

Abstract
We have used potentiometric titrations to measure the pK values of the ionizable groups of proteins in alanine pentapeptides with appropriately blocked termini. These pentapeptides provide an improved model for the pK values of the ionizable groups in proteins. Our pK values determined in 0.1 M KCl at 25°C are: 3.67±0.03 (α-carboxyl), 3.67±0.04 (Asp), 4.25±0.05 (Glu), 6.54±0.04 (His), 8.00±0.03 (α-amino), 8.55±0.03 (Cys), 9.84±0.11 (Tyr), and 10.40±0.08 (Lys). The pK values of some groups differ from the Nozaki and Tanford (N&T) pK values often used in the literature: Asp (3.67 this work vs. 4.0 N&T); His (6.54 this work vs. 6.3 N&T); α-amino (8.00 this work vs. 7.5 N&T); Cys (8.55 this work vs. 9.5 N&T); and Tyr (9.84 this work vs. 9.6 N&T). Our pK values will be useful to those who study pK perturbations in folded and unfolded proteins, and to those who use theory to gain a better understanding of the factors that determine the pK values of the ionizable groups of proteins.
Keywords: pK values, protein ionizable groups, pH titration, peptide model compounds
The acid/base properties of proteins have been studied since 1917, when Sorensen, who first defined pH in 1909, showed that egg albumin is an ampholyte (Sorensen et al. 1917). Soon thereafter, Linderstrom-Lang recognized that the net charge on a protein would influence the ionization of individual groups, and incorporated this into the first model developed to understand the acid/base properties of a protein (Linderstrom-Lang 1924). An important contribution by Tanford and Kirkwood triggered an intense interest in the factors that determine the pK values of the ionizable groups of proteins that continues to the present day (Tanford and Kirkwood 1957; Braun-Sand and Warshel 2005). The net charge on a protein varies with pH, and is determined by the content and the pK values of the ionizable groups (Tanford 1962). Thus, the pK values of the ionizable groups are important to biochemists because they influence the structure, stability, solubility, and the many functions of proteins (Tanford 1968; Pace 1975; Fersht 1985; Matthew et al. 1985; Anderson et al. 1990; Ries-Kautt and Ducruix 1997; Shaw et al. 2001; Bartlett et al. 2002).
In early studies aimed at interpreting titration curves of proteins, Tanford (1962) introduced the term intrinsic pK (pKint). He defined the term as the pK an ionizable group would have when the net charge on the molecule is zero. When proteins fold, the perturbations of the pKs of the ionizable groups on the surface of the protein from the pKint values are usually small, and are determined mainly by charge–charge interactions with other ionizable groups (Laurents et al. 2003). However, if these groups are partially or fully buried in the protein interior, large positive and negative perturbations often occur, and it is important that we understand why (Schutz and Warshel 2001). Experimental studies of these perturbations have been reported by several groups (see, for example, Garcia-Moreno et al. 1997; Giletto and Pace 1999; Dwyer et al. 2000; Edgcomb and Murphy 2002; Forsyth et al. 2002; Harris and Turner 2002; Laurents et al. 2003; Horng et al. 2005; Pujato et al. 2005; Trevino et al. 2005), and theoretical studies have shown that the perturbations result primarily from the Born effect, charge–charge interactions, and hydrogen bonding (see, for example, Schutz and Warshel 2001; Fitch et al. 2002; Georgescu et al. 2002; Braun-Sand and Warshel 2005).
Studies of pK perturbations in proteins require accurate, unperturbed pK values. Historically, these pK values were determined using small molecules or peptides as models, and direct techniques such as potentiometric titration or indirect techniques such as NMR to monitor ionization. In Table 1 we summarize the values commonly used in the literature. These measurements were made at various temperatures, and some were corrected for electrostatic interactions and/or ionic strength effects and some were not (see Table 1 of Tanford 1962 for a description of these corrections). Most researchers today use the pKint values from Nozaki and Tanford (N&T) (Nozaki and Tanford 1967), which are given in column 3 of Table 1. Our goal in this paper is to provide accurate pK measurements using a better model system than any of those used previously.
Table 1.
pK values for the ionizable groups in proteins from the literature

These pK values were measured at various temperatures, as noted below. Typically, the error in the measurements is ±0.1–0.2. In some studies no salt was present, and in some the ionic strength was not given. We have not corrected any of the values given in the original articles. Usually the errors in measuring the pK values are greater than these corrections (Tanford 1962).
aDetermined using various model compounds at 25°C, as described in Table 1 in Chapter 20 of Cohn and Edsall (1943).
bDetermined using various model compounds at 25°C, as described in Table 3 of Nozaki and Tanford (1967).
cDetermined with Gly-Gly-X-Gly-Gly pentapeptides by 13C NMR at 26°C, except for Tyr, which was determined at 33°C (see Gurd et al. 1972; Keim et al. 1973). Both termini of the peptides were not blocked.
dDetermined in Gly-Gly-X-Ala tetrapeptides by 13C NMR at 35°C (see Richarz and Wuthrich 1978). Both termini of the peptides were not blocked.
eFrom Creighton's textbook on protein biochemistry that references some of the values from the previous columns (Creighton 1993).
In this paper we report pK values for the ionizable groups of proteins measured by potentiometric titration using alanine based pentapeptides in 0.1 M KCl at 25°C. We believe these peptides provide the most reasonable model for determining the pK values for the ionizable groups in a protein. We compare our measurements to the N&T pKint values given in Table 1. These results will be useful to those interested in pK perturbations in proteins, and to those who use theory to understand the pK values of ionizable groups in proteins.
Results
The pK values of the groups of interest were determined in model pentapeptides by potentiometric titration in the presence of 0.1 M KCl at 25°C. Figure 1 shows typical results for peptides containing Glu and His in the host site. A nonlinear, least-squares fit of these data using Equation 1 gave a pK = 4.28±0.02 for the γ-carboxyl group of Glu and a pK = 6.57±0.02 for the imidazole group of His. These data, as well as the data for the other peptides, were also analyzed using Equation 2. In each case, the Hill coefficient n did not differ significantly from unity, indicating that only one noninteracting, ionizable group was present in each peptide. Our results are summarized in Table 2, where they are compared to the pKint values reported by Nozaki and Tanford (1967).
Figure 1.
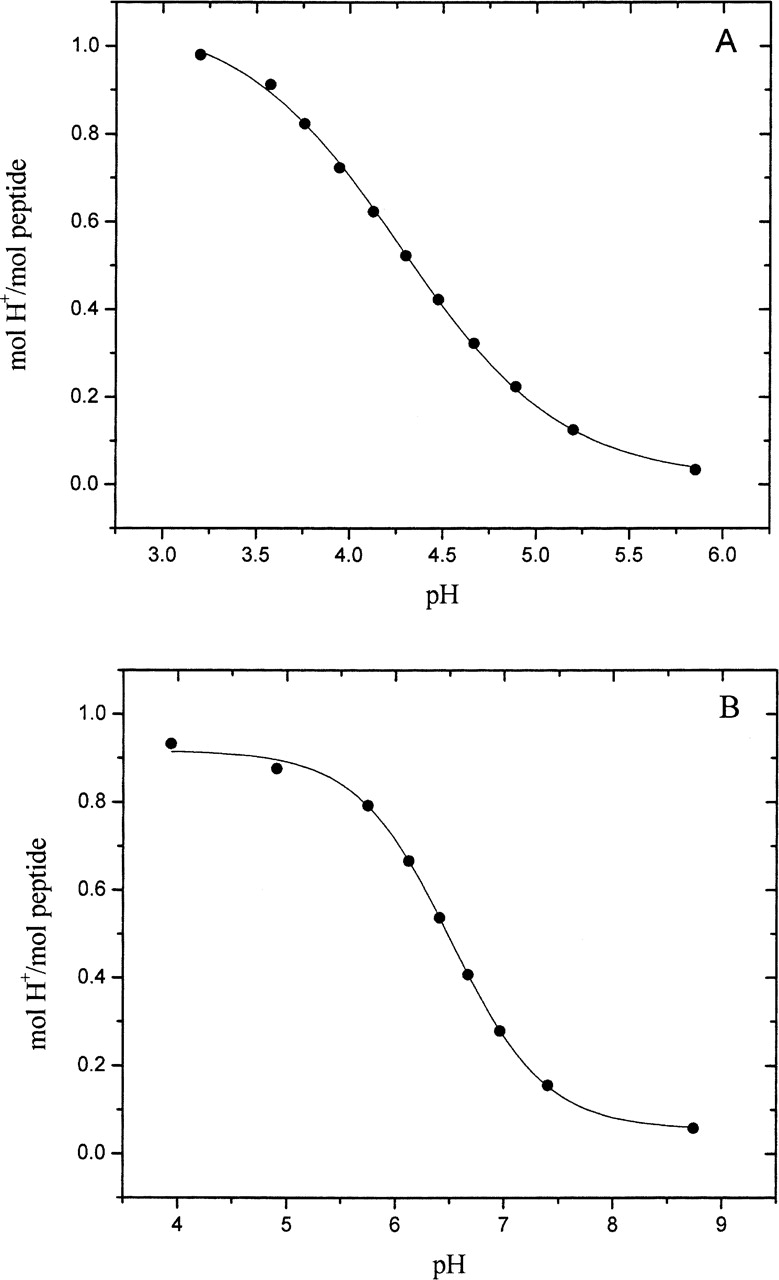
Potentiometric titration curves of the side chain Glu carboxyl group in Ac-AAEAA-NH2 (A), and of the side chain His imidazole group in Ac-AAHAA-NH2 (B). The peptides were dissolved in 0.1 M KCl and titrated with HCl at 25°C. The lines are the best fit of the data to Equation 2.
Table 2.
Measured pK values based on the alanine pentapeptides compared to the pKint values of Nozaki and Tanford

aFrom the model compound data in Table 3 of Nozaki and Tanford (1967).
bThe pK values of the ionizable groups in the alanine pentapeptides used in this work measured in 0.1 M NaCl at 25°C. The errors are the standard deviations from the average of three independent experiments for the α-carboxyl, Glu, α-amino, and Tyr; and two independent experiments for Asp, His, Cys, and Lys. For all of the titrations, the error in the pK value from fitting the experimental data to Equations 1 or 2 was <0.03.
Discussion
The peptides used in these experiments are good models to measure the unperturbed pK values for the ionizable groups in proteins. The choice of a pentapeptide reduces purification problems commonly encountered with smaller peptides and minimizes the possibility of secondary structure formation and hydrogen bonding interactions that can occur in larger peptides (Padmanabhan et al. 1990). The residue of interest was placed in the middle of the pentapeptides, with both termini blocked in order to eliminate the possibility of pK perturbations through electrostatic interactions with a charged group. The alanine pentapeptides should give a local environment for the ionizable group similar to that expected in an unfolded, uncharged protein. The ionizable group will be influenced by the chemical structure and partial charges (dipoles), but not by charge–charge interactions, or to a great extent by burial.
As discussed in the introduction to this paper, there is great interest in reaching a better understanding of the factors that contribute to the very high (Fitch et al. 2002; Trevino et al. 2005) and very low (Anderson et al. 1990; Giletto and Pace 1999) pK values observed for buried residues in folded proteins (Schutz and Warshel 2001). There is also increasing interest in interactions involving ionizable residues in the unfolded states of proteins (Elcock 1999; Giletto and Pace 1999; Pace et al. 2000; Wong et al. 2000) because such interactions can influence the kinetics and mechanism of protein folding (Horng et al. 2005; Tollinger et al. 2005; Trefethen et al. 2005). Our results will provide a good benchmark for interpreting these studies.
We compare the pK values from this work to the commonly cited pKint values of N&T in Table 2. Our results agree with the N&T values within experimental error for the α-carboxyl, Glu, and Lys ionizable groups. We observe a somewhat lower pK value for the Asp carboxyl, and somewhat higher pK values for the His imidazole and the Tyr –OH groups. These differences are only slightly larger than the experimental error, and probably just reflect the differences among the model compounds used for the measurements. However, the values for the Cys–SH group and the α-amino group reported here differ significantly from the N&T values.
Our pK value of 8.55 for the Cys–SH group is 0.95 pH units lower than the N&T value of 9.5, which was based on the pK of OH-CH2-CH2-SH. However, the pK values used for cysteine thiol ionization in the literature range from 8.3 to 8.7 (Nelson and Creighton 1994; Takahashi and Creighton 1996; Dyson et al. 1997; Moutevelis and Warwicker 2004; Naor and Jensen 2004; Hansen et al. 2005). In a thorough study of cysteine ionization and reactivity from the Goldenberg lab, the pK values of a single Cys were measured in 16 model peptides with both termini blocked. The pKs ranged from 7.4 to 9.1 (Bulaj et al. 1998). Thus, these data also indicate that the N&T value is too high, and suggest that that our pK value of 8.55 is a more reasonable value to use as a model for the Cys residues in proteins.
Our pK value of 8.00 for the α-amino group is 0.50 pH units higher than the N&T value of 7.5, which is the average of eight model compound values given in Table 1 of (Tanford 1962). Three of these model compounds have pK values of 6.8, 7.0, and 7.2 for the α-amino group. These are significantly lower than the pK values of the other five compounds, which are all better models for an α-amino group. For these five compounds, the pK values range from 7.6 to 7.9, and the average pK = 7.8. This suggests that the N&T value used is probably too low, and that our value of 8.00 is a more reasonable value to use.
There is considerable interest in using theory to predict the pK values of the ionizable groups in proteins (Russell and Warshel 1985; Yang et al. 1993; Antosiewicz et al. 1996; Sham et al. 1997; Schutz and Warshel 2001; Fitch et al. 2002; Georgescu et al. 2002; Warwicker 2004). The theoretical models used generally require unperturbed pK values for the ionizable groups in proteins and the (Nozaki and Tanford 1967) intrinsic pK values have been used most often. (For a discussion of this subject, see Russell and Warshel 1985) The pK values reported in this paper were determined using a model system that is more reasonable than those used in previous studies. In addition, identical conditions were used for all of our pK measurements. Hopefully, it will speed progress in developing theoretical models to understand the factors that determine pK values in proteins if the pK values reported here are used in future studies.
Materials and methods
Peptides with the structure Ac-A-A-X-A-A-NH2 were synthesized by manual, solid-phase Fmoc chemistry methods using standard coupling and cleavage procedures. The N and C termini of the peptides were blocked with acetyl and amide groups, respectively, except in those cases where the unblocked peptides were constructed to measure the pKs of the N-terminal and C-terminal groups. The peptides were purified using reversed-phase liquid chromatography and their identity confirmed by MALDI-TOF mass spectrometry.
The pK of the group of interest was determined by potentiometric titration as previously described (Nozaki and Tanford 1967; Huang and Bolen 1995), with minor modifications. The conditions were 0.1 M KCl at 25°C. The titrations were performed with constant stirring in a sealed, jacketed titration vessel from Metrohm (Brinkman Instruments), maintained under a CO2 free N2 atmosphere. The instrumentation included a Hamilton MicroLab 500 syringe pump (Hamilton, Co.), a Corning Model 450 pH meter (Corning Inc.), and a Beckman Futura pH electrode (Beckman Instruments). A computer program was developed in-house to control the titration system. Two or three independent titrations of the solvent blank and peptide solution were performed.
The mol of H+ bound per mol peptide was plotted versus pH, and a nonlinear, least-squares method was used to fit the data with this form of the Henderson-Hasselbalch equation:
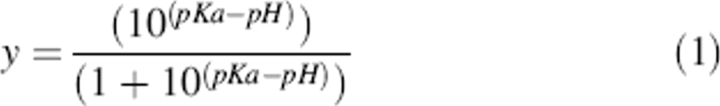 |
The same data were similarly analyzed using the following equation so that the Hill coefficient for proton binding or release could be determined (Markley 1975):
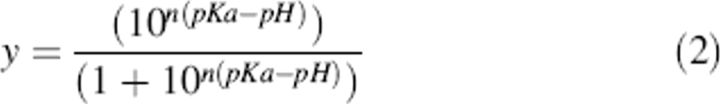 |
Acknowledgments
This work was supported by NIH Grants GM 37039 and GM 52483, Welch Foundation Grants BE-1060 and BE-1281, and the Tom and Jean McMullin Professorship. We thank Drs. Joe Morgan and Jay Porter in the Department of Engineering Technology at Texas A&M University for developing the software used to control our titration system; Larry Dangott of the Protein Chemistry Laboratory at Texas A&M University for performing the MALDI-TOF mass spectrometry; and Doug Laurents for suggestions that improved the manuscript.
Footnotes
Reprint requests to: C. Nick Pace, Department of Molecular and Cellular Medicine, Texas A&M University, System Health Science Center, College Station, TX 77843, USA; e-mail nickpace@tamu.edu; fax: (979) 847-9481.
Article published online ahead of print. Article and publication date are at http://www.proteinscience.org/cgi/doi/10.1110/ps.051840806.
References
- Anderson D.E., Becktel W.J., Dahlquist F.W. 1990. pH-induced denaturation of proteins: A single salt bridge contributes 3–5 kcal/mol to the free energy of folding of T4 lysozyme Biochemistry 29 2403–2408. [DOI] [PubMed] [Google Scholar]
- Antosiewicz J., McCammon J.A., Gilson M.K. 1996. The determinants of pKas in proteins Biochemistry 35 7819–7833. [DOI] [PubMed] [Google Scholar]
- Bartlett G.J., Porter C.T., Borkakoti N., Thornton J.M. 2002. Analysis of catalytic residues in enzyme active sites J. Mol. Biol. 324 105–121. [DOI] [PubMed] [Google Scholar]
- Braun-Sand S. and Warshel A. 2005. Electrostatics of proteins: Principles, models, and applications In Protein folding handbook, part I. (eds. Buchner J. and Kiefhaber T.) . . Wiley-VCH Verlag GmbH & Co, KGaA, Weinheim.
- Bulaj G., Kortemme T., Goldenberg D.P. 1998. Ionization–reactivity relationships for cysteine thiols in polypeptides Biochemistry 37 8965–8972. [DOI] [PubMed] [Google Scholar]
- Cohn E.J. and Edsall J.T. In Proteins, amino acids and peptides . 1943. Hafner Publishing Company, New York.
- Creighton T.E. In Proteins: Structures and molecular properties pp. 507. 1993. 2nd ed. W.H. Freeman, New York.
- Dwyer J.J., Gittis A.G., Karp D.A., Lattman E.E., Spencer D.S., Stites W.E., Garcia-Moreno E.B. 2000. High apparent dielectric constants in the interior of a protein reflect water penetration Biophys. J. 79 1610–1620. [DOI] [PMC free article] [PubMed] [Google Scholar]
- Dyson H.J., Jeng M.F., Tennant L.L., Slaby I., Lindell M., Cui D.S., Kuprin S., Holmgren A. 1997. Effects of buried charged groups on cysteine thiol ionization and reactivity in Escherichia coli thioredoxin: Structural and functional characterization of mutants of Asp 26 and Lys 57 Biochemistry 36 2622–2636. [DOI] [PubMed] [Google Scholar]
- Edgcomb S.P. and Murphy K.P. 2002. Variability in the pKa of histidine side-chains correlates with burial within proteins Proteins 49 1–6. [DOI] [PubMed] [Google Scholar]
- Elcock A.H. 1999. Realistic modeling of the denatured states of proteins allows accurate calculations of the pH dependence of protein stability J. Mol. Biol. 294 1051–1062. [DOI] [PubMed] [Google Scholar]
- Fersht A. In Enzyme structure and mechanism pp. 475. 1985. 2nd ed. W.H. Freeman, New York.
- Fitch C.A., Karp D.A., Lee K.K., Stites W.E., Lattman E.E., Garcia-Moreno E.B. 2002. Experimental pK(a) values of buried residues: Analysis with continuum methods and role of water penetration Biophys. J. 82 3289–3304. [DOI] [PMC free article] [PubMed] [Google Scholar]
- Forsyth W.R., Antosiewicz J.M., Robertson A.D. 2002. Empirical relationships between protein structure and carboxyl pKa values in proteins Proteins 48 388–403. [DOI] [PubMed] [Google Scholar]
- Garcia-Moreno B., Dwyer J.J., Gittis A.G., Lattman E.E., Spencer D.S., Stites W.E. 1997. Experimental measurement of the effective dielectric in the hydrophobic core of a protein Biophys. Chem. 64 211–224. [DOI] [PubMed] [Google Scholar]
- Georgescu R., Alexov E., Gunner M. 2002. Combining conformational flexibility and continuum electrostatics for calculating pKas in proteins Biophys. J. 83 1731–1748. [DOI] [PMC free article] [PubMed] [Google Scholar]
- Giletto A. and Pace C.N. 1999. Buried, charged, non-ion-paired aspartic acid 76 contributes favorably to the conformational stability of ribonuclease T1 Biochemistry 38 13379–13384. [DOI] [PubMed] [Google Scholar]
- Gurd F.R.N., Keim P., Glushko V.G., Lawson P.J., Marshall R.C., Nigen A.M., Vigna R.A. 1972. Carbon-13 nuclear magnetic resonance of some pentapeptides In Chemistry and biology of peptides (ed. Meienhofer J.) . pp. 45–49. Ann Arbor Science Publishers, Ann Arbor, MI.
- Hansen R.E., Ostergaard H., Winther J.R. 2005. Increasing the reactivity of an artificial dithiol-disulfide pair through modification of the electrostatic milieu Biochemistry 44 5899–5906. [DOI] [PubMed] [Google Scholar]
- Harris T.K. and Turner G.J. 2002. Structural basis of perturbed pKa values of catalytic groups in enzyme active sites IUBMB Life 53 85–98. [DOI] [PubMed] [Google Scholar]
- Horng J.-C., Cho J.-H., Raleigh D.P. 2005. Analysis of the pH-dependent folding and stability of histidine point mutants allows characterization of the denatured state and transition state for protein folding J. Mol. Biol. 345 163–173. [DOI] [PubMed] [Google Scholar]
- Huang Y. and Bolen D.W. 1995. Probes of energy transduction in enzyme catalysis Methods Enzymol. 259 19–43. [DOI] [PubMed] [Google Scholar]
- Keim P., Vigna R.A., Morrow J.S., Marshall R.C., Gurd F.R.N. 1973. Carbon 13 nuclear magnetic resonance of pentapeptides of glycine containing central residues of serine, threonine, aspartic and glutamic acids, asparagine, and glutamine J. Biol. Chem. 248 7811–7818. [PubMed] [Google Scholar]
- Laurents D.V., Huyghues-Despointes B.M., Bruix M., Thurlkill R.L., Schell D., Newsom S., Grimsley G.R., Shaw K.L., Trevino S., Rico M.et al. 2003. Charge–charge interactions are key determinants of the pK values of ionizable groups in ribonuclease Sa (pI=3.5) and a basic variant (pI=10.2) J. Mol. Biol. 325 1077–1092. [DOI] [PubMed] [Google Scholar]
- Linderstrom-Lang K.U. 1924. On the ionisation of proteins C.R. Trav. Lab. Carlsberg 15 1–29. [Google Scholar]
- Markley J.L. 1975. Observation of histidine residues in proteins by means of nuclear magnetic resonance spectroscopy Acc. Chem. Res. 8 70–80. [Google Scholar]
- .Matthew J.B., Gurd F.R., Garcia-Moreno B., Flanagan M.A., March K.L., Shire S.J. 1985. pH-dependent processes in proteins. CRC Crit. Rev Biochem. 18 91–197. [DOI] [PubMed] [Google Scholar]
- Moutevelis E. and Warwicker J. 2004. Prediction of pKa and redox properties in the thioredoxin superfamily Protein Sci. 13 2744–2752. [DOI] [PMC free article] [PubMed] [Google Scholar]
- Naor M.M. and Jensen J.H. 2004. Determinants of cysteine pKa values in creatine kinase and α1-antitrypsin Proteins 57 799–803. [DOI] [PubMed] [Google Scholar]
- Nelson J.W. and Creighton T.E. 1994. Reactivity and ionization of the active site cysteine residues of DsbA, a protein required for disulfide bond formation in vivo Biochemistry 33 5974–5983. [DOI] [PubMed] [Google Scholar]
- Nozaki Y. and Tanford C. 1967. Examination of titration behavior Methods Enzymol. 11 715–734. [Google Scholar]
- Pace C.N. 1975. The stability of globular proteins CRC Crit. Rev. Biochem. 3 1–43. [DOI] [PubMed] [Google Scholar]
- Pace C.N., Alston R.W., Shaw K.L. 2000. Charge–charge interactions influence the denatured state ensemble and contribute to protein stability Protein Sci. 9 1395–1398. [DOI] [PMC free article] [PubMed] [Google Scholar]
- Padmanabhan S., Marqusee S., Ridgeway T., Laue T.M., Baldwin R.L. 1990. Relative helix-forming tendencies of nonpolar amino acids Nature 344 268–270. [DOI] [PubMed] [Google Scholar]
- Pujato M., Braken C., Mancusso R., Cataldi M., Tasayco M. 2005. pH dependence of amide chemical shifts in natively disordered polypeptides detects medium-range interactions with ionizable residues Biophys. J. 89 3293–3302. [DOI] [PMC free article] [PubMed] [Google Scholar]
- Richarz R. and Wuthrich K. 1978. Carbon-13 NMR chemical shifts of the common amino acid residues measured in aqueous solutions of the linear tetrapeptides H-Gly-Gly-X-L-Ala-OH Biopolymers 17 2133–2141. [Google Scholar]
- Ries-Kautt M. and Ducruix A. 1997. Inferences drawn from physicochemical studies of crystallogenesis and precrystalline state Methods Enzymol. 276 23–59. [DOI] [PubMed] [Google Scholar]
- Russell S. and Warshel A. 1985. Calculations of electrostatic energies in proteins: The energetics of ionized groups in bovine pancreatic trypsin inhibitor J. Mol. Biol. 185 389–404. [DOI] [PubMed] [Google Scholar]
- Schutz C.N. and Warshel A. 2001. What are the dielectric “constants” of proteins and how to validate electrostatic models? Proteins 44 400–417. [DOI] [PubMed] [Google Scholar]
- Sham Y., Chu Z., Warshel A. 1997. Consistent calculations of pKa's of ionizable residues in proteins: Semi-microscopic and microscopic approaches J. Phys. Chem. B 101 4458–4472. [Google Scholar]
- Shaw K.L., Grimsley G.R., Yakovlev G.I., Makarov A.A., Pace C.N. 2001. The effect of net charge on the solubility, activity, and stability of ribonuclease Sa Protein Sci. 10 1206–1215. [DOI] [PMC free article] [PubMed] [Google Scholar]
- Sorensen S.P.L., Hoyrup M., Hempel J., Palitzsch S. 1917. Studies on proteins. II. The capacity of egg-albumin to combine with acids or bases C.R. Trav. Lab. Carlsberg 12 68–163. [Google Scholar]
- Takahashi N. and Creighton T.E. 1996. On the reactivity and ionization of the active site cysteine residues of Escherichia coli thioredoxin Biochemistry 35 8342–8353. [DOI] [PubMed] [Google Scholar]
- Tanford C. 1962. The interpretation of hydrogen ion titration curves of proteins Adv. Protein Chem. 17 69–165. [Google Scholar]
- Tanford C. 1968. Protein denaturation Adv. Protein Chem. 23 121–282. [DOI] [PubMed] [Google Scholar]
- Tanford C. and Kirkwood J.G. 1957. Theory of protein titration curves. I. General equations for impenetrable spheres J. Am. Chem. Soc. 79 5333–5339. [Google Scholar]
- Tollinger M., Kay L., Forman-Kay J.D. 2005. Measuring pKa values in protein folding transition state ensembles by NMR spectroscopy J. Am. Chem. Soc. 127 8904–8905. [DOI] [PubMed] [Google Scholar]
- Trefethen J., Pace C.N., Scholtz J.M., Brems D. 2005. Charge–charge interactions in the denatured state influence the folding kinetics of ribonuclease Sa Protein Sci. 14 1934–1938. [DOI] [PMC free article] [PubMed] [Google Scholar]
- Trevino S.R., Gokulan K., Newsom S., Thurlkill R.L., Shaw K.L., Mitkevich V.A., Makarov A.A., Sacchettini J.C., Scholtz J.M., Pace C.N. 2005. Asp79 makes a large, unfavorable contribution to the stability of RNase Sa J. Mol. Biol. 354 967–978. [DOI] [PubMed] [Google Scholar]
- Warwicker J. 2004. Improved pKa calculations through flexibility based sampling of a water-dominated interaction scheme Protein Sci. 13 2793–2805. [DOI] [PMC free article] [PubMed] [Google Scholar]
- Wong K.B., Clarke J., Bond C.J., Neira J.L., Freund S.M., Fersht A.R., Daggett V. 2000. Towards a complete description of the structural and dynamic properties of the denatured state of barnase and the role of residual structure in folding J. Mol. Biol. 296 1257–1282. [DOI] [PubMed] [Google Scholar]
- Yang A.S., Gunner M.R., Sampogna R., Sharp K., Honig B. 1993. On the calculation of pKas in proteins Proteins 15 252–265. [DOI] [PubMed] [Google Scholar]