Abstract
The advantages of electrospray ionization mass spectrometry (ESIMS) to measure relative solution-phase affinities of tightly bound protein–protein complexes are demonstrated with selected variants of the Bacillus amyloliquefaciens protein barstar (b*) and the RNAase barnase (bn), which form protein–protein complexes with a range of picomolar to nanomolar dissociation constants. A novel chemical annealing procedure rapidly establishes equilibrium in solutions containing competing b* variants with limiting bn. The relative ion abundances of the complexes and those of the competing unbound monomers are shown to reflect the relative solution-phase concentrations of those respective species. No measurable dissociation of the complexes occurs either during ESI or mass detection, nor is there any evidence for nonspecific binding at protein concentrations <25 μM. Differences in ΔΔG of dissociation between variants were determined with precisions <0.1 kcal/mol. The ΔΔG values obtained deviate on average by 0.26 kcal/mol from those measured with a solution-phase enzyme assay. It is demonstrated that information about the protein conformation and covalent modifications can be obtained from differences in mass and charge state distributions. This method serves as a rapid and precise means to interrogate protein–protein-binding surfaces for complexes that have affinities in the picomolar to nanomolar range.
Keywords: mass spectrometry, protein–protein interaction, barnase, electrospray, biosensing
Protein–protein complexes are among the most important higher order molecular assemblies in biology. They play crucial roles in processes that include signal transduction, immune response, transcriptional regulation, and apoptosis. It is now common to seek strategies for clinical intervention that use small molecule inhibitors of specific protein–protein interactions. Current targets include amyloid plaque formation in Alzheimer's disease (Gestwicki et al. 2004), RGD motif-mediated protein recognition that facilitates the spread and growth of metastatic cells (Tsuchiya et al. 2002; Foty and Steinberg 2004), and pain relief through integrin blocking (Fu et al. 2004). Characterization of the interacting surfaces of proteins has thus become a major focus of biochemistry (DeLano 2002).
The design of appropriate drugs to modulate protein–protein interaction is particularly challenging because the interfaces, unlike enzyme active sites or receptor-binding loci, are typically large (600–1000 Å2), devoid of accessible pockets, and chemically diverse (Janin and Chothia 1990; DeLano et al. 2000). Dissociation constants vary from weak (greater than millimolar) to extremely strong (less than picomolar).
Precise measurement of the dissociation constants (KD) of protein–protein complexes can present a formidable experimental challenge, and there is no generally applicable facile method for their determination in homogenous solution. Calorimetric methods are general and have been quite useful in the study of protein interactions (Weber and Salemme 2003), but calorimetry is slow in execution and requires relatively large amounts of protein (∼0.5 mg) at high concentrations (micromolar) (Weber and Salemme 2003) and can present difficulty in interpretation (Cooper et al. 2001). Other general solution techniques rely on modification of the purified protein with a chemical tag, e.g., fluorophores for FRET studies (Cheung and Hearn 2003) or modification of the genetic makeup of the protein to attach a reporter activity (as in the “yeast two-hybrid” screen [Causier and Davies 2002] or the creation of association-mediated splice sites [Ozawa and Umezawa 2001]). Biosensing platforms based on, for example, surface plasmon resonance, are in principle generally applicable, but the experiments must be carried out under heterogenous conditions (with one partner immobilized), and the results may be compromised by surface effects, artefacts from the immobilization, and nonspecific binding. The analysis of results from these systems can be particularly sensitive to impurities (Homola 2003).
An ideal method would provide a simultaneous readout of the concentrations of both free and complexed molecules in solution. The method must be sensitive, accurate, and able to measure multiple analytes simultaneously for high-throughput analyses and for internal mass balance checks. We describe here a laddered mass spectrometry method that has these advantages, and apply it to the determination of dissociation energies for a series of protein–protein complexes with KD values ranging from picomolar to nanomolar.
Mass spectrometry is a promising general method for characterizing protein–protein interactions. With electrospray ionization (ESI) (Wong et al. 1988), macromolecules and their complexes can be rapidly and gently transferred from solution into the mass spectrometer for analysis. ESI–MS has been used to obtain the stoichiometry of macromolecular complexes. Studies of macromolecular complexes by ESI–MS have been extensively reviewed (Loo 1997; Veenstra 1999; Miranker 2000; Heck and van den Heuvel 2004). Many groups have exploited ESI–MS as a probe of solution macromolecular interactions, and the observation of a macromolecular complex in the gas phase can indicate a solution interaction. A number of different techniques are available to measure protein-drug KD values with mass spectrometry (Jørgensen et al. 1998; Kempen and Brodbelt 2002; Powell et al. 2002; Daniel et al. 2003; Trester-Zadlitz et al. 2003) and have been demonstrated for relatively low-affinity complexes (millimolar and higher), typical of lead compounds for drug discovery. It is particularly advantageous to develop complementary methods for measuring the very strong (nanomolar–picomolar) interactions often found in biological systems.
In this study, the interaction between the 12,383 Da-secreted bacterial ribonuclease, barnase (bn), and its 10,343-Da noncovalently bound inhibitor, barstar (b*), is investigated. The complex of the two proteins is arguably the best-studied protein–protein interaction. Extensive mutagenic studies of the interaction have been carried out (Hartley 1993, 2001; Schrieber and Fersht 1993, 1995; Frisch et al. 1997) by observing intrinsic fluorescence changes that accompany complex formation and by monitoring the inhibition by barstar of barnase activity. An advantage of this system is that the structure of the complex is largely unperturbed by small mutations at its interface (Buckle et al. 1994; Vaughn et al. 1999). The method described here has the distinct advantage of utilizing identical proteins and conditions for both the enzymatic and mass spectrometric probes of protein–protein interaction. Technical considerations dictated that substantially different analogs be used in earlier work (Wang et al. 2003).
The results presented here show that relative KD values for protein–protein association in the nanomolar to picomolar range are readily determined by ESI–MS. The technique has a number of appealing features, including its speed, simplicity, accuracy, potential for multiplexing, and insensitivity to the presence of contaminants.
Results and Discussion
Evaluation of bn–b* dissociation constants (KD)
Native wild-type b* has cysteine residues at positions 40 and 82 that contribute to the stability of the bn–b* complex (Mitkevich et al. 2003). They readily form adventitious inter- or intramolecular disulfide-bonded species that do not inhibit barnase (Hartley 1993; Buckle et al. 1994). This problem is circumvented by the use of a pseudo-wild-type (Ψwt) barstar, in which both cysteines are replaced by alanines. High resolution X-ray structures of barnase–barstar complexes have only been reported for this cysteineless barstar and its mutants (Buckle et al. 1994). The double alanine substitution results in an ∼10-fold increase in KD (Hartley 1993; Mitkevich et al. 2003). This Ψwt is also particularly advantageous for ESI–MS studies (see below).
Equilibrium constants associated with bn–b* complex formation were reported for all of the b* mutants used in this study in the wild-type (cysteinated) background, in a Tris buffer (Schrieber and Fersht 1995). The KD values are pH and ionic strength dependent (Schrieber and Fersht 1993). The cysteine sulfhydryl groups participate in bn recognition and significantly affect the ΔΔGdissoc (Mitkevich et al. 2003). Affinities determined by ESI–MS are therefore best validated by comparison against values determined by established methods under identical solution conditions, using the same cysteine-to-alanine mutants used for ESI–MS. A fluorimetric substrate hydrolysis assay (Hartley 2001) was used to evaluate the KD values.
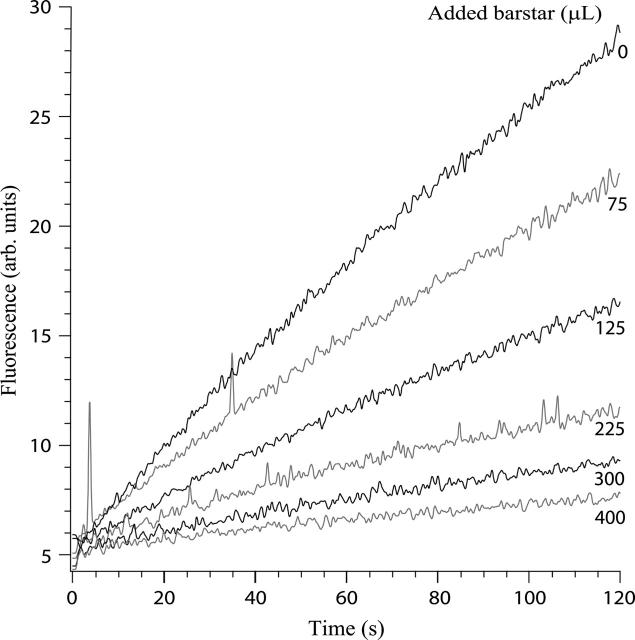
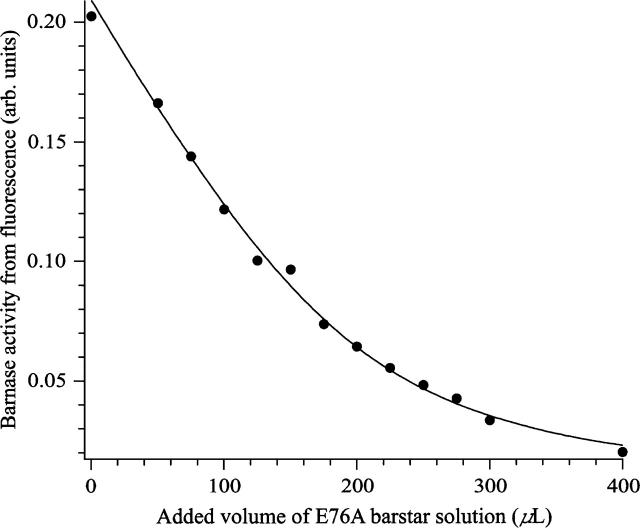
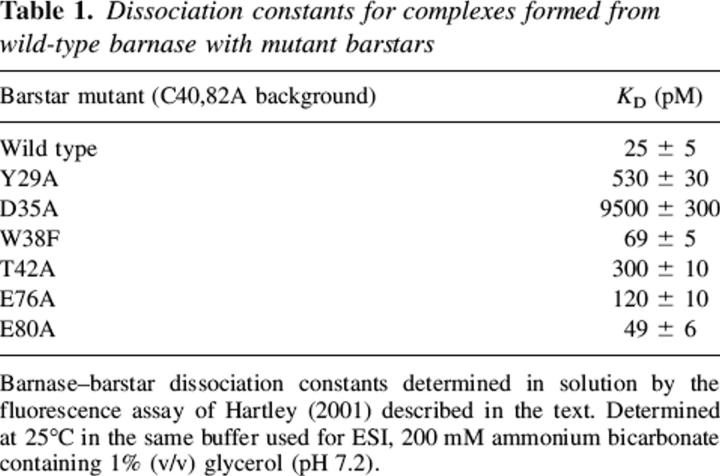
A typical titration of free bn by b* is shown in Figure 1. A plot of substrate hydrolysis rate versus added volume of b* is fit to a binding isotherm (Fig. 2). Least-squares analysis yields both the KD value and the titer of the added b* solution. The KD values for all bn–b* mutant complexes are given in Table 1. They follow the same ordering observed in studies of the cysteinated species (Schrieber and Fersht 1995), but are approximately two orders of magnitude higher, as might be expected from the loss of the sulfhydryls and the slightly lower pH used in these experiments.
Figure 1.
Sample fluorescence assays for barnase activity (Hartley 2001). A total of 2 nM barnase and 10 μM substrate were mixed in a 3-mL cuvette and the emission at 480 nm recorded as a function of time. The rates of substrate hydrolysis decrease with increasing b*. A fixed volume of b* at unknown concentration was added, and the assay volume was made up to 3 mL with buffer. Assay conditions: 200 mM ammonium bicarbonate, 1% (v/v) glycerol (pH 7.2), at 25°C. Traces shown are a subset of the experiments shown in Figure 2.
Figure 2.
Data of Figure 1 plotted as the barnase catalytic rate vs. added b*. The data were fitted to a rectangular hyperbola with b* titer and the KD value for the bn–b* complex as the fitted parameters.
Table 1.
Dissociation constants for complexes formed from wild-type barnase with mutant barstars
Urea-assisted annealing
The establishment of true equilibrium distributions of competitive protein complexes that are characterized by tight dissociation constants can be complicated by their long dissociation half-lives. Association rate constants for macromolecules in solution are limited by diffusion to values ≤108 M−1 sec−1 (Zhou 1993); consequently, mixtures of proteins characterized by subnanomolar dissociation constants may take minutes or longer to reach equilibrium. For example, the dissociation rate constant for the wt bn–b* complex is 3.7 × 10⁻⁶ sec−1 (Schrieber and Fersht 1995), corresponding to a half-life of about 2 d. Thus, some mixtures of barnase and barstar mutants may potentially take hours or days to reach equilibrium.
In order to reduce the time necessary to attain equilibrium in these experiments, bn–b* solutions were mixed in microdialysis cartridges in buffer containing 2.5 M urea. Urea destabilizes the complexes and thus reduces the time required to reach equilibrium. After 10–12 h, the initial urea concentration was reduced by 0.5 M every 4 h. Two additional 2-h dialyses were performed in buffer alone to remove residual urea. This method is analogous to thermal annealing, but lessens the potential for irreversible denaturation and protein aggregation. The time required for this process could likely be reduced by adjusting the urea concentrations and the dialysis method. To our knowledge, chemical annealing has not previously been used with mass spectrometry in this manner, although urea has been used to destabilize complexes in some MS studies (Powell et al. 2002).
Urea has the potential to cyanylate proteins, but no such attachment was observed by MS in these experiments. Guanidinium chloride does not react covalently with proteins and could serve as an alternative annealing agent.
Complex stability and ion abundance
In order to determine solution-phase binding affinities by mass spectrometry, it is necessary that the relative concentrations of species in solution be calculable from the corresponding gas-phase ion abundances. The latter, measured by mass spectrometry, however, depend not only upon the concentrations of the species in solution, but also upon their ionization efficiencies, instrumental factors, and the other solution components (a “matrix” effect). For large proteins that differ by only one or two amino acid side chains, all of these effects should be nearly the same, provided that there are no gross structural differences. Such differences would likely be indicated by changes in the ESI charge state distribution (Chowdhury et al. 1990). Therefore, the relative gas-phase ion abundances of a series of mutants of the same monomer are expected to correlate with their relative solution concentrations.
The same considerations apply to protein–protein complexes that differ only by one or two buried mutations. ESI, however, may produce other artefacts in the distribution of molecular ions. Solution-phase complexes that bind weakly in the gas phase may dissociate during ESI and/or in the gas phase prior to detection (Robinson et al. 1996), with the result that the distribution of ions in the mass spectrum reflects both solution- and gas-phase properties (Loo et al. 1997;Wigger et al. 2002). If different complexes dissociate with the same rate constant, then the relative gas-phase monomer abundances would be perturbed, but the relative abundances of complex ions would still indicate their relative solution concentrations. Even that relationship will be lost if significant dissociation occurs and if the rates for different complexes differ. Consequently, it is necessary to know the extent of complex dissociation.
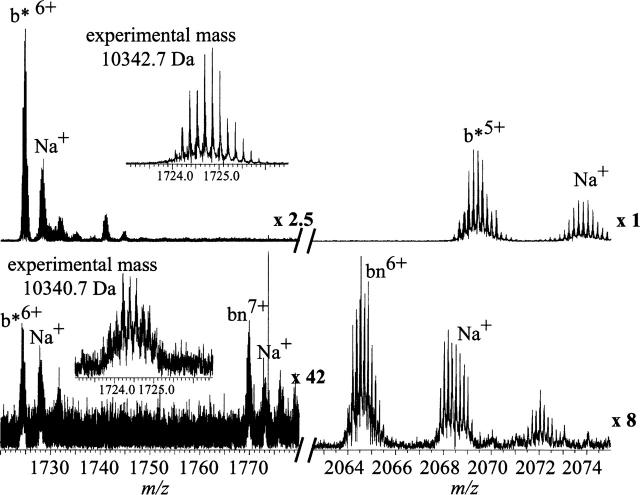
To quantitate this factor, solutions containing 10 μM bn and 15 μM b* were prepared in 200 mM aqueous ammonium bicarbonate, 1% (v/v) glycerol (pH 7.5). A partial ESI mass spectrum obtained from this solution is shown in Figure 3 (top). Signals for b* in the 6+ and 5+ charge state and for the bn–b* complex in the 9+ and 10+ charge state are observed (complex data not shown for these spectra). No signal for bn is detected. Under the experimental conditions, the free bn concentration is ∼2× KD, or 0.14 pM. Detection of the free-limiting component of a multiprotein complex whose constituents are all present at concentrations >>KD, requires concentration detection sensitivity on the order of KD.
Figure 3.
Partial ESI mass spectra of solutions of wild-type barnase and barstar. Barstar is added to bn at a 3:2 molar ratio (top) and at a 2:3 molar ratio (bottom) in 200 mM aqueous ammonium bicarbonate (pH 7.2), 1% glycerol. Insets expand the molecular ion regions of (b* + 6H) 6+ showing native reduced b* (top) and oxidized b* (bottom). Spectra have been expanded as indicated. Partial spectra only are shown for clarity. Barstar 6+ isotopic peaks were fitted with the MIDAS program from NHMFL.
The absence of any bn signal in Figure 3 (top) clearly shows that no measurable dissociation of the complex occurs either during electrospray ionization or subsequently in the gas phase prior to detection. Complexes and monomers do not equilibrate in the gas phase before detection, because Coulombic repulsion between multiply charged ions and very low pressures preclude dimer formation in the mass spectrometer. These results and considerations show that the relative abundances of complexes that are observed in the ESI mass spectrum reflect the relative concentrations of the complexes in solution. No aberrant complexes—homodimers or higher order oligomers—were observed, implying that the complexes observed in these experiments are generated only from pre-existing solution heterodimers.
The role of sulfhydryl oxidation
In a complementary experiment, 15 μM bn and 10 μM b* were mixed. The resulting partial ESI spectrum (Fig. 3, bottom) shows 6+ and 7+ bn monomer ions, but the 5+ and 6+ b* ions are not detected because here b*, not bn, is limiting. However, a 6+ molecular ion distribution is observed near the m/z of the 6+ b* ion. The average mass of this ion is 2 Da less than that of native b* and it is assigned to oxidized b* with the disulfide bond between Cys40 and Cys82. This species does not form a complex with bn (Hartley 1993;Buckle et al. 1994).
Interestingly, although b* under these conditions is formed primarily in the 5+ charge state, the 5+ charge state of the oxidized species is not observed. Because the sodiated bn 6+ signal would substantially overlap a b* 5+ signal, it is possible that the species is present below our ability to detect. Such a small quantity would be insignificant, however, for two reasons: First, complex dissociation is undetectable, as clearly shown in Figure 3 (top). Second, under these conditions, the detection sensitivity for b* is much greater than for bn (Fig. 3, cf. signals for top and bottom), and thus, significant amounts of free b* 5+ would be expected to be visible despite the sodiated bn 6+ peaks. The conformation of a macromolecule is of primary importance in determining its ESI charge state distribution (Chowdhury et al. 1990; Iavarone and Williams 2003); partially or completely unfolded conformers charge to a greater extent in the ESI process than do more folded, compact ones. Analysis of the complex structure suggests that formation of the disulfide bond would necessitate large changes in structure, including “disruption of the hydrophobic core packing” (Buckle et al. 1994) and hence, exposure of more of the protein to solvent, from which it could accept protons. This observation is consistent with the propensity of the oxidized species to accept more charge than does the reduced one. This propensity appears superficially to contradict other studies in which disulfide-oxidized species charge less than reduced species. The critical difference is that those studies used secreted proteins for which disulfides constrain the protein to its compact native structure, while the disulfide in b* is adventitious and disrupts the compact structure.
These results demonstrate a striking advantage that mass spectrometry brings to the analysis of specific biomolecular complexes. High accuracy and high-resolution mass measurements enable the identification of microheterogeneities in a sample that may modulate binding affinity. Mass spectrometry therefore offers a means to determine relative binding affinities in a mixture of covalently modified proteins. With this method, the relative binding affinity among covalently modified forms of the same polypeptide chain may be as easily measured as for that among mutants. Modifications, which would simply be a source of error in other assays, can be resolved, and their effects quantitated by mass spectrometry. Further, the charge state distribution may make possible identification of isobaric proteins that are folded differently.
Pseudo-wild type
In order to minimize the extent of disulfide bond formation and to simplify the data analysis, dithiothreitol and β-mercaptoethanol were independently added to the assay buffer at approximately five reducing equivalents per b*. Either reagent resulted in reduced and inconsistent heterodimer signal; therefore, the pseudo-wild-type (Ψwt)b* (see above) was used in the following experiments.
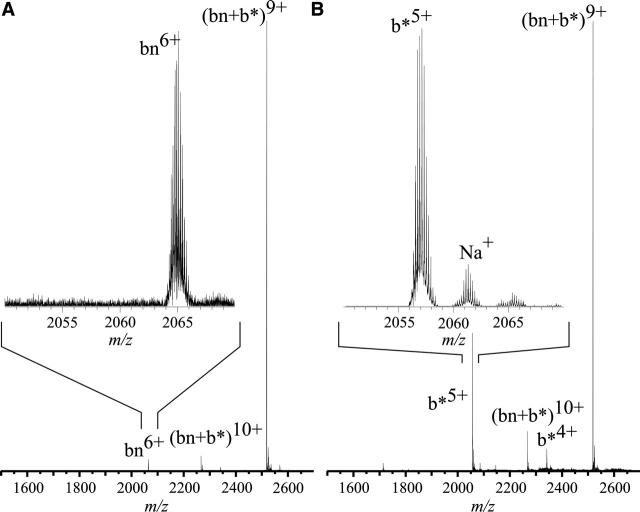
In separate experiments, solutions containing limiting bn and limiting wt b* were again examined to verify that the wild type neither dissociates from the bn–b* complex during electrospray nor leaves a residual population of nonbinding b*. An ESI mass spectrum was obtained from a 200 mM ammonium bicarbonate, 1% glycerol solution containing 20 μM Ψwt b* and 25 μM bn (Fig. 4, left). This spectrum shows the heterodimer, primarily in the 9+ charge state, but <10% of the protein is present as the 10+ ion. Monomeric bn 6+ and 7+ ions are also observed; the 7+ peak is about 1/10 the abundance of the 6+. Results from the complementary experiment, in which the concentrations of the two proteins are exchanged, are shown in Figure 4 (right). Signals for the complex (9+, 10+) and monomeric b* (4+, 5+, and 6+) ions are observed, but none for barnase is seen. Sodium adducts of b* are located near the m/z of the monomeric bn 6+ ion, but the adjacent isotope peaks are separated by 1/5 Da, and thus we attribute all observable signal to the sodiated 5+ b*. This conclusion is justified by the absence of b* signal under conditions of excess bn (Fig. 4, left); there is no observable dissociation of the intact complex. The greater than 200-to-1 signal to noise ratio of the 5+ b* peak for a solution concentration of 5 μM, and its absence at limiting b*, indicate that dissociation of the complexes is <0.5% during ESI and detection, and corresponds to a maximum possible error in b* concentration of 25 nM.
Figure 4.
ESI mass spectra of mixtures of pseudo-wild type b* and barnase: (A) 20 μM b* and 25 μM bn and (B) 25 μM b* and 20 μM bn. ESI solution is 200 mM aqueous ammonium bicarbonate, 1% (v/v) glycerol (pH 7.2). An identical region including the (bn + 6H) 6+ and (b* + 5H) 5+ molecular ions is inset in both spectra.
Ion signal for protein homodimers was observed only when generated from bn solutions more concentrated than 25 μM, or b* solutions more concentrated than 30 μM. Consequently, each species was used at solution concentrations less than 20 μM in all experiments to determine KD's.
Relative solution affinities from mass spectrometry
The dynamic range of a method determines the range of KD values that can be measured directly. Although very little material is required for mass analysis using mass spectrometry (attomole and subattomole detection is possible [Valaskovic et al. 1996; Belov et al. 2000]), the lower limit of concentrations typically used for mass spectrometry compares unfavorably with some other analytical methods, such as laser-induced fluorescence or some bioactivity assays, which can be used to detect species <10−13 M. For investigating protein complexes, it is highly desirable to form these ions from native solution conditions, which often include high concentrations of buffer ions that can make ion formation more challenging. Consequently, KD values that have been determined directly by mass spectrometry are generally 0.3 μM or larger, because tighter associations mandate that the limiting species be present in undetectable quantities (for example, see Zhang et al. 2003).
An interesting MS-based approach—chemical destabilization of the interaction paired with hydrogen/deuterium exchange (Powell et al. 2002)—can enable quantitation of stronger interactions, but this method requires many iterative experiments and the deuterium exchange results in a loss of resolution and, hence, ability to multiplex. Thus, that approach forfeits some of the great advantages of the mass spectrometer in cutting through complex solutions quickly and unambiguously.
Our method measures the effect of a particular mutation on the free energy of complex formation relative to those of different mutants, rather than measuring absolute affinity. The relative dissociation constants of mutant b*–bn complexes, formed from solutions in which two b* variants competed for limiting wild-type bn, were determined by mixing the components in approximately equal concentrations (10–15 μM) in the assay buffer, annealing with urea as discussed above, and measuring relative ion abundances of the complex ions and of the monomeric barstar ions using ESI–MS. The relative affinity, Krel, of bn for any two b* mutants is given by Equation 1, where Krel is expressed as the product of two ratios that are readily accessible by ESI–MS.
 |
Here, [b*1] and [b*2] represent the solution concentrations of two b* variants, and [b*1•bn] and [b*2•bn] those of their complexes with bn. The corresponding change in free energy of association is given by Equation 2.
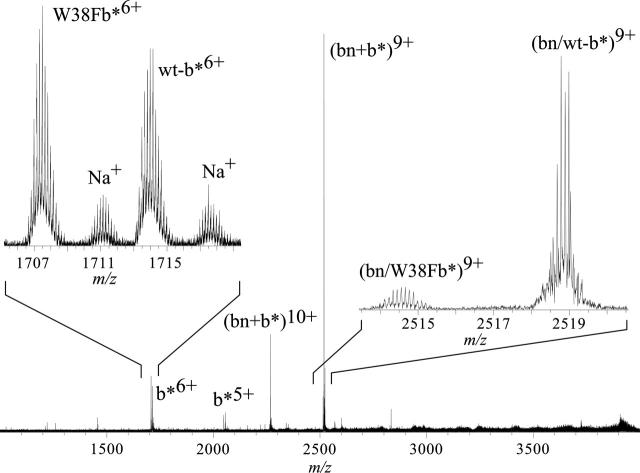
A typical ESI spectrum is shown in Figure 5, where two b* variants, the Ψwt and the W38F mutant, were mixed with bn. Heterodimers are formed predominantly in the 9+ charge state, with <10% observed in the 10+ state. A few spectra show 8+ heterodimers and no 10+ (data not shown). The monomeric b* species occurs predominantly at 5+ and 6+ charge states; the 4+ is occasionally present. The observed ratio between the 6+ b* variant ions was always within 5% of that of the 5+ ions. Only the abundances of the 5+ charge states were used in calculation, because they gave better signal-to-noise ratios. Similarly, only the 9+ complex peaks were used in the calculations, because the 10+ abundances closely reflected the 9+ abundances; incorporation of the 10+ data results in lower overall signal-to-noise. A previous study of carbohydrate binding to engineered antibodies (Wang et al. 2003) noted that all charge states had to be evaluated in order to calculate solution KD values accurately. The small charge state dependence seen in the results presented here is likely a result of the compactness and stability of b*, which exists overwhelmingly in one well-defined conformation (Sridevi and Udgaonkar 2002). The introduced mutations do not appear to perturb this conformation significantly. Sodium adducted to all species in these experiments. However, in any given spectrum, comparable species were observed to adduct to similar extents, and thus, only the base (unadducted) peaks were used in calculation for improved signal-to-noise. Whether to include multiple charge states and multiple adduct peaks will be a function of the particular system under investigation.
Figure 5.
A typical mass spectrum of a solution containing two b* variants, Ψwt and W38F, competing for limiting bn, with no signal averaging. The proteins were each initially 15 μM in 200 mM aqueous ammonium bicarbonate, 1% (v/v) glycerol (pH 7.2).
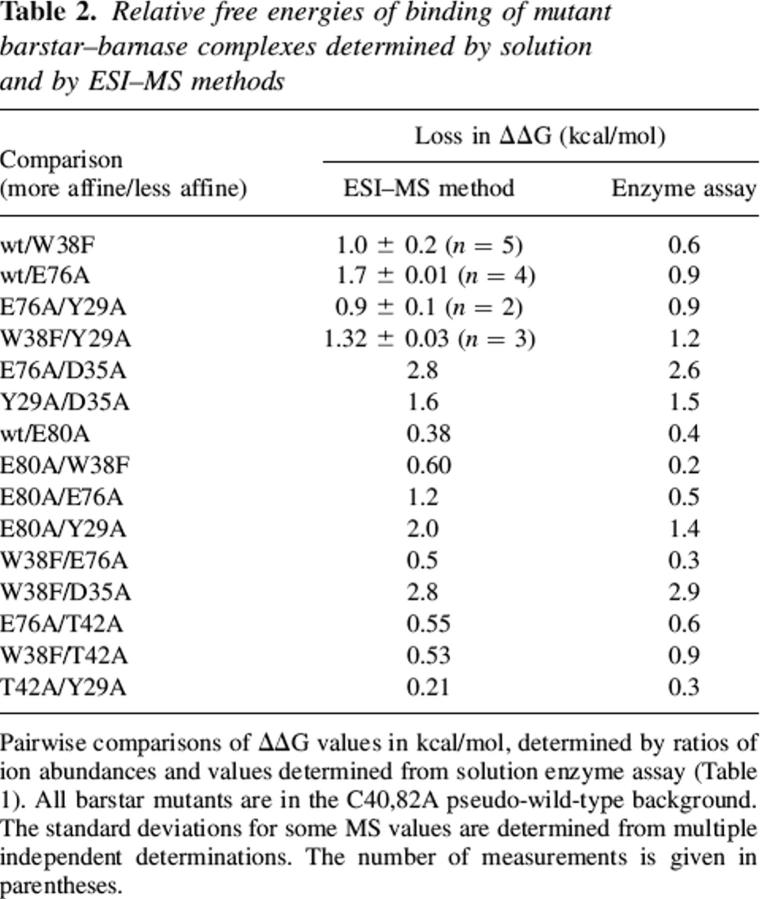
The results for these measurements are given in Table 2. Replicate determinations were made with four of the b* pairs on different days with separately prepared and annealed mixtures. The standard deviations ranged from 0.01 to 0.2 kcal/mol. The precision is improved by the simultaneous evaluation of both the monomer and complex concentration ratios; therefore, this approach is insensitive to errors associated with uncertainty in protein concentration at large dilutions.
Table 2.
Relative free energies of binding of mutant barstar–barnase complexes determined by solution and by ESI–MS methods
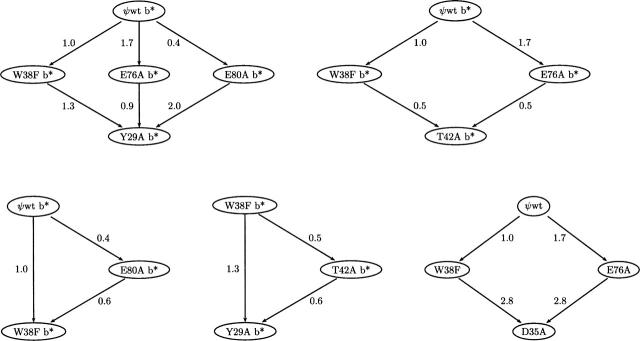
This ratioing approach was extended to evaluate a 3.5 kcal/mol range of ΔΔG values. Because these measurements are relative, affinities for a common partner of two species that were not directly compared experimentally can be computed by referencing each to one or more other intermediate species, thus constructing a “ladder” of values, as shown in Figure 6. This approach was introduced by Hammett (1940), who used dye indicators with overlapping pKa values to construct his HO scale. In general, multiple independent determinations exist; therefore, ΔΔG can be calculated along multiple paths, as shown by the arrows in Figure 6. Addition of the pairwise-measured changes in association free energy (shown adjacent to the arrows, in kcal/mol) gives the total ΔΔG from the top to the bottom of the path. Whereas replicate measurements provide a measure of the precision of the method (Table 2), internal discrepancies among multiple paths (Fig. 6) serve as a gauge of the overall accuracy of the method. In this case, they range from 0 (bottom, left) to 0.7 kcal/mol (bottom, right).
Figure 6.
The accessible range of bn–b* complex stability constants containing mutant b* is extended by comparison with species of intermediate affinity. For example (lower right), the W38F complex was compared directly with the D35A and wild-type complexes, but the ΔΔG separating the latter complexes is so large that direct comparison is difficult. Comparison with multiple intermediates (upper left) improves the precision of measurement as required by the path independence of free energy. The numerical values are in kcal/mol.
Comparison of KD values determined from activity and from ESI–MS measurements
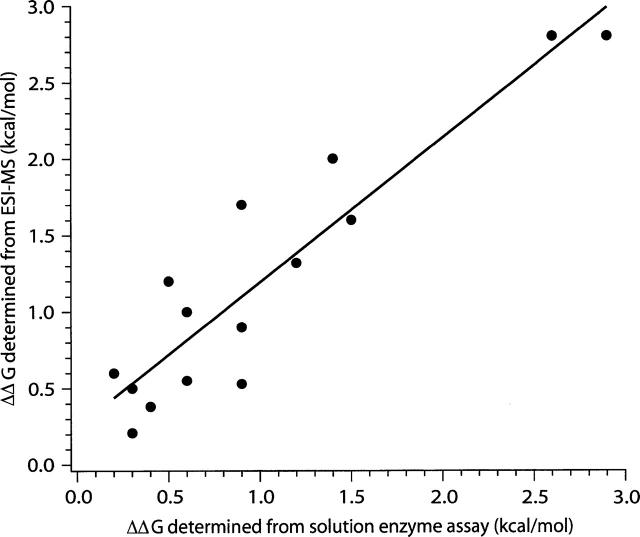
A plot of the ΔΔG values (Table 2) for each of the mutants measured by the two methods is shown in Figure 7. The linear least-squares fit to these data has a slope of 0.9 ± 0.1, indicating excellent agreement between these two methods. The y-intercept is 0.30 ± 0.14. Any given measurement deviates from the linear fit by ≤0.5 kcal/mol. By comparison, the absolute dissociation energies of the complexes are in the range of from 11 to 15 kcal/mol. The 0.5 kcal/mol discrepancy is quite small by enzymological standards because of the very low KD and the low concentrations required for determinations. For example, different enzymological methods used to measure wild-type bn–b* association yielded a 10-fold range in KD (Schrieber and Fersht 1995; Hartley 2001). The deviations between the two methods used in this study are most likely due to error in the very low protein concentrations in the solution assays. The ESI–MS approach is much less sensitive to such errors.
Figure 7.
A plot of the ΔΔG determined from ESI-MS vs. ΔΔG obtained from the barnase activity assay (the data are in Table 2). A least-squares linear fit (solid line) shows good correspondence between the data, with a slope of 0.9 ± 0.1 and a y-intercept of 0.30 ± 0.14, with R2 = 0.85.
Advantages of ESI–MS for the determination of solution KD values
Electrospray ionization mass spectrometry in combination with chemical annealing, where required, is a reliable, precise, accurate, and rapid method to characterize solution-phase macromolecular interactions. The mass spectrum provides a “snapshot” of the relative solution-phase distributions of proteins and their complexes, from which accurate relative binding affinities can be determined with high precision.
Although there are limitations to this method, such as a restricted set of buffers and sensitivity to adducting salts, this method has notable advantages over traditional enzyme assays, most significantly: (1) the ESI–MS method does not require highly purified samples or precisely known concentrations; (2) ESI–MS can identify covalently modified proteins (e.g., disulfides) and evaluate the attendant impact on affinity; (3) the charge state distribution is a diagnostic for structurally aberrant proteins; (4) the method is fast (a few minutes/sample) and enables simultaneous comparison of multiple species; therefore, it is well-suited for high-throughput screening; (5) it is insensitive to mutations that alter enzyme activity; (6) it requires no immobilization; therefore, artifacts that sometimes confound heterogenous phase analysis (e.g., surface based biosensing or ELISA) are obviated; (7) no derivitization of the proteins is required. Consequently, the described mass spectrometric procedure is a very attractive method for high-throughput measurements of relative binding affinities of protein–protein complexes.
Materials and methods
Protein expression and purification
ACS grade urea was purchased from Sigma chemical company, and used without further modification.
Barnase was expressed heterologously in Escherichia coli strain HB101 with plasmid pMT1002, a derivative of pTN441 with the HindIII sites removed from the cI gene (Okorokov et al. 1994). Cells were grown according to an unpublished protocol suggested by R.H. Hartley (pers. comm.). The culture was grown in buffered rich medium with ampicillin for 24 h; barnase was secreted into the medium. The culture was chilled and acetic acid was added to 5%. Cells were centrifuged out and barnase was collected from the medium by stirring it with SP-Sephadex for 1 h. The resin was collected into a column and barnase eluted with 2 M ammonium acetate (pH 8.0). This crude preparation gave an excellent ESI–MS signal and could be used to form complexes. The eluent was desalted and loaded onto an SP Sephadex column, from which it was eluted with a 0.2–1.0 M gradient of ammonium acetate (pH 8.0). The resulting purified protein yield was typically 50–100 mg/L of culture. Protein was transferred into the electrospray solution (200 mM ammonium bicarbonate, 1% [v/v] glycerol) by dialysis.
Barstar was expressed heterologously in E. coli strain HB101 with plasmid pMT316 (Hartley 1988). Mutations were made by the Quik-Change protocol of Stratagene. Cells were grown in buffered rich medium, and were induced during exponential growth with 100 μM isopropyl thio-β-D-galactopyranose. Cells were centrifuged after 24 h, transferred into 20 mM ammonium acetate (pH 8.0), and washed. Cells were broken ultrasonically and the soluble lysate was fractionated with ammonium sulfate. Barstar precipitated in the 40%–80% cut. The resolubilized 80% pellet was transferred into 20 mM ammonium acetate (pH 8.0) with a Sephadex G-25 column. This desalted solution gave excellent ESI–MS signal, and could be used for complex formation. Protein was further purified for quantitative comparisons by anion-exchange chromatography on Q-Sephadex. Yields were between 0.1 and 1 g/L of culture. Protein was transferred into the electrospray solution by dialysis.
Dialyzes during protein purification were performed with Spectra-Por cellulose membranes (Spectrum). Complexes were urea annealed in “Slide-a-Lyzer MINI” dialysis cartridges (Pierce Chemical). Urea annealing was not necessary for fluorescence experiments because those experiments did not involve competition between barstar mutants.
Activity assays
Free barnase activity was monitored during the course of purification of barnase and barstar using Torula yeast RNA (Rushizky et al. 1963). Barstar was quantitated by titration against barnase activity. A more precise measure of free barnase activity, used in determining solution KD values, was conducted with a fluorescent ligand by the method of Hartley (2001) that is described in the Discussion section.
Mass spectrometry
Mass spectra were acquired on a Fourier transform mass spectrometer with a 9.4-T superconducting magnet. This instrument has been described elsewhere (Jurchen and Williams 2003). Ions were generated by nanoelectrospray from borosilicate glass capillaries pulled to ∼4 μm inner diameter tips. A total of 10 μL of analyte solution is added to the capillary, which is placed ∼1.5 mm from the instrument's orifice, and a potential of −750 to −1100 V relative to the instrument is applied to the solution via an inserted platinum wire.
Nanoelectrospray-generated ions are stored in a hexapole and are introduced through a standard Bruker Apex II ESI source. Ions are pulsed from the hexapole through a series of lenses and ion guides into a custom-designed cylindrical ion cell at ultra-high vacuum (∼10−9 mbar). Injection of ions into the analyzer cell is accompanied by a transient pulse of nitrogen gas to ∼5 × 10⁻⁶ mbar to assist in trapping and thermalizing the ions.
Acknowledgments
We thank Dr. Robert Hartley for his generous gifts of plasmids PMT1002 and PMT316, and for advice on their use, and Mr. Osita A. Udekwu and Mr. Nicholas A. Leefer for assistance with the solution assays. This work was supported by the National Institutes of Health (E.R.W., GM64712; J.F.K., GM35373).
Footnotes
Reprint requests to: Jack Kirsch, Program in Biophysics, Department of Chemistry, and Department of Molecular and Cellular Biology, University of California at Berkeley, Berkeley, CA 94720-1460, USA; e-mail: jfkirsch@uclink.berkeley.edu; fax (510) 642-6368; or Evan Williams, Program in Biophysics, Department of Chemistry, University of California at Berkeley, Berkeley, CA 94720-1460, USA; e-mail: williams@cchem.berkeley.edu; fax (510) 642-7714.
Article and publication are at http://www.proteinscience.org/cgi/doi/10.1110/ps.062083406.
References
- Belov M.E., Goshkov M.V., Udseth H.R., Anderson G.A., Smith R.D. 2000. Zeptomole-sensitivity electrospray ionization—Fourier transform ion cyclotron resonance mass spectrometry of proteins Anal. Chem. 72 2271–2279. [DOI] [PubMed] [Google Scholar]
- Buckle A.M., Shreiber G., Fersht A.R. 1994. Protein/protein recognition: Crystal structural analysis of a barnase-barstar complex at 2.0 Ångstrom resolution Biochemistry 33 8878–8889. [DOI] [PubMed] [Google Scholar]
- Causier B. and Davies B. 2002. Analysing protein/protein interactions with the yeast two-hybrid system Plant Mol. Biol. 50 855–870. [DOI] [PubMed] [Google Scholar]
- Cheung T.C. and Hearn J.P. 2003. Development of a baculovirus-based fluorescence resonance energy transfer assay for measuring protein-protein interaction Eur. J. Biochem. 270 4973–4981. [DOI] [PubMed] [Google Scholar]
- Chowdhury S.K., Katta V., Chait B.T. 1990. Probing conformational changes in proteins by mass spectrometry J. Am. Chem. Soc. 112 9012–9013. [Google Scholar]
- Cooper A., Johnson C.M., Lakey J.H., Nollmann M. 2001. Heat does not come in different colors: Entropy-enthalpy compensation, free energy windows, quantum confinement, pressure perturbation calorimetry, solvation and the multiple causes of heat capacity effects in biomolecular interactions Biophys. Chem. 93 215–230. [DOI] [PubMed] [Google Scholar]
- Daniel J.M., McCombie G., Wendt S., Zenobi R. 2003. Mass spectrometric determination of association constants of adenylate kinase with two noncovalent inhibitors J. Am. Soc. Mass Spectrom. 14 442–448. [DOI] [PubMed] [Google Scholar]
- DeLano W.L. 2002. Unraveling hot spots in binding interfaces: Progress and challenges Curr. Opin. Struct. Biol. 12 14–20. [DOI] [PubMed] [Google Scholar]
- DeLano W.L., Ultsch M.H., de Vos A.M., Wells J.A. 2000. Convergent solutions to binding at a protein-protein interface Science 287 1279–1283. [DOI] [PubMed] [Google Scholar]
- Foty R.A. and Steinberg M.S. 2004. Cadherin mediated cell-cell adhesion and tissue segregation in relation to malignancy Int. J. Dev. Biol. 48 397–409. [DOI] [PubMed] [Google Scholar]
- Frisch C., Schrieber G., Johnson C.M., Fersht A.R. 1997. Thermodynamics of the interaction of barnase and barstar: Changes in free energy versus changes in enthalpy on mutation J. Mol. Biol. 267 696–706. [DOI] [PubMed] [Google Scholar]
- Fu W.M., Chang T.K., Sun W.Z., Ling Q.D., Peng H.C., Liou H.C., Lu D.Y., Huang T.F. 2004. Inhibition of neuropathic pain by a potent disintegrin—triflavin Neurosci. Lett. 368 263–268. [DOI] [PubMed] [Google Scholar]
- Gestwicki J.E., Crabtree G.R., Graef I.A. 2004. Harnessing chaperones to generate small-molecule inhibitors of amyloid β aggregation Science 306 865–869. [DOI] [PubMed] [Google Scholar]
- Hammett L.P. In Physical organic chemistry. . 1940. McGraw-Hill, New York.
- Hartley R.W. 1988. Barnase and barstar: Expression of its cloned inhibitor permits expression of a cloned RNAase J. Mol. Biol. 202 913–916. [DOI] [PubMed] [Google Scholar]
- Hartley R.W. 1993. Directed mutagenesis and barnase-barstar recognition Biochemistry 32 5978–5984. [DOI] [PubMed] [Google Scholar]
- Hartley R.W. 2001. Barnase-barstar interaction Methods Enzymol. 341 599–611. [DOI] [PubMed] [Google Scholar]
- Heck A.J.R. and van den Heuvel R.H.H. 2004. Investigation of intact protein complexes by mass spectrometry Mass Spectrom. Rev. 23 368–389. [DOI] [PubMed] [Google Scholar]
- Homola J. 2003. Present and future of surface plasmon resonance biosensors Anal. Bioanal. Chem. 377 528–539. [DOI] [PubMed] [Google Scholar]
- Iavarone A.T. and Williams E.R. 2003. Mechanism of charging and supercharging molecules in electrospray ionization J. Am. Chem. Soc. 125 2319–2327. [DOI] [PMC free article] [PubMed] [Google Scholar]
- Janin J. and Chothia C. 1990. The structure of protein/protein recognition sites J. Biol. Chem. 265 16027–16030. [PubMed] [Google Scholar]
- Jørgensen T.J.D., Roepstorff P., Heck A. 1998. Direct determination of solution binding constants for noncovalent complexes between bacterial cell wall peptide analogues and vancomycin group antibiotics by electrospray ionization mass spectrometry Anal. Chem. 70 4427–4432. [Google Scholar]
- Jurchen J.C. and Williams E.R. 2003. Origin of asymmetric charge partitioning in the dissociation of gas-phase protein homodimers J. Am. Chem. Soc. 125 2817–2826. [DOI] [PMC free article] [PubMed] [Google Scholar]
- Kempen E.C. and Brodbelt J.S. 2002. A method for the determination of binding constants by electrospray ionization mass spectrometry Anal. Chem. 72 5411–5416. [DOI] [PubMed] [Google Scholar]
- Loo J.A. 1997. Studying noncovalent protein complexes by electrospray ionization mass spectrometry Mass Spectrom. Rev. 16 1–23. [DOI] [PubMed] [Google Scholar]
- Loo J.A., Hu P., McConnell P., Mueller W.T., Sawyer T.K., Thanabal V. 1997. A study of src SH2 domain protein-phosphopeptide binding interactions by electrospray ionization mass spectrometry J. Am. Soc. Mass Spectrom. 8 234–243. [Google Scholar]
- Miranker A.D. 2000. Protein complexes and analysis of their assembly by mass spectrometry Curr. Opin. Struct. Biol. 10 601–606. [DOI] [PubMed] [Google Scholar]
- Mitkevich V.A., Schulga A.A., Ermolyuk Y.S., Lobachov V.M., Chekhov V.O., Yakolev G.I., Hartley R.W., Pace C.N., Kirpichnikov M.P., Makarov A.A. 2003. Thermodynamics of denaturation of complexes of barnase and binase with barstar Biophys. Chem. 105 383–390. [DOI] [PubMed] [Google Scholar]
- Okorokov A.L., Hartley R.W., Panov K.I. 1994. An improved system for ribonuclease ba expression Protein Expr. Purif. 5 547–552. [DOI] [PubMed] [Google Scholar]
- Ozawa T. and Umezawa Y. 2001. Detection of protein-protein interactions in vivo based on protein splicing Curr. Opin. Struct. Biol. 5 578–583. [DOI] [PubMed] [Google Scholar]
- Powell K.D., Ghaemmaghami S., Wang M.Z., Ma L., Oas T.G., Fitzgerald M.C. 2002. A general mass spectrometry-based assay for the quantitation of protein-ligand binding interactions in solution J. Am. Chem. Soc. 124 10256–10257. [DOI] [PubMed] [Google Scholar]
- Robinson C.V., Chung E.W., Kragelund B.B., Knudsen J., Aplin R.T., Poulsen F.M., Dobson C.M. 1996. Probing the nature of noncovalent interactions by mass spectrometry: A study of protein-CoA ligand binding and assembly J. Am. Chem. Soc. 118 8646–8653. [Google Scholar]
- Rushizky G.W., Sober H.A., Hartley R.W., Greco A.E. 1963. Studies on B. subtilis ribonuclease. 1. Characterization of enzymatic specificity Biochemistry 2 787–793. [DOI] [PubMed] [Google Scholar]
- Schrieber G. and Fersht A.R. 1993. Interaction of barnase with its polypeptide inhibitor barstar studied by protein engineering Biochemistry 32 5145–5150. [DOI] [PubMed] [Google Scholar]
- Schrieber G. and Fersht A.R. 1995. Energetics of protein-protein interactions: Analysis of the barnase-barstar interface by single mutations and double mutant cycles J. Mol. Biol. 248 478–486. [DOI] [PubMed] [Google Scholar]
- Sridevi K. and Udgaonkar J.B. 2002. Unfolding rates of barstar determined in native and low denaturant conditions indicate the presence of intermediates Biochemistry 41 1568–1578. [DOI] [PubMed] [Google Scholar]
- Trester-Zadlitz M., Kamada K., Burley S.K., Fenyo D., Chait B., Muir T. 2003. A modular cross-linking approach for exploring protein interactions J. Am. Chem. Soc. 125 2416–2425. [DOI] [PubMed] [Google Scholar]
- Tsuchiya Y., Sawada S., Tsukada K., Saiki I. 2002. A new psuedo-peptide of arg-gly-asp (RGD) inhibits metastasis of orthopically implanted murine hepatocellular carcinoma Int. J. Oncol. 20 319–324. [PubMed] [Google Scholar]
- Valaskovic G.A., Kelleher N.L., McLafferty F.W. 1996. Attomole protein characterization by capillary electrophoresis mass spectrometry Science 273 1199–1202. [DOI] [PubMed] [Google Scholar]
- Vaughn C.K., Buckle A.M., Fersht A.R. 1999. Structural response to mutation at a protein-protein interface J. Mol. Biol. 286 1487–1506. [DOI] [PubMed] [Google Scholar]
- Veenstra T.D. 1999. Electrospray ionization mass spectrometry in the study of bimolecular non-covalent interactions Biophys. Chem. 79 63–79. [DOI] [PubMed] [Google Scholar]
- Wang W., Kitova E.N., Klassen J.S. 2003. Influence of solution and gas phase processes on protein-carbohydrate binding affinities determined by nanoelectrospray Fourier transform ion cyclotron resonance mass spectrometry Anal. Chem. 75 4945–4955. [DOI] [PubMed] [Google Scholar]
- Weber P.C. and Salemme F.R. 2003. Applications of calorimetric methods to drug discovery and the study of protein interactions Curr. Opin. Struct. Biol. 13 115–121. [DOI] [PubMed] [Google Scholar]
- Wigger M., Eyler J.R., Benner S.A., Li W., Marshall A.G. 2002. Fourier transform-ion cyclotron resonance mass spectrometric resolution, identification, and screening of non-covalent complexes of hck src homology 2 domain receptor and ligands from a 324-member peptide combinatorial library J. Am. Soc. Mass Spectrom. 13 1162–1169. [DOI] [PubMed] [Google Scholar]
- Wong S.F., Meng C.K., Fenn J.B. 1988. Multiple charging in electrospray ionization of poly(ethylene glycol) J. Phys. Chem. 92 546–550. [Google Scholar]
- Zhang S., Van Pelt C.K., Wilson D.B. 2003. Quantitative determination of noncovalent binding interactions using automated nanoelectrospray mass spectrometry Anal. Chem. 75 3010–3018. [DOI] [PubMed] [Google Scholar]
- Zhou H.X. 1993. Brownian dynamics study of the influences of electrostatic interaction and diffusion on protein-protein association kinetics Biophys. J. 64 1711–1726. [DOI] [PMC free article] [PubMed] [Google Scholar]


