

Abstract
Recent work using chemical cross-linking to define interresidue distance constraints in proteins has shown that these constraints are useful for testing tertiary structural models. We applied this approach to the G-protein-coupled receptor bovine rhodopsin in its native membrane using lysine- and cysteine-targeted bifunctional cross-linking reagents. Cross-linked proteolytic peptides of rhodopsin were identified by combined liquid chromatography and FT-ICR mass spectrometry with automated data-reduction and assignment software. Tandem mass spectrometry was used to verify cross-link assignments and locate the exact sites of cross-link attachment. Cross-links were observed to form between 10 pairs of residues in dark-state rhodopsin. For each pair, cross-linkers with a range of linker lengths were tested to determine an experimental distance-of-closest-approach (DCA) between reactive side-chain atoms. In all, 28 cross-links were identified using seven different cross-linking reagents. Molecular mechanics procedures were applied to published crystal structure data to calculate energetically achievable theoretical DCAs between reactive atoms without altering the position of the protein backbone. Experimentally measured DCAs are generally in good agreement with the theoretical DCAs. However, a cross-link between C316 and K325 in the C-terminal region cannot be rationalized by DCA simulations and suggests that backbone reorientation relative to the crystal coordinates occurs on the timescale of cross-linking reactions. Biochemical and spectroscopic data from other studies have found that the C-terminal region is highly mobile in solution and not fully represented by X-ray crystallography data. Our results show that chemical cross-linking can provide reliable three-dimensional structural information and insight into local conformational dynamics in a membrane protein.
Keywords: bovine rhodopsin, cross-linking, distance constraints, LC-MS, Q-Tof, FT-ICR, tandem mass spectrometry
Membrane proteins, encoded by as much as 30% of the genes in most organisms, play a central role in intracellular signaling, energy and material transport, cell intoxication and pathogenesis, and cell recognition and motility. However, relative to soluble proteins, few membrane protein structures have been resolved by X-ray crystallography and/or NMR spectroscopy (White 2004). Progress in the structural analysis of eukaryotic membrane proteins in particular has been slowed by the instability of these proteins in environments lacking phospholipids, their tendency toward aggregation and precipitation, low protein abundance, difficulties in expressing functional protein, and sample purity issues that have hindered the application of standard structural determination methods.
Such technical challenges have necessitated the use of a variety of techniques to gather information about the structure and conformational dynamics of membrane proteins. Disulfide mapping, photoaffinity labeling, metal-ion binding, solvent accessibility, and site-directed spin labeling studies combined with electron paramagnetic resonance (SDSL-EPR) have been used to obtain low- to moderate-resolution distance constraints in membrane proteins (Nakayama and Khorana 1990; Resek et al. 1993; Nakanishi et al. 1995; Yu et al. 1995; Farrens et al. 1996; Sheikh et al. 1996; Wu and Kaback 1996; Klein-Seetharaman et al. 2001; Hubbell et al. 2003). These methods often require the construction and expression of site-specific histidine or cysteine mutants of the native protein. Alternatively, several groups have recently reported an approach to the analysis of protein structure that combines chemical cross-linking and mass spectrometry to obtain moderate-resolution structural information (Young et al. 2000; Davidson and Hilliard 2003; Huang et al. 2004; Silva et al. 2005). This approach utilizes reactive amino acid residues in the native protein sequence, offering the advantage of minimally perturbing protein structure and allowing studies to be carried out on protein in its native environment.
In this study, we have adapted cross-linking methods to a membrane protein in its native membrane. We chose the extensively studied G-protein-coupled receptor (GPCR) rhodopsin as a model system because it can be purified in large quantities in its native rod outer segment (ROS) membrane, and there are several crystal structures (Palczewski et al. 2000; Okada et al. 2002; Li et al. 2004) with which we can compare our results. The study of native membrane proteins by chemical cross-linking requires significant optimization of (1) sample preparation methods (including reaction conditions, separation of monomeric protein, and proteolysis), (2) chromatography and mass spectrometry conditions for separating and identifying complex mixtures of hydrophobic peptides, and (3) data analysis software for the assignment of complex MS spectra. We show that once these methodologies are optimized, they can be used to successfully identify specific sites of chemical cross-linking in bovine rhodopsin.
We also consider the best way to relate the formation of interresidue cross-links to the structure and dynamics of a protein, an issue that has great impact on the utility of cross-linking data in structure determination. In general, flexible cross-links between atoms on flexible amino acid side chains will produce constraints with large distance uncertainties, limiting the accuracy of structural models that depend on them (Faulon et al. 2003). Distance measurements can be refined by performing a series of cross-linking reactions using reagents with a range of linker arm lengths but identical end-group reactivity and identifying the minimum length that allows for the formation of the cross-link (Novak et al. 2003). This approach provides an upper, and potentially a lower, bound on the distance of closest approach (DCA) between reactive atoms, albeit over a timescale of minutes, and is similar to the use of nested-length covalently tethered inhibitors on transmembrane channels as molecular “tape measures” to measure the radial distance of residues from the pore (Blaustein et al. 2000).
In order to validate chemical cross-linking as a method for deriving bounds on interresidue distances, we have extensively compared experimentally observed cross-links in bovine rhodopsin with those predicted from the X-ray crystal structure of rhodopsin (Palczewski et al. 2000) using a variety of modeling approaches. In general, the observed cross-links are consistent with the structural information available for bovine rhodopsin, although the data imply significant side-chain motion relative to the crystal structure coordinates, as has been concluded from other studies (for review, see Klein-Seetharaman 2002). The results indicate that cross-linking is a useful technique for probing membrane protein structure and, potentially, assessing dynamic features of a structure—features that may be important in the conformational changes that accompany protein activation and protein–protein interactions.
Results
Sample preparation
Bovine rhodopsin in the rod outer segment (ROS) membrane was first reacted with either hetero-bifunctional cysteine- and lysine-specific (C–K) or homo-bifunctional lysine-specific (K–K) cross-linking reagents under dim red light. The C–K reagents chosen (SIA, GMBS, EMCS, LS-SMCC) contain a primary amine-reactive N-hydroxysuccinimidyl (NHS) ester group on one end and a sulfhydryl-reactive group (iodoalkyl for SIA, maleimidyl for all others) on the other; the K–K reagents used (DST, DSG, DSS) have NHS esters at both ends. (See Materials and Methods for the full chemical names of the cross-linkers.)
During a cross-linking reaction, cross-linker can react with two amino acid residues on a single rhodopsin molecule, or with residues on two proteins to form a covalent dimer. Similarly, dimers can be linked to other rhodopsin molecules to form multimeric covalent complexes. All of these scenarios were observed under the reaction conditions used (Fig. 1). The molar excess of cross-linker to protein was optimized (typically 50:1) in order to minimize the formation of dimer and higher-order complexes, but separation of monomeric and multimeric protein was necessary to definitively identify intra-molecular cross-links. Standard SDS-PAGE separation followed by in-gel digestion protocols did not provide complete protein sequence coverage due to retention in the gel of hydrophobic peptides (data not shown). Instead, monomeric rhodopsin was purified using preparative tube gel electrophoresis with automated fraction collection (see Fig. 1) before protein digestion. Using this technique, the yield of monomer following cross-linking and purification was 50%–70% of the starting material in ROS membrane.
Figure 1.

Cross-linking of dark-adapted rhodopsin in native rod outer segment membranes (ROS) and purification of monomeric proteins is shown by Coomassie-stained 4%–20% Tris-Gly SDS-PAGE. Rhodopsin is the primary component of purified ROS membranes (lanes 1,2; monomeric rhodopsin band indicated by arrow M). Following reaction of ROS with C–K cross-linkers, dimer (arrow D) is observed for cross-linkers EMCS (lane 3, 50:1 cross-link:rhodopsin; lane 4, 200:1), GMBS (lane 5, 50:1), LC-SMCC (lane 6, 50:1) and SIA (lane 7, 50:1; lane 8, 200:1). Monomeric protein was purified from dimer and higher-order complexes by preparative PAGE for each cross-linking experiment, in the same order, in lanes 9–14. A standard with the relevant masses labeled is in the left lane.
LC-MS
Several groups have reported the use of C4, C8, or C18 columns for the reversed-phase HPLC separation of peptides resulting from the digestion of rhodopsin and bacteriorhodopsin (Barnidge et al. 1997; Ball et al. 1998). We achieved optimal separation using a polysterene/divinylbenzene column (PLRP-S, Michrom Bioresources), which effectively separated peptides with a wide range of hydrophobicity. Following the reduction and alkylation of cysteines, purification of monomeric protein, and protein precipitation, rhodopsin was cleaved at methionines using cyanogen bromide (CNBr) and analyzed by LC-MS, as detailed in Materials and Methods. An example of an LC-MS analysis of rhodopsin digest products is shown in Figure 2A. Complete sequence coverage, including peptides containing glycosyl and palmitoyl groups, was routinely observed. Despite this, many prominent species could not be identified. These may represent heterogeneity in the rhodopsin population or low-abundance, contaminating membrane proteins in ROS membrane. Following cross-linking of rhodopsin, new masses were observed by LC-MS and identified by our assignment software as peptides that were cross-linked or otherwise modified by cross-linking reagents. An example for the C–K cross-linker EMCS is shown in Figure 2B. The chromatographic behavior of a cross-linked peptide pair and one of the parent peptides is shown in Figure 2, C and D. It is important to note that cross-linked products were always much less abundant than unmodified parent peptides from the same experiment, as measured by LC-MS, making optimization of sample preparation, chromatographic separation, and instrument sensitivity key factors in the detection of cross-linked species.
Figure 2.

Total ion chromatograms (TICs) of the reverse-phase HPLC separation and FT-MS of CNBr-digested rhodopsin (A) and rhodopsin exposed to the cysteine–lysine cross-linker EMCS (B). For the region of B from 10 to 20 min, selected ion chromatograms (SICs) of the most abundant charge state for peptide 50—86 cross-linked to peptide 310—317 (C, dotted line, expanded vertically fourfold) and unmodified peptide 50—86 (D, solid line) are shown. The SICs for the entire chromatogram are overlaid to scale on the TIC. All post-translational modifications were observed; free cysteines were reduced and pyridylethylated.
Identification of cross-links
We found it necessary to develop stringent guidelines for the identification of cross-linked peptides from very complex peptide mixtures to rule out spurious assignments. From the present work, we determined that reliable identification of cross-linked peptides by mass spectrometry required (1) reproducible proteolysis methods, (2) complete sequence coverage of peptides containing reactive residues, (3) comparison between control and cross-linking experiments to identify differences in LC-MS profile, (4) acquisition of MS and MS/MS spectra with high mass accuracy, and, in some cases, (5) independent confirmation of cross-links through the identification of redundant, mass-shifted assignments in experiments using cross-linkers with the same residue specificity but different molecular weight.
For LC-MS experiments on proteolyzed, cross-linked rhodopsin, mass spectra were usually internally calibrated against unmodified CNBr digest peptides using Xmass software (Bruker Daltonics). This resulted in monoisotopic mass accuracies usually <2 ppm, although for low-abundance peaks this value was as high as 8 ppm (Tables 1, 2). Experimental masses were assigned against a theoretical library using the program ASAP (see Materials and Methods) with a 5–10 ppm error threshold. The high mass accuracy of Fourier transform ion cyclotron resonance (FT-ICR) mass spectrometry was usually sufficient to provide unambiguous assignments of cross-linked species without the use of isotopically labeled reagents or MS/MS. Automated assignments were then manually evaluated for reasonable elution time and chromatographic profile, isotopic distribution, charge state distribution, MS peak shape, and signal-to-noise ratio. In addition, as described below, all of the cross-link assignments were verified by MS/MS and/or through assignment redundancy between experiments using cross-linkers with different lengths but the same specificity.
Table 1.
Observed M + H+ and experimental error of cysteine–lysine cross-linked, CNBr-digested rhodopsin

Table 2.
Observed M + H+ and experimental error of lysine–lysine cross-linked, CNBr-digested rhodopsin

A summary of cross-links formed using hetero-bifunctional C–K reagents is given in Table 1. The cross-links involve residues present on the cytoplasmic face of rhodopsin involving CNBr peptides 50–86, 310–317, 318–348, and 87–143. Only minor differences were observed in the cross-linking pattern produced by the different reagents. For example, the cross-linkers GMBS, EMCS, and LC-SMCC all formed the same cross-links despite large differences in linker arm lengths. Figure 3 shows examples of C–K cross-links between CNBr peptides 50–86 and 310–317, which were observed for all four C–K reagents used in this study. This figure demonstrates how the use of a series of cross-linkers provides verification of a cross-link assignment. Two intra-peptide cross-links, C140×K141 (peptide 87–143) and K311×C316 (peptide 310–317), formed using all but the shortest cross-linker, SIA, raising the possibility that the DCAs for these reactive atom pairs were greater than the fully extended length of SIA.
Figure 3.

Mass spectra of rhodopsin CNBr digest peptides 50–86 and 310–317 cross-linked with cysteine–lysine cross-linkers of different linker arm length. A single spectrum from an LC-MS experiment is shown for each cross-linker, and the monoisotopic peak is indicated by an arrow for SIA, m/z 1055.388+5, signal/noise (S/N) = 241 (A); GMBS, m/z 1080.383+5, S/N = 717 (B); EMCS, m/z 1085.998+5, S/N = 463 (C); and LC-SMCC, m/z 1113.816+5, S/N = 345 (D). S/N is based on most abundant isotope peak. See Table 1 for M + H+ and experimental errors.
Cross-linking results using homo-bifunctional K–K reagents are summarized in Table 2. As with the C–K cross-links, they involved cytoplasmic residues on CNBr peptides 50–86, 310–317, and 318–348. Again, a similar cross-linking pattern was observed with all three K–K cross-linkers with the exception of K325×K339, which was not detected with the shortest cross-linker, DST. No cross-links were observed involving K296, the retinal attachment site, or K16, the only reactive residue located on the extracellular side of the membrane. It should be noted that a negative result does not definitively prove that a cross-link did not form, only that it was below the threshold for detection. There are a number of reasons why a low-abundance cross-link may not be detected using these methods (see Discussion).
MS/MS
Three rhodopsin CNBr digest peptides contain more than one lysine. We found that proteolysis using trypsin (at lysines, arginines, and possibly tyrosines) was inefficient, resulting in a number of missed cleavage products and thereby reducing the MS signal intensity for individual peptides to the point that cross-linked digest products were difficult to identify. Instead, we performed tandem MS experiments to resolve the exact sites of cross-linking when ambiguities arose. The high MW and low abundance of cross-linked peptides prevented us from performing data-dependent LC-MS/MS experiments. Instead, cross-linked products were purified by semi-preparative HPLC and analyzed by direct infusion MS. Fractions were screened by Q-Tof-MS to identify those containing cross-linked species. These fractions were then analyzed by direct infusion MS/MS, as described below.
Several of the cross-link assignments posed particular problems for analysis by MS/MS. The peptide 50–86 contains two adjacent lysines in the center of the peptide that could not be sequenced by FT-MS/MS using collision-induced dissociation (CID) or infrared multi-photon dissociation (IRMPD) or by Q-Tof-MS/MS using CID. However, it was found that FT-MS/MS using electron capture dissociation (ECD) resulted in fragmentation through the center of the peptide. Thus, several cross-link assignments containing peptide 50–86, notably 50–86×310–317 (K66 or K67 cross-linked to C311) and 50–86×318–348 (residues K66 or K67 cross-linked to K325 or K339) were disambiguated using this technique. The FT-MS/MS studies involving CID, IRMPD, and ECD techniques are presented in a separate report (Novak et al. 2005). It was shown that K67 and not K66 participates in cross-links with C316, K325, and K339. One assignment, 50–86×310–317 (K66/67×K311), occurred in too low abundance to allow MS/MS. However, it seems likely based on modeling and cross-linking data that K67 is also the primary participant in this cross-link (see Discussion).
We found that CID MS/MS using a Q-Tof instrument was effective for resolving the sites of attachment for some cross-linked peptides. The results of two such experiments, involving the peptides 318–348 and 310–317 linked with either C–K or K–K cross-linkers, are shown in Figure 4. An interesting cross-linking pattern is revealed by these data: C316 cross-links selectively to K325 (Fig. 4A), while K311, which is on the same short CNBr peptide as C316, is linked preferentially to K339 (Fig. 4B). Since CID can fragment at the amide bond formed between the epsilon amino group of lysine and the carbonyl of the linker arm, it is not possible to entirely rule out a cross-link based on its absence in a CID MS/MS spectrum. However, extensive y- and b- ion series directly confirming the cross-links described above were observed in the MS/MS spectra, suggesting that these are the major products. In the case of cross-link C316×K325, nearly identical spectra were observed following CID fragmentation of peptides cross-linked with three different reagents, SIA, GMBS, and LC-SMCC, which have a large range of linker arm lengths (data are shown only for LC-SMCC). There is indirect evidence that a very small portion of the cross-linking could occur between C316 and K339, based on the b-ion fragment containing the unmodified sequence 318–326 (see Fig. 4A). However, the MS peak is very low-abundance and could also be formed by double fragmentation at both the amide bond in the cross-link and before P327, which in control MS/MS experiments with peptide 318–348 is one of the major points of fragmentation (data not shown).
Figure 4.

The exact site of attachment for two cross-links was determined by Q-Tof MS/MS using CID. Rhodopsin CNBr digest peptides 310–317 and 318–348 were cross-linked by the cysteine–lysine cross-linker LC-SMCC (A) or the lysine–lysine cross-linker DSG (B). The fragmentation patterns show that cross-links were formed specifically between C316 of peptide 310–317 and K325 of peptide 318–348 using LC-SMCC and between K311 of peptide 310–317 and K339 of peptide 318–348 using DSG. The spectra are labeled with major b-, y-, and internal ion series; a cross-link between fragments is indicated by an “x.” C322 and C323 are palmitoylated, and M317 is modified to homoserine lactone by CNBr cleavage. The largest peaks have been truncated for clarity.
Labeling studies
Cysteine and lysine labeling experiments were performed to assess the role of reactivity/accessibility in cross-link formation. It was shown previously that two cysteine residues, C140 and C316, are reactive under mild conditions (Findlay et al. 1984; Resek et al. 1993), and our results using N-ethyl-maleimide (NEM) are consistent with this (data not shown). By contrast, 4-vinylpyridine (90 mM) reacted with all reduced cysteines, as was also observed recently by Wang and coworkers (Wang et al. 2004). We also note that some of C322 and/or C323 was labeled using either NEM or 4-VP (data not shown), indicating that these sites were not fully palmitoylated. It has been shown that DTT, which is present at 1 mM during the ROS membrane preparation, can remove palmitoyl groups (Sachs et al. 2000). To explore this possibility, we performed a ROS preparation without DTT. We still observed un-palmitoylated cysteines, but at much lower levels than in rhodopsin from preparations using DTT. This suggests that while most of the observed under-palmitoylation is due to the presence of DTT, there is some under-palmitoylated rhodopsin already present before purification.
We also performed lysine labeling experiments using N-hydroxysuccinimide esters. Under conditions similar to those used in cross-linking experiments, every lysine residue except K298, which is presumably bound to retinal, were labeled at 50:1 excess of label over protein (data not shown). These findings are similar to those of Wang and coworkers (Wang et al. 2004).
Definition of distance constraints from cross-linking results
A recent study reported the length distributions of some commonly used cross-linkers, including the K–K cross-linkers used in this study (Green et al. 2001). For this study, we calculated minimum and maximum sulfur-to-nitrogen distances for C–K cross-linkers using methods similar to those of Green and coworkers (Green et al. 2001). The length ranges for all cross-linkers used in this study are shown in Tables 1 and 2. It is likely that extended conformations of the linker arm were accessible in the minute to hour time scale of cross-linking experiments. If a cross-link was formed for a given cross-linker, then the maximally extended linker length in its reacted form sets a hard upper bound on the distance of closest approach (DCA) between reacting atom pairs (N–N or S–N) on the protein's side chains. Experiments using cross-linkers with decreasing linker arm lengths allowed further refinement of the DCA between reactive atoms. Each distance constraint used in our molecular modeling (see below) corresponds to the predicted maximum length of the shortest cross-linker for which a cross-link was detected (presented in Table 3 as the observed DCA).
Table 3.
Comparison of cross-linker length and theoretical approach distances for cross-linked atoms

Comparison of experimental and predicted distances between reactive atoms
Three computational approaches were used to compare interatomic distances based on cross-linking to those predicted from the crystal structure of bovine rhodopsin. A baseline comparison was first made using distances between reactive side-chain atoms (S–N or N–N) calculated from the energy-minimized X-ray structure 1F88 (Palczewski et al. 2000). However, since the crystal structure represents a single, static picture of the protein structure, conformational search procedures were also used to investigate other energetically realistic side-chain orientations that could give rise to the experimentally observed cross-links. We calculated interatomic distances using ensembles compiled from (1) a 40-nsec molecular dynamics simulation of dark-adapted bovine rhodopsin in an explicit lipid bilayer (Crozier et al. 2003) and (2) constrained-energy minimization of structures generated by Monte Carlo conformational searches with flexible side chains and a fixed backbone. The results from these simulations are summarized and compared with experimental results in Table 3. The interatomic distances predicted by the constrained minimization were consistent with the experimental measurements in all but two cases, which are noted in Table 3 (and see Discussion). By contrast, the distances predicted from the crystal structure and molecular dynamics simulations were generally too large to account for the observed cross-links. The results of simulations suggest, therefore, that substantial side-chain movement occurs on the timescale of cross-linking reactions.
Discussion
Chemical cross-linking techniques have been used for decades to explore the conformation and quaternary structure of biomolecules. It was not demonstrated until recently, however, that cross-linking of a native protein, FGF2, could provide a significant number of intra-molecular cross-links in a single experiment (Young et al. 2000). Furthermore, when these cross-links were interpreted as distance constraints between backbone carbons, the set of constraints was sufficient to reject poor structural models from a set of homology-based models and select those from the correct fold family. Since that time, other studies have been published using a similar set of cross-linking, proteolysis, and mass spectrometry techniques (termed MS3D by its originators) (Huang et al. 2004; Silva et al. 2005), but none were targeted at integral membrane proteins. In this work, we present a set of methods developed using bovine rhodospin that will help to extend the applicability of cross-link-based structural studies to this biologically important family of proteins.
We have also examined the consistency of the cross-links we observed in bovine rhodopsin with existing structural data in an effort to establish improved methods for interpreting cross-linking-based distance constraints. In published MS3D studies, this interpretation has been ad hoc. The original study used them as Euclidian constraints between α-carbons to facilitate ranking of structural models of the backbone (Young et al. 2000). However, bifunctional cross-linking reagents presumably react with one side chain first, with the modified side chain then moving around the surface of the protein until it either reacts with another side chain or hydrolyzes. Our data support the hypothesis that, for proposed structural models (e.g., an X-ray structure), the minimum distance that can be dynamically achieved between two reacting side-chain atoms is related to, and should be less than, the maximum length of the shortest cross-linker that forms a cross-link between the two. If this hypothesis is correct, the case in which the length of an observed cross-link is shorter than the minimum distance between the reacting atoms permitted by the structural model would indicate that the structural model is locally in error, or that there may be local conformational flexibility. In the case of bovine rhodopsin, abundant structural data from disulfide cross-linking, EPR and NMR, X-ray crystallography, and molecular dynamics simulation are available for the dark-state conformation. These data provide a context for interpreting the cross-links we have observed in terms of the “known” structure of rhodopsin and its conformational dynamics.
Integral membrane proteins pose significant bioanalytical challenges. Recently, however, progress has been made in the preparation of integral membrane proteins, including rhodopsin, for mass spectrometry (Barnidge et al. 1997; Kraft et al. 2001; Knapp et al. 2002; Wang et al. 2004). In the present study, bovine rhodopsin was purified and modified with cross-linking and labeling reagents in native ROS membranes. This technique has the advantage of utilizing naturally occurring amino acid “handles” in the target protein and thus minimizing structural perturbations that might result from the introduction of mutations or removal of the protein from its native membrane environment. However, the information available from “native residue” cross-linking is limited by the number of cross-linking sites in the protein.
A number of technical difficulties were overcome in implementing a cross-linking protocol for rhodopsin, including the purification of monomeric protein to ensure that only intra-molecular cross-links were identified, the establishment of complete, reproducible proteolytic methods, and the development of LC-MS and MS/MS protocols that allowed the identification of minor cross-linked components within complex peptide mixtures. The resistance of rhodopsin to efficient enzymatic cleavage prevented identification of low-abundance cross-linked peptide products by “double digest” using CNBr and an enzyme such as trypsin. Instead, CNBr digestion, which results in consistent and nearly complete cleavage at methionine residues, was solely relied upon for this study. The drawback of CNBr cleavage of rhodopsin is that large fragments with multiple reactive residues are generated. Tandem MS was necessary in a number of cases to determine the exact sites of cross-linker attachment. In all but one case, ambiguous points of attachment were resolved by MS/MS experiments using either electron capture dissociation (ECD) or collision-induced dissociation (CID). The particularly difficult problem of distinguishing between K66 and K67, which are located in the center of a large CNBr peptide containing amino acids 50–86, required the use of ECD on an FTMS instrument, as detailed in a separate report (Novak et al. 2005). One cross-link, between K311 and either K66 or K67, could not be analyzed by ECD due to low abundance and problems isolating the parent ion. The ambiguous assignments that did not involve peptide 50–86 were resolved using CID as shown in Figure 4. The results of MS/MS experiments provide independent confirmation that cross-linked peptides can be accurately identified using high-resolution mass spectrometry alone without the need for additional tags such as isotopically labeled reagents (Muller et al. 2001; Collins et al. 2003).
It is clear from our data that cross-links do not form randomly between reactive residues and are generally consistent with previous studies, suggesting that cross-linking did not distort the protein structure. The cross-links observed in this study represent a subset of the possible pairings of reactive cysteines and lysines, and this subset was identical across repetitions of a given experiment (see Fig. 5). In fact, the pattern of cross-linking was generally not affected by the length of the cross-linker arm (see Tables 1, 2). In only three cases did a pair of residues observed to cross-link using the longest cross-linkers fail to do so with the shortest one. This is surprising given that the distance between reactive side-chain atoms based on crystal structure 1F88 (Palczewski et al. 2000) was in nearly every case greater than the length of the shortest cross-linker able to connect them (see Table 3). The cross-link between C316 and K67, for example, involves reactive atoms separated by 9.2 Å in the crystal structure but can be formed with SIA, which has an extended linker length of only 4 Å. Consistent with this, a study measuring the rate of spontaneous disulfide formation between C316 and engineered cysteines in cytoplasmic loop I (CLI) found that (1) a disulfide formed between C316 and a cysteine at position 67, albeit at a relatively slow rate; and (2) even at positions 65 and 68, where the rate of disulfide formation was the highest, the reactive atoms still require a 3- to 4-Å movement from the crystal coordinates to come within range for disulfide formation (Klein-Seetharaman et al. 2001).
Figure 5.

Cytoplasmic face of rhodopsin displaying reactive cysteine and lysine side chains. Connecting lines indicate unambiguous cysteine–lysine (orange) and lysine–lysine (blue) cross-link assignments; dashed lines indicate the unresolved cross-link between K311 and K66 or K67. Helical domains I–VIII and cytoplasmic loops CLI–CLIII are labeled. Arrows indicate C-terminal direction of the loops.
Residue accessibility appears to play an important role in determining which cross-links form. For example, MS/MS results show that cross-links form preferentially to K67 over K66 (Novak et al. 2005). This finding correlates with the time-averaged solvent exposures of these residues in structures calculated from a molecular dynamics simulation of rhodopsin (Crozier et al. 2003). In the presence of membrane lipids, the solvent exposure of K67 is about three times greater than that of K66 (Fig. 6, upper panel). This analysis was also performed for cysteine residues (Fig. 6, lower panel) and shows that the calculated solvent exposure corresponds well with actual reactivity based on labeling and cross-linking data.
Figure 6.
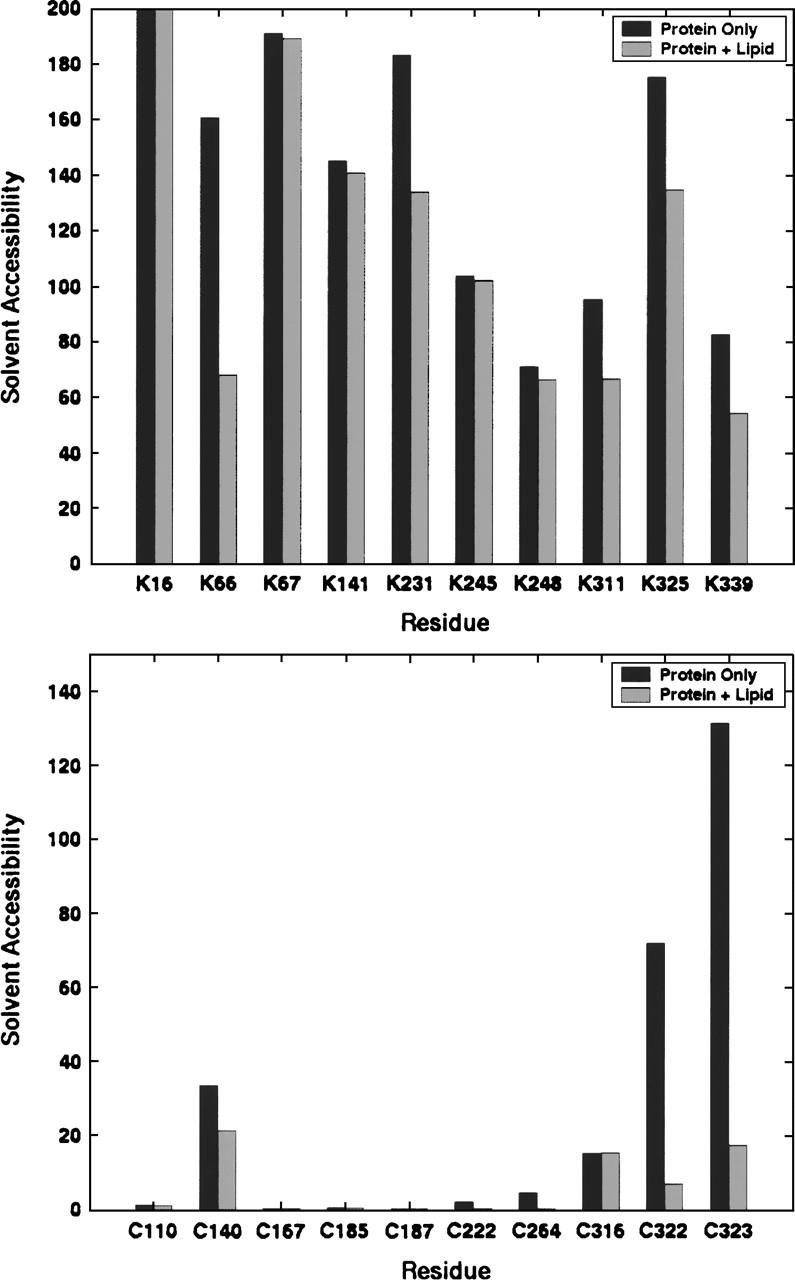
Average accessible surface areas (SAS, in Å2) of lysine (upper panel) and cysteine (lower panel) side chains calculated using a 2000-structure sample from a 40-nsec molecular dynamics simulation (Crozier et al. 2003).
In general, the crystal coordinates of reactive side-chain atoms were not predictive of which residue pairs would form cross-links, suggesting that substantial side-chain motion relative to the X-ray structure occurs on the timescale of the cross-linking reactions. Lysine residues in particular have substantial side-chain flexibility, making large deviations from their exact position in the crystal structure potentially relevant to the interpretation of cross-linking results. To account for this, we used several strategies to calculate the distance of closest approach, or DCA, for each pair of cross-linked atoms: (1) energy-minimized X-ray crystal structure 1F88 (Palczewski et al. 2000), (2) random sampling of side-chain conformations followed by constrained minimization and relaxation of the relevant interatomic distances (SC-CM), and (3) a 40-nsec molecular dynamics simulation (Crozier et al. 2003), as summarized in Table 3. Only three cross-links—C140×K141, K311×C316, and K67×K339—were consistent with the energy-minimized crystal structure. In all other cases, the distance between reactive atoms in the crystal structure was too large to account for the observed cross-links. In contrast, all but two cross-links (discussed below) were consistent with SC-CM simulation. Since the protein backbone was held in place during these simulations, the substantial shifts in the distance between reactive atoms relative to their position in the crystal structure (see Table 3) is due only to side-chain reorientation. Not unexpectedly, the DCA between reactive atoms was less in SC-CM simulations than in the crystal structure in every case. For example, the reactive nitrogen atoms of K311 and K339, which are 16.9 Å apart in the crystal structure, are brought to within 5.7 Å of each other by the SC-CM simulation, close enough to explain the observed cross-link formed by DST, which has a linker arm length of 5.8 Å. The DCA values calculated from the molecular dynamics simulation were generally somewhere in between the crystal structure and SC-CM calculations. When possible side-chain reorientations are considered, the set of cross-links involving CLI, helix VIII, and the C-terminal region (see Table 3; Fig. 5) are generally consistent with other structural studies of this region. Data from both biochemical studies (Cai et al. 1997; Klein-Seetharaman et al. 2001) and crystallography support the notion that there is substantial side-chain mobility in solvent-exposed regions of rhodopsin. Indeed, a survey of the rhodopsin crystal structures available in the protein database (Palczewski et al. 2000; Okada et al. 2002; Li et al. 2004) shows that the distances between reactive atoms vary by as much as 10 Å between structures due primarily to differences in side-chain orientation. It is important to note that the ability of two residues to cross-link implies only that sufficient proximity is attainable over the timecourse of a cross-linking reaction, not that such proximity is common or energetically favored.
Two cross-links involving K325 cannot be fully explained by simulations that incorporate side-chain flexibility. In particular, the cross-link formed between K325 and C316 by SIA, which indicates a maximum sulfur to nitrogen distance of 4.0 Å, is inconsistent with the minimum simulated DCA of 7.5 Å (Table 3). Similarly, the cross-link formed between K325 and K67 by DST (maximum nitrogen-to-nitrogen distance 5.8 Å) would not be predicted by DCA simulations (minimum DCA of 6.4 Å), although this discrepancy is less striking. Taken together, the results suggest that flexibility of the protein backbone around K325 is necessary to explain these cross-links. It is possible that attachment of the cross-linker at C316 distorts the structure locally and permits extension of the modified side chain to reach the other site, although we see no evidence for this in the overall pattern of cross-linking. Other possible cross-links involving C316, such as with K339, were not observed. It is interesting that C316 preferentially cross-links to K325 over K339, despite the latter achieving closer proximity during SC-CM simulation (7.5 vs. 3.4 Å, respectively), while K339 cross-links promiscuously to both K311 and K67. It should be stated that the CID MS/MS used to confirm these assignments can cause fragmentation at the amide bond formed between cross-linker and lysine, so the absence of a given cross-linked fragment is not definitive proof that the cross-link did not occur. The two C-terminal lysine residues (K325 and K339) were about equally reactive in NHS-acetate labeling experiments (data not shown; see also Wang et al. 2004). While it is possible that local steric effects or structural perturbations caused by cross-link attachment at C316 contributed to this pattern of cross-linking, the results taken together suggest that K325 and K339 are achieving positions that differ from those in the crystal structure during the course of cross-linking reactions.
The C-terminal region of rhodopsin beyond the palmitoylation sites appears to be mobile and highly unstructured. Indeed, the crystal structure b-factors rise sharply beyond the palmitoylation sites (C322 and C323), and no structure was observed from L328 to A333 (Palczewski et al. 2000) for the B chain of the structure 1F88 or for two other structures available in the protein database (Okada et al. 2002; Li et al. 2004). Based on spin-labeling experiments, Langen and coworkers (Langen et al. 1999) found the C-terminal region to behave essentially like an unfolded peptide anchored at one end, and NMR studies have found this region to be highly mobile in solution (Klein-Seetharaman et al. 2002; Getmanova et al. 2004). The C-terminal region up to the end of helix VIII has been implicated in interactions with the G-protein (Weiss et al. 1994; Ernst et al. 2000; Marin et al. 2000), and the ability to cross-link native residues in this region may be useful for exploring state-dependent local conformational changes.
We did not observe cross-links involving CLIII despite the presence of three lysine residues that react with NHS ester labeling reagents (Wang et al. 2004; R. Jacobsen, M. Ayson, and J. Schoeniger, unpubl.), and a single cross-link between adjacent residues in CLII. This is surprising given that some of these residues are in close proximity with other reactive residues, according to the crystal structure. Furthermore, in previous studies measuring spontaneous disulfide formation between engineered cysteines in CLII and CLIII, disulfide cross-links formed in a number of positions at or near the location of reactive residues that might be expected to cross-link in our study, for example, residues K339 and K245 (S338C and K245C in Cai et al. [1997]), or K311 and K245 (K311C and A246C in Cai et al. [2001]). There are a number of reasons why a predicted cross-link may not be observed. Although the residues in question reacted well with cysteine- and lysine-labeling reagents, they may be less accessible to bulkier cross-linking reagents. It is also possible that the kinetics of the cross-linking reaction and local steric effects favor the formation of some cross-links over others. For example, it was shown recently that rhodopsin is present in ROS membrane as ordered arrays of dimers (Fotiadis et al. 2003; Liang et al. 2003) and can be cross-linked to form dimers and oligomers using K–K and C–C cross-linkers (Jastrzebska et al. 2004). We also find that dimers and oligomers are readily formed using K–K and C–K cross-linkers (see Fig. 1), although this study was focused on the analysis of intra-molecular cross-links. It is possible that cysteine and lysine residues on peptides 87–143 and 208–253 preferentially form intermolecular attachments with other rhodopsin molecules. Indeed, Jastrzebska and coworkers (Jastrzebska et al. 2004) presented a model of oligomeric rhodopsin in which all of the reactive residues on these peptides are potential candidates for intermolecular cross-linking. However, it is difficult to draw conclusions about potential cross-links that are not observed using LC-MS-based analysis of complex samples.
It has already been demonstrated that distance constraints from cross-linking (either alone or in combination with other experimental distances) are useful for testing structural models. The implementation of structural constraints into threading and fold recognition studies has recently been reported by several groups (Young et al. 2000; Reva et al. 2002). Lengauer and coworkers (Albrecht et al. 2002; Sommer et al. 2002) demonstrated a 30% improvement in correct fold recognition rates when using cross-linking and NMR distance constraints with the 123D threading algorithm. Koster and coworkers (Back et al. 2002) have used chemical cross-linking and mass spectrometry to identify likely models for sequences with <30% homology with known structures. In the case of membrane proteins, our group has recently reported a computational technique for correctly identifying membrane-helix protein folds matching a set of distance constraints from NMR NOE, chemical cross-linking, dipolar EPR, and FRET experiments (Faulon et al. 2003). On the basis of these modeling results, it is likely that methods enabling the rapid identification of experimental distance constraints by chemical cross-linking and mass spectrometry will contribute significantly to advances in membrane protein structure determination.
Materials and methods
Materials
Frozen bovine retinas were purchased from Schenk Packing Company, Inc. Tris (2-carboxyethyl) phosphine hydrochloride (TCEP-HCl) and the cross-linking reagents, including disuccinimidyl tartarate (DST), disuccinimidyl glutarate (DSG), disuccinimidyl suberate (DSS), N-(γ-Maleimidobutyryloxy) succinimide ester (GMBS), N-[ɛ-Maleimidocaproyloxy]succinimide ester (EMCS), succinimidyl 4-[N-maleimidomethyl]cyclohexane-1-carboxy-(6-amidocaproate) (LC-SMCC), and N-Succinimidyl iodoacetate (SIA), were obtained from Pierce Biotechnology, Inc. 4-vinyl-pyridine (4-VP) and cyanogen bromide (CNBr) were purchased from Sigma-Aldrich. The detergent, n-Nonyl-β-D-glucoside, was purchased from Anatrace, Inc. N-hydroxysuccinimidyl (NHS) acetate was purchased from ICN Biomedical. Molecular weight standard was Mark 12 (Invitrogen).
ROS membrane purification
Rod outer segments (ROS) from bovine retinas were prepared under dim red light (>650 nm) as previously described (Okada et al. 1994). Briefly, ROS fragments were isolated using the sucrose flotation method (Papermaster 1982) and purified via a sucrose step gradient centrifugation. ROS membranes were washed with hypotonic buffer (10 mM HEPES, 1 mM DTT, 100 μM EDTA, and 100 μM PMSF) to remove loosely bound polypeptides and subsequently were stored in isotonic buffer (100 mM NaCl, 10 mM HEPES, 5 mM MgCl2•6H2O, 1 mM DTT, and 100 μM PMSF) at −80°C until needed.
Rhodopsin quantification
Extraction of rhodopsin from purified ROS membranes was achieved by centrifugation (16,000g, 5 min) and subsequent resuspension in 50 mM pyridine-HCl (pH 6.5) with 25 mM ZnCl2 and 0.6% n-nonyl-β-D-glucoside (Okada et al. 1998). Samples were solubilized for 30 min at room temperature, and the concentration of rhodopsin was determined based on the absorbance difference at 500 nm before and after illumination (∈ = 42,700 M−1 cm−1) (Hong and Hubbell 1972).
Cross-linking
Lysine–lysine cross-linkers were DST, DSG, and DSS; cysteine–lysine cross-linkers were SIA, GMBS, EMCS, and LC-SMCC. Stock solutions were prepared by dissolving cross-linkers in DMSO, typically at a concentration of 300 mM. Lysine–lysine cross-linking was performed on rhodopsin in purified ROS membranes (10 μM rhodopsin) in 50 mM HEPES buffer, with 100 mM NaCl (pH 7.5), containing 10- to 200-fold molar excess of cross-linker. Reactions were incubated for 30 min at 37°C and quenched with 10 mM Tris (pH 7.5), for 15 min at room temperature. Cysteine–lysine cross-linking was carried out in two steps. In the first, cysteine coupling (200-fold molar excess of cross-linker, 30 min incubation, 37°C) was favored using a low-pH buffer (50 mM pyridine, 100 mM NaCl at pH 6). The membrane was then pelleted and washed to remove unreacted cross-linker, then incubated in HEPES buffer for 1 h to facilitate the reaction of cysteine-bound cross-linker with lysine residues. Samples were quenched with 10 mM Tris-HCl (pH 7.5), and 0.01% β-mercaptoethanol (BME).
Following cross-linking, cysteine residues were reduced and alkylated in the ROS membrane. Disulfides were reduced with 50 mM tris(2-carboxyethyl)phosphine (TCEP) in 50 mM HEPES buffer, 100 mM NaCl (pH 7.5), for 30 min at 37°C. Samples were then alkylated with 90 mM 4-vinylpyridine for 30 min at room temperature and the membranes washed twice using the same buffer to remove the 4-vinylpyridine.
Monomer purification and cleavage with CNBr
Following cross-linking, monomeric rhodopsin was separated from multimeric protein and contaminants by preparative tris-glycine ALS-PAGE using a mini-prep cell (Bio-Rad) and column gel (5-cm, 11% acrylamide resolving; 4-cm, 4% stacking; 1-cm diameter). The cell was equipped with a peristaltic pump and fraction collector. Eluted protein fractions were collected and analyzed for protein content by SDS-PAGE with Coomassie staining. Fractions containing monomeric rhodopsin were pooled and concentrated using centrifugal filters (5–10K MWCO, Millipore). Purified rhodopsin was subsequently delipidated by chloroform/methanol/water (CMW) extraction (Wessel and Flugge 1984), and the resulting protein pellet was washed once with acetone without being allowed to dry completely. Failure to remove methanol by acetone wash following extraction resulted in substantial methylation of the protein during the subsequent acidic CNBr cleavage step. Rhodopsin samples were dissolved in 100% trifuoroacetic acid (TFA), diluted to 70% TFA with water, and then chemically digested with 100–200 mM CNBr (from an 8 M stock in ACN). Sample vials were flushed with nitrogen, covered with aluminum foil, and shaken overnight at room temperature. Equivalent cleavage was seen after 6 h of incubation. Digested samples were dried and washed once with ACN to remove residual CNBr. Dried samples were stored at −80°C until further analysis.
Lysine and cysteine labeling
ROS membrane was pelleted and resuspended in 50 mM pyridine buffer or 200 mM sodium phosphate buffer (pH 6 or 7), to a final rhodopsin concentration of 10 μM. For cysteine labeling, ROS membrane was incubated with up to 50–1000:1 N-ethyl maleimide:rhodopsin for 30–60 min at 37°C. For lysine labeling, ROS membrane was incubated with 50- to 200-fold molar excess of NHS-acetate for 30 min at 37°C. Reactions were quenched with 100 mM Tris (pH 7). All labeling reactions were reduced with TCEP, alkylated with 4-VP, CMW-extracted, and digested with CNBr prior to LC-MS analysis, as described above.
LC-MS
Rhodopsin CNBr digest products were dissolved in formic acid, diluted with an equal volume of ACN, and then water to a final ratio of 10:10:80 by volume. The typical concentration, based on quantification before CMW extraction, was estimated to be ∼0.5–1 mg/mL. A portion (5–8 μL) was loaded onto a PLRP/S column (5-μm particle size, 300-Å pore size, 0.2 × 150-mm, Michrom Bioresources) and separated using buffer and gradient conditions as follows: buffer A, 5% acetic acid, 2.5% ACN, and 2.5% isopropanol; buffer B, 4% acetic acid, 40% ACN, and 50% isopropanol; gradient (in % B buffer), 0 for 1 min, 0%–15% in 4 min, 15–60 in 30 min, 60–100 in 15 min; flow rate, 5 μL/min. All chromatographic separations were performed at 25°C using an Agilent 1100 capillary HPLC system (Agilent Technologies). The column was connected directly to the mass spectrometer with no split.
Mass spectrometry was performed using an APEX II FTMS equipped with a 7.0 T superconducting magnet and an Apollo ESI ion source (Bruker Daltonics), upgraded with a mass selective quadrupole front end. Mass spectra were obtained by accumulating ions in the ESI source hexapole and running the quadrupole mass filter in non mass-selective RF-only mode so that ions of a broad m/z range (300–2000) were passed to the FTMS analyzer cell. All spectra were acquired in positive ion mode.
Preparative liquid chromatography and MS/MS
Preparative LC separation was performed on a Hewlett Packard 1100 series instrument. Samples were purified using a Michrom PLRP-S column (5-μm, 300-Å, 2.0 × 150-mm) at 30°C. The gradient was (in % B buffer, see LC-MS section for description of buffers): 0–20 in 5 min, 20–70 in 50 min, 70–100 in 10 min, flow rate 0.25–0.3 mL/min, absorbance 280 nm. A typical prep used 200–400 μg of rhodopsin in ROS, based on quantification before the cross-linking reaction. Dried CNBr digest products were dissolved with formic acid and diluted to 10% with buffer A (final volume ≤400 μL) before being loaded onto the column. Effluent fractions were collected using a Bio-Rad 2110 fraction collector, and their mass spectra were analyzed by direction infusion on an ESI-Q-Tof mass spectrometer (Micromass Ultima API, Waters) to identify fractions containing the desired cross-linked species. MS/MS analysis was performed on purified cross-linked peptides by either ECD using an FT-ICR instrument (Apex II, Bruker Daltonics) or CID using a Q-Tof instrument (Micromass Ultima, Waters). The ECD experiments have been detailed in a separate report (Novak et al. 2005). For CID MS/MS using a Q-Tof instrument, fractions from preparative LC were directly infused at 0.7–1 μL/min and the most abundant charge state of target cross-linked peptides fragmented over a wide range of collision energies (16–65 eV, depending on the charge state, size, and fragmentation characteristics of the parent ion). Scans of 1-sec duration were collected and averaged over acquisition times of up to 30 min in the case of low-abundance cross-links. Examples of Q-Tof CID spectra are shown in Figure 4. The largest cross-linked peptides and cross-links containing peptide 50–86 were most effectively analyzed by ECD using FTMS because of the high resolution necessary to resolve complex mixtures of large fragments and the difficulty of fragmenting between two adjacent lysine residues in peptide 50–86. Those cross-links that were resolved by ECD are indicated in Tables 1 and 2.
Data analysis
A macro for data reduction of LC-MS files was developed in our laboratory and implemented within the Xmass software package (Bruker Daltonics) as described previously (Kruppa et al. 2003). Output files of monoisotopic masses were matched to a theoretical library of cross-linked, modified, and/or unmodified proteolysis products generated by the program ASAP (Automated Spectrum Assignment Program), described previously (Young et al. 2000).
Tandem MS data were analyzed using the in-house program MS2Links, an updated software version of MS2Assign described previously (Schilling et al. 2003). MS2Assign and MS2Links were developed for the assignment of tandem mass spectra of cross-linked, labeled, and/or unmodified peptides on the same principle as ASAP. Web-based versions of ASAP and MS2Assign are available at http://roswell.ca.sandia.gov/∼mmyoung.
Cross-linker length calculations
Minimum and maximum cross-linker lengths were determined for cysteine–lysine cross-linkers by searching their available conformations using a stochastic dynamics simulation procedure as outlined in Green et al. (2001). These simulations were performed using the MacroModel molecular mechanics package and the AMBER* force field as implemented in MacroModel (Mohamadi et al. 1990). Cross-linker structures were built in MacroModel using the molecular building tools in the Maestro graphical user interface. The conformational search procedure consisted of first energy minimizing the cross-linker using 500 steps of conjugate gradient minimization, then equilibrating the system for 50 psec before performing stochastic dynamics for either 5 nsec for the shorter cross-linkers (SIA and GMBS) or 10 nsec for the longer cross-linkers (EMCS and LC-SMCC). All simulations were performed at 300 K using a generalized Born/solvent accessible (GB/SA) water solvation model. The minimum and maximum cross-linker length was determined from the set of structures that were saved every 1 psec.
Energy minimization of rhodopsin crystal structure
The A chain of the bovine rhodopsin crystal structure (1F88.pdb) was used as the starting structure for all comparisons to experimental distances. Missing atoms were modeled using the internal coordinates tables in the CHARMM22 topology definitions file. Energy calculations were performed using the CHARMM22 all atom force field (Brooks et al. 1983; MacKerell et al. 1998). Both the CHARMM and NAMD (Kalé et al. 1999) molecular mechanics packages were used for energy minimization and conformational search.
Molecular dynamics trajectory
Paul Crozier kindly provided the results of a 40-nsec molecular dynamics simulation of dark-adapted rhodopsin in an explicit lipid bilayer (Crozier et al. 2003). We sampled this MD trajectory every 20 psec to produce a more manageable trajectory of 2000 structures from which structural data were extracted.
Conformational search
Conformational searching of side chains was performed using a Monte Carlo sampling procedure in which 1-psec bursts of high-temperature molecular dynamics were used to randomize side-chain orientations. Each 1-psec burst of MD was followed by energy minimization using the conjugate gradients algorithm to relax the structure into the nearest local minimum. Monte Carlo sampling was performed at both 500°K and 750°K, and 1000 structures were generated at each temperature. In order to determine whether side-chain reorientations were sufficient to account for the experimental cross-links, conformational searches were done with the protein backbone fixed in space.
Constrained minimization
Constraints between cross-linked atoms were added to the CHARMM energy function using the NOE constraints function built into CHARMM, which models distance constraints as a soft square well potential:
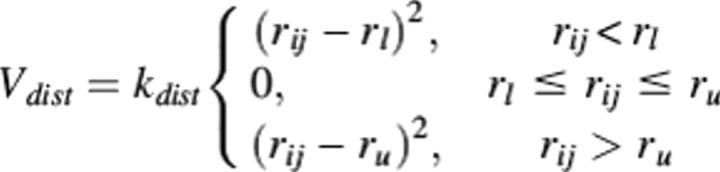 |
where rij is the distance between atom i and atom j, rl and ru are the lower and upper bounds on the distance, respectively, and kdist is a force constant, which was set to 10 kcal/mol Å2. The well width was defined with an upper bound on the cross-linker length as described earlier. The lower bound was set equal to the sum of the van der Waals radii of the two cross-linked atoms.
Constrained energy minimization was performed in three steps. In the first step, the structure was minimized with the distance constraint active and all non-bond interactions turned off. This allowed the side chains to move freely within the structure to satisfy the distance constraint. In step two, non-bond interactions were turned on and the structure minimized to relieve bad contacts generated by the first minimization. In the final minimization, the distance constraint was turned off to allow complete relaxation of the side chains in their new environment, resulting in rhodopsin structures at new local energy minima.
Solvent accessibility
The COOR SURF command in CHARMM was used to compute the solvent accessible surface area (SAS) of rhodopsin for each 20-psec time step of the molecular dynamics trajectory. The COOR SURF command in CHARMM computes the SAS using the Lee and Richards methods (Lee and Richards 1971). A probe radius of 1.4 Å was used for all SAS calculations.
Acknowledgments
We thank Helgi Adalsteinsson for helpful discussions and assistance in calculating the maximum cross-linker lengths. This work was supported by the Laboratory Directed Research and Development program at Sandia National Laboratories, which is a multiprogram laboratory operated by Sandia Corp., a Lockheed Martin company, for the United States Department of Energy under contract no. DE-AC04-94AL85000.
Footnotes
Reprint requests to: Joseph S. Schoeniger, Sandia National Laboratory, 7111 East Avenue, Building 929, MS 9292, Livermore, CA 94550, USA; e-mail: jsschoe@sandia.gov; fax: (925) 294-3020.
Article and publication are at http://www.proteinscience.org/cgi/doi/10.1110/ps.052040406.
Abbreviations: MS, mass spectrometry; FT-ICR, fourier transform infrared coupled resonance; Q-Tof, quadrapole time-of-flight; LC-MS, liquid chromatography—mass spectrometry; MS/MS, tandem mass spectrometry; CID, collision-induced dissociation; ECD, electron capture dissociation; ROS, rod outer segment; HPLC, high-pressure liquid chromatography; DCA, distance of closest approach; CNBr, cyanogen bromide; TFA, trifuoroacetic acid; ACN, acetonitrile; TCEP, tris (2-carboxyethyl) phosphine; NHS, N-hydroxysuccinimide; NEM, N-ethylmaleimide; MD, molecular dynamics; ALS, ammonium lauryl sulfate; BME, β-mercaptoethanol; 4-VP, 4-vinylpyridine; DTT, dithiothreitol; DMSO, dimethyl sulfoxide; DST, disuccinimidyl tartarate; DSG, disuccinimidyl glutarate; DSS, disuccinimidyl suberate; GMBS, N-(γ-Maleimidobutyryloxy) succinimide ester; EMCS, N-[ɛ-Maleimidocaproyloxy]succinimide ester; LC-SMCC, succinimidyl 4-[N-maleimidomethyl]cyclohexane-1-carboxy-(6-amidocaproate); SIA, N-Succinimidyl iodoacetate.
References
- Albrecht M., Hanisch D., Zimmer R., Lengauer T. 2002. Improving fold recognition of protein threading by experimental distance constraints In Silico Biol. 2 325–337. [PubMed] [Google Scholar]
- Back J.W., Sanz M.A., De Jong L., De Koning L.J., Nijtmans L.G., De Koster C.G., Grivell L.A., Van Der Spek H., Muijsers A.O. 2002. A structure for the yeast prohibitin complex: Structure prediction and evidence from chemical crosslinking and mass spectrometry Protein Sci. 11 2471–2478. [DOI] [PMC free article] [PubMed] [Google Scholar]
- Ball L.E., Oatis J.E. Jr., Dharmasiri K., Busman M., Wang J., Cowden L.B., Galijatovic A., Chen N., Crouch R.K., Knapp D.R. 1998. Mass spectrometric analysis of integral membrane proteins: Application to complete mapping of bacteriorhodopsins and rhodopsin Protein Sci. 7 758–764. [DOI] [PMC free article] [PubMed] [Google Scholar]
- Barnidge D.R., Dratz E.A., Sunner J., Jesaitis A.J. 1997. Identification of transmembrane tryptic peptides of rhodopsin using matrix-assisted laser desorption/ionization time-of-flight mass spectrometry Protein Sci. 6 816–824. [DOI] [PMC free article] [PubMed] [Google Scholar]
- Blaustein R.O., Cole P.A., Williams C., Miller C. 2000. Tethered blockers as molecular “tape measures” for a voltage-gated K+ channel Nat. Struct. Biol. 7 309–311. [DOI] [PubMed] [Google Scholar]
- Brooks B.R., Bruccoleri R.E., Olafson B.D., States D.J., Swaminathan S., Karplus M. 1983. CHARMM: A program for macromolecular energy, minimization, and dynamics calculations J. Comput. Chem. 4 187–217. [Google Scholar]
- Cai K., Langen R., Hubbell W.L., Khorana H.G. 1997. Structure and function in rhodopsin: Topology of the C-terminal polypeptide chain in relation to the cytoplasmic loops Proc. Natl. Acad. Sci. 94 14267–14272. [DOI] [PMC free article] [PubMed] [Google Scholar]
- Cai K., Klein-Seetharaman J., Altenbach C., Hubbell W.L., Khorana H.G. 2001. Probing the dark state tertiary structure in the cytoplasmic domain of rhodopsin: Proximities between amino acids deduced from spontaneous disulfide bond formation between cysteine pairs engineered in cytoplasmic loops 1, 3, and 4 Biochemistry (Mosc.) 40 12479–12485. [DOI] [PubMed] [Google Scholar]
- Collins C.J., Schilling B., Young M., Dollinger G., Guy R.K. 2003. Isotopically labeled crosslinking reagents: Resolution of mass degeneracy in the identification of crosslinked peptides Bioorg. Med. Chem. Lett. 13 4023–4026. [DOI] [PubMed] [Google Scholar]
- Crozier P.S., Stevens M.J., Forrest L.R., Woolf T.B. 2003. Molecular dynamics simulation of dark-adapted rhodopsin in an explicit membrane bilayer: Coupling between local retinal and larger scale conformational change J. Mol. Biol. 333 493–514. [DOI] [PubMed] [Google Scholar]
- Davidson W.S. and Hilliard G.M. 2003. The spatial organization of apolipoprotein A-I on the edge of discoidal high density lipoprotein particles: A mass spectrometry study J. Biol. Chem. 278 27199–27207. [DOI] [PubMed] [Google Scholar]
- Ernst O.P., Meyer C.K., Marin E.P., Henklein P., Fu W.Y., Sakmar T.P., Hofmann K.P. 2000. Mutation of the fourth cytoplasmic loop of rhodopsin affects binding of transducin and peptides derived from the carboxyl-terminal sequences of transducin α and γ subunits J. Biol. Chem. 275 1937–1943. [DOI] [PubMed] [Google Scholar]
- Farrens D.L., Altenbach C., Yang K., Hubbell W.L., Khorana H.G. 1996. Requirement of rigid-body motion of transmembrane helices for light activation of rhodopsin Science 274 768–770. [DOI] [PubMed] [Google Scholar]
- Faulon J.L., Sale K., Young M. 2003. Exploring the conformational space of membrane protein folds matching distance constraints Protein Sci. 12 1750–1761. [DOI] [PMC free article] [PubMed] [Google Scholar]
- Findlay J.B., Barclay P.L., Brett M., Davison M., Pappin D.J., Thompson P. 1984. The structure of mammalian rod opsins Vision Res. 24 1501–1508. [DOI] [PubMed] [Google Scholar]
- Fotiadis D., Liang Y., Filipek S., Saperstein D.A., Engel A., Palczewski K. 2003. Atomic-force microscopy: Rhodopsin dimers in native disc membranes Nature 421 127–128. [DOI] [PubMed] [Google Scholar]
- Getmanova E., Patel A.B., Klein-Seetharaman J., Loewen M.C., Reeves P.J., Friedman N., Sheves M., Smith S.O., Khorana H.G. 2004. NMR spectroscopy of phosphorylated wild-type rhodopsin: Mobility of the phosphorylated C-terminus of rhodopsin in the dark and upon light activation Biochemistry (Mosc.) 43 1126–1133. [DOI] [PubMed] [Google Scholar]
- Green N.S., Reisler E., Houk K.N. 2001. Quantitative evaluation of the lengths of homobifunctional protein cross-linking reagents used as molecular rulers Protein Sci. 10 1293–1304. [DOI] [PMC free article] [PubMed] [Google Scholar]
- Hong K. and Hubbell W.L. 1972. Preparation and properties of phospholipid bilayers containing rhodopsin Proc. Natl. Acad. Sci. 69 2617–2621. [DOI] [PMC free article] [PubMed] [Google Scholar]
- Huang B.X., Kim H.Y., Dass C. 2004. Probing three-dimensional structure of bovine serum albumin by chemical cross-linking and mass spectrometry J. Am. Soc. Mass Spectrom. 15 1237–1247. [DOI] [PubMed] [Google Scholar]
- Hubbell W.L., Altenbach C., Hubbell C.M., Khorana H.G. 2003. Rhodopsin structure, dynamics, and activation: A perspective from crystallography, site-directed spin labeling, sulfhydryl reactivity, and disulfide cross-linking Adv. Protein Chem. 63 243–290. [DOI] [PubMed] [Google Scholar]
- Jastrzebska B., Maeda T., Zhu L., Fotiadis D., Filipek S., Engel A., Stenkamp R.E., Palczewski K. 2004. Functional characterization of rhodopsin monomers and dimers in detergents J. Biol. Chem. 279 54663–54675. [DOI] [PMC free article] [PubMed] [Google Scholar]
- Kalé L., Skeel R., Bhandarkar M., Brunner R., Gursoy A., Krawetz N., Phillips J., Shinozaki A., Varadarajan K., Schulten K. 1999. NAMD2: Greater scalability for parallel molecular dynamics J. Comput. Phys. 151 283–312. [Google Scholar]
- Klein-Seetharaman J. 2002. Dynamics in rhodopsin ChemBioChem 3 981–986. [DOI] [PubMed] [Google Scholar]
- Klein-Seetharaman J., Hwa J., Cai K., Altenbach C., Hubbell W.L., Khorana H.G. 2001. Probing the dark state tertiary structure in the cytoplasmic domain of rhodopsin: Proximities between amino acids deduced from spontaneous disulfide bond formation between Cys316 and engineered cysteines in cytoplasmic loop 1 Biochemistry (Mosc.) 40 12472–12478. [DOI] [PubMed] [Google Scholar]
- Klein-Seetharaman J., Reeves P.J., Loewen M.C., Getmanova E.V., Chung J., Schwalbe H., Wright P.E., Khorana H.G. 2002. Solution NMR spectroscopy of [α-15N]lysine-labeled rhodopsin: The single peak observed in both conventional and TROSY-type HSQC spectra is ascribed to Lys-339 in the carboxyl-terminal peptide sequence Proc. Natl. Acad. Sci. 99 3452–3457. [DOI] [PMC free article] [PubMed] [Google Scholar]
- Knapp D.R., Crouch R.K., Ball L.E., Gelasco A.K., Ablonczy Z. 2002. Mass spectrometric analysis of G protein-coupled receptors Methods Enzymol. 343 157–161. [DOI] [PubMed] [Google Scholar]
- Kraft P., Mills J., Dratz E. 2001. Mass spectrometric analysis of cyanogen bromide fragments of integral membrane proteins at the picomole level: Application to rhodopsin Anal. Biochem. 292 76–86. [DOI] [PubMed] [Google Scholar]
- Kruppa G.H., Schoeniger J., Young M.M. 2003. A top down approach to protein structural studies using chemical cross-linking and Fourier transform mass spectrometry Rapid Commun. Mass Spectrom. 17 155–162. [DOI] [PubMed] [Google Scholar]
- Langen R., Cai K., Altenbach C., Khorana H.G., Hubbell W.L. 1999. Structural features of the C-terminal domain of bovine rhodopsin: A site-directed spin-labeling study Biochemistry (Mosc.) 38 7918–7924. [DOI] [PubMed] [Google Scholar]
- Lee B. and Richards F.M. 1971. The interpretation of protein structures: Estimation of static accessibility J. Mol. Biol. 55 379–400. [DOI] [PubMed] [Google Scholar]
- Li J., Edwards P.C., Burghammer M., Villa C., Schertler G.F. 2004. Structure of bovine rhodopsin in a trigonal crystal form J. Mol. Biol. 343 1409–1438. [DOI] [PubMed] [Google Scholar]
- Liang Y., Fotiadis D., Filipek S., Saperstein D.A., Palczewski K., Engel A. 2003. Organization of the G protein-coupled receptors rhodopsin and opsin in native membranes J. Biol. Chem. 278 21655–21662. [DOI] [PMC free article] [PubMed] [Google Scholar]
- MacKerell A.D.J., Brooks B.R., Brooks III C.L., Nilsson L., Roux B., Won Y., Karplus M. 1998. CHARMM: The energy function and its parameterization with an overview of the program In The encyclopedia of computational chemistry (eds. P.V.R. Shleyer M.et al.) . pp. 271–277. John Wiley & Sons, Chichester, UK.
- Marin E.P., Krishna A.G., Zvyaga T.A., Isele J., Siebert F., Sakmar T.P. 2000. The amino terminus of the fourth cytoplasmic loop of rhodopsin modulates rhodopsin-transducin interaction J. Biol. Chem. 275 1930–1936. [DOI] [PubMed] [Google Scholar]
- Mohamadi F., Richards N.G., Guida W.C., Liskamp R., Lipton M., Caufield C., Chang G., Hendrickson T. 1990. MacroModel—An integrated software system for modeling organic and bioorganic molecules using molecular mechanics J. Comput. Chem. 11 440–467. [Google Scholar]
- Muller D.R., Schindler P., Towbin H., Wirth U., Voshol H., Hoving S., Steinmetz M.O. 2001. Isotope-tagged cross-linking reagents. A new tool in mass spectrometric protein interaction analysis Anal. Chem. 73 1927–1934. [DOI] [PubMed] [Google Scholar]
- Nakanishi K., Zhang H., Lerro K.A., Takekuma S., Yamamoto T., Lien T.H., Sastry L., Baek D.J., Moquin-Pattey C., Boehm M.F.et al. 1995. Photoaffinity labeling of rhodopsin and bacteriorhodopsin Biophys. Chem. 56 13–22. [DOI] [PubMed] [Google Scholar]
- Nakayama T.A. and Khorana H.G. 1990. Orientation of retinal in bovine rhodopsin determined by cross-linking using a photoactivatable analog of 11-cis-retinal J. Biol. Chem. 265 15762–15769. [PubMed] [Google Scholar]
- Novak P., Young M.M., Schoeniger J.S., Kruppa G.H. 2003. A top-down approach to protein structure studies using chemical cross-linking and Fourier transform mass spectrometry Eur. J. Mass Spectrom. (Chichester, Eng) 9 623–631. [DOI] [PubMed] [Google Scholar]
- Novak P., Haskins W.E., Ayson M.J., Jacobsen R.B., Schoeniger J.S., Leavell M.D., Young M.M., Kruppa G.H. 2005. Unambiguous assignment of intramolecular chemical cross-links in modified mammalian membrane proteins by Fourier transform-tandem mass spectrometry Anal. Chem. 77 5101–5106. [DOI] [PubMed] [Google Scholar]
- Okada T., Matsuda T., Kandori H., Fukada Y., Yoshizawa T., Shichida Y. 1994. Circular dichroism of metaiodopsin II and its binding to transducin: A comparative study between meta II intermediates of iodopsin and rhodopsin Biochemistry (Mosc.) 33 4940–4946. [DOI] [PubMed] [Google Scholar]
- Okada T., Takeda K., Kouyama T. 1998. Highly selective separation of rhodopsin from bovine rod outer segment membranes using combination of divalent cation and alkyl(thio)glucoside Photochem. Photobiol. 67 495–499. [PubMed] [Google Scholar]
- Okada T., Fujiyoshi Y., Silow M., Navarro J., Landau E.M., Shichida Y. 2002. Functional role of internal water molecules in rhodopsin revealed by X-ray crystallography Proc. Natl. Acad. Sci. 99 5982–5987. [DOI] [PMC free article] [PubMed] [Google Scholar]
- Palczewski K., Kumasaka T., Hori T., Behnke C.A., Motoshima H., Fox B.A., Le Trong I., Teller D.C., Okada T., Stenkamp R.E.et al. 2000. Crystal structure of rhodopsin: A G protein-coupled receptor Science 289 739–745. [DOI] [PubMed] [Google Scholar]
- Papermaster D.S. 1982. Preparation of retinal rod outer segments Methods Enzymol. 81 48–52. [DOI] [PubMed] [Google Scholar]
- Resek J.F., Farahbakhsh Z.T., Hubbell W.L., Khorana H.G. 1993. Formation of the meta II photointermediate is accompanied by conformational changes in the cytoplasmic surface of rhodopsin Biochemistry (Mosc.) 32 12025–12032. [DOI] [PubMed] [Google Scholar]
- Reva B., Finkelstein A., Topiol S. 2002. Threading with chemostructural restrictions method for predicting fold and functionally significant residues: Application to dipeptidylpeptidase IV (DPP-IV) Proteins 47 180–193. [DOI] [PubMed] [Google Scholar]
- Sachs K., Maretzki D., Meyer C.K., Hofmann K.P. 2000. Diffusible ligand all-trans-retinal activates opsin via a palmitoylation-dependent mechanism J. Biol. Chem. 275 6189–6194. [DOI] [PubMed] [Google Scholar]
- Schilling B., Row R.H., Gibson B.W., Guo X., Young M.M. 2003. MS2Assign, automated assignment and nomenclature of tandem mass spectra of chemically crosslinked peptides J. Am. Soc. Mass Spectrom. 14 834–850. [DOI] [PubMed] [Google Scholar]
- Sheikh S.P., Zvyaga T.A., Lichtarge O., Sakmar T.P., Bourne H.R. 1996. Rhodopsin activation blocked by metal-ion-binding sites linking transmembrane helices C and F Nature 383 347–350. [DOI] [PubMed] [Google Scholar]
- Silva R.A., Hilliard G.M., Fang J., Macha S., Davidson W.S. 2005. A three-dimensional molecular model of lipid-free apolipoprotein A-I determined by cross-linking/mass spectrometry and sequence threading Biochemistry (Mosc.) 44 2759–2769. [DOI] [PubMed] [Google Scholar]
- Sommer I., Zien A., von Ohsen N., Zimmer R., Lengauer T. 2002. Confidence measures for protein fold recognition Bioinformatics 18 802–812. [DOI] [PubMed] [Google Scholar]
- Wang X., Kim S.H., Ablonczy Z., Crouch R.K., Knapp D.R. 2004. Probing rhodopsin-transducin interactions by surface modification and mass spectrometry Biochemistry (Mosc.) 43 11153–11162. [DOI] [PubMed] [Google Scholar]
- Weiss E.R., Osawa S., Shi W., Dickerson C.D. 1994. Effects of carboxyl-terminal truncation on the stability and G protein-coupling activity of bovine rhodopsin Biochemistry (Mosc.) 33 7587–7593. [DOI] [PubMed] [Google Scholar]
- Wessel D. and Flugge U.I. 1984. A method for the quantitative recovery of protein in dilute solution in the presence of detergents and lipids Anal. Biochem. 138 141–143. [DOI] [PubMed] [Google Scholar]
- White S.H. 2004. The progress of membrane protein structure determination Protein Sci. 13 1948–1949. [DOI] [PMC free article] [PubMed] [Google Scholar]
- Wu J. and Kaback H.R. 1996. A general method for determining helix packing in membrane proteins in situ: Helices I and II are close to helix VII in the lactose permease of Escherichia coli Proc. Natl. Acad. Sci. 93 14498–14502. [DOI] [PMC free article] [PubMed] [Google Scholar]
- Young M.M., Tang N., Hempel J.C., Oshiro C.M., Taylor E.W., Kuntz I.D., Gibson B.W., Dollinger G. 2000. High-throughput protein fold identification by using experimental constraints derived from intramolecular cross-links and mass spectrometry Proc. Natl. Acad. Sci. 97 5802–5806. [DOI] [PMC free article] [PubMed] [Google Scholar]
- Yu H., Kono M., McKee T., Oprian D. 1995. A general method for mapping tertiary contacts between amino-acid residues in membrane-embedded proteins Biochemistry (Mosc.) 34 14963–14969. [DOI] [PubMed] [Google Scholar]