

Abstract
Reliable prediction of model accuracy is an important unsolved problem in protein structure modeling. To address this problem, we studied 24 individual assessment scores, including physics-based energy functions, statistical potentials, and machine learning–based scoring functions. Individual scores were also used to construct ∼85,000 composite scoring functions using support vector machine (SVM) regression. The scores were tested for their abilities to identify the most native-like models from a set of 6000 comparative models of 20 representative protein structures. Each of the 20 targets was modeled using a template of <30% sequence identity, corresponding to challenging comparative modeling cases. The best SVM score outperformed all individual scores by decreasing the average RMSD difference between the model identified as the best of the set and the model with the lowest RMSD (ΔRMSD) from 0.63 Å to 0.45 Å, while having a higher Pearson correlation coefficient to RMSD (r = 0.87) than any other tested score. The most accurate score is based on a combination of the DOPE non-hydrogen atom statistical potential; surface, contact, and combined statistical potentials from MODPIPE; and two PSIPRED/DSSP scores. It was implemented in the SVMod program, which can now be applied to select the final model in various modeling problems, including fold assignment, target–template alignment, and loop modeling.
Keywords: model assessment, comparative modeling, fold assignment, statistical potentials, support vector machine, protein structure prediction
Genomics efforts are providing researchers with the genomes of many species, including Homo sapiens. More difficult tasks lie ahead in annotating, understanding, and modifying the functions of the proteins encoded by these genomes. The structures of proteins aid in these efforts, as the biochemical function of a protein is determined by its structure and dynamics. Atomic structures can be determined for a small subset of proteins by X-ray crystallography and nuclear magnetic resonance (NMR) spectroscopy. However, for many proteins of interest, such methods are often costly, time-consuming, and challenging. In the absence of an experimentally determined structure, structure models are often valuable for rationalizing existing evidence and guiding new experiments (Baker and Sali 2001).
The accuracy of a model determines its utility, making a means of reliably determining the accuracy of a model an important problem in protein structure prediction (Baker and Sali 2001; Ginalski et al. 2005). Model assessment has been previously applied to (1) determine whether or not a model has the correct fold (Miyazawa and Jernigan 1996; Domingues et al. 1999; Melo et al. 2002; McGuffin and Jones 2003), (2) discriminate between the native and near-native states (Lazaridis and Karplus 1999a; Gatchell et al. 2000; Vorobjev and Hermans 2001; Seok et al. 2003; Tsai et al. 2003; Zhu et al. 2003), and (3) select the most native-like model in a set of decoys that does not contain the native structure (Shortle et al. 1998; Wallner and Elofsson 2003). Several scoring schemes have been developed for these tasks, including (1) physics-based energies, (2) statistical potentials, and (3) machine-learning-based scores. Molecular mechanics energy functions with solvation models are the usual components of physics-based energies, examples of which include Effective Energy Function 1 (EEF1) (Lazaridis and Karplus 1999a) and Generalized Born (GB) potentials (Still et al. 1990). In contrast, statistical potentials are derived from known protein structures and quantify the observed conformational preferences of residue or atom types in proteins (Sippl 1995). Examples of statistical potentials include ProsaII (Sippl 1993a, b), ANOLEA (Melo and Feytmans 1997, 1998), and DFIRE (Zhou and Zhou 2002; Zhang et al. 2004). Finally, machine learning–based methods combine scores from physics-based energies and statistical potentials, including the GA341 score obtained with a genetic algorithm (F. Melo and A. Sali, in prep.), and the ProQ (Wallner and Elofsson 2003) and GenThreader (Jones 1999a) scores derived with neural networks.
In this paper, we aim to select the most accurate protein structure model from among a set of alternate conformations or decoys. To achieve this goal, we adopted 24 individual assessment scores, including physics-based energy functions, statistical potentials, and machine learning–based scoring functions. Because the combination of assessment scores has been shown to increase the ability to discriminate incorrect models from correct models (Melo et al. 2002; Wallner and Elofsson 2003), we combined the individual scores into a composite score using a support vector machine (SVM) algorithm and a training set of models.
Support vector machines are universal approximators that learn a variety of representations from training samples, and as such, are applicable to classification and regression tasks (Vapnik 1995). SVMs have been used in biological problems including fold recognition (Ding and Dubchak 2001), functional annotation of single nucleotide polymorphisms (Karchin et al. 2005), prediction of β-turns (Cai et al. 2003b), protein function classification (Cai et al. 2003a), prediction of central nervous system permeability to drug molecules (Doniger et al. 2002), analysis of pharmaceutical quantitative structure–activity relationships (Burbidge et al. 2001), identification of protein–protein interactions (Bock and Gough 2001), and protein secondary structure prediction (Ward et al. 2003). In this work, several SVMs were trained in the regression mode with individual scores from physics-based energies, statistical potentials, and machine-learning-based scoring functions as inputs. The output of the SVMs is a score that predicts the actual RMSD between the model and its native structure. A jackknife protocol was used to identify the best combination of the individual scores and training parameters, which were then implemented in the SVMod program.
We begin by assessing the accuracy of each individual scoring method as applied to our testing set and the comparative performance gain by the SVM-derived score (Results). Then we discuss the implications of the results for protein structure prediction (Discussion). Details describing the training and testing sets used, the individual evaluated scoring functions, the testing criteria, and the generation of the SVMs are provided (Materials and Methods).
Results
Testing of 24 assessment scores with the MOULDER decoys
The 24 individual assessment scores were tested for how many times each score obtains the best or equal to the best Δnative overlap (ΔNO) and ΔRMSD (see Materials and Methods). The DFIRE and DOPEAA scores were most frequently the best single scores at discriminating the most native-like models from others as judged by ΔRMSD, obtaining the best or equal to the best ΔRMSD ∼25% of the time (Table 1). PROSACOMB, PSIPREDWEIGHT, MODPIPECOMB, and MODCHECK obtained the best ΔRMSD 23%, 23%, 21%, and 20% of the time, respectively. The PSIPREDWEIGHT score at 0.63 Å obtained the absolute lowest average ΔRMSD. Similar results were obtained by ROSETTA at 0.71 Å, PSIPREDPERCENT at 0.75 Å, DOPEAA at 0.77 Å, MODCHECK at 0.83 Å, and MODPIPECOMB at 0.87 Å. Of the 24 scores, a total of 11 had an average accuracy under 1.0 Å ΔRMSD (Table 1; Supplemental Table S1a).
Table 1.
Accuracy of the individual assessment scores on the MOULDER testing set

Using as a criterion the ΔNO, the PSIPREDWEIGHT, DOPEAA, and DFIRE scores were the most accurate assessment scores, obtaining the best or equal to the best ΔNO 28%, 27%, and 26% of the time, respectively (Table 1). PROSACOMB, MODPIPECOMB, ROSETTA, PSIPREDPERCENT, and MODCHECK obtained the best ΔNO 25%, 25%, 25%, 23%, and 22% of the time, respectively. The PSIPREDWEIGHT and ROSETTA scores at 6.7% obtained the absolute lowest average ΔNO. Similar results were obtained by DOPEAA at 6.9%, DFIRE at 7.1%, MODPIPECOMB at 7.4%, and GA341 at 7.5%. Of the 24 scores, a total of 12 had an average accuracy <10.0% ΔNO (Table 1; Supplemental Table S1b).
The ability of the tested methods to identify native-like models greatly varied across different targets (Supplemental Table S1). Thus, the particularities of the MOULDER test set, and not only the assessment scores, may have contributed to some of the observed high ΔRMSD and ΔNO values. In particular, all assessment methods averaged worse than 1.25 Å ΔRMSD in the assessment of the 1cewI models. Most of the models for this relatively short, monomeric target (108 residues) contain a poorly modeled long loop region (∼17 residues) that largely contributed to the overall global RMSD value. Therefore, models with similarly accurate cores may differ solely in this loop. Another example in which most methods underperformed is the target 1lgaA (average ΔRMSD > 0.5 Å), which exists as a homodimer in the crystal structure. The single chain crystal structure contains a loop of ∼11 residues that points directly into the solvent. In comparison to 1cewI, the overall contribution of this loop to the global RMSD of a model is reduced because of the larger size of the protein (279 residues). In contrast, sets 1bbhA and 1eaf_ had at least one score with high accuracy, resulting in an average ΔRMSD value of <0.1 Å.
Despite the differences in performance for each target, an average ΔRMSD under 0.05 Å and an average ΔNO score of 0.4% can be achieved by selecting the model based on the most accurate method for each target. This result indicates that at least one of the 24 tested scoring methods was able to identify a model close to the best model for all targets in the set (Supplemental Table S1).
A Student's t-test to assess the significance of the difference between two methods (Marti-Renom et al. 2002) indicates that nine assessment scores (PSIPREDWEIGHT, ROSETTA, PSIPREDPERCENT, DOPEAA, DFIRE, MODCHECK, MODPIPEGA, MODPIPECOMB, and PROSACOMB) outperformed all other methods with statistical significance at the 95% confidence level (Fig. 1). Despite being ranked lower than 17 other scores, the Xd score was not shown to be statistically worse or better than the other assessment scores due to a very high standard deviation of the ΔRMSD.
Figure 1.

Comparison of accuracies (ΔRMSD) of the individual assessment scores. (Upper diagonal) Gray and white squares indicate pairs of methods whose performance are and are not statistically significantly different at the confidence level of 95%, respectively. (Lower diagonal) The intensity of gray is proportional to the ΔRMSD between the compared methods.
Testing of the composite SVM score with the MOULDER decoys
Eleven scores (PSIPREDWEIGHT, ROSETTA, PSIPREDPERCENT, DOPEAA, DFIRE, MODCHECK, GA341, MODPIPECOMB, MODPIPEPAIR, MODPIPESURF, and Xd) were used as inputs to train SVMs using the jackknife protocol (see Materials and Methods). Though the list was biased to include the best scores, we did not simply select the top 11 ranked individual scores. Some scores were omitted because their performances correlated with other scores (e.g., PROSACOMB and MODPIPECOMB, and DOPEAA and DOPEBB have correlation coefficients of 0.95 and 0.90, respectively) (Fig. 2; Supplemental Table S3). However, DOPEAA and DFIRE were both included, in spite of a very high correlation coefficient (0.98), as they were among the very best individual scores tested. It was our hope that the combination of these two scores, which use different reference states and were trained using different decoy sets and parameters, could have a synergistic effect. The CHARMM EEF1 and GB scores were omitted due to their sensitivity on the model coordinates (Lazaridis and Karplus 2000) and the corresponding strong dependence on the model minimization protocol preceding the assessment (Discussion). Finally, despite being ranked lower than FRST, Xd was selected because it could not be statistically distinguished from the best-performing methods (Fig. 1).
Figure 2.

Weighted pair-group average clustering based on a pairwise correlation distance matrix. The image was generated by the Phylodendron Web server (http://iubio.bio.indiana.edu/treeapp/). Their physical distance represents the difference in the pairwise correlation between any two methods, with one distance unit corresponding to a difference of 0.1 from perfect correlation (r = 1.0).
Of the ∼85,000 SVMs tested with different feature inputs, kernel types, and training values, the best performing class combined PSIPREDPERCENT, DOPEAA, MODPIPECOMB, MODPIPEPAIR, MODPIPESURF, and PSIPREDWEIGHT as feature inputs with a linear kernel, default C-value, and a W-value of 0.1. The SVM method searches for a linear combination of the individual scores by optimizing the approximation of the RMSD error of the model:
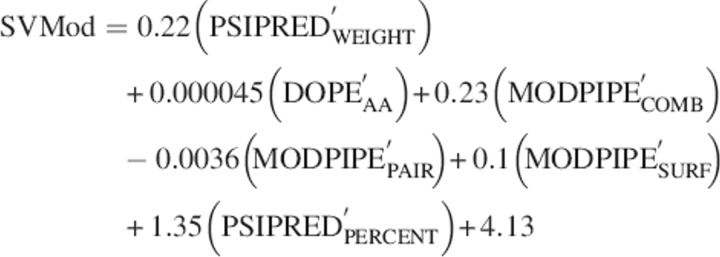 |
where primes indicate the normalization of the input PSIPREDWEIGHT, DOPEAA, MODPIPECOMB, MODPIPEPAIR, MODPIPESURF, and PSIPREDPERCENT scores by dividing the raw values by 10, 10,000, 1, 100, 10, and 1, respectively, prior to SVM training. Given the weights of the normalized scores and the typical magnitudes of each of the individual scores, the relative contributions of PSIPREDWEIGHT, DOPEAA, MODPIPECOMB, MODPIPEPAIR, MODPIPESURF, and PSIPREDPERCENT in SVMod are ∼39%, 8%, 4%, 7%, 18%, and 24%, respectively.
The jackknife test confirmed that these inputs and parameters produced an SVM composite score that consistently outperformed any of the 24 individual scores. Using the ΔRMSD criterion, the composite score was the best assessment score in ∼30% of the 40,000 testing subsets (Table 1). The next-best scores were DFIRE and DOPEAA, which obtained the lowest average ΔRMSD for ∼25% of the time. The average ΔRMSD for the composite score was 0.45 Å, outperforming by 0.18 Å the absolute best individual method, PSIPREDWEIGHT (Fig. 3; Supplemental Table S1a).
Figure 3.

Comparison of accuracies (ΔRMSD) of the assessment scores used to develop the SVMod score. (Upper diagonal) Gray and white squares indicate pairs of methods whose performance are and are not statistically significantly different at the confidence level of 95%, respectively. (Lower diagonal) The intensity of gray in each box is proportional to the pairwise ΔRMSD between the scores listed on the axes (absolute differences indicated).
Using ΔNO as an accuracy criterion, the jackknife composite score was best in 33% of the subsets, outperforming next-best scores PSIPREDWEIGHT, DFIRE, and DOPEAA, which obtained the lowest average ΔNO for 28%, 27%, and 26% of the time, respectively (Table 1). The composite score was also the best method assessed by the ΔNO criterion. The average ΔNO for the composite score was 4.5%, outperforming the best individual scores, PSIPREDWEIGHT and ROSETTA, by 2.2% (Table 1; Supplemental Table S1b). Thus, though the composite score was trained to predict an RMSD value, it was still able to outperform each individual method at identifying the best models of a set by the native overlap criterion.
The average correlation coefficient between the composite score and the actual RMSD for all 20-target sets of 300 models was 0.87, ranging from 0.75 to 0.93 (Fig. 4; Supplemental Table S3). The averages for all 24 individual scores ranged between 0.23 and 0.87 (Supplemental Table S2a). Despite resulting in a similar average correlation coefficient, SVMod selected better models with higher frequency than DOPEAA alone.
Figure 4.
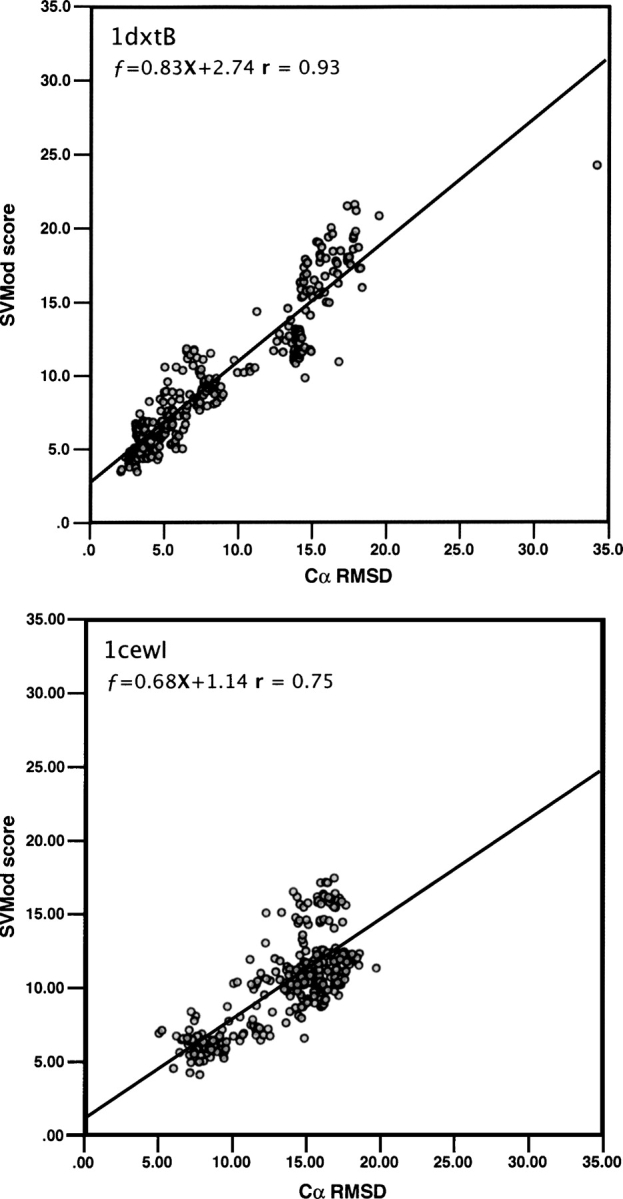
Cα RMSD correlation with the SVMod score for 300 models for the targets with the best (1dxtB, upper panel) and worst (1cewI, lower panel) correlations, at r = 0.93 and 0.75, respectively.
The SVMod composite score resulted in an enrichment factor 10% higher than any of the other tested methods when selecting the top 20 ranked models. SVMod found the most accurate model within the top 20 ranked models for 75% of the targets, while DOPEAA, DFIRE, ROSETTA, and PSIPREDPERCENT selected the best model for 65% of the targets (Fig. 5).
Figure 5.

Enrichment factor defined as the fraction of the 20 targets for which a method was able to select the best model within the N best-ranked models.
Testing of the SVMod composite score with the MODPIPE decoys
The MODPIPE test set was generated to assess the performance of SVMod in the context of large-scale comparative modeling. In particular, the set was designed to test how well SVMod could predict the absolute accuracy of a model, rather than its accuracy relative to other models. This led to fundamental differences between the MODPIPE and MOULDER decoy sets. Because the MOULDER decoy set was established to evaluate the ability of each score to assess the relative accuracy of a model, each of the models for a given target were of the same sequence and length. This made the determination of the “best model” a straightforward task. In contrast, the models in the MODPIPE decoy set greatly varied in sequence and length. For a given target sequence, MODPIPE produced models for all aligned templates with a significant alignment score; if these templates partly covered the target sequence, only that region of the sequence was modeled. Thus, identification of the “best model” is a rather difficult task in the MODPIPE decoys set, because one must arbitrarily decide the way to balance coverage and accuracy. While not a good test for assessing the relative accuracy of a method, the MODPIPE set serves as an important large-scale test for how well SVMod predicts the absolute accuracy of a model, a feature unique to SVMod. Of the very good models (see Materials and Methods), SVMod predicted 53% to have an RMSD within 1 Å and 93% within 2 Å. Only 14% of the good models were predicted by SVMod to have an RMSD >3 Å. For the acceptable models (3–5 Å), 46% were predicted in the correct range, with 51% being predicted with smaller values of RMSD; 32% were predicted to be in the range of 2–3 Å. Finally, 85% of the bad models were predicted by SVMod to have an RMSD >3 Å. Thus, 15% of the bad models were predicted as good (RMSD within 3 Å) by SVMod and could be considered false positives (Fig. 6). The correlation coefficient between the actual RMSD and the SVMod score for the MODPIPE test set is 0.68.
Figure 6.

Histogram of the Cα RMSD and SVMod score (predicted RMSD) distributions for the MODPIPE set of 80,593 models. RMSD measures were grouped in bins of 1 Å, with the size of each bin indicated by both the intensity and the area of the circle.
Discussion
Summary
Most protein structure prediction programs generate a large number of models, making the ability to select the model closest to the native structure essential for increasing the accuracy and utility of prediction methods (Baker and Sali 2001; Marti-Renom et al. 2003). To address the problem of error assessment, we studied 24 individual assessment scores, including physics-based energy functions, statistical potentials, and machine-learning-based scoring functions. We then derived a composite score from a subset of individual scores. More specifically, SVMod, a fully automated method, linearly combines six individual scores that depend on the input model only: the DOPE all heavy-atom statistical potential; surface, contact, and combined statistical potentials from MODPIPE; and two PSIPRED/DSSP secondary structure agreement scores. The output of SVMod is a single score that predicts the accuracy of the model. SVMod outperforms all individual tested scores in identifying the best models in the decoy set (Table 1; Fig. 3), and has an equivalent or higher correlation coefficient with the actual Cα RMSD and NO (Fig. 4; Supplemental Table S3) than any of the individual scores. Thus, SVMod is expected to be generally more useful for predicting errors in protein structure models than any of the tested individual scores.
Decoys
To test the ability of SVMod to predict model errors, we have used two different test sets: (1) 300 models from each of 20 target/template pairs sharing low sequence identity (MOULDER test set) and (2) 80,593 models of 4011 different target sequences from a large-scale comparative modeling exercise (MODPIPE test set). Thus, the ranges for the RMSD and NO measures are similar to that of difficult comparative modeling cases (Supplemental Fig. S1). The average size of a model in our decoy sets (∼175 residues) (Table 2) is close to the average size of a protein domain (Pearl et al. 2005), unlike other decoy sets that contain primarily small models (Samudrala and Levitt 2000; Tsai et al. 2003). The differences between our sets and those of other studies reflect their different aims: whereas many model assessment methods try to identify the native structure from among a set of decoys (Park and Levitt 1996; Tsai et al. 2003), we attempted to select the model closest to the native structure, which may not necessarily have native-like characteristics. To discriminate native from non-native structures, an optimal decoy set should (1) contain conformations for a wide variety of different proteins, (2) contain conformations relatively close to the native structure (i.e., within 4 Å), (3) consist of conformations that are not trivially excludable based on obvious non-protein-like features, and (4) be produced by an unbiased procedure that does not use information from the native structure (Park and Levitt 1996; Park et al. 1997). In contrast, for the purpose of selecting the best model from among a set of similar models, criterion 1 does not always reflect actual conditions in which a model assessment score is used, as even the best model generated by a prediction method—particularly in de novo predictions or comparative modeling based on template proteins with a low sequence identity to the target—may often result in RMSDs >4 Å.
Table 2.
MOULDER testing set properties

Criteria
The individual and composite assessment scores were assessed by their abilities to minimize the ΔRMSD and ΔNO measures. In essence, this choice of measures is equivalent to minimizing the RMSD (or maximizing the NO) to the native conformation, yet allows for a comparison of the accuracy of a method across different test sets (Supplemental Fig. S1). We chose not to use the rank order, a common accuracy measure, because it neglects the fact that models can be considered identical at small differences in ΔRMSD and because the distribution of RMSD and NO was not uniform within a set. For example, the ΔRMSD difference between the first and the 25th models across the 20 MOULDER sets varies from 0.27 to 5.7 Å, making the ΔRMSD a more informative measure than rank order.
Scores
Some trends could be observed from the testing of the 24 individual scores. For example, atomic statistical potentials (i.e., DOPE and DFIRE) were most frequently the best performing individual scores (Table 1; Figs. 1, 3). PSIPREDWEIGHT and PSIPREDPERCENT, two scores based on the percent agreement between the predicted and actual secondary structure of a model, were the best and third-best scores by the ΔRMSD criterion, respectively; PSIPREDWEIGHT was also the best score by the ΔNO criterion. The ROSETTA score, a combination of atomic statistical potentials and solvation terms, was the second-best score by ΔRMSD and equivalent to PSIPREDWEIGHT as the most accurate score by the ΔNO criterion. In general, statistical potentials outperformed energies from physics-based force fields. This observation is in agreement with the suggestion that the statistical potentials are less sensitive to small structural displacements, making them more suitable for assessing models with larger errors (Lazaridis and Karplus 2000). However, not all statistical potentials are necessarily better suited for selecting the best model from among a set of similar models: EEF1 and GB were more accurate than many of the statistical potentials tested (Table 1; Supplemental Table S1). It is also possible that the way in which we relaxed the structures prior to evaluation by EEF1 and GB might have been suboptimal, and that different relaxation schemes would have produced more accurate results. Furthermore, increasing the coarseness of a statistical potential did not improve its performance, as all heavy-atom potentials (e.g., DOPEAA) performed better than their coarser counterparts (e.g., DOPEBB), and very coarse potentials such as Xd did not outperform the more fine-grained surface and contact potentials tested. The relative orientation between side-chain atoms is better encoded by all non-hydrogen statistical potentials (e.g., DOPEAA) than by a residue-based potential (e.g., DOPEBB). This feature could explain the differences observed between the all non-hydrogen and residue-based potentials.
Solvation scores assume that protein chains are isolated in an infinitely large continuum dielectric medium (water), an assumption that is violated at least to some degree in crystal structures. This assumption, together with the characteristics of the MOULDER decoy set, may have contributed to the relatively poor performance of those potentials (e.g., surface statistical potential, EEF1, and GB scores). Of the 20 targets of the MOULDER test set, 12 were either solved experimentally as part of an oligomeric structure (nine cases) or were presumed to be oligomeric (three cases). In these cases, models of single subunits are presumably harder to evaluate than the models of subunits that exist as monomers, particularly for those scores that would penalize for artificially exposed binding regions. However, the inclusion of this type of target in our test sets represents an additional level of realism in the testing of comparative modeling, where it is often unknown whether the target sequence is part of a larger biological complex.
Although many of the 24 tested individual scores performed similarly, the average correlation coefficients between them showed that similar performance could not be attributed to particular similarities between the scores (Table 1; Figs. 2 and 3; Supplemental Table S3). For example, DOPEAA, ROSETTA, and the PSIPRED scores performed similarly well, yet the four scores do not form a cluster. However, scores based on similar principles (see Materials and Methods) were shown to cluster, including (1) DOPEAA and DFIRE (both heavy atom distance-dependent statistical potentials); (2) PSIPREDPERCENT, PSIPREDWEIGHT, and SVMod (PSIPRED scores are similar and have large weights in the SVMod score); (3) pair statistical potential scores and their corresponding combined scores; (4) GB and EEF1 (both physics-based solvation energies); and (5) PROSASURF, MODPIPESURF, and Solvx (three statistical potential scores that describe solvation) (Fig. 2).
The jackknife test showed that the ability of SVMod to select the best model is independent of the SCOP fold type of the native structure, the accuracy of the closest model to the native conformation (correlation coefficient of r = 0.41 between best RMSD and composite score average ΔRMSD), median RMSD value of the decoy set (r = 0.50), and fraction of models structurally similar to the best model of the decoys set (r = 0.57). Finally, despite the inclusion of PSIPRED-based scores in SVMod, its performance showed little correlation to the PSIPRED Q3 accuracy (r = 0.28). To assess the accuracy of the PSIPRED scores based on a perfect secondary structure prediction, we calculated a PSIPRED score that solely relies on the DSSP-based secondary structure assignment. A perfect secondary structure prediction would, presumably, not only be 100% correct but also have confidence values of 9 for each residue, making this score equivalent to a perfect PSIPREDWEIGHT with confidence value of 9 for each of the residues (see Materials and Methods). The perfect PSIPRED score would improve the ΔRMSD and ΔNO measures with respect to PSIPREDPERCENT by 0.12 Å and 2.4%, respectively. While individually the correlation between the SVMod accuracy and a given measure is small, our best composite score has a tendency to correctly select the most native-like models on sets of globular proteins ranging from 100 to 250 residues, for which there are several close-to-native models, and from sequences that result in an accurate PSIPRED prediction.
Composite score
The composite score implemented in SVMod is a weighted sum of PSIPREDWEIGHT, DOPEAA, MODPIPECOMB, MODPIPEPAIR, MODPIPESURF, and PSIPREDPERCENT with relative weighs of ∼39%, 8%, 4%, 7%, 18%, and 24%, respectively. These six individual scores were selected from a set of 11 different individual scores because of their optimal performance when combined by the SVM. Other individual scores were not included in the SVMod optimization for several reasons: (1) The ANOLEA, SIFT, and Solvx scores resulted in significantly lower accuracy when compared against all other methods (Fig. 1); although the three methods use different properties to evaluate the accuracy of a model, their statistical potentials are sensitive to small changes in the atomic coordinates of individual atoms. (2) The physics-based scores (i.e., EEF1 and GB) require larger calculation time, which make them prohibitive for large-scale applications. (3) The PROSA scores were not included due to their similarity to the MODPIPE scores (Melo et al. 2002) as well as DOPEBB, which is a derivation of the DOPEAA score (Fig. 2).
As was previously shown (Jones 1999a; Melo et al. 2002; Wallner and Elofsson 2003), we demonstrated that combining disparate assessment scores in a composite score results in a more successful method than any of the individual scores for identifying the most accurate model within a decoy set. The SVMod test using the MODPIPE decoy set indicates that a composite score trained on a small number of models from a limited number of targets is general enough to be applied to models having hundreds of different folds. In other words, the SVMod score is able to capture subtle properties of individual scores that generalize to many different sequences and folds, capturing nonobvious relationships between the input scores and the RMSD and NO errors.
Implications for large-scale comparative modeling
SVMod is useful for protein structure prediction methods in which a key step is the detection of the model closest to the native structure from a set of decoys. Although the absolute gains in terms of the ΔRMSD and ΔNO appear to be small, the benefits telescope in a large-scale application, such as our comprehensive MODBASE database (Pieper et al. 2004). MODBASE stores comparative models generated by MODPIPE (Eswar et al. 2003) for domains in 1.1 million of the 1.8 million unique sequences in UniProt (May 2005) (Bairoch et al. 2005). Most of the models in MODBASE (2.15 million of 2.97 million models) are based on an alignment of the target and the template of <30% sequence identity. Those alignments likely contain significant errors that result in inaccurate models. Therefore, the ability of SVMod to detect the best model in a set of decoys more often than the present score in MODPIPE (GA341) is likely to translate to a significant number of more accurate models. We have shown that the SVMod score results in a 10% higher enrichment factor compared to the GA341 score for selecting the closest model to the native structure (Fig. 5). Thus, by using SVMod, we can expect to correctly select the most accurate model for ∼110,000 more sequences than with the current MODPIPE.
Although we showed that SVMod outperformed all tested individual scores, its current implementation is limited by (1) particular properties of the training set, (2) the potential suboptimality of the parameters used for the SVM training, and (3) incorrect assessments by the underlying individual input scores. First, the training set is limited primarily in its size: The use of a larger set would allow for multiple SVMs to be trained on more specific or tailored decoy sets and would reduce the relative contributions of poorly assessed targets, such as 1cewI and 1lga_ (see Results). Second, while the options used in SVM training were extensive, they were by no means exhaustive. Custom kernels have not been tested at this time; however, they may find a better global fit on inputs that vary so widely in value and are dependent on other factors (i.e., protein length) that are not easily normalized. Third, as inaccurate input assessment scores hamper the overall accuracy of SVMod, improvements in individual scores would also improve the performance of future versions of SVMod. Moreover, we are poised to include additional information in model assessment, such as protein size, length, and fold type. As these additions are incorporated, the performance of the composite score is likely to improve further.
Materials and methods
Decoy set
Twenty target/template pairs of protein sequences with known structures ranging from 81 to 340 residues in length (Table 2) were randomly selected from the Fischer set of remotely related homologs (Fischer et al. 1996; John and Sali 2003). The Fischer set was devised to test fold assignment methods in the most difficult regime of no statistically significant sequence similarity. The percentages of the pairs in the α, β, α/β, and α + β SCOP classes (Andreeva et al. 2004) were 25%, 45%, 10%, and 20%, respectively. The 20 targets do not share significant structural similarity to each other. For each of the 20 targets, the structural template specified by the Fischer set was used as the template. The target–template alignments were obtained using MOULDER (John and Sali 2003) with MODELLER (Sali and Blundell 1993) to create 300 different target–template alignments. The 300 alignments uniformly ranged from ∼0% to 100% of both the native overlap (below) and the correctly aligned positions with respect to the CE structure-based alignment (Shindyalov and Bourne 1998). No two alignments of a given target shared >95% of identically aligned positions or had fewer than five different alignment positions. A comparative model was built from each target–template alignment using the default parameters for the model routine in MODELLER. Thus, the final decoy set consisted of a total of 300 models for each of the 20 targets. The accuracy of each model was measured by the Cα RMSD and the native overlap after rigid-body superposition to the native structure as calculated by the superpose command in MODELLER. The native overlap (NO) was defined as the percentage of Cα atoms in the model that are within 3.5 Å of the corresponding atoms in the superposed native structure. The distribution of RMSD and native overlap varied greatly between the 20 sets (Supplemental Fig. S1). Roughly 4% of the models are within 1–3 Å RMSD (good models; NO > 80%), ∼15% are between 3 and 5 Å RMSD (acceptable models; NO from 60% to 80%), and ∼81% superpose to the native structure with an RMSD > 5 Å (bad models; NO smaller than 60%). This test set was previously used in the development of the MOULDER protocol for iterative alignment and comparative model building (John and Sali 2003), as well as the Mod-EM method for combined comparative modeling and fitting into a mass density map from electron cryomicroscopy (Topf et al. 2005).
In addition, to measure the ability of SVMod in predicting the absolute accuracy (i.e., the actual RMSD value) of a model, a total of 168,632 comparative models were calculated by our automated comparative modeling protocol MODPIPE (Eswar et al. 2003) for the PDB-select40 list (6877 sequences as of March 2005). For each target sequence, MODPIPE builds a sequence profile using the profile.build method in the MODELLER program by iteratively searching the UniProt database (Apweiler et al. 2004). Profile.build relies on local dynamic programming and a robust method of estimation of alignment significance. Sequence–structure matches are established by aligning the target sequence profile against the template profiles, using local dynamic programming implemented in the profile.scan method of the MODELLER program. Significant alignments covering distinct regions of the target sequence are chosen for modeling using the default model building procedure of MODELLER. All models <100 residues or >250 residues were removed from the testing set. This length restriction reduced the set size to 80,593 models for 4011 different sequences. The RMSD binning of the models in the MODPIPE set shows that ∼5% of models are within 1 Å RMSD to the native structure (very good models), ∼13% are within 1–3 Å RMSD (good models), ∼20% are within the RMSD range 3–5 Å (acceptable models), and ∼62% superimpose to the native structure with an RMSD > 5 Å (bad models).
The entire MOULDER and MODPIPE testing sets, including all 86,593 models and the assessment scores calculated for each model, are available for download at http://salilab.org/our_resources.shtml.
Model accuracy measures
The choice of metric to quantify the accuracy of a model, given the native structure, is difficult (Cristobal et al. 2001; Eyrich et al. 2001; Marti-Renom et al. 2002; Moult et al. 2003; Rychlewski and Fischer 2005). While there are several measures that have been used to quantify model accuracy, such as LGScore (Cristobal et al. 2001) and MaxSub (Siew et al. 2000), we evaluated all models using the Cα RMSD and NO measures after rigid body superposition of the compared structures. All accuracy prediction methods were tested for their ability to minimize the ΔRMSD and ΔNO scores, which are defined as the absolute differences in RMSD and NO, respectively, between the selected model (i.e., best scored model) and the actual best model (i.e., structurally closest to the native structure). Thus, a value of 0.0 for either measure indicates that the closest model to the native conformation in the decoy set was identified.
Model assessment scores
A total of 24 scores for predicting model accuracy were calculated for each of the 6000 models in the MOULDER test set. As our main goal was to develop a score that combines the most successful individual assessment scores, we selected a diverse array of established methods that were readily available, easy to implement, work by accepting the three-dimensional coordinates of a protein structure model to produce a single assessment score, and could be incorporated in a composite score. This last requirement caused us to focus on methods that could either be redistributed as part of our SVMod code, or accessed by a Web server. Additionally, we attempted to select representative methods for different types of scores (e.g., distance-dependent scores, surface-dependent scores). Next, we briefly describe these scores.
CHARMM EEF1
The Effective Energy Function 1 in the CHARMM program (Brooks et al. 1983) depends on a modified CHARMM-19 force field and a Gaussian solvent exclusion model (Lazaridis and Karplus 1997, 1999b, 2000). CHARMM v.28a3 was used to minimize the potential energy of the models by 50 steps of conjugate gradients minimization followed by 300 steps of Adopted Basis Newton-Raphson minimization. The EEF1 energy (EEF1) was then calculated for the minimized models.
CHARMM Generalized Born
The CHARMM GB potential includes the Generalized Born solvation model (Still et al. 1990; Qiu et al. 1997) into the CHARMM force field to account for the solvation contribution to the free energy. The implementation of GB in CHARMM v.28a3 was used to calculate the GB potential energy (GB), using the same minimization protocol as that of EEF1.
ROSETTA
The Rosetta scoring function is an all-atom force field that focuses on short-range interactions (i.e., van der Waals packing, hydrogen bonding, and desolvation) while neglecting long-range electrostatics (Kuhlman et al. 2003; Bradley et al. 2005). It was run with default values “-score” option to produce the Rosetta score (ROSETTA).
ANOLEA
The Atomic Non-Local Environment Assessment program (Melo and Feytmans 1997, 1998; Melo et al. 1997) relies on atomic distance-dependent and solvent accessibility-dependent statistical potentials (Melo and Feytmans 1998). It was run with the default values, producing three scores: the ANOLEA pseudo-energy (ANOLEAPE), percent of residues in the structure that make unfavorable contacts (ANOLEAPUC), and a Z-score of the ANOLEA pseudoenergy (ANOLEAZPE).
DFIRE
The DFIRE score (Zhou and Zhou 2002) is a statistical potential summed over all pairs of non-hydrogen atoms. DFIRE uses a distance-scaled finite ideal gas as reference state. The DFIRE program was used with default parameters to calculate the score (DFIRE) for each model in the test set.
DOPE
The Discrete Optimized Protein Energy program (M.-Y. Shen and A. Sali, in prep.) is a distance-dependant statistical potential based on a physical reference state that accounts for the finite size and spherical shape of proteins. The reference state assumes a protein chain consists of noninteracting atoms in a homogeneous sphere of equivalent radius to that of the corresponding protein. The DOPE potential was derived by comparing the distance statistics from a nonredundant PDB subset of 1472 high-resolution protein structures with the distance distribution function of the reference state. Two versions of DOPE were used: one that assigns a score for a protein by considering the positions of all non-hydrogen atoms (DOPEAA), and one that only considers the positions of the backbone atoms (DOPEBB).
Harmonic average distance score
The weighted harmonic average difference score (Xd) assumes that conserved hydrophobic positions in the core are clustered more tightly in an accurate model than in an inaccurate model (Pazos et al. 1997). The calculation relies on an alignment of the tested model with homologous sequences and compares the Euclidean distance distribution for pairs of the conserved hydrophobic positions against the reference distribution for pairs of all positions.
Modcheck
The Modcheck program relies on the Cβ → Cβ, Cβ → N, N → Cβ, Cβ → O, and O → Cβ distance-based statistical potential implemented in the GenTHREADER program (Jones 1999a) and incorporates an estimate of the initial alignment accuracy based on a randomly shuffled set of alignments. The Modcheck program was used with default parameters (MODCHECK).
MODPIPE assessment scores
Several model assessment scores are calculated by MODPIPE: a distance-dependent statistical potential score (MODPIPEPAIR) (Melo et al. 2002), an accessible surface statistical potential score (MODPIPESURF) (Melo et al. 2002), a distance and surface combined potential score (MODPIPECOMB) (Melo et al. 2002), a structural compactness score (MODPIPECOMP) (F. Melo and A. Sali, in prep.), the target–template sequence identity (Si) implied by the target–template alignment, and a machine-learning-based potential derived by a genetic algorithm protocol (GA341) (F. Melo and A. Sali, in prep.):
 |
where the Z-score is calculated for the combined statistical potential score of the model using the mean and standard deviation of the statistical potential score of 200 random sequences with the same amino acid residue-type composition and structure as the model. All of the MODPIPE scores were developed and implemented as described elsewhere (Melo et al. 2002; Eswar et al. 2003; John and Sali 2003; F. Melo and A. Sali, in prep.).
ProsaII
The ProsaII program (Sippl 1993a, 1995) uses distance- and surface-dependent statistical potentials for Cβ atoms of all residues in the model. The original ProsaII program was used with default parameters to obtain three different scores: a distance-dependent pair score (PROSAPAIR), an accessible surface score (PROSASURF), and a combined score (PROSACOMB).
Sift
Sift (Adamczak et al. 2004) is a statistical potential-based program that calculates the shape of the inter-residue radial distribution function (RDF) for a given model. The RDF shape function is compared to an averaged (i.e., independent of the amino acid residue type) RDF to discriminate properly packed models from misfolded ones. Sift was used with default parameters (SIFT).
Solvx
The Solvx program (Holm and Sander 1992) implements a statistical potential that evaluates the solvent contacts made by a model with respect to atomic solvation preferences derived from a database of known structures. Solvx was used with default parameters (SOLVX).
Victor/FRST
The Victor/FRST program (Tosatto 2005) depends on a weighted linear combination of three statistical potentials (an atomic distance potential, a solvation potential, and a torsion angle potential) for estimating the accuracy of a protein model. The program was used with default parameters (FRST).
Predicted secondary structure
The DSSP program (Kabsch and Sander 1983) was used to assign a secondary structure state to each residue in a model. The eight-state DSSP assignments were translated to the three-state Q3 format following the conventions of EVA (Eyrich et al. 2001). The PSIPRED program (Jones 1999b) was used to predict a secondary structure state for each residue of the 20 target sequences. Finally, we calculated the percentage of amino acid residues that had different Q3 states for both the model and the target sequence (PSIPREDPERCENT). A weighted score that takes into account the PSIPRED prediction confidence was also calculated (PSIPREDWEIGHT) as follows:
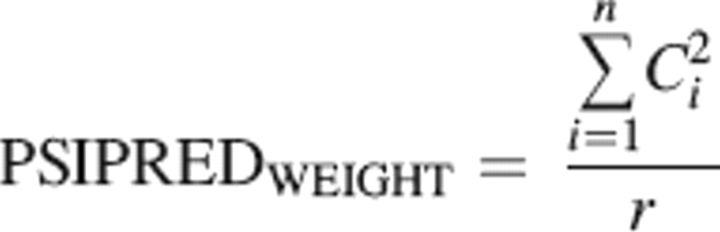 |
where the sum runs only over the n residue positions that have different Q3 states in the sequence (PSIPRED) and the model (DSSP), Ci is the confidence value (0–9) for prediction of the state of residue i, and r is the total number of residues in the sequence.
Comparing assessment scores
All 24 assessment scores were compared to each other by the average Pearson correlation coefficient for the 6000 model scores in the testing set. The average correlation coefficient between every pair of assessment scores was calculated as the average of the pairwise correlation coefficients for each of the 20 templates. A matrix containing the correlation coefficients for all comparisons was input into the FITCH program of the PHYLIP Package (Felsenstein 1985) to generate a tree representation of the relationships between the different scores (Fig. 2).
Testing of the assessment scores
To determine the accuracy of a score for identifying the most native-like model from a set, each of the 20 sets of 300 models was split into 2000 randomly populated smaller sets of 75 models. This split reduced the impact of individual target sets on the final ranking of the scores and increased the robustness of our benchmark. For each 75-model set, the model with the lowest Cα RMSD after rigid-body superposition to the native structure was used as the reference to calculate the ΔRMSD measure; for the ΔNO measure, the model with the highest native overlap was used as the reference. The ΔRMSD and ΔNO measures were averaged for the 24 scoring methods over all 40,000 (20 by 2000) subsets. The frequency with which a particular score produced the best (or equivalent to the best) ΔRMSD and ΔNO was also calculated, as was an enrichment factor defined by the fraction of the 20 targets for which a method was able to select the best model within the top N ranked models. Finally, the statistical significance of the difference in performance of any two scores was assessed by the parametric Student's t-test at the 95% confidence value (Marti-Renom et al. 2002).
Support vector machine (SVM) composite score
Ten of the best performing individual scoring methods provided input into the SVM software SVMlight (Joachims 1988). The regression mode of SVMlight was used so that several input features are mapped to an output value. The SVMs were trained to predict the RMSD value of a model given a number of input scores. A leave-one-out heterogeneous jackknife approach was applied to train all SVMs. For each sequence, an SVM was trained by using the remaining 19 sequences as training input (5700 possible models), and its models (300 in total) as the testing set. To avoid noise in the SVM training, all models at least 15 Å Cα RMSD from the native structure were removed from the training sets. The native structures were not included in the training sets. To accelerate the training process, all input scores were normalized to values between −1 and 1. This normalization had no effect on the accuracy of the predicted classifiers, yet it increased the training speed by an order of magnitude (data not shown).
Four different SVM standard kernel types were tested: a linear kernel, a polynomial kernel, a radial basis function kernel, and a sigmoid kernel. C-values between 0 and 10 were tested in increments of 1, and W-values between 0 and 1 in increments of 0.1. In excess of 4000 different training parameters and inputs were tried and assessed; with the jackknife protocol, this training resulted in ∼85,000 SVMs. The relative weights for each input score in a trained SVM were calculated by computing the normalized weighted sum of the support vectors, using an SVMlight script. Once the best input features and parameters were identified through the jackknife protocol, the composite score underlying SVMod was derived by using all models <15 Å Cα RMSD from all 20 MOULDER sets.
Electronic supplemental material
The Supplemental Material contains RMSD histograms for the 20 targets in the MOULDER decoy set; average ΔRMSDs for each of the 20 targets in the MOULDER decoy set; average ΔNOs for each of the 20 targets in the MOULDER decoy set; average RMSDs for each of the 20 targets in the MOULDER decoy set; average NOs for each of the 20 targets in the MOULDER decoy set; correlation coefficients between the assessment scores and ΔRMSDs for each of the 20 targets in the MOULDER decoy set; correlation coefficients between the assessment scores and ΔNOs for each of the 20 targets in the MOULDER decoy set; and average pairwise correlation coefficients between the assessment scores and the accuracy measures.
Acknowledgments
We thank John Chodera and Drs. M.S. Madhusudhan and Eswar Narayanan for helpful discussions; and Drs. Ursula Pieper, Ben Webb, and Eswar Narayanan for their maintenance of the computational resources required for this study. We also thank Dr. Yaoqi Zhou for the DFIRE code. We acknowledge the helpful comments and suggestions made by the two anonymous reviewers of this manuscript. D.E. is supported in part by an NIH GM 08284 Structural Biology Training Grant. We are also grateful for the support of NSF EIA-032645, NIH R01 GM54762, Human Frontier Science Program, The Sandler Family Supporting Foundation, SUN, IBM, and Intel.
Footnotes
Supplemental material: see www.proteinscience.org
Reprint requests to: Marc A. Marti-Renom and Andrej Sali, California Institute for Quantitative Biomedical Research, QB3 at Mission Bay, Suite 503B, University of California at San Francisco, 1700 4th Street, San Francisco, CA 94158, USA; e-mail: marcius@salilab.org or sali@salilab.org; fax: (415) 514-4231.
Article published online ahead of print. Article and publication date are at http://www.proteinscience.org/cgi/doi/10.1110/ps.062095806.
References
- Adamczak R., Porollo A., Meller J. 2004. Accurate prediction of solvent accessibility using neural networks-based regression. Proteins 56: 753–767. [DOI] [PubMed] [Google Scholar]
- Andreeva A., Howorth D., Brenner S.E., Hubbard T.J., Chothia C., Murzin A.G. 2004. SCOP database in 2004: Refinements integrate structure and sequence family data. Nucleic Acids Res. 32: D226–D229. [DOI] [PMC free article] [PubMed] [Google Scholar]
- Apweiler R., Bairoch A., Wu C.H., Barker W.C., Boeckmann B., Ferro S., Gasteiger E., Huang H., Lopez R., Magrane M.et al. 2004. UniProt: The Universal Protein knowledge base. Nucleic Acids Res. 32: D115–D119. [DOI] [PMC free article] [PubMed] [Google Scholar]
- Bairoch A., Apweiler R., Wu C.H., Barker W.C., Boeckmann B., Ferro S., Gasteiger E., Huang H., Lopez R., Magrane M.et al. 2005. The Universal Protein Resource (UniProt). Nucleic Acids Res. 33: D154–D159. [DOI] [PMC free article] [PubMed] [Google Scholar]
- Baker D. and Sali A. 2001. Protein structure prediction and structural genomics. Science 294: 93–96. [DOI] [PubMed] [Google Scholar]
- Bock J.R. and Gough D.A. 2001. Predicting protein–protein interactions from primary structure. Bioinformatics 17: 455–460. [DOI] [PubMed] [Google Scholar]
- Bradley P., Misura K.M., Baker D. 2005. Toward high-resolution de novo structure prediction for small proteins. Science 309: 1868–1871. [DOI] [PubMed] [Google Scholar]
- Brooks R.B., Bruccoleri R.E., Olafson B.D., States D.J., Swaminathan S., Karplus M. 1983. CHARMM: A program for macromolecular energy minimization and dynamics calculations. J. Comput. Chem. 4: 187–217. [Google Scholar]
- Burbidge R., Trotter M., Buxton B., Holden S. 2001. Drug design by machine learning: Support vector machines for pharmaceutical data analysis. Comput. Chem. 26: 5–14. [DOI] [PubMed] [Google Scholar]
- Cai C.Z., Wang W.L., Sun L.Z., Chen Y.Z. 2003a. Protein function classification via support vector machine approach. Math. Biosci. 185: 111–122. [DOI] [PubMed] [Google Scholar]
- Cai Y.D., Liu X.J., Li Y.X., Xu X.B., Chou K.C. 2003b. Prediction of β-turns with learning machines. Peptides 24: 665–669. [DOI] [PubMed] [Google Scholar]
- Cristobal S., Zemla A., Fischer D., Rychlewski L., Elofsson A. 2001. A study of quality measures for protein threading models. BMC Bioinformatics 2:–5. [DOI] [PMC free article] [PubMed]
- Ding C.H. and Dubchak I. 2001. Multi-class protein fold recognition using support vector machines and neural networks. Bioinformatics 17: 349–358. [DOI] [PubMed] [Google Scholar]
- Domingues F.S., Koppensteiner W.A., Jaritz M., Prlic A., Weichenberger C., Wiederstein M., Floeckner H., Lackner P., Sippl M.J. 1999. Sustained performance of knowledge-based potentials in fold recognition. Proteins 3:Suppl. 3 112–120. [PubMed] [Google Scholar]
- Doniger S., Hofmann T., Yeh J. 2002. Predicting CNS permeability of drug molecules: Comparison of neural network and support vector machine algorithms. J. Comput. Biol. 9: 849–864. [DOI] [PubMed] [Google Scholar]
- Eswar N., John B., Mirkovic N., Fiser A., Ilyin V.A., Pieper U., Stuart A.C., Marti-Renom M.A., Madhusudhan M.S., Yerkovich B.et al. 2003. Tools for comparative protein structure modeling and analysis. Nucleic Acids Res. 31: 3375–3380. [DOI] [PMC free article] [PubMed] [Google Scholar]
- Eyrich V.A., Marti-Renom M.A., Przybylski D., Madhusudhan M.S., Fiser A., Pazos F., Valencia A., Sali A., Rost B. 2001. EVA: Continuous automatic evaluation of protein structure prediction servers. Bioinformatics 17: 1242–1243. [DOI] [PubMed] [Google Scholar]
- Felsenstein J. 1985. Confidence limits on phylogenies: An approach using the bootstrap. Evolution Int. J. Org. Evolution 39: 783–791. [DOI] [PubMed] [Google Scholar]
- Fischer D., Elofsson A., Rice D., Eisenberg D. 1996. Assessing the performance of fold recognition methods by means of a comprehensive benchmark. Pac. Symp. Biocomput. 397: 300–318. [PubMed] [Google Scholar]
- Gatchell D.W., Dennis S., Vajda S. 2000. Discrimination of near-native protein structures from misfolded models by empirical free energy functions. Proteins 41: 518–534. [PubMed] [Google Scholar]
- Ginalski K., Grishin N.V., Godzik A., Rychlewski L. 2005. Practical lessons from protein structure prediction. Nucleic Acids Res. 33: 1874–1891. [DOI] [PMC free article] [PubMed] [Google Scholar]
- Holm L. and Sander C. 1992. Evaluation of protein models by atomic solvation preference. J. Mol. Biol. 225: 93–105. [DOI] [PubMed] [Google Scholar]
- Joachims T. 1988. Making large-scale SVM learning practical.” LS VIII-Report, No. 24. Computer Science Department, Universität Dortmund, Dortmund, Germany.
- John B. and Sali A. 2003. Comparative protein structure modeling by iterative alignment, model building and model assessment. Nucleic Acids Res. 31: 3982–3992. [DOI] [PMC free article] [PubMed] [Google Scholar]
- Jones D.T. 1999a. GenTHREADER: An efficient and reliable protein fold recognition method for genomic sequences. J. Mol. Biol. 287: 797–815. [DOI] [PubMed] [Google Scholar]
- Jones D.T. 1999b. Protein secondary structure prediction based on position-specific scoring matrices. J. Mol. Biol. 292: 195–202. [DOI] [PubMed] [Google Scholar]
- Kabsch W. and Sander C. 1983. Dictionary of protein secondary structure: Pattern recognition of hydrogen-bonded and geometrical features. Biopolymers 22: 2577–2637. [DOI] [PubMed] [Google Scholar]
- Karchin R., Kelly L., Sali A. 2005. Improving functional annotation of non-synonomous SNPs with information theory. Pac. Symp. Biocomput. 2005: 397–408. [DOI] [PubMed] [Google Scholar]
- Kuhlman B., Dantas G., Ireton G.C., Varani G., Stoddard B.L., Baker D. 2003. Design of a novel globular protein fold with atomic-level accuracy. Science 302: 1364–1368. [DOI] [PubMed] [Google Scholar]
- Lazaridis T. and Karplus M. 1997. New view of protein folding reconciled with the old through multiple unfolding simulations. Science 278: 1928–1931. [DOI] [PubMed] [Google Scholar]
- Lazaridis T. and Karplus M. 1999a. Discrimination of the native from misfolded protein models with an energy function including implicit solvation. J. Mol. Biol. 288: 477–487. [DOI] [PubMed] [Google Scholar]
- Lazaridis T. and Karplus M. 1999b. Effective energy function for proteins in solution. Proteins 35: 133–152. [DOI] [PubMed] [Google Scholar]
- Lazaridis T. and Karplus M. 2000. Effective energy functions for protein structure prediction. Curr. Opin. Struct. Biol. 10: 139–145. [DOI] [PubMed] [Google Scholar]
- Marti-Renom M.A., Madhusudhan M.S., Fiser A., Rost B., Sali A. 2002. Reliability of assessment of protein structure prediction methods. Structure (Camb.) 10: 435–440. [DOI] [PubMed] [Google Scholar]
- Marti-Renom M.A., Fiser A., Madhusudhan M.S., John B., Stuart A.C., Eswar N., Pieper U., Shen M.-Y., Sali A. 2003. Modeling protein structure from its sequence. In Current protocols in bioinformatics (eds. Baxevanis A.D.et al.) . pp. 5.1.1–5.1.32. John Wiley & Sons, New York.
- McGuffin L.J. and Jones D.T. 2003. Benchmarking secondary structure prediction for fold recognition. Proteins 52: 166–175. [DOI] [PubMed] [Google Scholar]
- Melo F. and Feytmans E. 1997. Novel knowledge-based mean force potential at atomic level. J. Mol. Biol. 267: 207–222. [DOI] [PubMed] [Google Scholar]
- Melo F. and Feytmans E. 1998. Assessing protein structures with a non-local atomic interaction energy. J. Mol. Biol. 277: 1141–1152. [DOI] [PubMed] [Google Scholar]
- Melo F., Devos D., Depiereux E., Feytmans E. 1997. ANOLEA: A www server to assess protein structures. Proc. Int. Conf. Intell. Syst. Mol. Biol. 5: 187–190. [PubMed] [Google Scholar]
- Melo F., Sanchez R., Sali A. 2002. Statistical potentials for fold assessment. Protein Sci. 11: 430–448. [DOI] [PMC free article] [PubMed] [Google Scholar]
- Miyazawa S. and Jernigan R.L. 1996. Residue–residue potentials with a favorable contact pair term and an unfavorable high packing density term, for simulation and threading. J. Mol. Biol. 256: 623–644. [DOI] [PubMed] [Google Scholar]
- Moult J., Fidelis K., Zemla A., Hubbard T. 2003. Critical assessment of methods of protein structure prediction (CASP)-round V. Proteins 53:Suppl. 6 334–339. [DOI] [PubMed] [Google Scholar]
- Park B. and Levitt M. 1996. Energy functions that discriminate X-ray and near-native folds from well-constructed decoys. J. Mol. Biol. 258: 367–392. [DOI] [PubMed] [Google Scholar]
- Park B.H., Huang E.S., Levitt M. 1997. Factors affecting the ability of energy functions to discriminate correct from incorrect folds. J. Mol. Biol. 266: 831–846. [DOI] [PubMed] [Google Scholar]
- Pazos F., Helmer-Citterich M., Ausiello G., Valencia A. 1997. Correlated mutations contain information about protein–protein interaction. J. Mol. Biol. 271: 511–523. [DOI] [PubMed] [Google Scholar]
- Pearl F., Todd A., Sillitoe I., Dibley M., Redfern O., Lewis T., Bennett C., Marsden R., Grant A., Lee D.et al. 2005. The CATH Domain Structure Database and related resources Gene3D and DHS provide comprehensive domain family information for genome analysis. Nucleic Acids Res. 33: D247–D251. [DOI] [PMC free article] [PubMed] [Google Scholar]
- Pieper U., Eswar N., Braberg H., Madhusudhan M.S., Davis F.P., Stuart A.C., Mirkovic N., Rossi A., Marti-Renom M.A., Fiser A.et al. 2004. MODBASE, a database of annotated comparative protein structure models, and associated resources. Nucleic Acids Res. 32: D217–D222. [DOI] [PMC free article] [PubMed] [Google Scholar]
- Qiu D., Shenkin P.S., Hollinger F.P., Still W.C. 1997. The GB/SA continuum model for solvation. A fast analytical method for the calculation of approximate Born radii. J. Phys. Chem. A 101: 3005–3014. [Google Scholar]
- Rychlewski L. and Fischer D. 2005. LiveBench-8: The large-scale, continuous assessment of automated protein structure prediction. Protein Sci. 14: 240–245. [DOI] [PMC free article] [PubMed] [Google Scholar]
- Sali A. and Blundell T.L. 1993. Comparative protein modelling by satisfaction of spatial restraints. J. Mol. Biol. 234: 779–815. [DOI] [PubMed] [Google Scholar]
- Samudrala R. and Levitt M. 2000. Decoys ‘R’ Us: A database of incorrect conformations to improve protein structure prediction. Protein Sci. 9: 1399–1401. [DOI] [PMC free article] [PubMed] [Google Scholar]
- Seok C., Rosen J.B., Chodera J.D., Dill K.A. 2003. MOPED: Method for optimizing physical energy parameters using decoys. J. Comput. Chem. 24: 89–97. [DOI] [PubMed] [Google Scholar]
- Shindyalov I.N. and Bourne P.E. 1998. Protein structure alignment by incremental combinatorial extension (CE) of the optimal path. Protein Eng. 11: 739–747. [DOI] [PubMed] [Google Scholar]
- Shortle D., Simons K.T., Baker D. 1998. Clustering of low-energy conformations near the native structures of small proteins. Proc. Natl. Acad. Sci. 95: 11158–11162. [DOI] [PMC free article] [PubMed] [Google Scholar]
- Siew N., Elofsson A., Rychlewski L., Fischer D. 2000. MaxSub: An automated measure for the assessment of protein structure prediction quality. Bioinformatics 16: 776–785. [DOI] [PubMed] [Google Scholar]
- Sippl M.J. 1993a. Boltzmann's principle, knowledge-based mean fields and protein folding. An approach to the computational determination of protein structures. J. Comput. Aided Mol. Des. 7: 473–501. [DOI] [PubMed] [Google Scholar]
- Sippl M.J. 1993b. Recognition of errors in three-dimensional structures of proteins. Proteins 17: 355–362. [DOI] [PubMed] [Google Scholar]
- Sippl M.J. 1995. Knowledge-based potentials for proteins. Curr. Opin. Struct. Biol. 5: 229–235. [DOI] [PubMed] [Google Scholar]
- Still W.C., Tempczyk A., Hawley R.C., Hendrickson T. 1990. Semianalytical treatment of solvation for molecular mechanics and dynamics. J. Am. Chem. Soc. 112: 6127–6129. [Google Scholar]
- Topf M., Baker M.L., John B., Chiu W., Sali A. 2005. Structural characterization of components of protein assemblies by comparative modeling and electron cryo-microscopy. J. Struct. Biol. 149: 191–203. [DOI] [PubMed] [Google Scholar]
- Tosatto S.C.E. 2005. The victor/FRST function for model quality estimation. J. Comput. Biol. 12: 1316–1327. [DOI] [PubMed] [Google Scholar]
- Tsai J., Bonneau R., Morozov A.V., Kuhlman B., Rohl C.A., Baker D. 2003. An improved protein decoy set for testing energy functions for protein structure prediction. Proteins 53: 76–87. [DOI] [PubMed] [Google Scholar]
- Vapnik V. In The nature of statistical learning theory . 1995. Springer, Berlin, Germany.
- Vorobjev Y.N. and Hermans J. 2001. Free energies of protein decoys provide insight into determinants of protein stability. Protein Sci. 10: 2498–2506. [DOI] [PMC free article] [PubMed] [Google Scholar]
- Wallner B. and Elofsson A. 2003. Can correct protein models be identified? Protein Sci. 12: 1073–1086. [DOI] [PMC free article] [PubMed] [Google Scholar]
- Ward J.J., McGuffin L.J., Buxton B.F., Jones D.T. 2003. Secondary structure prediction with support vector machines. Bioinformatics 19: 1650–1655. [DOI] [PubMed] [Google Scholar]
- Zhang C., Liu S., Zhou H., Zhou Y. 2004. The dependence of all-atom statistical potentials on structural training database. Biophys. J. 86: 3349–3358. [DOI] [PMC free article] [PubMed] [Google Scholar]
- Zhou H. and Zhou Y. 2002. Distance-scaled, finite ideal-gas reference state improves structure-derived potentials of mean force for structure selection and stability prediction. Protein Sci. 11: 2714–2726. [DOI] [PMC free article] [PubMed] [Google Scholar]
- Zhu J., Zhu Q., Shi Y., Liu H. 2003. How well can we predict native contacts in proteins based on decoy structures and their energies? Proteins 52: 598–608. [DOI] [PubMed] [Google Scholar]