

Abstract
Residual dipolar couplings (RDCs) have proven to be a valuable NMR tool that can provide long-range constraints for molecular structure determination. The constraints are orientational in nature and are, thus, highly complementary to conventional distance constraints from NOE data. This complementarity would seem to extend to the study of the geometry of ligands bound to proteins. However, unlike transferred NOEs, where collection, even with a large excess of free ligand, results in measurements dominated by bound contributions, RDCs of exchanging ligands can be dominated by free-state contributions. Here we present a strategy for enhancement of RDCs from bound states that is based on specifically enhancing the alignment of the protein to which a ligand will bind. The protein is modified by addition of a hydrophobic alkyl tail that anchors it to the bicelles that are a part of the ordering medium needed for RDC measurement. As an illustration, we have added a propyl chain to the C terminus of the carbohydrate recognition domain of the protein, Galectin-3, and report enhanced RDCs that prove consistent with known bound-ligand geometries for this protein.
Keywords: RDC, lectin, ligand conformation, NMR, transferred NOE, carbohydrate binding
Defining the conformation of ligands as they exist when bound to proteins and defining the structural interactions that exist between bound ligands and residues in the active site of a protein provide a useful starting point for the rational design of many drugs. NMR has proven to be a major source of experimental information needed for defining these properties (Moore 1999). Transfer nuclear Overhauser effects (NOE) (Campbell and Sykes 1993; Poveda and Jimenez-Barbero 1998; Post 2003) and saturation transfer difference (STD) experiments (Mayer and Meyer 1999; Meyer and Peters 2003) have been particularly effective at providing information on the properties of bound ligands. These are both based on cross-relaxation between pairs of spins via a dipole–dipole interaction. The steep r−6 distance dependence of cross-relaxation provides both contact information and distance constraints useful in conformational analysis. For rapidly exchanging systems, these experiments are typically applied with a 10- to 20-fold excess of ligand over protein, a condition that makes observation of cross-relaxation involving ligand protons a highly sensitive process. An average of free and bound-state cross-relaxation effects is observed, but the dependence of cross-relaxation efficiency on a correlation time that scales with the size of the complex allows bound-state contributions to dominate to an extent that makes analysis of bound state conformations straightforward (Moseley et al. 1997). Nevertheless, there are limitations. Data only provide constraints for proton–proton pairs with distance separations shorter than 4–5 Å. For ligands with small numbers of such inter-residue pairs and for proteins that use hydrogen-bonding arrays as opposed to van der Waals contacts for recognition, the number of constraints is often inadequate to define a bound geometry. This is particularly a problem for carbohydrate-recognizing proteins.
For cases with small numbers of NOE constraints, residual dipolar couplings (RDCs) provide a potentially useful alternative in that they are orientational constraints, independent of distances between protons on ligand residues or protons on ligand residues and the protein. However, applications to exchanging systems have been few (Jain et al. 2003; Lipsitz and Tjandra 2004) because there is usually no preferential weighting of bound-state information. Here we provide one solution to this problem. It involves a simple modification of the protein to enhance its orientation, a factor that is required for measurement of RDCs and a factor that scales up contributions from any bound ligand.
Dipolar couplings between pairs of spin ½ nuclei display the angular dependence shown in Equation 1 (Bax 2003; Prestegard et al. 2004)
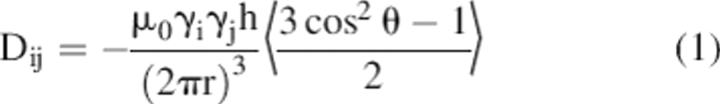 |
where θ is the angle between the magnetic field and the spin–spin interaction vector and r is the distance between interacting spins. In our case the pairs will be directly bonded or be in a semi-rigid ring structure for which the interaction distance is known and θ becomes the primary variable. The difficulty is the averaging that takes place with molecular tumbling in solution. When an isotropic distribution of vector directions is sampled, the function goes to zero and no dipolar couplings are observed (Prestegard et al. 2004). The solution most frequently involves use of a liquid crystal medium. Typical media for molecules that dissolve in aqueous environments are phospholipid bicelles, alkyl-ethyleneglycol-alcohol bilayers (for example, C12E5-hexanol) and bacteriophage (Ruckert and Otting 2000; Gaemers and Bax 2001; Prestegard et al. 2004). These media normally cause departures from isotropic orientational distributions through collisional interactions with anisotropically shaped molecules. The dipolar contribution does not go to zero and the interactions add to normal through-bond couplings where they are measured as departures in multiplet splittings from their isotropic values.
The problem for exchanging systems is that the anisotropy of shape is independent of size and the induced RDCs for a free ligand can be just as large as the induced RDCs for a ligand in a protein complex. Observed RDCs are given by Equation 2. If RDCs for the free state (RDCF) and bound state (RDCB) are similar, and the fraction of ligand in the bound state (fB) is of order 0.1, it will clearly be difficult to extract RDCB from a measured coupling.
One approach to resolving this problem is to make RDCB larger than RDCF. At least one proposal to do this has been reported in the literature (Ikegami et al. 2004), but it relies on using paramagnetic alignment of a protein, rather than a liquid crystal medium. RDCF in this case is nearly equal to zero and RDCB can dominate. But RDCB is typically very small in paramagnetically aligned systems and average ligand RDCs will be difficult to measure. The prospect may be somewhat brighter for pseudocontact shifts from paramagnetic centers; these can provide additional constraints on ligand geometry. Our approach relies strictly on making RDCB large so measured RDCs will correspondingly be easier to measure. The magnitude of RDCB is directly dependent on the magnitude of alignment of the complex. In our case we will enhance the alignment of the protein (and protein–ligand complex) by switching from collisional alignment to specific association with elements of the liquid crystal medium. There is some precedent in the study of ligand binding to membrane proteins where proteins in membrane fragments form the alignment medium. Koenig et al. (2000), for example, were able to measure the dipolar couplings of a transducin peptide fragment weakly bound to photo-activated rhodopsin. Our medium is a C12E5 medium with aligned elements having a lipid-bilayer-like hydrophobic interior. Association is promoted by addition of a hydrophobic alkyl tail to the protein. Only a short propyl chain proves necessary. It will be added to the terminus of a protein by adding a cysteine residue and using a cysteine specific reaction as shown below (Fig. 1; Smith et al. 1975; Bruice and Kenyon 1985; Mascia et al. 2000). The details of this reaction will be described later.
Figure 1.

Cysteine specific alkylation with alkyl methanethiolsufonate under reductant-free conditions.
The protein and the ligand we use as an illustration of the methods proposed are the Galectin-3 carbohydrate recognition domain (CRD) (PDB 1A3K) and lactose, respectively (Seetharaman et al. 1998). Galectin-3 has two functional domains, including an N-terminal domain and a C-terminal carbohydrate recognition domain (CRD, residues 117–250). The CRD of Galectin-3 is evolutionarily conserved within the Galectin family and carries a galactose-specific binding site (Seetharaman et al. 1998; Houzelstein et al. 2004). It is this domain that we study here. Although the CRD of Galectin-3 already has one cysteine (C173), this cysteine is buried and quite inaccessible to the solvent (<5%, calculated by NACCESS) (Frigeri et al. 1990; S.J. Hubbard and J.M. Thornton, University College London); we expect it to be unreactive. Another reactive cysteine is introduced by adding the nucleic acids coding for this amino acid to the C terminus of the cDNA for the domain. Because the C terminus is flexible and far from the binding site it is unlikely to change the protein conformation or interfere with ligand binding. The CRD has been characterized by NMR previously (Umemoto and Leffler 2001), and we have previously studied its carbohydrate binding properties, focusing more on protein structural response to ligand binding (Umemoto et al. 2003). Here we present a study focused on the conformation of a bound ligand (lactose) as opposed to that of the protein.
Results
Cysteine-specific alkylthiolation of Galectin-3 C251-CRD
Both the addition of the C-terminal cysteine and the formation of a disulfide bond between this cysteine and 1-propanethiol could lead to unwanted perturbation of protein properties. Moreover, the Galectin-3 CRD has a native cysteine that we prefer remain as a free sulfhydryl. Both of these issues require some attention. With respect to the first issue, we have chosen to add the cysteine and make the alkythiolation at the C-terminal end because the C terminus of the Galectin-3 CRD appears to be an unstructured segment in the crystal structure (PDB 1A3K) and this segment is well removed from the carbohydrate binding site.
The lack of significant perturbation on adding the cysteine can easily be confirmed by comparing 15N-1H HSQC spectra for mutant and native proteins. 15N and 1H chemical shifts are quite sensitive to local conformation changes and cross-peaks in these spectra from residues near perturbed regions should move. Figure 2 presents a comparison of spectra for native and mutant C251-CRDs of Galectin-3. The native spectrum is reconstructed from the work by Umemoto and Leffler (2001) and the C251-CRD spectrum was taken as described in the Materials and Methods section. With a few exceptions the two spectra are identical within the errors expected from small differences in buffer and other environmental factors. The major differences are for the amino acids of the N terminus and C terminus. The difference at the N terminus is explainable because the Galectin-3 CRD constructs differ slightly in the number of pre-CRD residues (before amino acid 117). In the work by Umemoto and Leffler, the CRD was prepared by collagenase digestion to yield a protein containing amino acids 108–250, whereas our construct encodes a protein containing amino acid 114–250 plus an added start Met (amino acid 113) and the C-terminal Cys (amino acid 251). Our Galectin-3 C251-CRD contains only 138 amino acids (114–251) if the Met is cleaved. The difference at the C terminus arises from our addition of cysteine-251. From the similarity in shifts of peaks from other residues, we can conclude that the CRD conformation was not changed significantly through the introduction of a cysteine to the C terminus.
Figure 2.

Overlay of the 1H-15N HSQC spectrum of Galectin-3 C251-CRD (amino acids 114–251) (black) with the native Galectin-3 CRD (red). The spectrum of Galectin-3 C251-CRD was collected at 800 MHz, as a 1 mM sample in phosphate buffer at pH 7.4. The spectrum of the native Galectin-3 CRD was reconstructed based on the deposited chemical shifts from BMRB (accession no. 4909). Amino acids 108–113 were not plotted here for easy comparison. The blue points represent peaks where no partner can be found.
With respect to the issue of modification of the internal cysteine we can also draw a definitive conclusion. Cysteine (C173) is actually buried and inaccessible to the solvent based on the crystal structure (Seetharaman et al. 1998) and an NACCESS calculation (<5%) (S.J. Hubbard and J.M. Thornton, University College, London). So, we have good reason to believe that this cysteine would not readily alkylate under native folded conditions; previous evidence also supports this contention (Frigeri et al. 1990). We used a combination of mass spectrometry and NMR methods to prove that the reaction occurred only at the C-terminal cysteine. Figure 3A shows the molecular ion region of a LC-MS spectrum for the C251 protein before reaction. The major peak is at an appropriate mass for the protein. The minor peak to higher mass is very likely from reaction with some residual β-mercaptoethanol in the buffer. Figure 3B shows the protein after reaction of the C251 protein with a 1:2 ratio of protein to PMTS as described in the Materials and Methods section. The major peak now appears displaced to a higher mass by 76 Da. This is very close to the theoretical value (74 Da) expected for addition of a single thiopropane chain. Only a very minor peak occurs at a mass that could correspond to the addition of two thiopropane groups. This suggests that to a good approximation, only one of the two cysteines is reacting.
Figure 3.

LC-MS spectra. (A) 15N-Galectin-3 C251-CRD (MW ∼15,852 Da) in phosphate buffer (75 mM KH2PO4, 75 mMNaCl, 2 mM EDTA, 5 mM NaN3, 1 mM DTT, 4 mM β-mecaptoethanol at pH 7.4). (B) 15N-Galectin-3 S-propyl-C251-CRD (MW ∼15,926 Da) in phosphate buffer (75 mM KH2PO4, 75mM NaCl, 2 mM EDTA, 5 mM NaN3, no DTT or β-mecaptoethanol at pH 7.4).
The particular cysteine involved, C251 or C173, can easily be established using NMR spectra. 1H-15N HSQC spectra were collected for both Galectin-3 S-propyl-C251-CRD and Galectin-3 C251-CRD. These are superimposed in Figure 4. The cross-peak arising from C173 is easily assigned based on published assignments for the native protein. There is essentially no shift of this cross-peak between spectra. Three peaks were observed to have chemical shift changes. Two of them are new peaks that arose on addition of C251 to the native protein; one is probably I250, which was not assigned in the native protein. M249, the residue two removed from the new C terminus, also has a small chemical shift change after the alkylthiolation. This is strong evidence that only the newly added cysteine (C251) is involved in the alkylthiolation and that the remainder of the protein is not perturbed by the addition of the thiopropane chain.
Figure 4.

Overlay of the 1H-15N HSQC spectra of 1 mM Galectin-3 C251-CRD (red) on spectra of Galectin-3 S-propyl-C251-CRD (black) in 75 mM phosphate buffer (pH 7.4). Spectra recorded at 25°C with a 1H resonance frequency of 800 MHz. C173 chemical shift remains unchanged. Three peaks (blue squares) were observed to have chemical shift changes where M249 shows a small degree of chemical shift variance and the other two were new peaks after the addition of C251.
Assessment of protein alignment in a bicelle medium
We had anticipated that addition of a thiopropane chain to the Galectin-3 CRD would increase association with the bicelles of our orientation media and enhance the size of RDCs for both the protein and the associated ligand. It is useful to first evaluate this increase for the protein, both to validate association and to provide data that can be used to yield an orientation for the protein that can be used as a reference for the orientation of the ligand. Figure 5 depicts the variation in 1H-15N RDCs measured for Galectin-3 C251-CRD (Fig. 5A) and Galectin-3 S-propyl-C251-CRD (Fig. 5B) in a 3% C12E5 bicelle medium. Note that the RDCs measured in the Galectin-3 S-propyl-C251-CRD and the Galectin-3 C251-CRD are significantly different and that the range of RDCs for Galectin-3 S-propyl-C251-CRD (±40 Hz) is almost three times that seen in the C251-Galectin-3-CRD (±15 Hz) sample.
Figure 5.

1H-15N RDC distribution plots. (A) RDCs from Galectin-3 C251-CRD; (B) RDCs from S-propyl-C251-Galectin-3 CRD. Forty 1H-15N RDCs were collected and plotted against amino acid numbers 125–247 from left to right.
Analysis of these data was conducted using the program REDCAT (Valafar and Prestegard 2004) and the crystal structure of Galectin-3 CRD (PDB 1A3K; Seetharaman et al. 1998). Given a molecular structure and RDC data, REDCAT uses a singular-value decomposition algorithm to solve for the elements of an order tensor that best represents the RDC data. It then diagonalizes the tensor to give principal-order parameters and orientations of axes of a principal alignment frame. It does this thousands of times, randomly selecting combinations of RDCs within estimated error limits of measurements. In our case we used 40 RDCs, excluding measurements from highly overlapped regions and regions known to be in flexible loops. An error estimate of 2 Hz was used for Galectin-3-CRD-C251 and 7 Hz for Galectin-3 S-propyl-C251-CRD. These errors represent both structural imperfections (estimated at 10% of the RDC range) and estimated experimental errors. The best set of principal-order parameters found for the thiopropyl protein are Sxx (−2.7E-06), Syy (1.2E-03), and Szz (−1.2E-03). These are approximately three times the values calculated from data on the unmodified protein. This again confirms enhanced alignment.
The distribution of directions for allowed alignment frames are depicted in Figure 6A for Galectin-3 S-propyl-C251-CRD. The spread gives an indication of the precision in determination of orientation of protein alignment. REDCAT can also back-calculate RDCs given elements of an order tensor and a probable structure. For the Galectin-3 S-propyl-C251-CRD, a plot of experimental versus back-calculated RDCs is given in Figure 6B. The correlation is reasonably good. This correlation can be quantitated in terms of a Q factor (Cornilescu and Bax 2000; Bax 2003); this is 0.21 for our case, something representative of agreement with the structure to within 2 Å over the backbone atoms (Bax 2003). This is confirmation that the modified protein is not significantly structurally perturbed.
Figure 6.

(A) Sauson-Flamsted projection of direction distributions for axes of allowed alignment frames; (B) correlation plot of experimentally measured RDCs vs. back-calculated RDCs of Galectin-3 S-propyl-C251-CRD based on the crystal structure of Galectin-3 CRD using REDCAT.
Assessment of ligand alignment
Ligand alignment can be assessed by measurement of one-bond 13C-1H and intra-ring 1H-1H RDCs. 13C-1H couplings are easily measured with an f1-coupled 13C-1H HSQC, even at natural abundance, because the ligand is in large excess over protein and an averaged spectrum is measured. In lactose we expect to see 14 one-bond 13C-1H couplings, seven from the glucose ring and seven from the galactose ring. There may be some resolution of sets from the α and β anomers, especially for sites near the anomeric carbon of glucose. We do not expect couplings to be different except at the anomeric carbon, because we do not expect them to bind with significant differences, as the anomeric site is distant from the part of galactose recognized by Galectin-3. While the number of couplings that could be measured is significant, five of the 13C-1H vectors in β-glucose and four in galactose are nearly parallel to one another because they occupy axial positions on the preferred 1C4 ring conformation. Also, two more vectors in each ring (H6-C6) are hard to use because of potential internal motions. α-Glucose is somewhat better than β-glucose because of the equatorial anomeric 13C-1H pair. However, the minimal number of completely independent vectors (four) necessitated an attempt to measure intra-ring 1H-1H couplings. This was done with a constant time COSY experiment (Tian et al. 1999).
Examples of segments from the coupled HSQC spectra are presented in Figure 7 for the C4-H4 and C5-H5 pairs from the galactose ring. Doublets are shown for the ligand under isotropic conditions (Fig. 7A), aligned in the absence of protein (Fig. 7B), aligned in the presence of Galectin-3 C251-CRD (Fig. 7C), and aligned in the presence of Galectin-3 S-propyl-C251-CRD (Fig. 7D). The RDCs (seen as the difference between isotropic and aligned conditions) are obviously measurable but small for lactose in the absence of protein. They remain small and not very different for lactose in the presence of Galectin-3 C251-CRD. This is the result of the influence of the excess free lactose in the average RDC measured and the fact that the RDCs are not significantly different in bound and free forms of lactose for this case. The situation is different in the presence of Galectin-3 S-propyl-C251-CRD. The couplings are larger and, while the lines broaden, couplings can still be accurately measured. More importantly, the observed RDCs are heavily weighted by bound-state RDCs in the presence of the propyl modification.
Figure 7.

Examples of measurement couplings of lactose from coupled 1H-13C HSQC spectra. (A) Lactose in phosphate buffer; (B) lactose in the absence of protein in 3%C12E5; (C) lactose in the presence of Galectin-3 C251-CRD in 3% C12E5 10:1 ratio; (D) lactose in the presence of Galectin-3 S-propyl-C251-CRD in 3%C12E5 10:1 ratio. All spectra were collected at 298 k with a proton resonance frequency of 800 MHz. All samples were prepared using 75 mM phosphate buffer (pH 7.4).
Table 1 presents a summary of ligand RDCs. The bound-state values have been separated from the average measurements using published data on lactose binding constants (Seetharaman et al. 1998). We have used REDCAT and an energy minimized geometry of lactose (ϕ = 50°, ψ = −116°) generated using the GLYCAM_04 force field (R.J. Woods, University of Georgia; http://glycam.ccrc.uga.edu/index.html) to extract an order tensor and back-calculate RDCs from the bound-state data. Note that except for one case where measurement is difficult because of overlap with media resonances, agreement is very good. Also note that the principal-order parameters extracted (−1.0E-03 for Szz) agree very well with the order parameters extracted for the bicelle-bound Galectin-3 S-propyl-C251-CRD itself. This suggests that the lactose is well modeled by the conformation used and that there is relatively little motion in the binding site.
Table 1.
RDCs for free-state and bound-state lactose

Discussion
Orientation of Galectin-3 S-propanyl-C251-CRD at bicelle surfaces
The 1H-15N RDC data collected on Galectin-3 S-propyl-C251-CRD in an oriented bicelle medium provide both confirmation of retention of an active structure for the modified protein and information on the actual orientation of the protein in the medium. The latter is a useful piece of information in understanding the nature of the protein's interaction with the medium and in providing a reference for understanding ligand orientation. The level of order is nearly equal in magnitude (but opposite in sign) for the Z and Y axes, but order along the Z axis of the principal alignment frame (PAF) is slightly greater. The order parameter for this axis is also negative. Order parameters derived from RDCs can be considered to be the average of (3cos2 θ′ − 1)/2, where θ′ is the instantaneous angle between a molecular PAF axis and the magnetic field. Hence, to make this negative for the Z axis, the angle relative to the magnetic field must have a preference for 90°. Bilayer-like elements are also known to orient with their normals near 90° with respect to the magnetic field. As we believe the elements of the C12E5 medium are bilayer-like, we can construct a model for protein–bilayer interaction as depicted in Figure 8. The PAF is defined in the coordinate system of the molecule (PDB 1A3K) and is depicted as the set of axes in the figure. The bilayer is drawn with its normal parallel to the PAF Z axis.
Figure 8.

Model for association between an alkylated protein and a bilayer-like medium. The propyl chain embeds into the hydrophobic inner layer. The structure of the protein was created based on known crystal structure (1A3K). Chimera (Pettersen et al. 2004) was used to optimize propyl bond angles and make the graphic.
Note that the orientation of the molecule projects the C-terminal propyl chain along the bilayer normal, in a manner that would allow insertion into the hydrophobic core. Actually we cannot distinguish this orientation from ones produced by rotation of the protein by 180° about the X or the Y axis of the PAF on the basis of RDCs alone, but these other structures would seem physically unreasonable. The structure is certainly not static or permanently fixed to the bilayer. If it were, the order parameters would approach 1 × 10⁻¹ instead of 1 × 10⁻³. There is very likely an equilibrium between free and associated states. The level of order can obviously be increased by modifying the protein with longer alkyl chains, but these would produce more line broadening and may prohibit collecting data that allow determination of protein orientation.
Geometry of bound lactose
The RDC data on bound lactose allow determination of molecular orientations as well. As mentioned above, the similarity in magnitudes of order parameters suggests minimal mobility of the ligand within the binding pocket and opens the possibility of building a model with lactose docked in the protein binding site. In principle, orientational constraints are provided by the knowledge that the PAFs, as seen from the point of view of the two molecules, must coincide if they are part of the same rigid complex. Thus, the ligand can be positioned on the protein by translational movement of a rigidly oriented body to achieve van der Waals contact with residues known to be in the binding site. A representative structure generated by rigid body translation, consistent with superposition of the best least square alignment frames, is depicted in Figure 9. The picture shows good van der Waals contacts between a tryptophan and the more hydrophobic sides of galactose and glucose. H-bonding contacts with the 4-hydroxyl have been well maintained. In both the crystal structure and our docked structure, the C-4 hydroxyl group is in a position where it can form hydrogen bonds with H158, R162, and D160. There are, however, some differences outside of this primary interaction region. In particular, the lactose is rotated by ∼30° toward a contact with tryptophan in our structure. Of course, the ligands are not identical in that the crystal structure contained an N-acetyl-lactosamine and the docked structure has lactose. In the crystal structure, one can see interactions between the acetyl group and the protein that may be leading to this orientational difference. Deviations can also stem from imprecision of RDC data.
Figure 9.

Lactose–Galectin-3 CRD complex docked using RDCs constraints.
RDC data can be more systematically combined with other data to explore the range of possible docked structures using programs such as HADDOCK (Dominguez et al. 2003). HADDOCK can not only do rigid body docking but can refine structures by relaxing side-chain geometry in the binding site. HADDOCK was initially developed for docking protein–protein complexes but, with slight modification, it can also work for protein–carbohydrate complexes. The initial rigid body stage allows translation of the ligand relative to a protein under orientational constraints from RDCs. The molecule is translated to optimize a list of contacts and noncontacts between active and passive residues. For the ligand, glucose and galactose residues were considered as active residues. The active and passive residues in the protein were identified based on the crystal structure of Galectin-3 CRD (PDB 1A3K; Seetharaman et al. 1998) and the approach of residues to the C4 region of the terminal galactose.
In the subsequent simulated annealing step, a single oxygen (C4 hydroxyl) was constrained with three “NOE” distances to retain hydrogen bonding interactions seen in the crystal structure; the glycosidic torsion angles in lactose were constrained at their crystal structure torsions; and RDC constraints were applied using a harmonic potential with a 14-Hz flat bottom potential. The annealed structures were then refined in a bath of discrete water molecules. The docking and refinement was repeated, with and without RDC constraints, starting from a series of random positions and orientations. Heavy atoms of the ligand (excluding O6) in 15 low-energy structures having no RDC violations superimpose to an RMSD of 0.4 Å with RDC constraints and to an RMSD of 1.0 Å without RDC constraints. The lactose position and orientation of the lowest energy structure produced in this way is close to that of N-acetyl lactosamine in the crystal structure (RMSD of 0.6 Å). This suggests that errors in RDCs are large enough to allow a ligand geometry close to that seen in the crystal structure, at least if modest distortions of ligand geometry are allowed in the final water refinement step.
Most importantly, we have demonstrated an ability to amplify bound-state RDCs in situations where ligands are exchanging rapidly on and off a protein and only average parameters are measured. This puts RDC measurements on a par with STD and tr-NOE measurements commonly used to determine bound-state geometries of protein ligands. Not only is the bound state emphasized, but the sensitivity of measurements is adequate to examine ligands that have not been isotopically labeled, even when the primary data are 13C-1H couplings. The RDC information is orientational in nature as opposed to distance-dependent. For oligosaccharide ligands this is useful when few NOEs across glycosidic bonds can be observed. Even though we have not done so here, glycosidic torsion angles in the bound state could be determined from the orientation of individual rings in an oligosaccharide when sufficient data are available.
The enhanced orientation in our case is obtained by modifying the protein by mutagenesis and subsequent addition of a short alkyl chain. There are other strategies that could parallel this in principle (Wohnert et al. 2003; Ikegami et al. 2004), but the ability to vary association by lengthening the alkyl chain is important. The larger the association, the more the bound-state data for the ligand will dominate, and the less protein in the ligand–protein mix can be used. There will, of course, be limits to application if the ligands themselves are highly hydrophobic and strongly associate with the orienting medium, but there are other aspects that broaden application. One important area of application is where bound ligand geometry, rather than orientation relative to the protein, is of interest. Here, data on the protein do not need to be collected; the protein does not need to be isotopically labeled, and it can be very strongly oriented.
Materials and methods
Preparation of the Galectin-3 C251-CRD plasmid
Since we are interested in only the carbohydrate recognition domain (CRD) of Galectin-3, the polymerase chain reaction (PCR) was applied to amplify the desired sequence from a PET3C plasmid that encodes intact Galectin-3 (Massa et al. 1993) to generate a construct encoding mainly the CRD (amino acids 114–250) with a new start site (Met) replacing amino acid 113, and a new cysteine introduced at the C terminus (position 251) by adding the code for this amino acid to the appropriate primer. Two restriction sites (NdeI and BamHI) are also included in the primers. The primers used in PCR were 5′-AACGAGCGGCATATGCTGATTGTGCC-3′ (forward) and 5′-GCGGGATCCTCAACATATCATGG-3′ (reverse) (IDT) (Massa et al. 1993).
The amplified PCR product and vector PET9a (Novagen) were double-digested by NdeI and BamHI and purified using a Qiaquick Gel Extraction Kit (Qiagen). The double-digested Galectin-3 CRD gene was then ligated into the PET9a vector with a molar ratio of the Galectin-3 CRD gene and the PET9a vector of 3:1 using T4 DNA ligase (Promega).
Protein expression and purification
Galectin-3 C251-CRD was expressed in Escherichia coli BL21(DE3) cells using the following protocol for expressing the 15N isotopically labeled protein: After transformation with the plasmids containing the Galectin-3 C251-CRD gene and plating on Kanamycin agar plates, one colony was selected to inoculate 50 mL of LB medium containing 100 μg/mL Kanamycin. This was incubated at 37°C overnight with shaking at 225–250 rpm. The cells were harvested and transferred to 1-L presterilized M9 minimal media with 1 g of 15NH4Cl (added for 15N labeling). The medium also contained 6.5 g of Na2HPO4, 3 g of KH2PO4, 0.5 g of NaCl, 1 mM MgSO4, 0.1 mM CaCl2, and 4 g glucose. The culture was then incubated in a 37°C incubator with shaking at 225–250 rpm. Monitoring cell growth by measuring the absorbance at wavelength 600 nm, 1 mL of 1mM isopropyl-β,D-thiogalactopyranoside was added to induce the protein expression when the absorbance reached 0.9 ± 0.1. The cells were then grown for additional 2 h and were spun down in a Sorvall SL-34 rotor at 5000 rpm for 30 min.
To extract the protein, the harvested cell pellet was resuspended in a lysis buffer containing 75 mM KH2PO4, 75 mM NaCl, 2 mM EDTA, 5 mM NaN3, 1 mM DTT, and 4 mM β-mecaptoethanol (pH 7.4) (Leffler et al. 1989). The lysates were then spun down in an ultracentrifuge (Beckman) at 30,000 rpm for 30 min and the supernatant was loaded onto a lactosyl-agarose affinity column (Leffler et al. 1989). The column was washed with 250 mL of lysis buffer to remove extraneous proteins and Galectin-3 C251-CRD was eluted with 100 mL of lysis buffer plus 300 mM lactose. The protein was concentrated using an Amicon concentrator (Millipore) and the concentrated solution was stored at −20°C. Typically 25–40 mg of pure protein per L can be obtained.
Preparation of Galectin-3 S-propyl-C251-CRD
Protein alkylthiolation had to be performed under reductant-free conditions. Hence, the reductants present during isolation (DTT and β-mecaptoethanol) were first removed by ultracentrifugal filtration (Millipore) using reductant-free, N2-saturated buffer C (75 mM KH2PO4, 75 mM NaCl, 2 mM EDTA,5 mM NaN3 at pH 7.4); the initial sample (4 mL) was reduced to 0.5 mL, and 3.5 mL of buffer C was added in 3–4 successive cycles. Propyl methanethiolsulfonate (PMTS) (Toronto Research Chemicals) was dissolved in the same reductant-free buffer C. The protein was then mixed with PMTS in a stoichiometry of 1:2 and incubated at room temperature for 10–15 min. The excess PMTS was removed by buffer exchange (reductant-free buffer C) using ultracentrifugal filtration (Millipore) immediately after the reaction. One of the advantages of this reaction is the ability to recover protein in its native form by adding appropriate reductants to cleave the newly formed disulfide bond.
The extent of reaction was assayed by LC-MS. A Perkin Elmer Sciex API I plus quadrupole mass spectrometer (Applied Biosystems) was used for the assay. A molecular ion was easily identified for both monomeric and dimeric species. There was an additional peak displaced by 74 mass units for the monomeric species. This was characteristic of addition of a single thiopropane group. Purification by size exclusion chromatography could be used to remove the small amount of dimer; however, this was not deemed necessary for the current application.
NMR spectroscopy
All NMR experiments were performed on a Varian Inova 800MHz spectrometer equipped with a cryogenic triple resonance probe. Two parallel experiments were performed for each sample: one in isotropic phosphate buffer (75 mM KH2PO4, 75 mM NaCl, 2 mM EDTA, 5 mM NaN3 at pH 7.4, 10% 2H2O) and one in an aligned 3%C12E5 bicelle medium prepared in the same buffer. The aligned medium was made approximately as described by Ruckert and Otting (2000). In general, 50 μl of C12E5 (Sigma) was dissolved in 500 μl of phosphate buffer and hexanol (∼12 μl) was added in 3-μl increments until the medium became clear and viscous. An equal volume of protein in buffer was added to produce a final sample ∼0.5 mM in protein and 3% in bicelle. For measurements on ligand, unlabeled lactose (Sigma) was first dissolved in phosphate buffer to make a stock solution at 200 mM and then added to protein containing samples to reach a final concentration of 5 mM. A control set of samples containing just lactose in isotropic buffer and bicelle medium was also prepared. Homogeneous alignment of C12E5 containing samples was ascertained by monitoring the deuterium quadrupole splitting of deuterons on 2H1HO in all cases.
For the measurement of 1H-15N backbone RDCs of the protein, an interleaved set of 1H-15N HSQC and TROSY experiments was run (Kay et al. 1992; Kontaxis et al. 2000). Offsets of paired peaks in the 15N direction were taken to be half the 15N-1H coupling. Differences in measurements in isotropic and aligned sets were taken to be RDCs. Normally 256 t1 quadrature pairs were acquired over 3000 Hz with 36 acquisitions each. The entire acquisition required 12 h.
For the measurement of ligand 1H-13C RDCs, a sensitivity-enhanced 1H-13C coupled HSQC was used (Schleucher et al. 1994). Three sets of experiments were carried out to get the dipolar couplings of the ligands; these included an isotropic and aligned spectrum of lactose only and an aligned spectrum of the lactose–protein mixture. Generally, 512 t1 points over 9500 Hz were acquired. Acquisitions were over 18 h with 48 acquisitions per t1 point. These long acquisitions are required since all 1H-13C couplings are measured at nature abundance.
In addition to the collection of 1H-13C couplings, 1H-1H couplings were obtained using the intensity-based constant-time 1H-1H COSY experiment (Tian et al. 1999). An array of constant times from 0.1 sec to 0.42 sec with time increment 0.04 sec was used for collecting the 1H-1H couplings of lactose alone, both in phosphate buffer and aligned in 3% C12E5 bicelle medium. For the 1H-1H couplings of a lactose–protein mixture, an array of constant times from 0.018 sec to 0.153 sec with time increment 0.015 sec was used. Spectra used 32 t1 quadrature pairs over 2000 Hz, and acquisitions required 14 h with 30 acquisitions per t1 pair.
All the data were processed using NMRPipe (Delaglio et al. 1995). For measuring the 1H-15N couplings of the protein, NMRPipe auto-peak picking and Nonlinear Lineshape Fitting (nLinLS) were used. Typical errors in the final RDCs are ±0.5 Hz as given by error analysis of this program. For measuring the 1H-13C couplings of the ligands, the Bayesian fitting program, XRAMBO (Andrec and Prestegard 1998), was used to extract splittings from the f1 dimension of the coupled spectra. To estimate errors, several doublets were projected onto the indirect axis, and the resulting 1D spectra fit to Gaussian lines using the Origin fitting program. Error estimates given by the program for peak positions in the aligned spectra are largest (±0.2 Hz). When propagated to the final RDCs, including errors for the isotropic measurements, errors are estimated at ±0.5 Hz. For 1H-1H couplings, the CT-COSY was processed in Magnitude mode, and the data were fit to the function, Icross/Iauto = A|tan((J + D)*π*t)| using routines in Matlab 6.0. Here Icross and Iauto are the intensity of cross-peaks and auto-peaks, respectively. The precision of couplings is estimated at ±0.1 Hz. Errors in bound state couplings, as given in Table 1 are obtained by standard error propagation through Equation 2.
Analysis of RDCs in terms of molecular structure and orientation was conducted with the program REDCAT (Valafar and Prestegard 2004). The molecular coordinates from the crystal structure of the wild--type CRD (PDB 1A3K; Seetharaman et al. 1998) were used with hydrogens being added to the structure prior to analysis using the program Chimera Pettersen et al. 2004).
Acknowlegments
We thank Dr. Ron Seidel, who was involved in the early stages of this work. His fruitful suggestions are gratefully acknowledged. This work was supported by NIH grants GM33225 and RR05351 to J.H.P. and grant 12165 from the Swedish Research Council to H.L.
Footnotes
Reprint requests to: James H. Prestegard, Complex Carbohydrate Research Center, University of Georgia, 315 Riverbend Road, Athens, GA 30602, USA; e-mail: jpresteg@ccrc.uga.edu; fax: (706) 542-4412.
Article published online ahead of print. Article and publication date are at http://www.proteinscience.org/cgi/doi/10.1110/ps.051994306.
Abbreviations: NMR, nuclear magnetic resonance; NOE, nuclear Overhauser effect; RDC, residual dipolar coupling; HSQC, heteronuclear single quantum coherence; C12E5, pentaethylene glycol monododecyl ether; PMTS, propyl methanethiolsulfonate; CRD, carbohydrate recognition domain.
References
- Andrec M. and Prestegard J.H. 1998. Metropolis Monte Carlo implementation of Bayesian time-domain parameter estimation: Application to coupling constant estimation from antiphase multiplets. J. Magn. Reson. 130: 217–232. [DOI] [PubMed] [Google Scholar]
- Bax A. 2003. Weak alignment offers new NMR opportunities to study protein structure and dynamics. Protein Sci. 12: 1–16. [DOI] [PMC free article] [PubMed] [Google Scholar]
- Bruice T.W. and Kenyon G.L. 1985. Alkyl alkanethiolsulfonate sulfhydryl-reagents: β-sulfhydryl-modified derivatives of L-cysteine as substrates for trypsin and α-chymotrypsin. Bioorg. Chem. 13: 77–87. [Google Scholar]
- Campbell A.P. and Sykes B.D. 1993. The two-dimensional transferred nuclear Overhauser effect: Theory and practice. Annu. Rev. Biophys. Biomol. Struct. 22: 99–122. [DOI] [PubMed] [Google Scholar]
- Cornilescu G. and Bax A. 2000. Measurement of proton, nitrogen, and carbonyl chemical shielding anisotropies in a protein dissolved in a dilute liquid crystalline phase. J. Am. Chem. Soc. 122: 10143–10154. [Google Scholar]
- Delaglio F., Grzesiek S., Vuister G.W., Zhu G., Pfeifer J., Bax A. 1995. NMRPipe: A multidimensional spectral processing system based on Unix pipes. J. Biomol. NMR 6: 277–293. [DOI] [PubMed] [Google Scholar]
- Dominguez C., Boelens R., Bonvin A.M. 2003. HADDOCK: A protein–protein docking approach based on biochemical or biophysical information. J. Am. Chem. Soc. 125: 1731–1737. [DOI] [PubMed] [Google Scholar]
- Frigeri L.G., Robertson M.W., Liu F.T. 1990. Expression of biologically active recombinant rat Ige-binding protein in Escherichia coli. J. Biol. Chem. 265: 20763–20769. [PubMed] [Google Scholar]
- Gaemers S. and Bax A. 2001. Morphology of three lyotropic liquid crystalline biological NMR media studied by translational diffusion anisotropy. J. Am. Chem. Soc. 123: 12343–12352. [DOI] [PubMed] [Google Scholar]
- Houzelstein D., Goncalves I.R., Fadden A.J., Sidhu S.S., Cooper D.N., Drickamer K., Leffler H., Poirier F. 2004. Phylogenetic analysis of the vertebrate galectin family. Mol. Biol. Evol. 21: 1177–1187. [DOI] [PubMed] [Google Scholar]
- Ikegami T., Verdier L., Sakhaii P., Grimme S., Pescatore B., Saxena K., Fiebig K.M., Griesinger C. 2004. Novel techniques for weak alignment of proteins in solution using chemical tags coordinating lanthanide ions. J. Biomol. NMR 29: 339–349. [DOI] [PubMed] [Google Scholar]
- Jain N.U., Noble S., Prestegard J.H. 2003. Structural characterization of a mannose-binding protein-trimannoside complex using residual dipolar couplings. J. Mol. Biol. 328: 451–462. [DOI] [PubMed] [Google Scholar]
- Kay L.E., Keifer P., Saarinen T. 1992. Pure absorption gradient enhanced heteronuclear single quantum correlation spectroscopy with improved sensitivity. J. Am. Chem. Soc. 114: 10663–10665. [Google Scholar]
- Koenig B.W., Mitchell D.C., Konig S., Grzesiek S., Litman B.J., Bax A. 2000. Measurement of dipolar couplings in a transducin peptide fragment weakly bound to oriented photo-activated rhodopsin. J. Biomol. NMR 16: 121–125. [DOI] [PubMed] [Google Scholar]
- Kontaxis G., Clore G.M., Bax A. 2000. Evaluation of cross-correlation effects and measurement of one-bond couplings in proteins with short transverse relaxation times. J. Magn. Reson. 143: 184–196. [DOI] [PubMed] [Google Scholar]
- Leffler H., Masiarz F.R., Barondes S.H. 1989. Soluble lactosebinding vertebrate lectins: A growing family. Biochemistry 28: 9222–9229. [DOI] [PubMed] [Google Scholar]
- Lipsitz R.S. and Tjandra N. 2004. Residual dipolar couplings in NMR structure analysis. Annu. Rev. Biophys. Biomol. Struct. 33: 387–413. [DOI] [PubMed] [Google Scholar]
- Mascia M.P., Trudell J.R., Harris R.A. 2000. Specific binding sites for alcohols and anesthetics on ligand-gated ion channels. Proc. Natl. Acad. Sci. 97: 9305–9310. [DOI] [PMC free article] [PubMed] [Google Scholar]
- Massa S.M., Cooper D.N.W., Leffler H., Barondes S.H. 1993. L-29, an endogenous lectin, binds to glycoconjugate ligands with positive cooperativity. Biochemistry 32: 260–267. [DOI] [PubMed] [Google Scholar]
- Mayer M. and Meyer B. 1999. Characterization of ligand binding by saturation transfer difference NMR spectroscopy. Angew. Chem. Int. Ed. 38: 1784–1788. [DOI] [PubMed] [Google Scholar]
- Meyer B. and Peters T. 2003. NMR spectroscopy techniques for screening and identifying ligand binding to protein receptors. Angew. Chem. Int. Ed. 42: 864–890. [DOI] [PubMed] [Google Scholar]
- Moore J.M. 1999. NMR techniques for characterization of ligand binding: Utility for lead generation and optimization in drug discovery. Biopolymers 51: 221–243. [DOI] [PubMed] [Google Scholar]
- Moseley H.N.B., Lee W., Arrowsmith C.H., Krishna N.R. 1997. Quantitative determination of conformational, dynamic, and kinetic parameters of a ligand-protein/DNA complex from a complete relaxation and conformational exchange matrix analysis of intermolecular transferred NOESY. Biochemistry 36: 5293–5299. [DOI] [PubMed] [Google Scholar]
- Pettersen E.F., Goddard T.D., Huang C.C., Couch G.S., Greenblatt D.M., Meng E.C., Ferrin T.E. 2004. UCSF Chimera—A visualization system for exploratory research and analysis. J. Comput. Chem. 25: 1605–1612. [DOI] [PubMed] [Google Scholar]
- Post C.B. 2003. Exchange-transferred NOE spectroscopy and bound ligand structure determination. Curr. Opin. Struct. Biol. 13: 581–588. [DOI] [PubMed] [Google Scholar]
- Poveda A. and Jimenez-Barbero J. 1998. NMR studies of carbohydrate-protein interactions in solution. Chem. Soc. Rev. 27: 133–143. [Google Scholar]
- Prestegard J.H., Bougault C.M., Kishore A.I. 2004. Residual dipolar couplings in structure determination of biomolecules. Chem. Rev. 104: 3519–3540. [DOI] [PubMed] [Google Scholar]
- Ruckert M. and Otting G. 2000. Alignment of biological macromolecules in novel nonionic liquid crystalline media for NMR experiments. J. Am. Chem. Soc. 122: 7793–7797. [Google Scholar]
- Schleucher J., Schwendinger M., Sattler M., Schmidt P., Schedletzky O., Glaser S.J., Sorensen O.W., Griesinger C. 1994. A general enhancement scheme in heteronuclear multidimensional NMR employing pulsed-field gradients. J. Biomol. NMR 4: 301–306. [DOI] [PubMed] [Google Scholar]
- Seetharaman J., Kanigsberg A., Slaaby R., Leffler H., Barondes S.H., Rini J.M. 1998. X-ray crystal structure of the human galectin-3 carbohydrate recognition domain at 2.1-Å resolution. J. Biol. Chem. 273: 13047–13052. [DOI] [PubMed] [Google Scholar]
- Smith D.J., Maggio E.T., Kenyon G.L. 1975. Simple alkanethiol groups for temporary blocking of sulfhydryl groups of enzymes. Biochemistry 14: 766–771. [DOI] [PubMed] [Google Scholar]
- Tian F., Bolon P.J., Prestegard J.H. 1999. Intensity-based measurement of homonuclear residual dipolar couplings from CT-COSY. J. Am. Chem. Soc. 121: 7712–7713. [Google Scholar]
- Umemoto K. and Leffler H. 2001. Letter to the Editor: Assignment of 1H, 15N and 13C resonances of the carbohydrate recognition domain of human galectin-3. J. Biomol. NMR 20: 91–92. [DOI] [PubMed] [Google Scholar]
- Umemoto K., Leffler H., Venot A., Valafar H., Prestegard J.H. 2003. Conformational differences in liganded and unliganded states of Galectin-3. Biochemistry 42: 3688–3695. [DOI] [PubMed] [Google Scholar]
- Valafar H. and Prestegard J.H. 2004. REDCAT: A residual dipolar coupling analysis tool. J. Magn. Reson. 167: 228–241. [DOI] [PubMed] [Google Scholar]
- Wohnert J., Franz K.J., Nitz M., Imperiali B., Schwalbe H. 2003. Protein alignment by a coexpressed lanthanide-binding tag for the measurement of residual dipolar couplings. J. Am. Chem. Soc. 125: 13338–13339. [DOI] [PubMed] [Google Scholar]