Abstract
We have defined the free-energy profile of the Src SH2 domain using a variety of biophysical techniques. Equilibrium and kinetic experiments monitored by tryptophan fluorescence show that Src SH2 is quite stable and folds rapidly by a two-state mechanism, without populating any intermediates. Native state hydrogen–deuterium exchange confirms this two-state behavior; we detect no cooperative partially unfolded forms in equilibrium with the native conformation under any conditions. Interestingly, the apparent stability of the protein from hydrogen exchange is 2 kcal/mol greater than the stability determined by both equilibrium and kinetic studies followed by fluorescence. Native-state proteolysis demonstrates that this “super protection” does not result from a deviation from the linear extrapolation model used to fit the fluorescence data. Instead, it likely arises from a notable compaction in the unfolded state under native conditions, resulting in an ensemble of conformations with substantial solvent exposure of side chains and flexible regions sensitive to proteolysis, but backbone amides that exchange with solvent ∼30-fold slower than would be expected for a random coil. The apparently simple behavior of Src SH2 in traditional unfolding studies masks the significant complexity present in the denatured-state ensemble.
Keywords: hydrogen exchange, protein folding, SH2 domain, proteolysis, unfolded state, protein stability
Determining a protein's structure provides a wealth of information about its function, but the picture it provides is incomplete. Proteins are dynamic molecules, and under physiological conditions they can populate a range of high-energy conformations ranging from local fluctuations to completely unfolded forms. At equilibrium, the relative populations of these conformations are determined by their free energies, according to a Boltzmann distribution. These populations, and the energetic barriers to their interconversion, make up a protein's energy landscape. A complete picture of protein function demands that we understand the entire energy landscape, not just the native structure.
The myriad non-native species that make up a protein's energy landscape are important for a variety of reasons. Locally distorted conformations and motions between them may play a key role in protein function, modulating enzymatic activity (Tousignant and Pelletier 2004) and allowing for allosteric regulation (Luque et al. 2002). The ability to populate an ensemble of conformations rather than a single, rigid native state also gives a single protein the flexibility needed to recognize and tightly bind a range of natural ligands (Ma et al. 2002). Such locally distorted species, however, are not the only relevant high-energy conformations in the native state ensemble of a protein; partially and globally unfolded species are also populated. While the unfolded state of a protein lacks the well-defined structure usually required to carry out specific reactions, interactions in the unfolded state make a significant, and often ignored, contribution to the stability of the native state. Native state stability is defined by the energetic difference between the native and unfolded states. Therefore, stability can be modulated by altering interactions in either the native or unfolded state. Interactions in the unfolded state have been recently demonstrated to modulate stability (Mok et al. 2001; Cho and Raleigh 2005), folding and unfolding rates (Cho et al. 2004; Trefethen et al. 2005), and thermostability (Guzman-Casado et al. 2003; Robic et al. 2003). A better understanding of the unfolded states of proteins is vital to understanding protein folding, stability, and function.
The unfolded states of proteins have often been modeled simply as random coils. This approach has the advantage of being conceptually and computationally simple, and successfully predicts properties like radii of gyration (Kohn et al. 2004) and backbone 3JHNα coupling constants (Smith et al. 1996) for many natural proteins, although these measures are crude and may not distinguish between random coils and models with significant structure (Fitzkee and Rose 2004). There is mounting evidence that the unfolded states of at least some proteins do not conform to the random coil model. pH titrations have revealed persistent, long-range electrostatic interactions in the N-terminal domain of ribosomal protein L9 (Cho et al. 2004). NMR nuclear Overhauser effect (NOE) spectroscopy has detected clustering of sequence-distant hydrophobic side chains in the unfolded state of the Drk SH3 domain (Crowhurst and Forman-Kay 2003). Unfolded state structure has also been inferred from significant deviations from expected values of the change in heat capacity upon unfolding (ΔCp) or the denaturant dependence of the unfolding free energy (m-value). These quantities are strongly correlated with the change in solvent-accessible surface area upon unfolding (Myers et al. 1995), and a reduced value of ΔCp in ribonuclease H (RNase H) from Thermus thermophilus (Guzman-Casado et al. 2003) and variations in the m-value upon mutation in staphylococcal nuclease (SNase) (Wrabl and Shortle 1999) have suggested residual unfolded state structure in these proteins. In addition, hydrogen exchange experiments have revealed some residual protection from solvent of polypeptide backbone amides in the unfolded states of several proteins, including the mouse prion protein (PrP) (Nicholson et al. 2002) and SNase (Wrabl and Shortle 1999).
Here, we use hydrogen exchange to detect residual unfolded state structure in the Src SH2 domain. SH2 domains bind short peptide sequences in target proteins containing phosphorylated tyrosine residues, and are present in a wide variety of signaling and scaffolding proteins in metazoans (Kuriyan and Cowburn 1997). They are small (∼100 residues), soluble, and amenable to NMR spectroscopy. These properties make SH2 domains good potential models for studies of protein folding and stability, but a thorough description of the folding energy landscape of an SH2 domain has not been reported. Here we present an analysis of the stability and folding kinetics of the Src SH2 domain. We also measure the hydrogen exchange rates of slow-exchanging backbone amides as a function of urea concentration. All secondary-structural elements behave similarly in this experiment, revealing no partially unfolded forms (PUFs) in the traditional sense. There is a large discrepancy (∼2 kcal/mol), however, between the unfolding free energy obtained from hydrogen exchange and the unfolding free energy measured by all other probes. Also, the denaturant dependence, or m-value, of the hydrogen exchange free energy is ∼15% higher than the m-value for fluorescence or proteolysis. This suggests that the unfolded state detected by hydrogen exchange is more solvated and higher in energy than the denatured state seen by other probes. The apparently simple, two-state behavior of Src SH2 in most experiments hides structural and energetic complexity in its unfolded state.
Results
Equilibrium and kinetic analysis indicate that Src SH2 is a two-state protein
Equilibrium stability
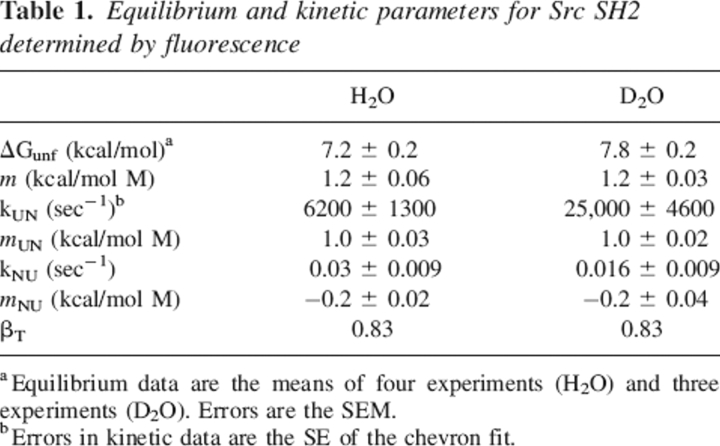
Equilibrium denaturation by urea was monitored using intrinsic tryptophan fluorescence. Fluorescence emission of the single tryptophan residue is blue-shifted by 20 nm in the native state of Src SH2; unfolding is characterized by a dramatic change in the shape and peak of the emission spectrum but very little change in the peak intensity. Equilibrium denaturation curves exhibit a single, cooperative transition indicative of two-state unfolding (Fig. 1A). Curves were fit using the linear extrapolation model (LEM) (Santoro and Bolen 1988) to obtain the ΔG for unfolding in H2O (Table 1). Because hydrogen exchange measurements are performed in 100% D2O and bulk solvent isotopes have a variable effect on protein stability (Makhatadze et al. 1995), denaturation was repeated in D2O. Src SH2 is slightly stabilized by deuterated solvent (ΔΔG = 0.65 kcal/mol).
Figure 1.
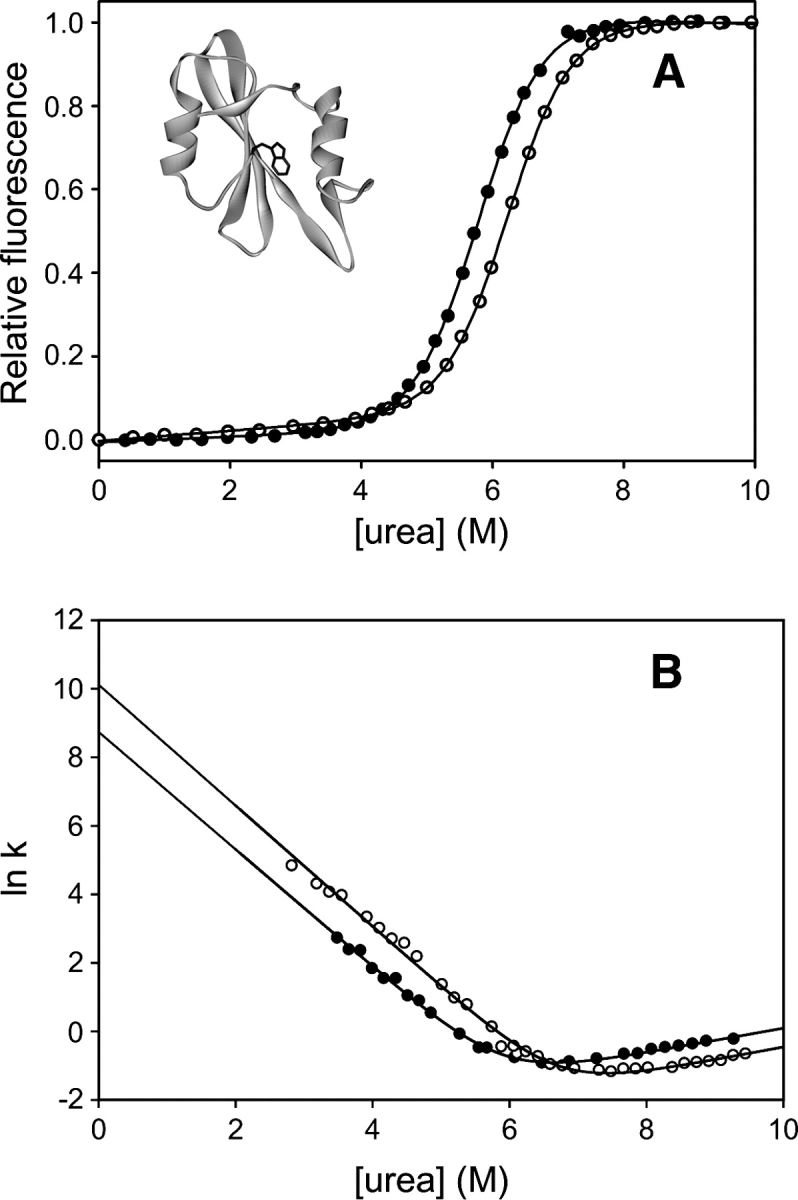
Stability, folding, and unfolding of the Src SH2 domain in 20 mM imidazole (pH 7.4). (A) Equilibrium unfolding in H2O (•) and D2O (○) detected by fluorescence. The location of the single tryptophan residue (W5) is shown in the inset. (B) Folding and unfolding rates plotted as a function of urea in H2O (•) and D2O (○). Fit parameters are listed in Table 1.
Table 1.
Equilibrium and kinetic parameters for Src SH2 determined by fluorescence
It is usually desirable to determine the stability of a protein using multiple probes, often fluorescence and circular dichroism (CD), in order to confirm the two-state assumption. Unfortunately, unfolding of Src SH2 is accompanied by a very small change in far-UV CD signal, and the baselines are steeply sloped, making quantitative analysis of the data extremely difficult. Unfolding curves determined by CD are qualitatively similar to those determined by fluorescence but do not provide reliable values for stability (data not shown).
Folding kinetics
Folding and unfolding kinetics were measured between 3 M and 9.5 M urea in H2O and D2O by using stopped-flow mixing. Two refolding phases were observed: The majority of the signal (∼85%) was recovered in a rapid, denaturant-dependent phase (k = 6200 sec−1 in 0 M urea). The remaining signal was recovered in a slow phase (k = 0.05 sec−1) with no discernible denaturant dependence (data not shown). Src SH2 has three trans prolines in the native state, and the slow isomerization of these in the unfolded state likely accounts for the second refolding phase. Unfolding occurred in a single kinetic phase at all denaturant concentrations. A plot of ln kobs versus [urea] (chevron plot) for the fast refolding phase and unfolding is shown in Figure 1B. The equilibrium constant determined from the ratio of the unfolding and refolding rates extrapolated to 0 M urea yields a measure of the stability of the protein that closely matches the stability measured by equilibrium denaturation (Table 1). The sum of the absolute values of the m-values for refolding and unfolding also matches the equilibrium m-value. Taken together, these observations suggest that the fast refolding phase represents two-state folding, and that no observable intermediates accumulate on the folding pathway of Src SH2. The stabilization of SH2 by D2O is reflected in both a faster folding rate and a slower unfolding rate.
Native state hydrogen exchange indicates cooperative unfolding
Hydrogen exchange rates were measured for 35 of 103 structured backbone amide hydrogens at 10 urea concentrations ranging from 0–3 M (25°C and a corrected pD of 7.4). Every secondary structural element is represented by at least one probe amide except βF. The largest random coil exchange rate among amides with measurable exchange is ∼30 sec−1 (Bai et al. 1993). The rate constant for folding ranges from 25,000 sec−1 in 0 M urea to 160 sec−1 in 3 M urea. Assuming that global folding is the slowest closing transition in the protein, this indicates that EX2 conditions (see Materials and Methods) are satisfied for all amides in all of these experiments, and therefore, the exchange rates report on the free energies of fluctuations leading to exchange. We were able to directly measure rates corresponding to ΔGHX values from 5–10 kcal/mol.
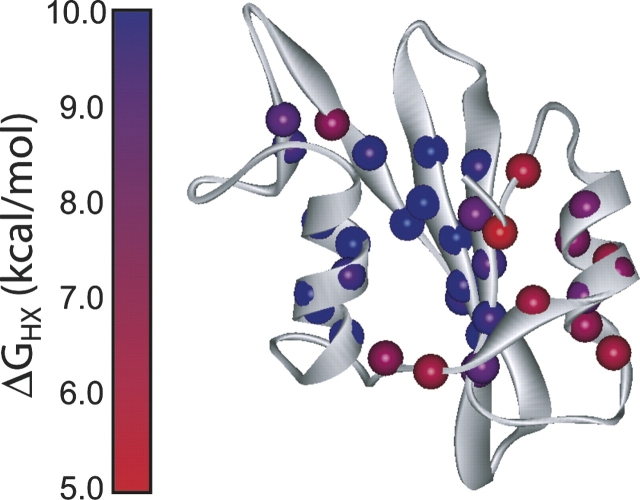
In the absence of denaturant, the measured hydrogen exchange free energies in the Src SH2 domain range from 5–9 kcal/mol. These values are mapped onto the crystal structure of the apo domain (Waksman et al. 1993) in Figure 2. There is significant variation across the domain: The central β-sheet and helix B have the highest ΔGHX, while helix A, the small sheet formed by strands D′ and E, and the terminal strands are less protected from exchange. The maximum values of ΔGHX are significantly larger than the equilibrium stability of the protein (7.8 kcal/mol). This discrepancy is investigated further below.
Figure 2.
Hydrogen exchange protection factors in Src SH2 in 0 M urea. Amide groups with measured exchange rates are shown as spheres, colored from red to blue according to the magnitude of the protection factor. Ribbon diagram is generated from the Protein Data Bank file 1spr (Waksman et al. 1993).
The pattern of hydrogen exchange protection is suggestive of a PUF with helix A and strands A and F unfolded. However, simply measuring ΔGHX in one set of conditions cannot distinguish between a PUF and many, uncoordinated local fluctuations in the native state. To differentiate between these possibilities, we carried out native state hydrogen exchange, measuring hydrogen exchange rates as a function of urea at 10 urea concentrations from 0–3 M. This concentration range lies entirely within the native baseline of the denaturation curve for the protein (Fig. 1), so that the native state is the dominant species in all the hydrogen exchange experiments. Representative plots of ΔGHX versus [urea] are shown in Figure 3A. Most amides display some denaturant-independent exchange at low urea concentrations, indicating exchange through local fluctuations. As the denaturant concentration rises, denaturant-dependent exchange rates appear for most amides, indicating exchange through fluctuations that expose a significant amount of the protein to solvent. Fits of these data to Equation 7 yield the free energies of local fluctuations and cooperative unfolding for each amide, and the denaturant dependence of unfolding, or m-value.
Figure 3.
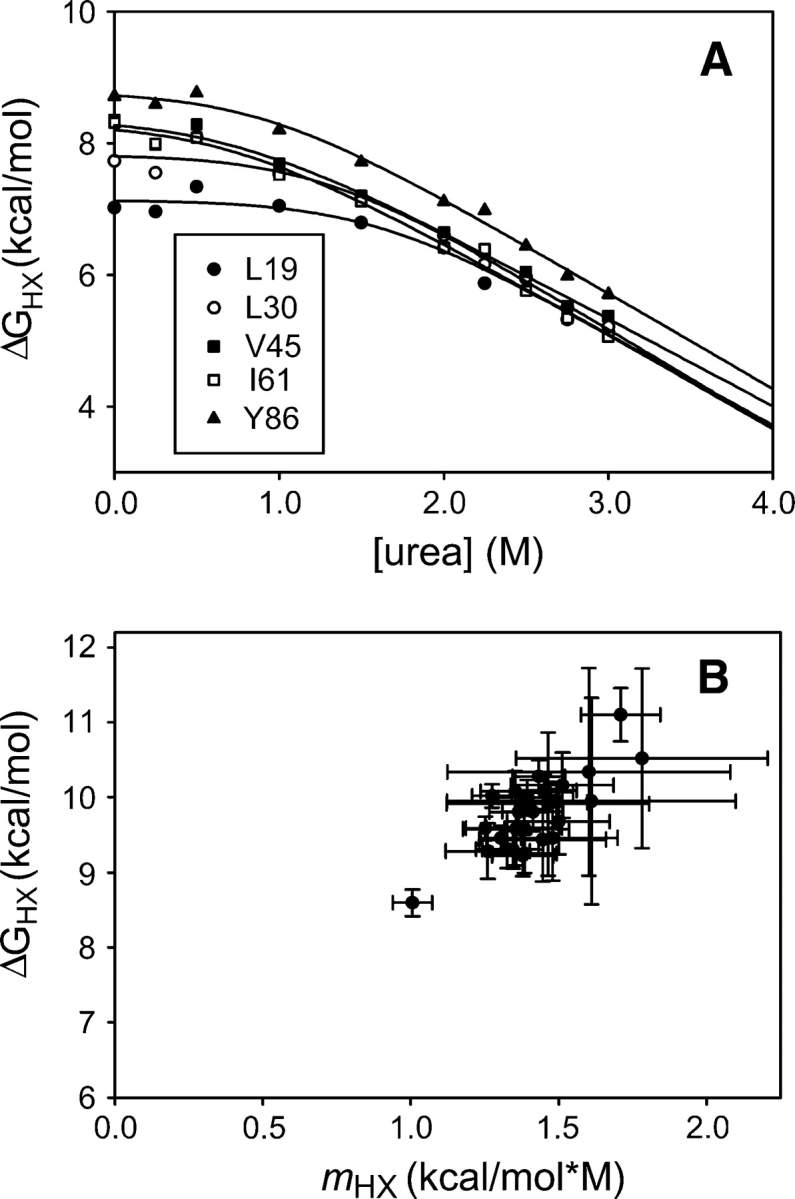
Stabilities and m-values of secondary structural elements of Src SH2 determined by native state hydrogen exchange. (A) Data for five amides representing different secondary structural elements of the protein. Continuous curves are fits to Equation 7. (B) ΔGHX vs. mHX plotted for each amide with measurable nonlocal exchange. Error bars, SE of the fit to Equation 7.
Amides that exchange from the same gross unfolding event, be it a PUF or global unfolding, should have the same ΔG and m-values (Bai et al. 1995). Different cooperatively unfolded structures can be identified from a plot of ΔG versus m from native state hydrogen exchange (Fig. 3B). All the amides in Src SH2 form a remarkably tight cluster in this plot, indicating that all denaturant-dependent exchange is reporting on a single, cooperative unfolding event. The hydrogen exchange data indicate only two structural ensembles under native conditions: the folded native state with highly localized fluctuations, and the unfolded state. The extrapolated values for ΔGHX cluster around 9.6 kcal/mol, significantly above the global stability determined by equilibrium denaturation in D2O (7.8 kcal/mol).
Ultracentrifugation indicates that Src SH2 is a monomer
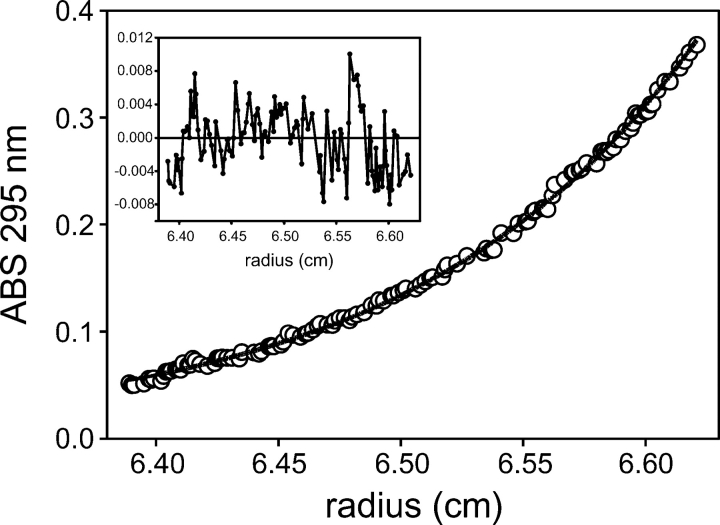
Hydrogen exchange protection in apparent excess of global stability (“super protection”) has been observed in many proteins (Huyghues-Despointes et al. 2001), and its origins are diverse. Self-association at the high protein concentrations used in the hydrogen exchange experiments could account for some of the excess protection, so we used analytical ultracentrifugation to investigate the self association of Src SH2. With loading concentrations ranging from 0.5 to 800 μM, sedimentation equilibrium profiles fit well to an ideal monomer model with an average apparent molecular weight of 12.7 kDa and a standard error of 0.3 kDa. This is in good agreement with the expected value of 12.5 kDa (Fig. 4). Furthermore, there was no upward trend in the apparent molecular weight with increasing concentration. These results indicate that dimerization is unlikely to explain the excess stability measured by hydrogen exchange.
Figure 4.
Representative sedimentation equilibrium curve for Src SH2. In this experiment, the loading concentration of protein was 100 μM and the speed was 30,000 rpm. Continuous curve is a fit to a single ideal species model with an apparent molecular weight of 12,081. The expected molecular weight is 12,521. Inset shows the residuals of the fit.
Proteolysis studies to test the LEM
The determination of stability from equilibrium fluorescence studies involves a linear extrapolation from data taken in the transition region, whereas the hydrogen exchange experiments do not. To determine if the resulting difference, or super protection, is a result of this extrapolation, we used proteolysis kinetics to provide a direct, independent measurement of the stability of SH2 at 10 concentrations of urea over the same range used in the hydrogen exchange measurements.
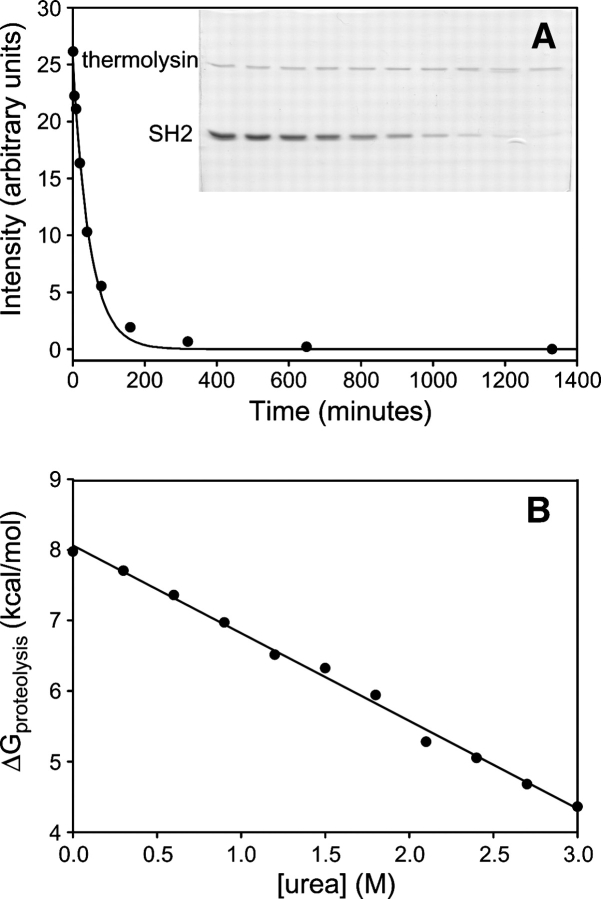
Proteases require relatively long stretches of extended polypeptide to cleave efficiently. Native proteins are therefore generally resistant to proteolysis, and cleavage requires some excursion into a high-energy cleavable state. This makes proteolysis a tool analogous to hydrogen exchange for probing rare unfolded conformations in proteins' native state ensembles (Park and Marqusee 2004). Similar to hydrogen exchange, proteolysis can occur through relatively small local fluctuations, or partial or global unfolding. These mechanisms can be distinguished by comparing proteolysis rates at increasing denaturant concentrations, as in native state hydrogen exchange. A plot of ΔGproteolysis versus [urea] for Src SH2 is shown in Figure 5. ΔGproteolyis exhibits a remarkably linear dependence on urea, with ΔGH2O of 8.1 kcal/mol and an m-value of 1.2 kcal/mol/M, in reasonable agreement with the values determined by extrapolation of the fluorescence unfolding data.
Figure 5.
Native state proteolysis of the Src SH2 domain. (A) Representative proteolysis experiment. Band intensities from the gel are plotted vs. time and fit to a single exponential to obtain ΔGproteolysis (see Materials and Methods). (B) ΔGproteolysis is plotted vs. urea concentration. A linear fit to the data is shown (r2 = 0.995). From this fit, ΔGH2O = 8.06 kcal/mol and m = 1.24 kcal/mol M.
Hydrogen exchange rates in the urea unfolded state
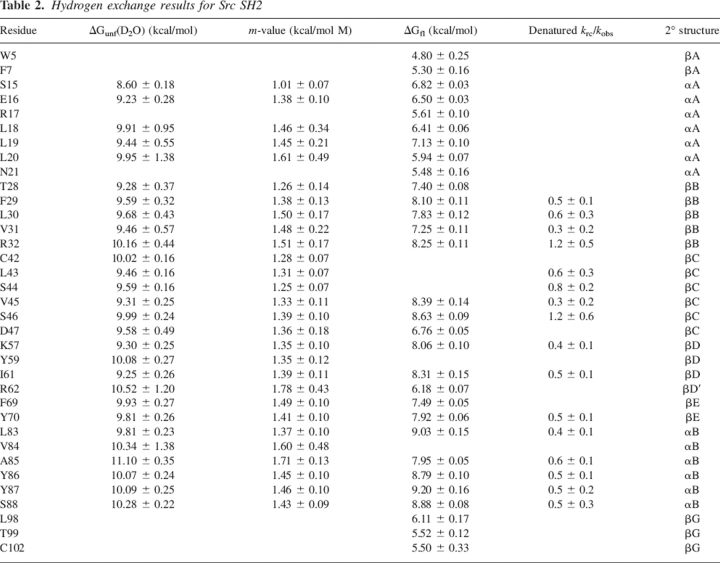
It is possible that the unfolded state of the protein is poorly modeled by the compounds used to estimate krc, leading to an overestimation of ΔGHX as defined in Equation 5. To further investigate the hydrogen exchange of unfolded SH2, we measured the exchange rates of backbone amides in 7 M urea using quench flow techniques. Protein in 7 M deuterated urea in D2O was rapidly diluted into 7 M protonated urea in H2O and allowed to exchange for 10, 120, 1000, and 10,000 msec before exchange was quenched by refolding the protein by dilution to 0.5 M urea. Under these conditions, the half-time for refolding is ∼250 μsec, much faster than the half times for exchange from a random coil (90 msec to 1.3 sec), allowing efficient quenching. The proton occupancy at each amide was assessed by NMR spectroscopy. Because of back exchange under quench conditions, this technique allows us to measure rates only for those amides that exchange very slowly in the native state, 18 of the 35 exchange probes. The denatured state exchange rates of all of these amides are within a factor of two to three of the krc values estimated from model compounds (Table 2) (Bai et al. 1993). In fact, the rates of exchange we measure in the denatured protein are systematically faster than krc, suggesting that what variation we see is the result of experimental error, and there is no significant deviation from random coil behavior. The protection suggested by the native state hydrogen exchange data is not evident, indicating that any residual structure responsible for the super protection does not persist in 7 M urea.
Table 2.
Hydrogen exchange results for Src SH2
Discussion
Native state hydrogen exchange is a powerful method for identifying and characterizing small populations of unfolded protein conformations under conditions that strongly favor the native state. In many proteins, this technique has shown that a hierarchy of PUFs exists in equilibrium with the native state. PUFs typically manifest as specific clusters of secondary structural elements with similar values of ΔGHX and mHX, indicating regions of the protein that unfold together while other regions remain folded (Bai et al. 1995). In some cases, such as Escherichia coli ribonuclease H, these PUFs are structurally similar to well-characterized folding intermediates that form before the transition state for protein folding (Raschke and Marqusee 1998). In other cases, including horse heart cytochrome c (Hoang et al. 2002) and redesigned apocytochrome b562 (Chu et al. 2002), PUFs appear to represent partially folded structures that form after the transition state barrier, showing the complex accumulation of structure in proteins with apparently two-state kinetics. Finally, some proteins, such as chymotrypsin inhibitor 2 (Itzhaki et al. 1997), peptostreptococcal protein L (Yi et al. 1997), and the SH3 domains of α-spectrin (Viguera and Serrano 2003) and Src (Grantcharova and Baker 1997; Wildes and Marqusee 2005), show no evidence for PUFs in equilibrium with the native and unfolded states.
Here we have presented a native state hydrogen exchange analysis of the SH2 domain of the protein tyrosine kinase Src. Our results indicate that, while Src SH2 lacks PUFs in the traditional sense, there is evidence for a highly populated, partially structured form in the denatured ensemble of this protein. Unlike traditional PUFs, the partially unfolded species we detect in Src SH2 does not involve part of the molecule unfolding while the remainder maintains native-like packing. Instead, it apparently involves expansion of the entire protein, allowing solvent to penetrate the hydrophobic core but maintaining some secondary structure. Our evidence for such an unusual PUF comes from the fact that equilibrium and kinetic experiments monitored by fluorescence and proteolysis provide a consistent measurement of ΔG and m, but hydrogen exchange provides significantly higher measurements of both parameters.
Evaluation of the apparent super protection
Hydrogen exchange protection larger than expected based on equilibrium denaturation studies—so-called super protection—has been seen in several proteins and attributed to a number of different factors (Huyghues-Despointes et al. 1999). The simplest explanations stem from differences in experimental conditions between hydrogen exchange measurements and more traditional methods. Hydrogen exchange rates are typically measured in D2O, a solvent with slightly different properties than H2O that can alter protein stability (Makhatadze et al. 1995). In the case of SH2, there is a slight (0.6 kcal/mol) isotope effect on protein stability (Fig. 1A), but the HX stability is still ∼2 kcal/mol higher than the stability determined in D2O.
The slow cis-trans isomerization of xaa-proline bonds in the unfolded state can also lead to super protection in hydrogen exchange experiments. This is because the unfolded state with a random, equilibrium distribution of proline isomers is lower in free energy than the unfolded state with native-like prolines, but the polypeptide chain relaxes to this state very slowly and the two unfolded states are equally sensitive to exchange. Thus the free energy of hydrogen exchange represents opening to a high-energy unfolded state relative to the unfolded state seen in equilibrium experiments. The energetic difference due to proline isomerization can be estimated based on cis-trans equilibrium constants of model peptides (Huyghues-Despointes et al. 2001), or from the magnitude of the slow, proline limited refolding phase in kinetic experiments. In either case, the three trans prolines in Src SH2 make a negligible contribution to the hydrogen exchange free energy, increasing the apparent ΔGunf by <0.2 kcal/mol, and cannot explain the 2 kcal/mol super protection we observe.
Another potential source of excess protection is protein self-association. The linkage between folding and dimerization equilibria leads to a predictable increase in the apparent stability of the native state with increasing protein concentration. In this study, the NMR measurements of exchange rates were performed at protein concentrations 500-fold higher than those employed for fluorescence, which could account for the observed super protection if Src SH2 forms a very tight dimer. The analytical ultracentrifugation experiments, however, confirm that the SH2 domain is a monomer across this concentration range, and therefore, association cannot account for the super protection in Src SH2.
Native state proteolysis shows no deviation from the LEM
Hydrogen exchange super protection can sometimes be explained by errors in the interpretation of denaturation curves. The stability of SH2 measured by fluorescence was calculated by linearly extrapolating the measured stability in the range of 4–7 M urea back to zero denaturant. The ΔGunf clearly varies linearly with denaturant in the transition region, where both the native and unfolded states are significantly populated, but this linearity does not necessarily hold for all urea concentrations. Indeed, several models for denaturant interactions with proteins predict upward curvature in ΔG versus [denaturant] at low denaturant concentrations (Pace 1986), and this has been seen in the hydrogen exchange behavior of some proteins (Englander et al. 1997; Yi et al. 1997; Fuentes and Wand 1998). Our determination of stability using a native state proteolysis method, which is carried out under native conditions without extrapolation from the transition zone, yields values consistent with the fluorescence studies. The proteolysis therefore shows that linear extrapolation of the fluorescence unfolding data provides an accurate estimate of the stability of SH2. The fact that the hydrogen exchange free energies for many amides do not agree with this stability suggests that the unfolded state probed by fluorescence and proteolysis contains some residual structure that protects backbone amides from exchange. This residual unfolded state structure does not appear to persist in high denaturant as the hydrogen exchange protection factors do not reveal protection in 7 M urea.
Unfolded states of Src SH2
The higher free energy and m-value of the hydrogen exchange unfolded state indicate that it most likely closely resembles the globally unfolded, random coil conformations of the polypeptide chain. The proteolysis and fluorescence experiments indicate that another unfolded species also exists in the native state ensemble of Src SH2. This species has an unfolded fluorescence signal, indicating that the single tryptophan residue, W5, is solvent exposed in this state, suggesting that core hydrophobic side chains are solvated. This species is also sensitive to proteolysis, indicating that there is sufficient backbone flexibility in at least some regions of the protein to allow rapid digestion by thermolysin. However, according to the native state hydrogen exchange, all backbone amides that are protected in the fully folded protein retain ∼2 kcal/mol of protection in this unfolded state. Moreover, the average m-value from native state hydrogen exchange is ∼20% higher than the m-value from proteolysis or fluorescence, suggesting that more surface area is exposed in the unfolding events detected by hydrogen exchange. These observations are consistent with a partially structured species in the unfolded ensemble of Src SH2 with a population in 0 M urea ∼30-fold higher than the random coil unfolded state. It should be noted that the hydrogen exchange protection in this species does not necessarily indicate that it has native-like secondary structure. We see the excess protection only in those residues that are structured in the native state simply because those are the only residues for which we can measure exchange rates. An ensemble of non-native but protected conformations in the unfolded state could give similar results.
We refer to the partially structured form of SH2 as part of the unfolded ensemble, but it should be noted that it could be interpreted as an equilibrium unfolding intermediate. The distinction is a matter of how we choose to define the unfolded state U. If U is defined as the most random coil-like ensemble of conformations accessible, then the HX unfolded state should be called U, the “real” ΔGunf of SH2 is the HX value of 9.5 kcal/mol, and the fluorescence and proteolysis experiments reveal an equilibrium intermediate that is 2 kcal/mol stable. However, if we broaden the definition of U to include all nonnative conformations with substantial side chain solvation, then the fluorescence and proteolysis experiments reveal a lower energy portion of the denatured ensemble with some residual, native-like structure. Traditionally, the latter definition of U has been employed to rationalize hydrogen exchange super protection where it has been observed in SNase (Wrabl and Shortle 1999), PrP (Nicholson et al. 2002), and thioredoxin (Bhutani and Udgaonkar 2003). For example, in wild-type SNase, significant super protection is observed in the β-barrel domain of the molecule. Certain mutants in the β-barrel domain both eliminate the apparent super protection and raise the m-value in fluorescence experiments. These observations have been rationalized in terms of an unfolded state for SNase with molten globule-like residual structure in the β-barrel domain. The increased m-value is then due to disruption of this residual structure leading to increased solvation of the unfolded state (Wrabl and Shortle 1999). An interpretation based on a narrower definition of U would call the molten globule an intermediate state in equilibrium with the native and unfolded conformations. In this case the mutations would destabilize the intermediate, decreasing its population in equilibrium unfolding experiments and altering the apparent m-value (Spudich and Marqusee 2000).
Energy landscape of Src SH2
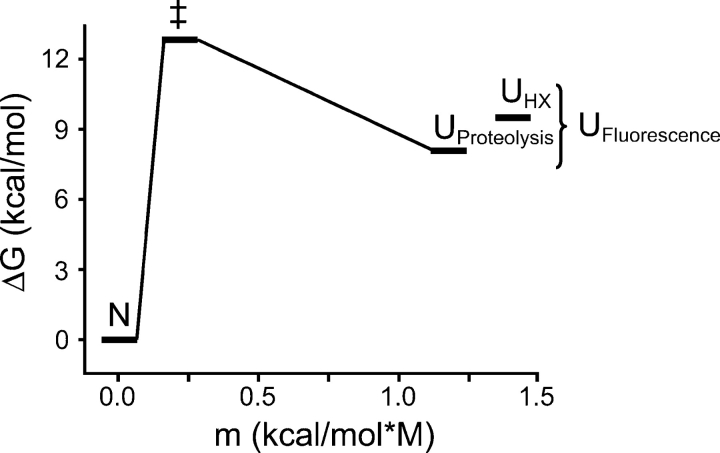
The results of the equilibrium and kinetic fluorescence experiments, proteolysis, and hydrogen exchange allow us to define an energy landscape for Src SH2, shown in Figure 6. Two unfolded states are apparent: one sensitive to proteolysis (Uproteolysis), and one sensitive to hydrogen exchange (UHX). The single tryptophan side chain is apparently equally exposed to solvent in both unfolded states; fluorescence is unable to distinguish between them, and unfolding appears simple and two-state when monitored by that probe. The free energies of these unfolded states relative to the native state can be determined from the apparent stabilities of the protein measured by proteolysis and hydrogen exchange. The difference in stability of ∼2 kcal/mol indicates that Uproteolysis is ∼30-fold more populated than the random coil unfolded state (UHX) in the absence of urea. We have no information about the kinetics of the transition between UHX and Uproteolysis, so no barrier is shown between these species. In our kinetic refolding experiments, Uproteolysis was the dominant unfolded species in the initial conditions (8 M urea), and the stability of the protein determined from the ratio of the rate constants for folding and unfolding matches the stability determined by fluorescence and proteolysis. These observations lead us to indicate folding directly from Uproteolysis to N.
Figure 6.
Experimentally determined energy landscape of Src SH2. The energy of each state is given relative to the native state N. The reaction coordinate is defined by the m-value of each transition, relative to N, a measure of the solvent-accessible surface area exposed in the transition. ΔG‡ is calculated using a preexponential factor of 108 sec−1, estimated from intrachain triplet energy transfer rates in unfolded peptides (Krieger et al. 2003). N, native state; ‡, transition state for (un)folding; Uproteolysis, unfolded state detected by proteolysis; and UHX, unfolded state detected by hydrogen exchange. The fluorescence signal does not distinguish between the two unfolded states. The height of the barrier, if any, connecting the two unfolded states has not been determined.
Despite the appearance of simple, two-state behavior in a number of equilibrium and kinetic experiments, the Src SH2 domain evidently has a more complex energy landscape. The appearance of multiple unfolded species in even a simple model protein such as this one suggests that partially structured species may be a common feature in larger and more complex proteins' energy landscapes. Given the demonstrated role of partially structured species in such important properties as thermal stability (Robic et al. 2003), misfolding, and aggregation (Jahn and Radford 2005), the characterization of these states in model proteins should provide a great deal of information about aspects of protein chemistry that remain poorly understood.
Materials and methods
Protein expression and purification
The SH2 domain of chicken c-Src was expressed and purified as described (Maxwell et al. 2005). Isotopic labeling with 15N was carried out by transferring log-phase cells from LB media to M9 media with 15N ammonium chloride as described (Marley et al. 2001). Protein double-labeled with 15N and 13C, for determination of backbone resonance assignments, was produced by growing cells continuously in M9 media with 15N ammonium chloride and 13C glucose. All purified proteins were dialyzed into 20 mM imidazole (pH 7.4) and 5 mM TCEP, concentrated to 1 mM with a centrifugal concentrator, and stored frozen at –80°C.
Equilibrium stability determination
The equilibrium free energy of unfolding was determined in 20 mM imidazole (pH 7.4) and 1 mM TCEP, with 1–2 μM protein. Individual 2 mL samples at different urea concentrations were prepared and equilibrated overnight at room temperature, followed by at least 30 min at 25°C prior to measurement. Fluorescence spectra of each sample were acquired on a Fluoromax 3 fluorimeter (JY Horiba). Excitation was at 280 nm, and emission spectra were recorded from 320–400 nm, with both slits at 4 nm. The center of mass of each spectrum was calculated using Equation 1:
 |
where Si is the signal at wavelength λi. A two-state model (Santoro and Bolen 1988) was fit to the CoM versus [urea] data to determine the equilibrium folding-free energy. All urea concentrations were determined from the index of refraction of the solutions (Warren and Gordon 1966).
Folding kinetics
Folding and unfolding rates were measured using a SFM-4 stopped-flow device (Molecular Kinetics) coupled to a Fluoromax-3 fluorimeter (JY Horiba). Excitation was at 280 nm with 10 nm slit width, and emission was recorded at 315 nm with 20 nm slit width. Temperature was maintained at 25°C by a circulating water bath, and buffers were temperature-equilibrated for 10 min each time the syringes were reloaded. A three-syringe, two-mixer setup was employed, where syringe 1 contained buffer at 0 M urea for refolding and 10 M urea for unfolding, syringe 2 contained buffer at the concentration midpoint for denaturation, and syringe 3 contained either native or unfolded protein. Reactions were initiated by diluting the protein 10-fold into various concentrations of urea, which were determined by adjusting the relative volumes delivered by syringes 1 and 2. The dead time was 6 msec for all experiments. Five curves were recorded for each denaturant concentration and averaged. The resulting traces were fit to a single exponential decay using the program SigmaPlot (SSI).
NMR assignments
All NMR experiments were performed on a Bruker 600 MHz spectrometer. HSQC assignments were initially determined at pH 5.5 in 20 mM deuterated sodium acetate (Cambridge Isotopes), using three-dimensional CBCANH and CBCACONH experiments. Assignments at pH 7.4 were determined by pH titration from 5.5 to 7.4.
Hydrogen exchange data collection
Exchange samples contained 1 mM protein in 20 mM deuterated imidazole (Cambridge Isotopes) and 1 mM TCEP. Samples (0.5 mL) were prepared in H2O, and the pH was adjusted to 7.0 with HCl or NaOH before samples were flash-frozen and lyophilized. Exchange was initiated by dissolving the samples in 0.5 mL of D2O with 0 to 3 M deuterated urea. Samples were immediately transferred to NMR tubes and placed in the spectrometer. Time between initiation of exchange and beginning of data collection averaged 25 min. Exchange was monitored with HSQC spectra. Forty-four complex points were collected in the indirect dimension, with a spectral width of 660 Hz. Four transients were averaged for each point, giving a total experiment time of 7 min. Spectra were acquired for increasing time intervals for periods ranging from 12 h for high urea samples to ∼1 mo. When outside of the spectrometer, the samples were kept in a temperature-controlled 25°C water bath. Sample pD was measured upon completion of exchange and corrected for the glass electrode isotope effect (Glasoe and Long 1960). Corrected pD ranged from 7.3 to 7.5. Spectra were processed with Felix 97.0 (Accelrys) Peak height as a function of time was fit to a single exponential decay with SigmaPlot (SSI).
Analysis of exchange rates
Amide hydrogen exchange is catalyzed by acid or base in aqueous solution. The first-order rate constant for an unstructured polypeptide (krc) depends on solution pH, temperature, and primary structure and has been extensively calibrated with model compounds (Bai et al. 1993). Observed hydrogen exchange rates in proteins are often many orders of magnitude lower than the rate in a random coil, due to hydrogen bonding and/or burial in the native protein structure. The hydrogen exchange reaction in a protein was modeled by a microscopic two-state equilibrium:
 |
The observed rate constant (kobs) for a given amide can be expressed as a function of the opening and closing rate constants:
 |
In the EX2 limit (Hvidt and Nielsen 1966), where kcl >> krc, the rate is limited by the population of the open state:
 |
The free energy difference between the closed state and the most accessible open state for each amide was calculated directly from the observed exchange rates using Equation 5.
 |
The dependence of ΔGHX on [urea] was modeled as a combination of two processes: urea-independent local fluctuations and unfolding reactions with a linear dependence of ΔG on [urea]:
Plots of ΔGHX versus [urea] for each amide were fit to Equation 7 to obtain ΔGFL, ΔGUNF, and m.
 |
Unfolded state hydrogen exchange
Exchange rates in SH2 denatured with 7 M urea were measured with a Bio-logic SFM4 quenched-flow device. Lyophilized 15N-labeled protein was dissolved to a final concentration of 1 mM in D2O with 7 M deuterated urea, 20 mM imidazole (pD 7.4), and 1 mM TCEP and allowed to exchange for 2 h at 25°C. Exchange was initiated by dilution of 250 μL of protein 1:10 with labeling buffer (7 M urea [in H2O], 20 mM imidazole at pH 7.4, 1 mM TCEP). The exchange time was adjusted to 10, 120, or 1000 msec by adjusting the flow rate and delay loop volume. In addition, exchange times of 10 and 100 sec were obtained by manual mixing. Exchange was quenched by a 1:8 dilution into refolding buffer (H2O with 50 mM sodium acetate at pH 5.5, 200 mM NaCl). Quenched samples were immediately concentrated to a volume of 0.5 mL using Amicon Ultra centrifugal concentrators. The buffer was then exchanged with 50 mM deuterated sodium acetate (Cambridge Isotopes) at pH 5.5 and 100 mM NaCl using a Sephadex G25 spin column, and the protein was flash-frozen in liquid nitrogen and lyophilized. The total workup time was ∼1 h. To control for exchange due to the slow refolding phase, a sample was collected where the unfolded, deuterated protein was directly diluted into refolding buffer.
The lyophilized protein samples were dissolved in 0.5 mL D2O and immediately transferred to NMR tubes to collect HSQC spectra. The total time to the start of data acquisition was 20 min, and the acquisition time was 1 h. NMR spectra were processed, and peak volumes were measured as described for the hydrogen exchange experiments. Peak volumes in each spectrum were corrected for protein concentration, and plotted versus time for each amide. Data were fit to single exponentials with Sigmaplot.
Proteolysis kinetics
Proteolysis by thermolysin was performed with 30 μM SH2 and 3 μM thermolysin in 20 mM imidazole (pH 7.4), 10 mM CaCl2, 50 mM NaCl, 1 mM TCEP, and 0–3 M urea. The addition of 50 mM NaCl and 10 mM CaCl2 did not alter the stability measured by fluorescence. Thermolysin kcat/Km in this buffer as a function of [urea] was estimated from the rate of digestion of 1.5 μM fluorogenic peptide substrate ABZ-Ala-Gly-Leu-Ala-pNA as described (Park and Marqusee 2004). Reactions were initiated by adding thermolysin to an SH2 solution. At various times, 15 μL aliquots were removed and quenched by addition of 1 μL 200 μM phosphoramidon (Sigma) and 4 μL 50 mM EDTA. The use of the competitive inhibitor phosphoramidon eliminates thermolysin self-cleavage, simplifying the analysis of proteolysis reactions. Quenched reactions were kept frozen at –20°C prior to analysis. Proteolysis rates were determined by separating samples on 15% SDS-PAGE gels, staining with Sypro Red (Molecular Probes), and scanning with a Typhoon imaging system (Amersham Biosciences). Band intensities were quantified with the program ImageJ. Intensity versus time was fit to a single exponential decay equation with the program SigmaPlot (SSI) to determine first-order rate constants for proteolysis.
The concentration of thermolysin was such that the rate of proteolysis of a random coil peptide was much less than the folding rate of SH2. This is analogous to the EX2 condition for hydrogen exchange described above. Under these conditions, the observed rate constant for proteolysis is related to the equilibrium constant between the proteolytically inaccessible and accessible states of the protein (Kop):
Values of Kop from proteolysis were converted to ΔGproteolysis using Equation 9.
Analytical ultracentrifugation
Sedimentation equilibrium experiments were performed by using a Beckman XL-1 ultracentrifuge. Six samples ranging in concentration from 0.5 to 800 μM were run at 30,000 and 40,000 rpm. After the samples reached equilibrium at each speed, absorbance scans were taken at wavelengths of 280, 290, and 300 nm. Data were analyzed using the programs SedFit and SedPhat.
Acknowledgments
We thank Tracy Handel for help with NMR assignments, Jeff Pelton for assistance with other NMR experiments, David King for mass spectrometry, Ying Yang for assistance with ultracentrifugation, and Chiwook Park, Katie Tripp, and Katelyn Connell for helpful comments on the manuscript. This work was supported by NIH grant GM50945.
Footnotes
Reprint requests to: Susan Marqusee, 237 Hildebrand Hall, Department of Molecular and Cell Biology, University of California, Berkeley, CA 94720-3206, USA; e-mail: marqusee@berkeley.edu; fax: (510) 643-9290.
Article published online ahead of print. Article and publication date are at http://www.proteinscience.org/cgi/doi/10.1110/ps.062136006.
References
- Bai Y., Milne J.S., Mayne L., Englander S.W. 1993. Primary structure effects on peptide group hydrogen exchange. Proteins 17: 75–86. [DOI] [PMC free article] [PubMed] [Google Scholar]
- Bai Y., Sosnick T.R., Mayne L., Englander S.W. 1995. Protein folding intermediates: Native-state hydrogen exchange. Science 269: 192–197. [DOI] [PMC free article] [PubMed] [Google Scholar]
- Bhutani N. and Udgaonkar J.B. 2003. Folding subdomains of thioredoxin characterized by native-state hydrogen exchange. Protein Sci. 12: 1719–1731. [DOI] [PMC free article] [PubMed] [Google Scholar]
- Cho J.H. and Raleigh D.P. 2005. Mutational analysis demonstrates that specific electrostatic interactions can play a key role in the denatured state ensemble of proteins. J. Mol. Biol. 353: 174–185. [DOI] [PubMed] [Google Scholar]
- Cho J.H., Sato S., Raleigh D.P. 2004. Thermodynamics and kinetics of non-native interactions in protein folding: A single point mutant significantly stabilizes the N-terminal domain of L9 by modulating non-native interactions in the denatured state. J. Mol. Biol. 338: 827–837. [DOI] [PubMed] [Google Scholar]
- Chu R., Pei W., Takei J., Bai Y. 2002. Relationship between the native-state hydrogen exchange and folding pathways of a four-helix bundle protein. Biochemistry 41: 7998–8003. [DOI] [PubMed] [Google Scholar]
- Crowhurst K.A. and Forman-Kay J.D. 2003. Aromatic and methyl NOEs highlight hydrophobic clustering in the unfolded state of an SH3 domain. Biochemistry 42: 8687–8695. [DOI] [PubMed] [Google Scholar]
- Englander S.W., Mayne L., Bai Y., Sosnick T.R. 1997. Hydrogen exchange: the modern legacy of Linderstrom-Lang. Protein Sci. 6: 1101–1109. [DOI] [PMC free article] [PubMed] [Google Scholar]
- Fitzkee N.C. and Rose G.D. 2004. Reassessing random-coil statistics in unfolded proteins. Proc. Natl. Acad. Sci. 101: 12497–12502. [DOI] [PMC free article] [PubMed] [Google Scholar]
- Fuentes E.J. and Wand A.J. 1998. Local dynamics and stability of apocytochrome b562 examined by hydrogen exchange. Biochemistry 37: 3687–3698. [DOI] [PubMed] [Google Scholar]
- Glasoe P.K. and Long F.A. 1960. Use of glass electrodes to measure acidities in deuterium oxide. J. Phys. Chem. 64: 188–190. [Google Scholar]
- Grantcharova V.P. and Baker D. 1997. Folding dynamics of the src SH3 domain. Biochemistry 36: 15685–15692. [DOI] [PubMed] [Google Scholar]
- Guzman-Casado M., Parody-Morreale A., Robic S., Marqusee S., Sanchez-Ruiz J.M. 2003. Energetic evidence for formation of a pH-dependent hydrophobic cluster in the denatured state of Thermus thermophilus ribonuclease H. J. Mol. Biol. 329: 731–743. [DOI] [PubMed] [Google Scholar]
- Hoang L., Bedard S., Krishna M.M., Lin Y., Englander S.W. 2002. Cytochrome c folding pathway: Kinetic native-state hydrogen exchange. Proc. Natl. Acad. Sci. 99: 12173–12178. [DOI] [PMC free article] [PubMed] [Google Scholar]
- Huyghues-Despointes B.M.P., Scholtz J.M., Pace C.N. 1999. Protein conformational stabilities can be determined from hydrogen exchange rates. Nat. Struct. Biol. 6: 910–912. [DOI] [PubMed] [Google Scholar]
- Huyghues-Despointes B.M., Pace C.N., Englander S.W., Scholtz J.M. 2001. Measuring the conformational stability of a protein by hydrogen exchange. Methods Mol. Biol. 168: 69–92. [DOI] [PubMed] [Google Scholar]
- Hvidt A. and Nielsen S.O. 1966. Hydrogen exchange in proteins. Adv. Protein Chem. 21: 287–386. [DOI] [PubMed] [Google Scholar]
- Itzhaki L.S., Neira J.L., Fersht A.R. 1997. Hydrogen exchange in chymotrypsin inhibitor 2 probed by denaturants and temperature. J. Mol. Biol. 270: 89–98. [DOI] [PubMed] [Google Scholar]
- Jahn T.R. and Radford S.E. 2005. The Yin and Yang of protein folding. FEBS J. 272: 5962–5970. [DOI] [PMC free article] [PubMed] [Google Scholar]
- Kohn J.E., Millett I.S., Jacob J., Zagrovic B., Dillon T.M., Cingel N., Dothager R.S., Seifert S., Thiyagarajan P., Sosnick T.R.et al. 2004. Random-coil behavior and the dimensions of chemically unfolded proteins. Proc. Natl. Acad. Sci. 101: 12491–12496. [DOI] [PMC free article] [PubMed] [Google Scholar]
- Krieger F., Fierz B., Bieri O., Drewello M., Kiefhaber T. 2003. Dynamics of unfolded polypeptide chains as model for the earliest steps in protein folding. J. Mol. Biol. 332: 265–274. [DOI] [PubMed] [Google Scholar]
- Kuriyan J. and Cowburn D. 1997. Modular peptide recognition domains in eukaryotic signaling. Annu. Rev. Biophys. Biomol. Struct. 26: 259–288. [DOI] [PubMed] [Google Scholar]
- Luque I., Leavitt S.A., Freire E. 2002. The linkage between protein folding and functional cooperativity: Two sides of the same coin? Annu. Rev. Biophys. Biomol. Struct. 31: 235–256. [DOI] [PubMed] [Google Scholar]
- Ma B., Shatsky M., Wolfson H.J., Nussinov R. 2002. Multiple diverse ligands binding at a single protein site: A matter of pre-existing populations. Protein Sci. 11: 184–197. [DOI] [PMC free article] [PubMed] [Google Scholar]
- Makhatadze G.I., Clore G.M., Gronenborn A.M. 1995. Solvent isotope effect and protein stability. Nat. Struct. Biol. 2: 852–855. [DOI] [PubMed] [Google Scholar]
- Marley J., Lu M., Bracken C. 2001. A method for efficient isotopic labeling of recombinant proteins. J. Biomol. NMR 20: 71–75. [DOI] [PubMed] [Google Scholar]
- Maxwell K.L., Wildes D., Zarrine-Afsar A., De Los Rios M.A., Brown A.G., Friel C.T., Hedberg L., Horng J.C., Bona D., Miller E.J.et al. 2005. Protein folding: Defining a “standard” set of experimental conditions and a preliminary kinetic data set of two-state proteins. 2005. Protein Sci. 14: 602–616. [DOI] [PMC free article] [PubMed] [Google Scholar]
- Mok Y.K., Elisseeva E.L., Davidson A.R., Forman-Kay J.D. 2001. Dramatic stabilization of an SH3 domain by a single substitution: Roles of the folded and unfolded states. J. Mol. Biol. 307: 913–928. [DOI] [PubMed] [Google Scholar]
- Myers J.K., Pace C.N., Scholtz J.M. 1995. Denaturant m values and heat capacity changes: Relation to changes in accessible surface areas of protein unfolding. Protein Sci. 4: 2138–2148. [DOI] [PMC free article] [PubMed] [Google Scholar]
- Nicholson E.M., Mo H., Prusiner S.B., Cohen F.E., Marqusee S. 2002. Differences between the prion protein and its homolog Doppel: A partially structured state with implications for scrapie formation. J. Mol. Biol. 316: 807–815. [DOI] [PubMed] [Google Scholar]
- Pace C.N. 1986. Determination and analysis of urea and guanidine hydrochloride denaturation curves. Methods Enzymol. 131: 266–280. [DOI] [PubMed] [Google Scholar]
- Park C. and Marqusee S. 2004. Probing the high energy states in proteins by proteolysis. J. Mol. Biol. 343: 1467–1476. [DOI] [PubMed] [Google Scholar]
- Raschke T.M. and Marqusee S. 1998. Hydrogen exchange studies of protein structure. Curr. Opin. Biotechnol. 9: 80–86. [DOI] [PubMed] [Google Scholar]
- Robic S., Guzman-Casado M., Sanchez-Ruiz J.M., Marqusee S. 2003. Role of residual structure in the unfolded state of a thermophilic protein. Proc. Natl. Acad. Sci. 100: 11345–11349. [DOI] [PMC free article] [PubMed] [Google Scholar]
- Santoro M.M. and Bolen D.W. 1988. Unfolding free-energy changes determined by the linear extrapolation method. 1. Unfolding of phenylmethanesulfonyl α-chymotrypsin using different denaturants. Biochemistry 27: 8063–8068. [DOI] [PubMed] [Google Scholar]
- Smith L.J., Fiebig K.M., Schwalbe H., Dobson C.M. 1996. The concept of a random coil: Residual structure in peptides and denatured proteins. Fold. Des. 1: R95–R106. [DOI] [PubMed] [Google Scholar]
- Spudich G. and Marqusee S. 2000. A change in the apparent m value reveals a populated intermediate under equilibrium conditions in Escherichia coli ribonuclease HI. Biochemistry 39: 11677–11683. [DOI] [PubMed] [Google Scholar]
- Tousignant A. and Pelletier J.N. 2004. Protein motions promote catalysis. Chem. Biol. 11: 1037–1042. [DOI] [PubMed] [Google Scholar]
- Trefethen J.M., Pace C.N., Scholtz J.M., Brems D.N. 2005. Charge-charge interactions in the denatured state influence the folding kinetics of ribonuclease Sa. Protein Sci. 14: 1934–1938. [DOI] [PMC free article] [PubMed] [Google Scholar]
- Viguera A.R. and Serrano L. 2003. Hydrogen-exchange stability analysis of Bergerac-Src homology 3 variants allows the characterization of a folding intermediate in equilibrium. Proc. Natl. Acad. Sci. 100: 5730–5735. [DOI] [PMC free article] [PubMed] [Google Scholar]
- Waksman G., Shoelson S.E., Pant N., Cowburn D., Kuriyan J. 1993. Binding of a high affinity phosphotyrosyl peptide to the Src SH2 domain: Crystal structures of the complexed and peptide-free forms. Cell 72: 779–790. [DOI] [PubMed] [Google Scholar]
- Warren J.R. and Gordon J.A. 1966. On refractive indices of aqueous solutions of urea. J. Phys. Chem. 70:–297.
- Wildes D. and Marqusee S. 2005. Hydrogen exchange and ligand binding: Ligand-dependent and ligand-independent protection in the Src SH3 domain. Protein Sci. 14: 81–88. [DOI] [PMC free article] [PubMed] [Google Scholar]
- Wrabl J. and Shortle D. 1999. A model of the changes in denatured state structure underlying m value effects in staphylococcal nuclease. Nat. Struct. Biol. 6: 876–883. [DOI] [PubMed] [Google Scholar]
- Yi Q., Scalley M.L., Simons K.T., Gladwin S.T., Baker D. 1997. Characterization of the free energy spectrum of peptostreptococcal protein L. Fold. Des. 2: 271–280. [DOI] [PubMed] [Google Scholar]


