Abstract
Protein kinase C (PKC) is an important signal transduction protein whose cysteine-rich regulatory domain C1 has been proposed to interact with general anesthetics in both of its diacylglycerol/phorbol ester–binding subdomains, the tandem repeats C1A and C1B. Previously, we identified an allosteric binding site on one of the two cysteine-rich domains, PKCδ C1B. To test the hypothesis that there is an additional anesthetic site on the other cysteine-rich subdomain, C1A, we subcloned, expressed in Escherichia coli, purified, and characterized mouse PKCδ C1A. Octanol and butanol both quenched the intrinsic fluorescence of PKCδ C1A in a saturable manner, suggesting the presence of a binding site. To locate this site, PKCδ C1A was photolabeled with three diazirine-containing alkanols, 3-azioctanol, 7-azioctanol, and 3-azibutanol. Mass spectrometry revealed that at low concentrations all three photoincorporated into PKCδ C1A with a stoichiometry of 1:1 in the labeled fraction, but higher stoichiometries occurred at higher concentrations, particularly with azibutanol. Photocomplexes of PKCδ C1A with azioctanols were separated from the unlabeled protein by HPLC, reduced, alkylated, digested with trypsin, and sequenced by mass spectrometry. All the azioctanols photolabeled PKCδ C1A at residue Tyr-29, corresponding to Tyr-187 of the full-length PKCδ, and at a neighboring residue, Lys-40, suggesting there is an alcohol site in this vicinity. In addition, Glu-2 was photolabeled more efficiently by 3-azibutanol than by the azioctanols, suggesting the existence of a second, smaller site.
Keywords: protein kinase C, diazirine, mass spectrometry, anesthesia, photolabeling, fluorescence, binding site
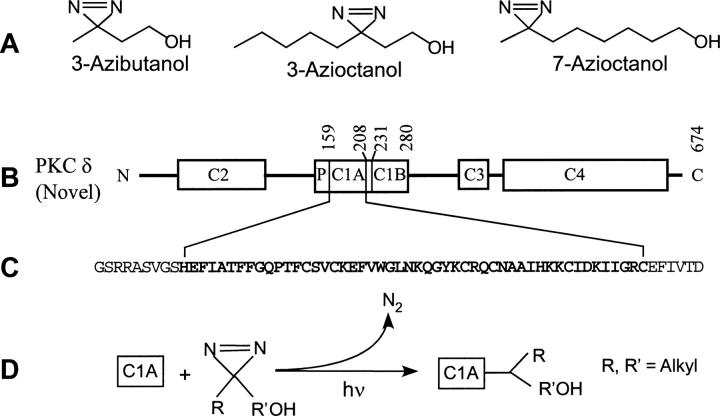
Protein kinase C (PKC) is an important signal transduction protein that has been proposed as the target of general anesthetics (Slater et al. 1993; Hemmings and Adamo 1994; for review, see Rebecchi and Pentyala 2002). The PKC superfamily plays a central role in signal transduction, regulating divergent cellular functions by phosphorylation of target proteins such as ion channels (Cho 2001; Newton 2001). It can be separated into two major categories, the conventional (α, βI, βII, γ) and the novel (δ, ɛ, θ, η) kinases, each having four domains, termed C1 though C4, that play distinct roles in the kinases’ function. C1 and C2 are the regulatory domains, C3 is the ATP binding domain, and C4 is the catalytic domain. The diacylglycerol (DAG) and phorbol ester binding sites are in the C1 domain, which consists of a tandem repeat of highly conserved cysteine-rich zinc finger subdomains C1A and C1B (residues 159–208 and 231–280 respectively in the δ isoform). These domains differ in their binding affinities for phorbol ester and sn-diacylglycerol (Slater et al. 1996; Irie et al. 1998; Stahelin et al. 2004; Pu et al. 2005). In the case of PKCδ and PKCα, the binding sites for DAG and phorbol esters are located in the C1A and C1B subdomains, respectively. Homology with different members of the superfamily is high within domains, but the novel kinases differ in having their C2 domain N-terminal to their C1 domain (Fig. 1) and in associating with membranes in a calcium-independent manner.
Figure 1.
Photolabels and protein used in the present study. (A) Diazirine analogs of butanol and octanol. (B) Schematic representation of the domains of protein kinase Cδ: The C1 regulatory domain binds to lipids, diacylglycerol, and phorbol esters; the C2 regulatory domain binds to anionic lipids but does not bind to Ca++; C3 is the ATP binding domain and C4 is the catalytic domain. P denotes the pseudo–substrate binding domain. C1B (residues 231–280) binds to phorbol esters with higher affinity than C1A (residues 159–208). (C) The 50 residues of subdomain C1A used in this study are shown in bold, and additional residues used in the construct are shown in regular type. (D) Simplified scheme for the reaction of aliphatic diazirine and C1A. (For a more complete description, see Brunner [1993].)
Stimulated PKC activity is modulated by anesthetics, and it has been proposed that discrete binding sites for general anesthetics could be present in the C1 domain (Slater et al. 1993, 1997). The isolated catalytic domain, C4, is unaffected by anesthetics, indicating that the primary anesthetic interaction occurs within the regulatory domains (Slater et al. 1993, 1996, 1997, 1998). In intact PKCα, volatile anesthetics and long- and short-chain alcohols modulate PKC activation in vitro and alter activator binding affinities. The enhancement of PKCα activity induced by octanol occurs in both the presence and absence of membranes, indicating that anesthetic binding is an intrinsic property of the kinase and not the result of membrane perturbation. Furthermore, the observations that both butanol and octanol inhibited low-affinity phorbol ester binding and that only octanol enhanced high-affinity phorbol ester binding suggest the presence of two alcohol binding sites in the C1 domain.
We previously characterized the anesthetic binding site in the second cysteine-rich high-affinity phorbol ester binding subdomain C1B (Das et al. 2004a,b). We found that octanol and butanol enhanced phorbol ester binding and that the binding site is in the proximity of Tyr-236 of the full-length protein. In the present study, we subcloned, expressed in Escherichia coli, and purified the first cysteine-rich low-affinity phorbol ester binding subdomain of mouse PKCδ C1A. We found that both butanol and octanol interact with PKCδ C1A, and that their diazirine derivatives photoincorporate into a primary site consisting of the neighboring residues Tyr-29 and Lys-40 of C1A, corresponding to residues 187 and 198 of the full-length PKCδ. In addition, a secondary site containing Glu-2 was preferentially photolabeled by 3-azibutanol.
Results
Protein purification and characterization
SDS-PAGE (10%) analysis of affinity-purified and thrombin-cleaved PKCδ C1A showed a single band around 7 kDa (Fig. 2A, inset). PKCδ C1A was characterized further by mass spectrometry, which showed the molecular weight of the protein to be 7331 Da, as expected (Fig. 2B). A number of other criteria suggest that the purified PKCδ C1A protein is correctly folded. Firstly, FPLC on a gel filtration column confirmed that the PKCδ C1A subdomain migrated as a single symmetrical peak with the expected Stokes radius. Secondly, analysis of the CD spectrum (Fig. 2A) suggests the secondary structure of PKCδ C1A has about two times more β-sheet content than α-helix content and a high content of random coil (∼40%) (Perczel et al. 1992). Thirdly, both DAG and DiC8 bind to PKCδ C1A. Vesicular DAG binds to PKCδ C1A with a Kd value similar to the value observed earlier (Stahelin et al. 2004). A 30-min incubation of 2 μM DiC8 with 2 μM PKCδ C1A caused 43% quenching of the protein intrinsic fluorescence indicating the DiC8 binding (data not shown).
Figure 2.
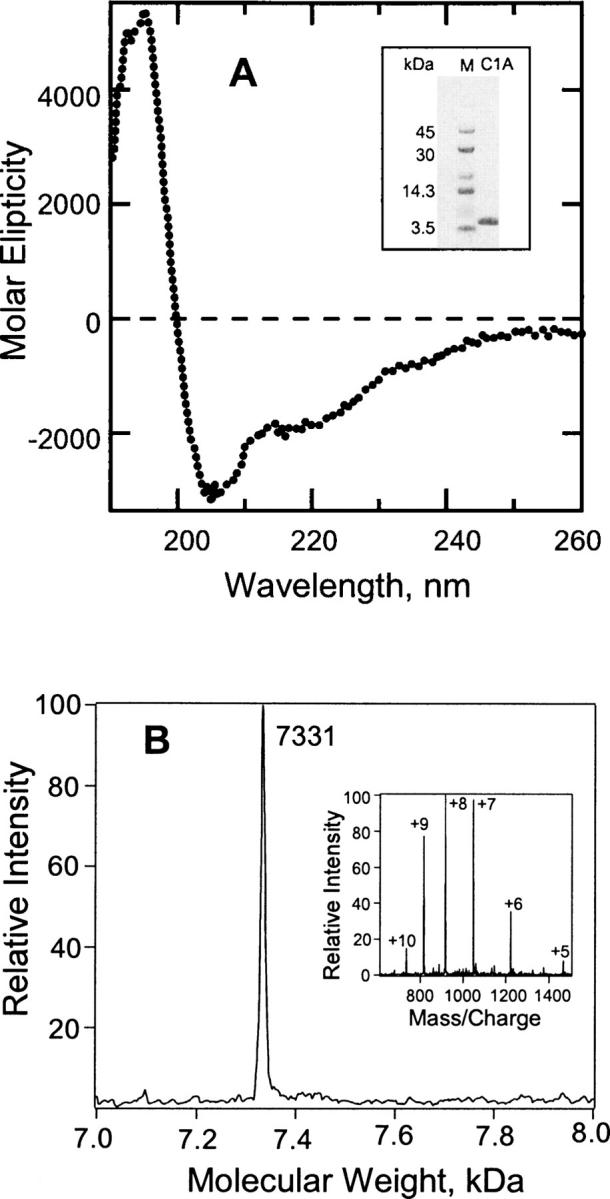
Characterization of PKCδ C1A. (A) Circular dichroism spectrum of expressed, purified PKCδ C1A. The protein concentration was 2.5 × 10⁻⁵ M in 5 mM phosphate buffer (pH 7.2). (Inset) SDS-PAGE (10%) of the purified PKCδ C1A. M denotes molecular weight marker. (B) Characterization of unlabeled PKCδ C1A by mass spectrometry. (Inset) The charge envelope of the PKCδ C1A (4 μM) obtained after the sample was infused into the LCQ Duo mass spectrometer. Deconvolution of this charge envelope yielded a single peak at 7331 Da.
Alcohol binding studies
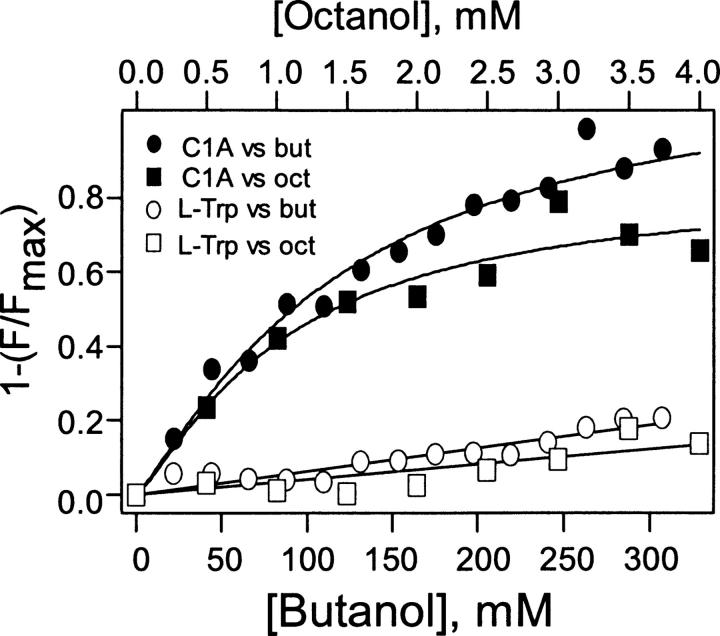
PKCδ C1A contains a single tryptophan (Trp-180) whose fluorescence was quenched by both butanol and octanol with a sigmoidal dependency of fluorescence intensity upon alcohol concentration (Fig. 3). As a control, alcohols were added to 1 μM L-Trp (see Materials and Methods). After subtracting this control, these data were fitted to logistic curves yielding EC50s of 78 mM for butanol and 840 μM for octanol and Hill coefficients of 1.5 ± 0.1 and 1.2 ± 0.3, respectively. Control experiments in which identical additions of DMSO were made to PKCδ C1A in buffer did not cause any significant fluorescence quenching (data not shown).
Figure 3.
Effects of octanol and butanol on the intrinsic fluorescence of PKCδ C1A. Quenching of PKCδ C1A fluorescence by octanol (filled square) and butanol (filled circle) is plotted after subtracting the data for nonspecific quenching of tryptophan (open symbols; see text). Curved lines represent nonlinear least square fits to the logistic equation (see Materials and Methods). F and Fmax are the average fluorescence intensities at 348–350 nm in the presence and absence of alcohol. Control experiments in which identical additions of DMSO were made to PKCδ C1A in buffer did not cause any significant fluorescence quenching (data not shown).
Concentration-dependent photolabeling of PKCδ C1A by azialcohols
PKCδ C1A–azioctanol complex could be separated from PKCδ C1A by HPLC. A series of HPLC traces with increasing concentration of 3-azioctanol (0–5 mM) are shown in Figure 4A. The percentage of unlabeled protein decreased and that of photocomplex formation increased with increasing concentration reaching a value of ∼25% at 5 mM 3-azioctanol. The HPLC peak at 1 mM, denoted by “a,” was collected between 14 and 16 min, concentrated, and characterized by mass spectrometry. It had a minor component with a molecular weight of 7331 Da and a major component of 7459 Da, corresponding to the unlabeled and monolabeled PKCδ C1A, respectively (Fig. 4B). The minor component might arise from contamination during the HPLC separation or decomposition of the labeled protein under the mass spectrometric conditions. At higher 3-azioctanol concentrations, some complexity in the HPLC profile can be discerned. For example, at 4 mM there is a shoulder at ∼13 min and a small peak at ∼16.5 min. These were not further investigated but may be caused by higher stoichiometries of photolabeling. This complexity is also consistent with the observation that the retention time of the photocomplexes decreased with increasing alcohol concentration.
Figure 4.
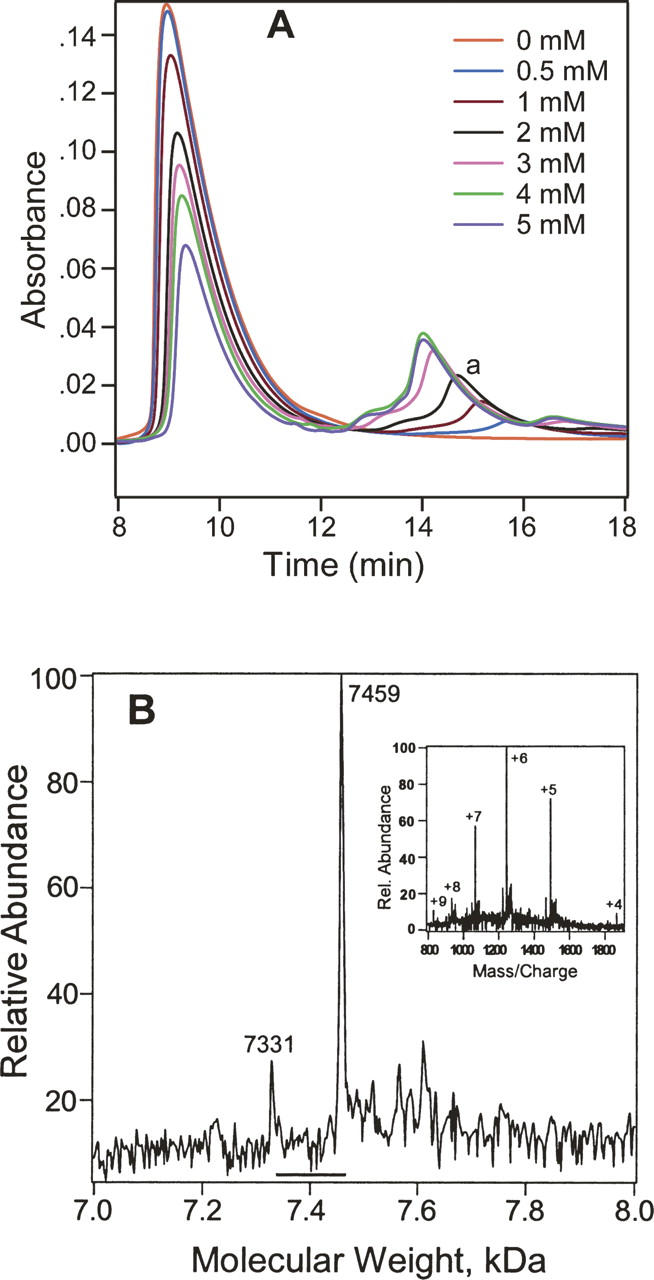
Concentration-dependent photolabeling of PKCδ C1A. (A) HPLC traces of the PKCδ C1A photolabeled at various concentrations of 3-azioctanol. The stated concentrations of 3-azioctanol were incubated with 0.14 mM PKCδ C1A for 20 min, photoirradiated for 30 min, and analyzed by HPLC. Unmodified PKCδ C1A is the large peak on the left. PKCδ C1A-azioctanol photocomplex is indicated as “a.” (B) The deconvoluted mass spectrum of the PKCδ C1A-azioctanol complex. Fractions (14–16 min) corresponding to the 1 mM (Fig. 4A) trace were collected, concentrated, and infused into the mass spectrometer. The small peak at 7331 Da is the mass of unchanged PKCδ C1A, and the large peak at 7459 Da has a single azioctanol incorporated. (Inset) The corresponding charge envelope.
Determination of the mole ratio of alcohol photoincorporation into PKCδ C1A by MS
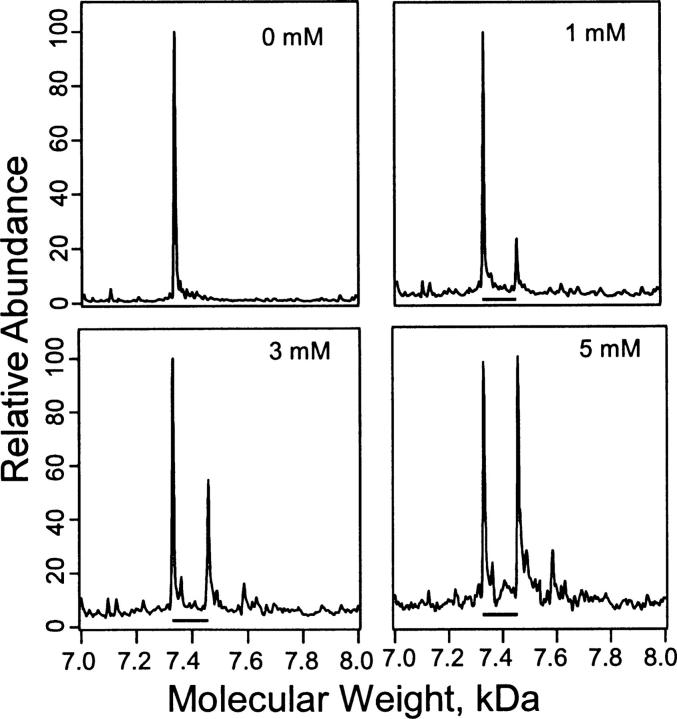
The deconvoluted spectra obtained from the charge envelopes for the unseparated photoreaction mixtures of PKCδ C1A and 3-azioctanol (0–5 mM) are shown in Figure 5. The molecular weight of both labeled and unlabeled protein can be determined because of their unique mass/charge envelopes (Addona et al. 2002; Das et al. 2004a). Deconvolution of these mass/charge envelopes yielded two major peaks with molecular weights that did not differ significantly from the expected ones of 7331 Da for PKCδ C1A and 7459 Da for PKCδ C1A modified by photoincorporation of a single azioctanol. The observed molecular weight difference between the two major peaks was 128 ± 1 Da. A higher-molecular-weight peak, corresponding to the photoincorporation of two azioctanols (7587 Da), was only observed at 3–5 mM azioctanol. The proportion of singly labeled PKCδ C1A increased with 3-azioctanol concentration.
Figure 5.
Stoichiometry of photoincorporation of 3-azioctanol into PKCδ C1A. Deconvoluted spectra of the charge envelopes of PKCδ C1A (4 μM) photolabeled with 3-azioctanol (0, 1, 3, or 5 mM). Bars show mass shifts of 128 Da corresponding to the incorporation of a single molecule of 3-azioctanol into PKCδ C1A. The photolabeled protein solution was directly infused by using a syringe pump into a LCQ Duo mass spectrometer. Mass spectra were acquired from m/z 300 to m/z 2000 with a maximum ejection time of 400 msec. Molecular weights were calculated from the charge envelopes in each case (not shown).
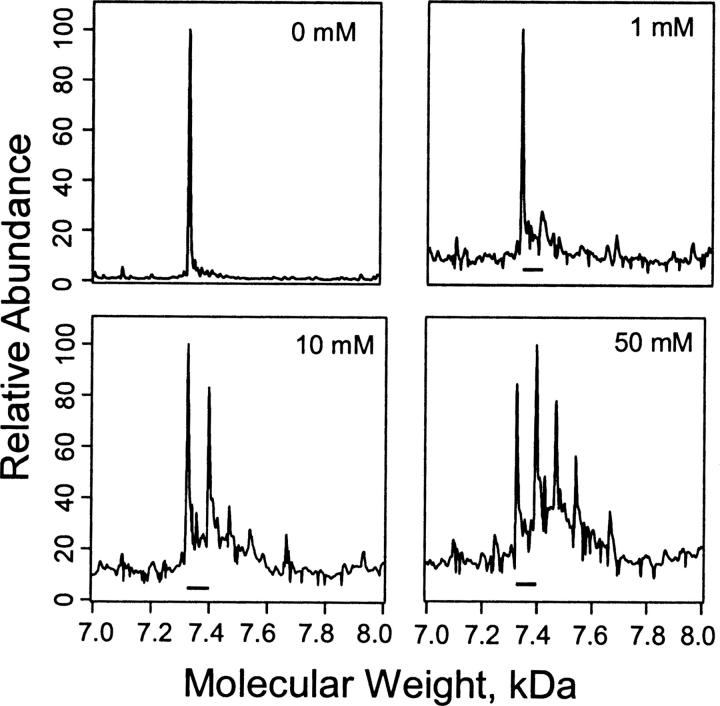
Similarly Figure 6 shows deconvoluted spectra for PKCδ C1A photolabeled with 3-azibutanol. At 1 mM, photoincorporation was rather low and had a mole ratio of 1:1. However, with increasing concentration of azibutanol (10 or 50 mM) this photoincorporation increased until its peak was of higher intensity than the control. Furthermore, new peaks corresponding to mole ratios of 1:2 and 1:3 appeared and were particularly prominent at 50 mM.
Figure 6.
Stoichiometry of photoincorporation of 3-azibutanol into PKCδ C1A. Deconvoluted mass spectra of the charge envelopes of PKCδ C1A (4 μM) photolabeled with 3-azibutanol (0, 1, 10, or 50 mM) determined as in Figure 5. Bars show mass shifts of 72 expected for the incorporation of a single molecule of 3-azibutanol into PKCδ C1A.
The charge envelope for PKCδ C1A photolabeled with 1 mM 7-azioctanol was deconvoluted to yield molecular weights corresponding to the expected values of 7331 and 7459 Da that differed by 128 Da, consistent with photoincorporation of 7-azioctanol at a molar ratio of 1:1 (data not shown).
Identification of photolabeled amino acid residues by LC/MS/MS
All peptides generated by trypsin digestion of photolabeled PKCδ C1A were analyzed by LC/MS/MS. Fragmentation along the peptide backbone results in series of ions that contain for a given peptide either the N terminus (called “a,” “b,” and “c” ions) or the C terminus (“x,” “y,” and “z” ions) (Kinter and Sherman 2000). Under our experimental conditions, b and y ions predominate and are identified by an index that denotes the number of residues remaining in the fragment ion.
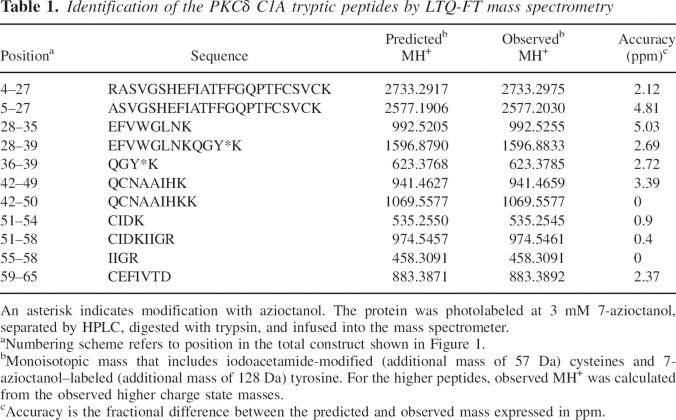
More than 90% of the PKCδ C1A construct was identified (60 out of 65 residues) after being photolabeled, HPLC-purified, reduced, alkylated, and digested with trypsin (Table 1). When run on the LCQ-FT instrument, the fragment ions were observed with very high (2–5 ppm) mass accuracy. Two predicted tryptic fragments were not identified: GSR (residues 1–3 of the total construct) and CR (residues 40–41). (Note that only in Table 1 and this paragraph do the residue numbers refer to the entire construct shown in Fig. 1.) The N-terminal peptide GSR is part of the nine extra residues that were included for cloning the PKCδ C1A. To rule out photoincorporation in the residues 1–3, we attempted to sequence intact PKCδ C1A by selecting the +7 charged state from the mass spectrum of an HPLC-purified undigested 3-azioctanol–photolabeled (1 mM) sample and sequencing it by MS/MS. In the complex resulting spectrum, there was a pair of unmodified triply charged b18 (m/z 637) and b19 (m/z 680) ions in both the control and the labeled sample, suggesting that azialcohol does not photoincorporate into the first 19 N-terminal residues. Although it was not observed, it is likely that R41 was not photolabeled because tryptic cleavage following it was not inhibited by photolabeling (Table 1). Similarly C40 is likely not photolabeled because we were able to observe all six reduced and alkylated cysteine residues.
Table 1.
Identification of the PKCδ C1A tryptic peptides by LTQ-FT mass spectrometry
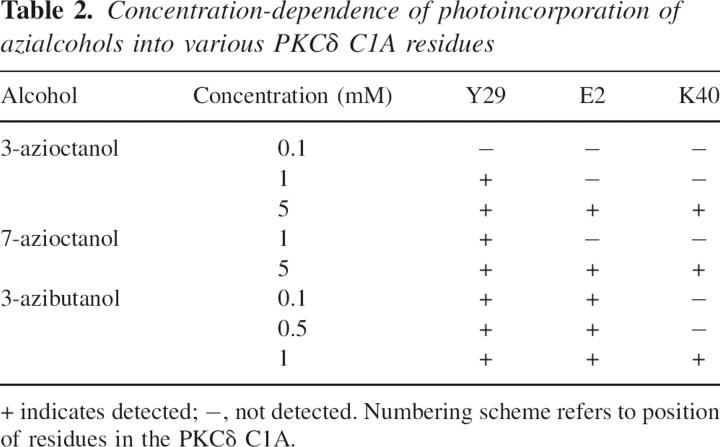
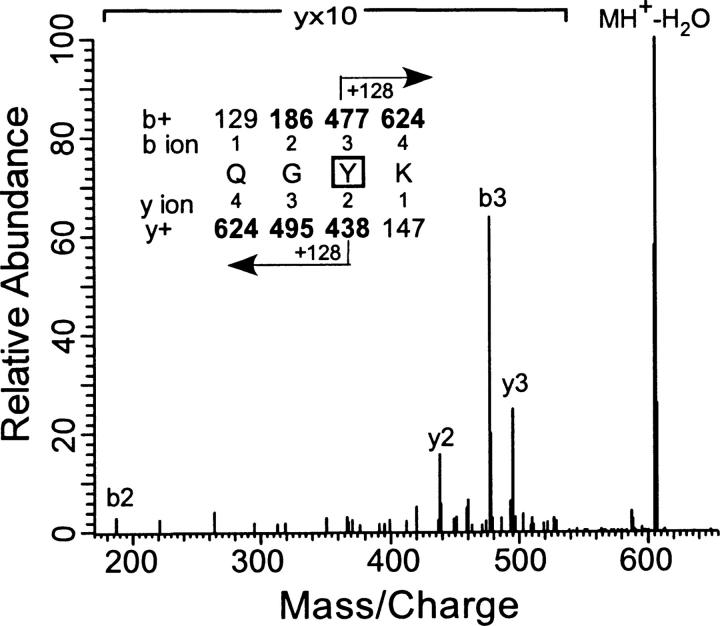
For the peptide sequencing experiments, MS/MS spectra were acquired under automatic acquisition of the most intense ion from each MS scan. All the residues that were found to be photolabeled by the azialcohols are summarized in Table 2, and representative supporting evidence is presented below. Figure 7 shows the collision-activated dissociation MS/MS spectrum of the singly charged 7-azioctanol (1 mM)–labeled tryptic peptide QGYK (m/z 623.4). All ion fragments that contain an azioctanol-modified residue will have a mass increase of 128 Da. In the b-series, b3 (477.2) and, in the y-series, y2 (438.4) and y3 (495.4) fragment ions were observed to have photoincorporation. The y-ion series was inconclusive, but the additional decrease in mass in b2 (186.2) revealed that b3 (Tyr-29 of PKCδ C1A) is the site of photoincorporation. In another sample, which was photolabeled with a higher concentration of 7-azioctanol (3 mM), the partially digested, photoincorporated EFVWGLNKQGYK was observed and 15 of 22 possible b- and y-ions were assigned. In the y-ions, y3 and y5–11 included photoincorporation, as did b11. Several unmodified b-ions were also observed (data not shown). These observations restricted the site of modification to the G or Y. An MS/MS/MS analysis of this peptide (data not shown) did not resolve the issue because of the poor intensity of the fragment ions. However, photoincorporation into QGYK was also observed, and sequencing assigned the photoincorporation site as Tyr-29 (data not shown). In all our photolabeling experiments (>10), we detected both the modified and unmodified QGYK with consistent b2, b3, and y2 ions (Supplemental Figs. 1–3). Modification in the QGYK is confirmed because we detected this peptide in the LTQ-FT experiments with 2.7 ppm accuracy. Detection of intense 128-Da mass shifted b3 and unmodified y3 means that the modification is either on Y or K. However if K is modified then trypsin would not cleave after K (for example, see Fig. 9). This confirms that Y is the site of modification.
Table 2.
Concentration-dependence of photoincorporation of azialcohols into various PKCδ C1A residues
Figure 7.
Identification of Tyr-29 as the site of photoincorporation of 7-azioctanol by LC/MS/MS using LTQ mass spectrometer. MS/MS data for the 7-azioctanol (1 mM) modified peptide QGYK obtained from the tryptic digest of PKCδ C1A. The site of attachment for 7-azioctanol was deduced from this spectrum. (Inset) The predicted mass/charge ratio of N-terminal ions (b-ions) and C-terminal ions (y-ions) are shown above and below the sequence, respectively. The horizontal arrows show which m/z values for the b-ions (above) and y-ions (below) have a mass of 128 Da added to them. Observed values are shown in bold. In the spectrum, the identified b- and y-peaks are labeled with a letter followed by a number that indicates the number of residues remaining in the ion fragment. Loss of residues from the C terminus results in b-ions, and those from the N terminus, in y-ions.
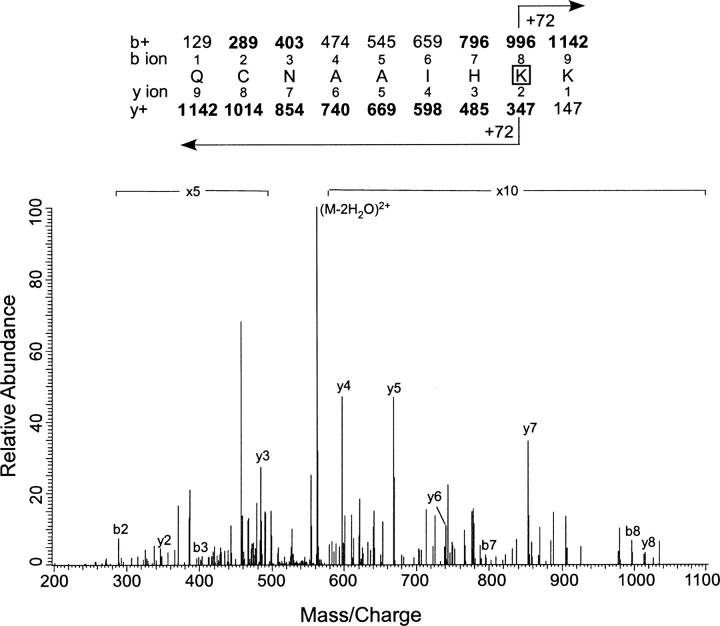
Figure 9.
Identification of Lys-40 as the site of photoincorporation of 3-azibutanol by LC/MS/MS using LTQ mass spectrometer. MS/MS data for the 3-azibutanol–labeled peptide QCNAAIHKK obtained from the tryptic digest of PKCδ C1A. The site of attachment for 3-azibutatanol was deduced from this spectrum. (Inset) The predicted mass/charge ratio of N-terminal ions (b-ions) and C-terminal ions (y-ions) are shown above and below the sequence, respectively. The horizontal arrows show which m/z values for the b-ions (above) and y-ions (below) have a mass of 72 Da added to them. Observed values are shown in bold.
At 5 mM 7-azioctanol, two additional residues, Glu-2 and Lys-40, were photolabeled. In the MS/MS spectrum of the doubly charged 23-residue peptide ASVGSHEFIATFFGQPTFCSVCK (m/z 1353.8), the 128-Da mass increment was observed on the b7–b15 and b17 ion (b16 was not observed), whereas b6 was unmodified, indicating that the seventh residue, i.e., Glu-2, is the site of modification (data not shown). In the y-ion series, y4–y6 and y8–y16 were observed to be unmodified, consistent with a label on y17 or higher. Photoincorporation at Lys-40 was detected on the MS/MS spectrum of the 7-azioctanol-labeled doubly charged nonapeptide, QCNAAIHKK, for which all the observed y2–y8 ions showed an increased mass of 128 Da (data not shown). This uncertainty was resolved in the b ion series, where b2, b3, b6, and b7 were unmodified but b8 was found to be modified as expected if Lys-40 is the photolabeled residue.
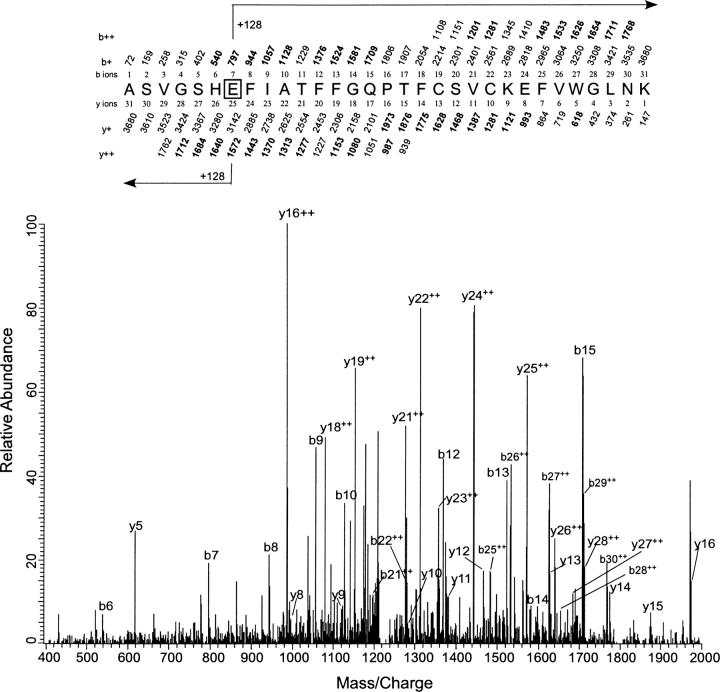
At 100 μM 3-azioctanol, no photolabeling was detected. At 1 mM 3-azioctanol, the only residue photolabeled was Tyr-29 based on the observation of singly charged b2, b3, y2, and y3 of QGYK with the same pattern of molecular weights as above. However, when the 3-azioctanol concentration was raised to 5 mM, in addition to Tyr-29, two more photolabeled residues were observed, as in the case of 7-azioctanol. Photoincorporation at the Glu-2 was deduced from the MS/MS scan (Fig. 8) of the triply charged 31-residue peptide ASVGSHEFIATFFGQPTFCSVCKEFVWGLNK. A series of doubly charged y-ions (y21++ to y28++) was observed all with strong signals. The y21–24++ ions were unmodified, whereas the y25–28++ ions were modified, placing the site of photoincorporation at Glu-2. Observation of the singly charged modified b7–b10, b12–15, and unmodified b6 confirmed the modification at Glu-2.
Figure 8.
Identification of Glu-2 as the site of photoincorporation of 3-azioctanol by LC/MS/MS using LTQ mass spectrometer. MS/MS data for the 3-azioctanol (5 mM) modified 31-residue peptide ASVGSHEFIATFFGQPTFCSVCKEFVWGLNK obtained from the tryptic digest of PKCδ C1A. The site of attachment for 3-azioctanol was deduced from this spectrum. At the top of the figure, the predicted mass/charge ratio of N-terminal ions (b-ions) and C-terminal ions (y-ions) is shown above and below the sequence, respectively. The horizontal arrows show which m/z values for the b-ions (above) and y-ions (below) have a mass of 128 Da added to them. Observed values are shown in bold. No ions were observed below a m/z of 400.
The assignment of Glu-2 was further confirmed in a doubly charged 23-residue peptide ASVGSHEFIATFFGQPTFCSVCK (m/z 1353.8) of the 5 mM 3-azioctanol sample (see Supplemental Fig. 4). The b7–15 and b17 ions were observed to contain an additional mass of 128 Da. Detection of the unmodified b6 indicated that Glu-2 of PKCδ C1A is the residue photolabeled. This is consistent with lack of photoincorporation in the y5, y6, and y8–16 ions. Although the b6 ion was of low intensity, it was consistently observed in six independent samples. Identification of the Lys-40 as the third site of photoincorporation was made from the same peptide as described for 7-azioctanol (QCNAAIHKK) (data not shown). In this case, however, several doubly charged fragment ions were observed, strengthening this interpretation.
Similarly, we sequenced 3-azibutanol–photolabeled PKCδ C1A after tryptic digestion by online LC/MS/MS. At 100 and 500 μM, residues Glu-2 and Tyr-29 were both photolabeled, but at 1 mM a third residue, Lys-40, was also photolabeled (Fig. 9). In the MS/MS spectrum for the doubly charged photolabeled nonapeptide QCNAAIHKK (precursor mass of 571.6), all the observed y-ions, y2–y8, showed a mass shift of 72 Da. Observation that the b8 ion at 996, but not the b7 ion, has an additional mass of 72 Da showed that Lys-40 is the labeled residue. Although we only observed a stoichiometry of one in Figure 6, at 1 mM this is not inconsistent with the observation of three photolabeled residues. It is likely that there are three separate species with stoichiometry of one. Because the probability of photolabeling a single residue is low, and the probability of observing a stoichiometry of two or higher is the product of the single labeling probabilities, the chance of observing a stoichiometry of two or higher at 1 mM is very low.
To define nonspecific binding, PKCδ C1A was photolabeled with 50 mM 3-azibutanol. In addition to the three residues above, several others, such as Glu-19, Asp-44, and Lys-45, were photolabeled (Supplemental Table).
Effect of DiC8 on photolabeling of PKCδ C1A and 3-azioctanol
No significant difference is observed in the percentage of photoincorporation of 3-azioctanol into PKCδ C1A in the presence and absence of DiC8 as determined by integrating the photocomplex peak area from the HPLC traces, as in Figure 4A. Even after changing the DiC8 to protein ratio from 1:1 (saturation) to 1:2 (half saturation) or increasing 3-azioctanol from 1 to 3 mM, no significant effect of DiC8 could be detected. Mass spectral sequencing of the photolabeled PKCδ C1A with and without DiC8 detected QGYK as the only 3-azioctanol–labeled peptide. In both cases, Tyr-29 was the site of photoincorporation, indicating that there is no other effect of DiC8 (data not shown).
Homology modeling of the structure of PKCδ C1A
In order to model the structure of PKCδ C1A, we used the CPH-models server (Lund et al. 2002; http://www.cbs.dtu.dk/services/CPHmodels/), which conducts a profile–profile alignment to find structures related to C1A. The program selected β-chimaerin (Protein Data Bank [PDB] code 1XA6) with 36% sequence identity as a template; in contrast, PKCδ C1B (PDB code 1PTQ) gave a value of 42%. The sum of the pairwise score of 1XA6 was higher than 1PTQ. Automated homology model building starting from 1XA6 template was then performed using the segmod program (Levitt 1992) and was refined using the encad program (Levitt et al. 1995) from the GeneMine package (http://www.bioinformatics.ucla.edu/genemine/). The total energy of these structures was computed by using GROMOS96 implemented in the program Swiss-model. All gave satisfactory negative free energies: The modeled structure of C1A gave a total energy of −1940 kJ/mol; the structure of 1PTQ gave −510 kJ/mol, and that for 1XA6 was −2270 kJ/mol. The reliability of the structural prediction of C1A was further checked by using the program PROCHECK (Laskowski et al. 1993), and the stereochemistry of the model was found to be satisfactory because in the Ramachandran plot 72.1% of the residues occupy the most favored region and the remaining 27.9% of the residues are in the additional allowed region. Further validation was obtained with VERIFY-3D (http://nihserver.mbi.ucla.edu/Verify_3D/; Luthy et al. 1992). This program is based on several statistically derived preferences and on the accessible surfaces of the amino acid residues. It yielded a score for the structures based on 1XA6 and 1PTQ of 0.62 and 0.52, respectively, where scores >0.5 are considered satisfactory. When comparing the structural alignment of the α-carbon trace of C1A with 1AX6 and 1PTQ, the root mean square deviations are 0.73 and 0.82 Å, respectively. The above results indicate that the homology model is reliable. The modeled structure is shown in Figure 10.
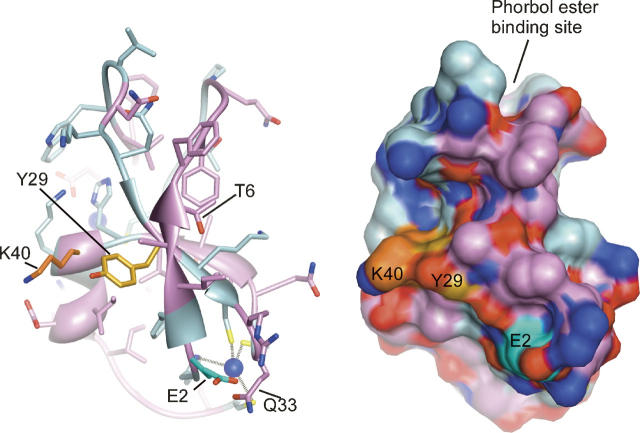
Figure 10.
Location of photolabeled residues in the modeled PKCδ C1A structure. Modeled structure of PKCδ C1A showing the positions of the photolabeled residues listed in Table 2. Tyr-29 and Lys-40 are in contact forming one site, whereas Glu-2 is more distant. The model is based on the published crystal structure of PKCδ C1B (Zhang et al. 1995), with all residues mutated to their equivalents in PKCδ C1A. The backbone and side-chain carbon atoms are colored light blue for residues that are conserved and plum for residues that are not conserved between C1A and C1B. The side-chain carbons of Tyr-29, Glu-2, and Lys-40 are colored gold, cyan, and orange, respectively. The zinc atoms, which each coordinate three conserved cysteines and one conserved histidine, are shown in dark blue. Molecular graphics images were produced by using the UCSF Chimera package from the Computer Graphics Laboratory, University of California, San Francisco (supported by NIH P41 RR-01081) (Pettersen et al. 2004).
Discussion
The hypothesis of Slater et al. (1997) is that anesthetics act on PKC activity by interacting with both of the tandem repeats that constitute the C1 domain. Their studies with PKCα showed anesthetics to interact both with the subdomain that binds phorbol esters with the highest affinity, where they allosterically enhance phorbol binding, and with the subdomain that binds phorbol esters with lower affinity, where they inhibit phorbol binding. In an earlier study of the subdomain in PKCδ that binds phorbols with higher affinity, C1B, we showed that anesthetics allosterically enhanced binding of the fluorescent phorbol ester, SAPD, and we located this allosteric site by photolabeling it with azialcohols (Das et al. 2004a), thus confirming part of the above hypothesis. The current study focuses on the other subdomain, C1A, of PKCδ. It is homologous, but not identical, to C1B. It binds diacylglycerols with high affinity, but its affinity for phorbols is very low. We could detect anesthetic–protein interactions indirectly from alcohol-induced intrinsic fluorescence quenching, and we confirmed this interaction by photolabeling with three azialcohols. However, we were unable to show with either technique any allosteric interaction between the agents studied and a DAG analog, DiC8. Thus, although we find an interaction between C1A and alcohols, consistent with the hypothesis of Slater et al. (2004) we were unable to confirm their hypothesized allosteric interaction with the phorbol/DAG site. This discrepancy is probably minor, resulting from the subtle structural differences between the α and δ isoforms of PKC. Indeed, the alcohol pharmacology of PKCα is highly specific, even exhibiting entantioselectivity, suggesting that the details of the binding pocket are important.
The location of these alcohol binding sites was sought by photolabeling. At the lowest concentrations examined, 3-azioctanol, 7-azioctanol, and 3-azibutanol all photolabeled PKCδ Tyr-187, which is Tyr-29 on C1A (Table 2). We conclude that there is a site for all the alcohols in this vicinity. In addition, at these concentrations Glu-160, which is Glu-2 on C1A, was photolabeled only by 3-azibutanol. That 3-azibutanol identified more residues than the azioctanols is consistent with a previous study in adenylate kinase, where 3-azibutanol identified two more residues than the azioctanols (Addona et al. 2002). In the latter case, on the known structure the extra residues that were labeled by 3-azibutanol were situated in a separate pocket, too small to accommodate the azioctanols. In PKCδ C1A, both Glu-2 and Tyr-29 were photolabeled even when the concentration of 3-azibutanol was lowered to 100 μM, suggesting that both sites may have comparable affinity for 3-azibutanol. However, when we next raised the 3- and 7-azioctanol concentration to 5 mM, we found that Glu-2 was photolabeled, suggesting that rather than sterically excluding octanol derivatives, the latter site simply has a lower affinity for them.
Where are Glu-2 and Tyr-29 situated in the structure of C1A? In the case of PKCδ C1A, there is no structural information. However, crystal and solution structures have been published for several other C1 subdomains (Zhang et al. 1995; Xu et al. 1997; Canagarajah et al. 2004; Shen et al. 2005). All show the same compact zinc binding region and very similar backbone structure. Comparison of the sequence of PKCδ C1A with these other C1 domains shows that in all cases the two histidine and three cysteine residues that interact with each zinc are conserved and that the domains generally contain 50 residues. On this basis we modeled the structure of PKCδ C1A, making the 29 substitutions for nonconserved residues and minimizing the structure (see Results). The resulting structure is shown in Figure 10, where it can be seen that the side chains of Glu-2 and Tyr-29 are distant from each other, their α-carbons being separated by 9.4 Å. Furthermore, the side chain of Glu-2 is pointing away from Tyr-29 and the two residues do not line a single pocket, which is consistent with the photolabeling data suggesting two separate sites. Furthermore, because the current mass spectrometer was more sensitive than that used previously (Das et al. 2004a), we repeated the photolabeling of PKCδ C1B with 1 mM 3-azioctanol. Tyr-6 was confirmed as the main site of incorporation, but a weaker site was detected at Asp-33, which corresponds to Gln-33 in C1A. The later residue is in contact with Glu-2 (Fig. 10), thus adding further evidence for the existence of a secondary alcohol site in this vicinity. Structural studies will be required to confirm these conclusions.
On the other hand, Lys-40 is in very close proximity to Tyr-29, their α-carbons being separated by just 6 Å. The lysine Cβ–Cδ and the tyrosine Cδ2–Cγ2 carbons are essentially in contact, being separated by ≤4.0Å (atom center to atom center), suggesting they are part of a single site. At first sight it is puzzling, then, that although all three azialcohols photolabeled this residue, they only did so at higher concentrations than were required to photolabel Tyr-29 (Table 2). However, the level of photolabeling in each residue is a function not just of site occupancy or affinity but also of the inherent variation in reaction rate between the photolabel and each residue (Sigrist et al. 1990; Brunner 1993). Based on the available data, insertion of aliphatic diazirines into tyrosines is relatively efficient, whereas insertion into lysines has not been reported previously. Thus, we tentatively conclude that these two residues are part of a single alcohol binding pocket but the threshold for the detection of the slower reacting Lys-40 is not attained until 5 mM azialcohol. Furthermore, unlike in one previous study (Addona et al. 2002), the residues were equally well photolabeled by 3- and 7-azioctanol, suggesting no preferential orientation of these alcohols.
The location of the above sites on PKCδ C1A differs from that in C1B, where Tyr-6 was photolabeled by all three photolabels at 1 mM (Das et al. 2004a) and where preliminary structural information shows alcohol contact with Tyr-6 and with Met-9 (Das et al. 2004b). However, neither of these residues is conserved between the two C1 subdomains of PKCδ. The substitutions (C1B to C1A) are Y6T and M9G. Of these, the latter is probably the most significant because it likely introduces flexibility in the backbone structure and alters the topology of the surface. Thus, the lack of photolabeling on this locality on C1A is not unexpected. Conversely, none of the residues photolabeled in C1A at up to 1 mM were photolabeled in C1B at that concentration, and this is consistent with the lack of conservation of these residues (the substitutions are E2R, Y29L, and K40H). Aliphatic diazirines have not been observed to react with aliphatic side chains, but histidines have been observed to do so at 0.1–1 mM 3-azioctanol (Addona et al. 2002). Perhaps, the Y29L substitution, by removing the possibility of hydrogen bond formation with the alcohol, lowers the binding affinity significantly, resulting in no photolabeling of His-40 on PKCδ C1B.
Comparison of PKCδ C1B and C1A reveals a further interesting aspect of these sites. In C1B, preliminary crystallography data places the alcohol between Tyr-6 and Met-9 (Das et al. 2004b), the latter residue being on the first phorbol-binding loop. On PKCδ C1A, a similar groove exists between the photolabeled residues (Lys-40 and Tyr-29) and the second phorbol-binding loop, suggesting that the ability of alcohols to modulate function in this superfamily may be related to proximity of these sites to the phorbol-binding loops.
The aliphatic diazirines have not been extensively used until recently (Addona et al. 2002; Das et al. 2004a; Ziebell et al. 2004). Like all photolabeling agents, their reaction rate with a given side chain is expected to vary. A recent treatment based on molar incorporation derived from Edman sequencing noted that the relative degrees of insertion into various residues were as follows: D, E, Y>C, H, Q, and S>aliphatics. In addition, it was noted that in many cases reactive residues that were in the vicinity of the binding site but not actually in it (based on independent structural information) were not photolabeled, suggesting that photolabeling is a reflection firstly of occupancy and only then of reactivity (Ziebell et al. 2004). These conclusions were based on a relatively high affinity general anesthetic, azietomidate, bearing an 3-azibutanol moiety (Husain et al. 2003). Because smaller general anesthetics and alcohols have lower potencies, of the order of 10−4–10−2 M, it is important to define their limits of usefulness. In the case of the most reactive residues, aspartate and glutamate, the strategy of titrating down the photolabel concentration to eliminate nonspecific photoincorporation is shown to be essential and effective by the fact that all five of these residues in the C1A construct (Fig. 1) were photolabeled at 50 mM 3-azibutanol, but only one was photolabeled in the concentration range of 0.1–1.0 mM. The results obtained in the paragraph above also cast some light on the EC50 obtained. The EC50 values reported in this article were measured by direct quenching of the single tryptophan's fluorescence in the PKCδ C1A domain. Although the EC50 of tryptophan quenching for butanol is indeed high at 78 mM, we were able to photolabel two residues Tyr-29 and Glu-2 at 100 μM azibutanol. To investigate the significance of the EC50, we photolabeled at 50 mM azibutanol and found several other residues, including the two residues mentioned above, to be labeled. This suggests that the observed fluorescence quenching is caused by binding to several sites simultaneously. In the case of octanol, however, the situation was simpler. The fluorescence EC50, 0.8 mM, is close to the value of the lowest concentration, 1 mM, at which we were able to photolabel one residue.
Anesthetic potencies of octanol and butanol are 57 μM and 10.8 mM, respectively, and those of their azi-derivatives are slightly higher (Alifimoff et al. 1989; Husain et al. 1999). The fact that in PKCδ C1A 3-azibutanol photoincorporates at a concentration one hundredth of its anesthetic potency makes it relatively more potent than octanol. This is also evident in studies of the activity of intact PKC that show (relative to the anesthetic potency) butanol is far more active than octanol in a number of different assays that have been performed both with and without lipids (Slater et al. 1997, 2004).
In conclusion, we have identified a primary alcohol binding site on PKCδ C1A located in the proximity of Tyr-29 and Lys-40, and there appears to be a secondary site favoring smaller alcohols in the vicinity of Glu-2. These new data support the hypothesis that discrete alcohol binding sites exist in the phorbol ester binding regulatory domain, C1, of PKC as proposed by Slater et al. (1997). The presence of anesthetic binding sites in both the cysteine-rich C1A and C1B domains suggests the complex nature of kinase activity regulation by alcohols.
Materials and methods
Material
TPCK-treated trypsin was obtained from Boehringer Mannheim; glutathione-Sepharose 4B, from Amersham Biosciences. 1,2-sn-Dioctanoylglycerol (DiC8) was purchased from Avanti Polar Lipids. 3-Azioctanol (Husain et al. 1999), 7-azioctanol (Addona et al. 2002), and 3-azibutanol (Fig. 1A; Church and Weiss 1970) were synthesized as described. All other reagents were obtained from Aldrich. Protein concentration was determined with a BCA protein assay reagent kit (Pierce).
Plasmid construction, bacterial expression, and purification of the PKCδ C1A
DNA coding for residues 159–208 of mouse PKCδ was subcloned into BamH1 and EcoR1 sites of pGEX-2TK (Pharmacia) from a pGEM-T vector containing the full-length PKCδ wild-type gene. This was kindly provided by Dr. P.M. Blumberg of the National Institutes of Health (Bethesda, MD). The protein was expressed as a thrombin cleavable glutathione S-transferase fusion protein in E. coli BL21 gold. The vector construction led to a post-cleavage expressed protein containing N- and C-terminal extensions with the sequences Gly-Ser-Arg-Arg-Ala-Ser-Val-Gly-Ser and Glu-Phe-Ile-Val-Thr-Asp, respectively (Fig. 1C). The protein was expressed and purified as described in the literature (Quest et al. 1995). Briefly, cell pellets were treated with 1% Triton X-100 and lysozyme (1 mg/mL), followed by sonication and centrifugation. The clarified supernatant was applied to a glutathione-Sepharose column. The bound protein was thoroughly washed, released by thrombin cleavage, eluted with PBS, and concentrated by ammonium sulfate precipitation. It was further purified by FPLC (BioRad Biologic Workstation) using a Superdex 75 column (Amersham Biosciences), a mobile phase of 50 mM Tris and 100 mM NaCl (pH 7.0), and a flow rate of 0.5 mL/min.
The purity of the affinity-purified and thrombin-cleaved PKCδ C1A was characterized by 10% SDS-PAGE.
CD measurements
Circular dichroism spectra were recorded from 260 to 190 nm at 25°C on an Aviv 62 DS instrument (Aviv Associates) in a quartz cell of 0.1-cm path length. Data were collected at 0.5-nm intervals and an accumulation time of 20 sec. CD spectra were fitted by using a CDNN program and the neural network approach of Bohm et al. (1992).
Fluorescence measurements
Fluorescence measurements were performed on a Jobin Yvon Spex (model Fluoromax-2, ISA Instruments S.A., Inc.) fluorimeter equipped with temperature and stirring control systems. A 1.5-mL cuvette (Hellma) with a Teflon stopper was used for measuring fluorescence intensity.
For quenching studies with alcohols, butanol (neat) and octanol (0.25 M in DMSO) were titrated by addition of successive 2 μL aliquots into 1 mL of PKCδ C1A (1 μM) in buffer (50 mM Tris at pH 7.2). The sample was excited at 280 nm, and intrinsic fluorescence quenching was monitored by recording fluorescence emission from 300–500 nm. The average fluorescence intensity between 348 and 350 nm was normalized to that without additions (F/Fmax) and used in the analysis of binding curves.
Addition of butanol (neat) and octanol (in DMSO) to a 1 μM L-tryptophan solution was used as a control for nonspecific effects of alcohols on fluorescence quenching.
After subtracting the contribution from the nonspecific binding, butanol and octanol titration curves were fitted by using the following equation (Dodson et al. 1987):
 |
where Max is the maximum value of the effect, EC50 is the equilibrium ligand concentration at half maximum effect, nH is the Hill coefficient, and x is the concentration of the alcohol.
Binding of DiC8 to PKCδ C1A was studied by addition of 2 μM DiC8 (2 μL in DMSO) in 2 μM PKCδ C1A and recording the intrinsic protein fluorescence after a 30-min incubation at 25°C.
Surface plasmon resonance analysis
Kinetics of vesicle-protein binding was determined by the SPR analysis as described earlier (Stahelin et al. 2004). Briefly, 25 nM PKCδ C1A was injected over a POPC/POPS (80:20) or POPC/POPS/DAG (79:20:1) surface and the response was recorded. Equilibrium dissociation constant, Kd, was determined as described previously (Stahelin et al. 2004).
Determination of stoichiometry of photolabeled PKCδ C1A by electrospray ionization mass spectrometry
A 10–15 μL aliquot of freshly FPLC–purified PKCδ C1A was added to water (±azialkanol) to a final concentration of 4 μM PKCδ C1A in a total volume of 200 μL. Appropriate amounts of aqueous 3-azioctanol, 7-azioctanol, or 3-azibutanol were preincubated for 30 min. Photolabeling was carried out at 365 nm for 30 min using a model UVL-56 20W Black-Ray handheld lamp (Upland). A few microliters of acetic acid were added after photolabeling to a final concentration of 1%. The sample was directly infused into the mass spectrometer (LCQ, ThermoElectron) using a syringe pump. Mass spectra were acquired from m/z 300 to m/z 2000 with a maximum ejection time of 400 msec. Molecular weights for both the modified and unmodified forms of PKCδ C1A were calculated from the resulting charge envelopes. Essentially, the charge state of an ion was determined by subtracting the mass to charge ratio of two adjacent ions from each other and the reciprocal of this difference multiplied by the ion of lower mass/charge minus one. The result is the charge state of the ion with the higher m/z of the two adjacent peaks. To calculate the unprotonated molecular weight, the determined charge state is multiplied by the ion's mass/charge, and then the charge state is subtracted from the product. Deconvolution of the mass spectra was done by using the Bioworks Browser 3.1 module of Xcalibur software from ThermoElectron.
Photolabeling in the presence of DiC8
PKCδ C1A and DiC8 (15 μM) were incubated for 30 min at a molar ratio of 1:1 or 1:2, the required amount of azioctanol (1 mM and 3 mM) was added, and the mixture was photoirradiated for 30 min. Samples with and without DiC8 were analyzed by HPLC and mass spectrometry.
Isolation of the protein–azialcohol complex by HPLC
PKCδ C1A (100 μg in 100μL) was photolyzed in the presence of various concentrations of azialcohols. After photolabeling, protein–azioctanol complexes were isolated by HPLC (Varian Prostar) using a reverse-phase C18 column (monomeric, 5 μm, 300 Å, 4.6 × 250 mm, Vydac) with a 0.8 mL/min flow rate and 0.05% TFA in a 0%–80% acetonitrile gradient for 25 min.
Reduction, alkylation, and trypsin digestion of PKCδ C1A and PKCδ C1A–azioctanol complexes
PKCδ C1A or the HPLC-separated PKCδ C1A–azioctanol complex (1 μg) was dried down by using a speed-vac and then resuspended in 45 μL of 50 mM ammonium bicarbonate. This solution was spiked with 5 μL of 100 mM DTT to a final concentration of 10 mM DTT and then heated at 62°C in a heating block for 30 min, after which 6 μL of 500 mM iodoacetamide (final concentration, 50 mM) was added and heating continued at 37°C for 20 min in the dark. The sample was dried under speed-vac and reconstituted in 2.5% acetonitrile plus 0.2% TFA solution. Each solubilized sample was loaded onto a STAGE tip (Rappsilber et al. 2003) containing C18 Empore Disks (3M), eluted with an equal volume of 60% acetonitrile plus 0.2% TFA and dried in the speed-vac.
Samples were reconstituted in 50 mM ammonium bicarbonate containing 12.5 ng/μL modified sequencing-grade trypsin (Promega) and placed in a 37°C room for no longer than 2 h. The reaction was stopped by completely drying the samples in a speed-vac. On the day of analysis, the sample was reconstituted in 5 μL of HPLC solvent A (2.5% acetonitrile, 0.1% formic acid).
Online reverse-phase chromatography and sequencing of azialcohol-labeled PKCδ C1A by electrospray ionization mass spectrometry
A nanoscale reverse-phase HPLC capillary column was created by packing 5-μm spherical C18 silica beads into a fused silica capillary (75-μm inner diameter × 12-cm length) with a flame-drawn tip (Peng and Gygi 2001). After equilibrating the column with water containing 0.1% formic acid, each sample was pressure-loaded off-line onto the column. The column was then reattached to the HPLC system. A gradient was formed and peptides were eluted with increasing proportions of solvent B (97.5% acetonitrile, 0.1% formic acid). As each peptide was eluted, it was subjected to electrospray ionization and then entered an LTQ linear ion-trap mass spectrometer (ThermoElectron). Eluting peptides were detected, isolated, and fragmented to produce a tandem mass spectrum of specific fragment ions for each peptide. Peptide sequences were determined by matching protein databases with the acquired fragmentation pattern by the software program Sequest (ThermoElectron) (Eng et al. 1994) and by manual interpretation. In some cases, for greater confidence in peptide identification, high mass accuracy was obtained by analyzing samples on an LTQ-FT mass spectrometer (ThermoElectron). Reduction, alkylation, trypsin digestion, and peptide sequencing were performed at the Taplin Biological Mass Spectrometry Facility of Harvard Medical School.
Acknowledgments
We thank Drs. S.S. Husain for synthesizing the azialcohols, Raj Sivananthaperumal for model construction, Jonathan Lee of Boston University for providing the CD spectrometer, and R. Stahelin and W. Cho for SPR analysis. We are grateful to Dr. P.M. Blumberg of the National Cancer Institute, Bethesda, for providing us with the DNA construct of full-length PKCδ. This research was supported by United States Public Health Service Grant GM 069726, and by the Department of Anesthesia and Critical Care, Massachusetts General Hospital.
Footnotes
Supplemental material: see www.proteinscience.org
Reprint requests to: Joydip Das, Department of Anesthesia and Critical Care, Massachusetts General Hospital, 55 Fruit Street, Boston, MA 02114, USA; e-mail: joydip_das@hms.harvard.edu; fax: (617) 724-8644.
Article and publication are at http://www.proteinscience.org/cgi/doi/10.1110/ps.062237606.
Abbreviations: PKC, protein kinase C; GST, glutathione-S-transferase; HPLC, high performance liquid chromatography; LC/MS/MS, liquid chromatography–tandem mass spectrometry; SAPD, sapintoxin-D; CD, circular dichroism; DMSO, dimethylsulfoxide; FPLC, fast performance liquid chromatography; EC50, equilibrium ligand concentration at half maximum effect; SDS-PAGE, sodium dodecyl sulfonate-polyacrylamide gel electrophoresis; TPCK, N-tosyl-L-phenylalanine chloromethyl ketone; DTT, dithiothreitol; DiC8, 1,2-sn-dioctanoylglycerol; DAG, sn-1,2-diacylglycerol; POPC, 1-palmitoyl-2-oleoyl-sn-glycero-3-phosphocholine; POPS, 1-palmitoyl-2-oleoyl-sn-glycero-3-phosphoserine; SPR, surface plasmon resonance.
References
- Addona G.H., Husain S.S., Stehle T., Miller K.W. 2002. Geometric isomers of a photoactivable general anesthetic delineate a binding site on adenylate kinase. J. Biol. Chem. 277: 25685–25691. [DOI] [PubMed] [Google Scholar]
- Alifimoff J.K., Firestone L.L., Miller K.W. 1989. Anaesthetic potencies of primary alkanols: Implications for the molecular dimensions of the anesthetic site. Br. J. Pharmacol. 96: 9–16. [DOI] [PMC free article] [PubMed] [Google Scholar]
- Bohm G., Muhr R., Jaenicke R. 1992. Quantitative analysis of protein far UV circular dichroism spectra by neural networks. Protein Eng. 5: 191–195. [DOI] [PubMed] [Google Scholar]
- Brunner J. 1993. New photolabeling and crosslinking methods. Annu. Rev. Biochem. 62: 483–514. [DOI] [PubMed] [Google Scholar]
- Canagarajah B., Leskow F.C., Ho J.Y., Mischak H., Saidi L.F., Kazanietz M.G., Hurley J.H. 2004. Structural mechanism for lipid activation of the Rac-specific GAP, β2-chimaerin. Cell 119: 407–418. [DOI] [PubMed] [Google Scholar]
- Cho W. 2001. Membrane targeting by C1 and C2 domains. J. Biol. Chem. 276: 32407–32410. [DOI] [PubMed] [Google Scholar]
- Church R.F.R. and Weiss M.J. 1970. Diazirines. II. Synthesis and properties of small functionalized diazirine molecules. Some observations on the reaction of a diazirine with the iodine-iodide ion system. J. Org. Chem. 35: 2465–2471. [Google Scholar]
- Das J., Addona G.H., Sandberg W.S., Husain S.S., Stehle T., Miller K.W. 2004a. Identification of a general anesthetic binding site in the diacylglycerol-binding domain of protein kinase Cδ. J. Biol. Chem. 279: 37964–37972. [DOI] [PubMed] [Google Scholar]
- Das J., Stehle T., Miller K.W. 2004b. Identification of an alcohol-binding site in the second cysteine-rich domain of protein kinase Cδ by X-ray crystallography. Biophys. J. 86:–508a.
- Dodson B.A., Braswell L.M., Miller K.W. 1987. Barbiturates bind to an allosteric regulatory site on nicotinic acetylcholine receptor-rich membranes. Mol. Pharmacol. 32: 119–126. [PubMed] [Google Scholar]
- Eng J.K., McCormack A.L., Yates J.R. 1994. An approach to correlate tandem mass spectral data of peptides with amino acid sequences in a protein database. J. Am. Soc. Mass Spectrom. 5: 976–989. [DOI] [PubMed] [Google Scholar]
- Hemmings H.C. Jr. and Adamo A.I. 1994. Effects of halothane and propofol on purified brain protein kinase C activation. Anesthesiology 81: 147–155. [DOI] [PubMed] [Google Scholar]
- Husain S.S., Forman S.A., Kloczewiak M.A., Addona G.H., Olsen R.W., Pratt M.B., Cohen J.B., Miller K.W. 1999. Synthesis and properties of 3-(2-hydroxyethyl)-3-n-pentyldiazirine, a photoactivable general anesthetic. J. Med. Chem. 42: 3300–3307. [DOI] [PubMed] [Google Scholar]
- Husain S.S., Ziebell M.R., Ruesch D., Hong F., Arevalo E., Kosterlitz J.A., Olsen R.W., Forman S.A., Cohen J.B., Miller K.W. 2003. (3-Methyl-3H-diaziren-3-yl)ethyl 1-(1-phenylethyl)-1H-imidazole-5-carboxylate: A derivative of the stereoselective general anesthetic etomidate for photolabeling ligand-gated ion channels. J. Med. Chem 46: 1257–1265. [DOI] [PubMed] [Google Scholar]
- Irie K., Oie K., Nakahara A., Yanai Y., Ohigashi H., Wender P.A., Fukuda H., Konishi H., Kikkawa U. 1998. Molecular basis for protein kinase C isozyme-selective binding: The systhesis, folding, and phorbol ester binding of the cysteine-rich domains of all protein kinase C isozymes. J. Am. Chem. Soc. 120: 9159–9167. [Google Scholar]
- Kinter M. and Sherman N.E. In Protein sequencing and identification using tandem mass spectrometry . 2000. Wiley-Interscience, New York.
- Laskowski R.A., MacArthur W., Moss D., Thornton J.M. 1993. PROCHECK: A program to check the stereochemical quality of protein structures. J. Appl. Crystallogr. 26: 283–291. [Google Scholar]
- Levitt M. 1992. Accurate modeling of protein conformation by automatic segment matching. J. Mol. Biol. 226: 507–533. [DOI] [PubMed] [Google Scholar]
- Levitt M., Hirshberg M., Sharon R., Daggett V. 1995. Potential energy function and parameters for simulations of the molecular dynamics of proteins and nucleic acids in solution. Comput. Phys. Commun. 91: 215–231. [Google Scholar]
- Lund O., Nielsen M., Lundegaard C., Worning P. 2002. X3M: A computer program to extract 3D models. In CASP5 methods abstracts –A102. CASP5, Asilomar, CA.
- Luthy R., Bowie J.U., Eisenberg D. 1992. Assessment of protein models with three-dimensional profiles. Nature 5: 583–585. [DOI] [PubMed] [Google Scholar]
- Newton A.C. 2001. Protein kinase C: Structural and spatial regulation by phosphorylation, cofactors, and macromolecular interactions. Chem. Rev. 101: 2353–2364. [DOI] [PubMed] [Google Scholar]
- Peng J. and Gygi S.P. 2001. Proteomics: The move to mixtures. J. Mass Spectrom. 36: 1083–1091. [DOI] [PubMed] [Google Scholar]
- Perczel A., Park K., Fasman G.D. 1992. Analysis of the circular dichroism spectrum of proteins using the convex constraint algorithm: A practical guide. Anal. Biochem. 203: 83–93. [DOI] [PubMed] [Google Scholar]
- Pettersen E.F., Goddard T.D., Huang C.C., Couch G.S., Greenblatt D.M., Meng E.C., Ferrin T.E. 2004. UCSF Chimera-A visualization system for exploratory research and analysis. J. Comput. Chem. 25: 1605–1612. [DOI] [PubMed] [Google Scholar]
- Pu Y., Perry N.A., Yang D., Lewin N.E., Kedei N., Braun D.C., Choi S.H., Blumberg P.M., Garfield S.H., Stone J.C. et al. 2005. A novel diacylglycerol-lactone shows marked selectivity in vitro among C1 domains of protein kinase C (PKC) isoforms α and δ as well as selectivity for RasGRP compared with PKCα. J. Biol. Chem. 280: 27329–27338. [DOI] [PubMed] [Google Scholar]
- Quest A.F., Bardes E.S., Xie W.Q., Willott E., Borchardt R.A., Bell R.M. 1995. Expression of protein kinase C γ regulatory domain elements containing cysteine-rich zinc-coordinating regions as glutathione S-transferase fusion proteins. Methods Enzymol. 252: 153–167. [DOI] [PubMed] [Google Scholar]
- Rappsilber J., Ishihama Y., Mann M. 2003. Stop and go extraction tips for matrix-assisted laser desorption/ionization, nanoelectrospray, and LC/MS sample pretreatment in proteomics. Anal. Chem. 75: 663–670. [DOI] [PubMed] [Google Scholar]
- Rebecchi M.J. and Pentyala S.N. 2002. Anaesthetic actions on other targets: Protein kinase C and guanine nucleotide-binding proteins. Br. J. Anaesth. 89: 62–78. [DOI] [PubMed] [Google Scholar]
- Shen N., Guryev O., Rizo J. 2005. Intramolecular occlusion of the diacylglycerol-binding site in the C1 domain of munc13-1. Biochemistry 44: 1089–1096. [DOI] [PubMed] [Google Scholar]
- Sigrist H., Muhlemann M., And Dolder M. 1990. Philicity of amino acid side- chains for photogenerated carbenes. J. Photochem. Photobiol. B 7: 277–287. [Google Scholar]
- Slater S.J., Cox K.J., Lombardi J.V., Ho C., Kelly M.B., Rubin E., Stubbs C.D. 1993. Inhibition of protein kinase C by alcohols and anaesthetics. Nature 364: 82–84. [DOI] [PubMed] [Google Scholar]
- Slater S.J., Ho C., Kelly M.B., Larkin J.D., Taddeo F.J., Yeager M.D., Stubbs C.D. 1996. Protein kinase Cα contains two activator binding sites that bind phorbol esters and diacylglycerols with opposite affinities. J. Biol. Chem. 271: 4627–4631. [DOI] [PubMed] [Google Scholar]
- Slater S.J., Kelly M.B., Larkin J.D., Ho C., Mazurek A., Taddeo F.J., Yeager M.D., Stubbs C.D. 1997. Interaction of alcohols and anesthetics with protein kinase Cα. J. Biol. Chem. 272: 6167–6173. [DOI] [PubMed] [Google Scholar]
- Slater S.J., Taddeo F.J., Mazurek A., Stagliano B.A., Milano S.K., Kelly M.B., Ho C., Stubbs C.D. 1998. Inhibition of membrane lipid-independent protein kinase Cα activity by phorbol esters, diacylglycerols, and bryostatin-1. J. Biol. Chem. 273: 23160–23168. [DOI] [PubMed] [Google Scholar]
- Slater S.J., Malinowski S., Stubbs C.D. 2004. The nature of hydrophobic n- alkanol binding site within the C1 domains of protein kinase Cα. Biochemistry 43: 7601–7609. [DOI] [PubMed] [Google Scholar]
- Stahelin R.V., Digman M.A., Medkova M., Ananthanarayanan B., Rafter J.D., Melowic H.R., Cho W. 2004. Mechanism of diacylglycerol-induced membrane targeting and activation of protein kinase Cδ. J. Biol. Chem. 279: 29501–29512. [DOI] [PubMed] [Google Scholar]
- Xu R.X., Pawelczyk T., Xia T.H., Brown S.C. 1997. NMR structure of a protein kinase C-γ phorbol-binding domain and study of protein-lipid micelle interactions. Biochemistry 36: 10709–10717. [DOI] [PubMed] [Google Scholar]
- Zhang G., Kazanietz M.G., Blumberg P.M., Hurley J.H. 1995. Crystal structure of the cys2 activator-binding domain of protein kinase C δ in complex with phorbol ester. Cell 81: 917–924. [DOI] [PubMed] [Google Scholar]
- Ziebell M.R., Nirthanan S., Husain S.S., Miller K.W., Cohen J.B. 2004. Identification of binding sites in the nicotinic acetylcholine receptor for [3H]azietomidate, a photoactivatable general anesthetic. J. Biol. Chem. 279: 17640–17649. [DOI] [PubMed] [Google Scholar]


