Abstract
Collagen has a unique folding mechanism that begins with the formation of a triple-helical structure near its C terminus followed by propagation of this structure to the N terminus. To elucidate factors that affect the folding of collagen, we explored the folding pathway of collagen-like model peptides using detailed molecular simulations with explicit solvent. Using biased molecular dynamics we examined the latter stages of folding of a peptide model of native collagen, (Pro-Hyp-Gly)10, and a peptide that models a Gly → Ser mutation found in several forms of osteogenesis imperfecta, (Pro-Hyp-Gly)3-Pro-Hyp-Ser-(Pro-Hyp-Gly)6. Starting from an unfolded state that contains a C-terminal nucleated trimer, (Pro-Hyp-Gly)10 folds to a structure where two of the three chains associate through water-mediated hydrogen bonds and the third is relatively separated from this dimer. Calculated free-energy profiles for folding from this intermediate to the final triple-helical structure suggest that further folding occurs at a rate of approximately one Pro-Hyp-Gly triplet per msec. In contrast, after 6 nsec of biased dynamics, the region N-terminal to the Ser residue in (Pro-Hyp-Gly)3-Pro-Hyp-Ser-(Pro-Hyp-Gly)6 folds to a structure where the three chains form close contacts near the N terminus, away from the mutation site. Further folding to an ideal triple-helical structure at the site of the mutation is unfavorable as the free energy of a triple-helical conformation at this position is more than 20 kcal/mol higher than that of a structure with unassociated chains. These data provide insights into the folding pathway of native collagen and the events underlying the formation of misfolded structures.
Keywords: collagen, protein folding, osteogenesis imperfecta, molecular simulations
Collagen, the most plentiful protein in mammals, constitutes approximately one quarter of all proteins in the human body (Stryer 1988). A variety of tissues, such as blood vessels, bone, and cartilage, owe their stability and tensile strength to collagen. The unique properties of collagen are related to its distinctive structure and amino acid composition. Unlike the compact, roughly spherical structures of globular proteins, collagen monomers are composed of three polypeptide chains that fold into a triple-helical rod (Brodsky and Persikov 2005). All side chains within this structure are solvent exposed—a stark contrast to globular structures, which have a significant number of their side chains buried within a hydrophobic core. This unique conformation imposes significant constraints on the sequence of each polypeptide chain. Given the close packing of amino acids near the common axis of the triple-helical rod, every third position in the amino acid sequence must be a Gly residue. Consequently, mature collagen sequences consist of triplets of the form X1-X2-Gly, where X1 and X2 are frequently Pro and Hyp, respectively (Stryer 1988). An additional defining characteristic of the structure of collagen is the hydrogen bonding pattern of its main chain. The backbone carbonyl of residue X1 in each triplet directly hydrogen bonds to a second polypeptide chain, and the N-H group of the Gly in each triplet hydrogen bonds to the other polypeptide chain (Brodsky and Persikov 2005).
NMR and X-ray crystallographic studies on collagen-like model peptides have clarified many aspects of the mechanism of collagen folding and have been instrumental in deciphering how sequence variation affects the structure of collagen (Buevich and Baum 2001). Kinetic measurements of folding rates for collagen-like peptides suggest that folding consists of several steps, which include the formation of a triple-helical region near the C terminus—a C-terminal nucleated trimer—followed by propagation of the triple-helical structure from the C terminus to the N terminus in a “zipper-like” mechanism (Buevich et al. 2000; Buevich and Baum 2001; Bachmann et al. 2005). Bottlenecks in the folding pathway arise from two factors: (1) the formation of a C-terminal nucleated trimer, and (2) cis-trans isomerization of Gly-Pro bonds (Buevich and Baum 2001; Bachmann et al. 2005).
Mutations that occur at positions normally occupied by Gly residues can alter this folding pathway and lead to the formation of structures that differ from the classic triple-helical fold. For instance, peptides containing a Gly → Ala mutation form triple-helical structures that contain a local bulge at the site of the mutation and a disruption of the normal collagen hydrogen bond pattern (Bella et al. 1994). Mutants containing amino acids with larger side chains can lead to more significant alterations in the structure (Beck et al. 2000; Buevich and Baum 2001). As a number of mutations have been linked to important connective tissue diseases, a thorough understanding of factors that affect the folding of collagen is of particular interest (Prockop and Ala-Kokko 2004).
Osteogenesis imperfecta (OI) is one such connective-tissue disorder associated with missense mutations that result in substitutions for Gly residues (Rauch and Glorieux 2004). The clinical manifestations of OI vary greatly depending on the type of mutation and where it occurs in the sequence of type I collagen (Prockop and Ala-Kokko 2004). Patients with severe forms of OI suffer a myriad of symptoms, which may include multiple fractures, hearing loss, and heart failure secondary to valvular heart disease (Prockop and Ala-Kokko 2004). The most severe forms of OI are lethal in the perinatal period (Prockop and Ala-Kokko 2004). A number of studies have identified patients with both nonlethal and lethal forms of OI who have missense mutations resulting in Gly → Ser substitutions in type I collagen (Westerhausen et al. 1990; Bateman et al. 1992; Prockop and Ala-Kokko 2004). To better understand the folding mechanism of native collagen and of mutants associated with OI at an atomistic level of detail, we calculated folding trajectories of a peptide model of native collagen, (Pro-Hyp-Gly)10, which we henceforth refer to as peptide 1, and of a mutant bearing a Gly → Ser substitution that models a mutation found in α1(I) chains of some patients with OI, (Pro-Hyp-Gly)3-Pro-Hyp-Ser-(Pro-Hyp-Gly)6. We refer to this latter sequence as peptide 2. Moreover, to fully explore the role that solvent has in the folding pathway, folding simulations were performed with explicit solvent.
The formation of triple-helical structures from individual peptide chains occurs on a time scale that is not readily accessible from the standpoint of molecular simulations (Buevich and Baum 2001). Therefore, to simplify the calculations, we focus on the latter stages of folding using an all-trans model of peptides 1 and 2 that contains a C-terminal nucleated trimer. While this greatly reduces the computational complexity of the problem, folding to a triple-helical structure from this unfolded state likely occurs on a time scale that cannot be easily achieved using conventional molecular dynamics (MD) simulations with explicit solvent (Bachmann et al. 2005). Consequently, to promote folding within a shorter period of time, we employ a technique which enables us to observe a folding event during a MD trajectory. In the biased MD (BMD) approach, a gentle bias is introduced during MD simulations to favor the formation of a prespecified conformation, that is, the target (Harvey and Gabb 1993; Marchi and Ballone 1999; Paci and Karplus 1999). This is accomplished by (1) selecting fluctuations during a molecular simulation that take the system closer to the target conformation, and (2) by associating a small penalty to fluctuations that take the system away from the target. In the current study, we bias the trajectory, which begins with the unfolded structure, toward folded conformations. The method is attractive because the gentle bias does not significantly affect the short-term dynamics of the system and, by design, the bias is not introduced when the system undergoes fluctuations that naturally cause the protein to fold (Paci and Karplus 1999). In addition, the use of a gentle biasing function in folding simulations with explicit solvent is desirable as this helps to ensure that the solvent molecules will relax about a changing protein structure.
The approach has been implemented in CHARMM and has been applied to a number of different systems (Paci and Karplus 1999; Paci et al. 2001, 2005; Morra et al. 2003). Using a combination of BMD and standard umbrella sampling, we develop a detailed picture of collagen folding that yields additional insights into the folding mechanism of collagen.
Results
A model of the unfolded state
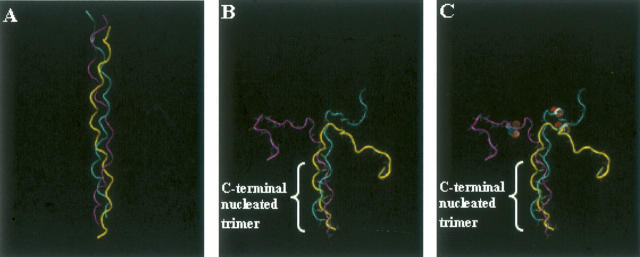
A model of the unfolded state of peptide 1 was generated from high-temperature simulations starting from a model of the folded structure (Fig. 1A). As we are interested in the folding pathway of the state that contains a C-terminal nucleated trimer, the last 15 residues (5 triplets) of the sequence were fixed during the high-temperature runs while the remaining 15 N-terminal residues were flexible. After 100 psec at 1000 K using an implicit solvent model, the N-terminal region of peptide 1 adopted a structure consisting of relatively extended chains (Fig. 1B). In addition, no cis-trans isomerizations occurred during the simulation, yielding an all-trans model of the unfolded state.
Figure 1.
Initial structures used in folding trajectories. The peptide is shown as a tube tracing where each of the three chains has a different color (yellow, cyan, purple). (A) Folded triple-helical structure of peptide 1 (the target structure); (B) initial unfolded structure of peptide 1; (C) initial structure of peptide 2. Ser residues are shown as solvent-accessible spheres.
A model of the unfolded state of peptide 2 was obtained by mutating residue Gly12 in peptide 1 to a Ser in each of the three chains of the unfolded structure, using the patch facility of CHARMM (Brooks et al. 1983). The resulting structure was then energy minimized to relieve poor contacts between side chains of the Ser residues and other atoms within the peptide. The backbone conformation of the final structure is nearly identical to that of the backbone structure of the unfolded state of peptide 1 (Fig. 1, cf. B and C).
The folding of trajectory of peptide 1
In BMD, the speed in which the system approaches the target conformation is a function, in part, of the biasing constant, α (Paci and Karplus 1999). The smaller the value of α, the more the trajectory will resemble a “real” unbiased folding trajectory. However, small values of α require long simulation times to observe a folding event. Conversely, the larger the value of α, the faster the system will approach its target value, but large values of α will lead to trajectories that may significantly differ from unbiased trajectories.
In prior studies, BMD has been used to calculate unfolding and unbinding trajectories (Paci and Karplus 1999; Paci et al. 2001, 2005; Li et al. 2005). Most of these calculations used an implicit solvent model and values of α between 0.0001 and 0.005 kcal/mol-Å4. With these choices, unfolding and/or unbinding occurs on the picosecond to nanosecond time scale (Paci and Karplus 1999; Paci et al. 2001, 2005). Therefore we began our folding calculations with parameters similar to those used in the aforementioned unfolding studies. Folding simulations for peptide 1 employed an implicit solvent model, GBSW (Im et al. 2003), with values of α = 0.0005 kcal/mol-Å4 and α = 0.005 kcal/mol-Å4. However, peptide 1 failed to fold to a conformation near the native state after several nanoseconds of simulation time. A principal component analysis of folding trajectories from the implicit solvent simulations reveals that the peptide folds to a state where two of the three chains develop an extensive set of close contacts (Fig. 2A,B, cyan and purple chains). Moreover, this state is quite distant from the native state (Fig. 2A,B). Additional folding simulations with another implicit solvent model, EEF1 (Lazaridis and Karplus 1999), and α = 0.05 kcal/mol-Å4 yielded results similar to that shown in Figure 2.
Figure 2.
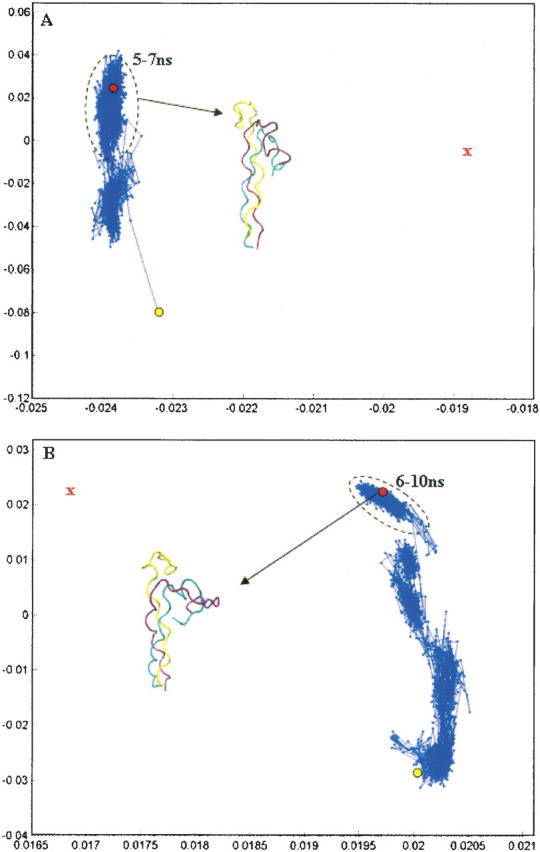
Principal component analysis of folding trajectory for peptide 1 using the implicit solvent model GBSW with α = 0.0005 kcal/mol-Å4 (A) and α = 0.005 kcal/mol-Å4 (B). The red X denotes the approximate position of the target structure. Structures corresponding to the last 2 nsec of the trajectory are outlined with a black oval in A and structures from the last 4 nsec of the trajectory are outlined in B. We note that, for these simulations, more than 99.5% of the variance in structural positions is accounted for by the first two components, suggesting that this representation is an adequate picture of the overall folding pathway. The initial and final structures from the folding trajectory are explicitly shown.
Given these results, we performed additional BMD simulations using an explicit model of solvent. We note that the use of explicit solvent in BMD simulations can be problematic as one must ensure that the surrounding water molecules have enough time to relax about the folding protein structure. In this regard, a lower bound on the folding time can be estimated from the diffusion constant of TIP3P water at 298 K—a value between 2 × 10⁻⁹ m2/sec (the experimentally determined value) and 6 × 10⁻⁹ (the calculated value) (Price et al. 1999; Mark and Nilsson 2001). In other words, atoms in the protein cannot, on average, move faster than the observed motion of water at 298 K. Given that the mean-square displacement associated with a given diffusion constant, D, is given by 2Dt, the time it takes, on average, to traverse a distance, l, is given by l2/2D. As the root-mean-square deviation (RMSD) of the unfolded state is ∼32 Å from the target structure, we estimate that the minimum folding time for our system is ∼3 nsec, using the most conservative estimate for the diffusion constant, 2 × 10⁻⁹ m2/sec. Therefore, our choice of α must ensure that folding does not occur any faster than this lower bound.
An appropriate value for α was chosen after running a series of short simulations between 0.1 nsec and 0.5 nsec using different values for α. Values on the order of 10−3 led to estimated folding times longer than 10 nsec. From this data, it was determined that a value of α = 0.05 kcal/mol-Å4 would serve as a reasonable compromise between the desire to have folding trajectories run in a reasonable amount of time and the desire to minimize the bias that is used during the simulation. More importantly, this value resulted in folding times well above our lower bound of 3 nsec.
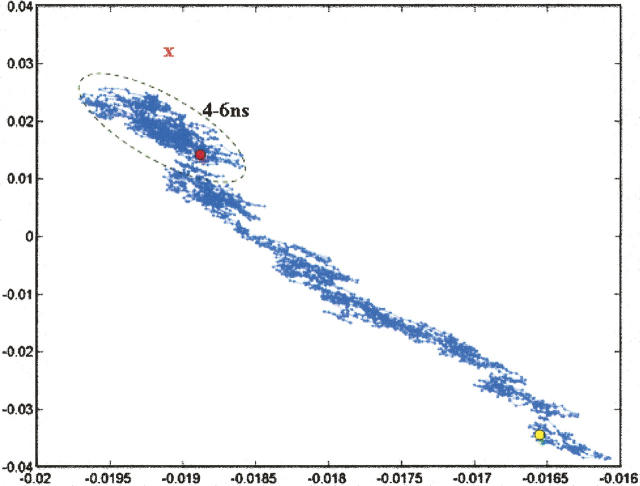
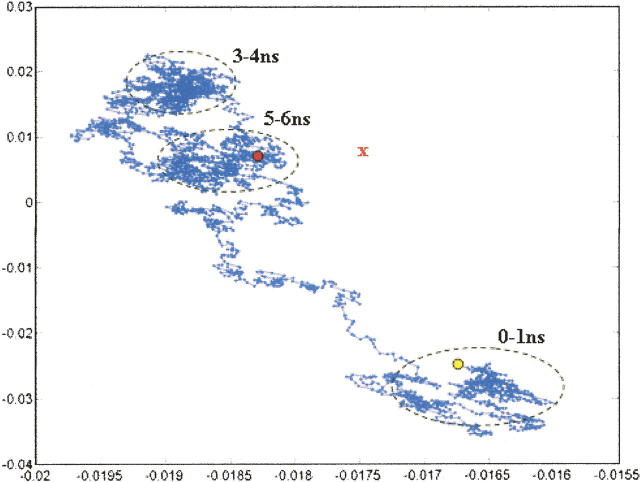
Using this value of α and a TIP3P model of explicit solvent, we performed a BMD simulation starting from the unfolded structure of peptide 1 (Fig. 1B). A principal component analysis of the resulting trajectory suggests that the peptide folds using an almost “direct” path from the unfolded state to a region of conformational space near the folded structure (Fig. 3). Most of the progress in folding occurs during the first 3.7 nsec of the simulation. In the subsequent 2.3 nsec, the peptide samples structures in a relatively confined region of conformational space without making significant progress to the folded state. As evidence of this, we note that the final structure from the simulation is farther from the native state than structures that were sampled at an earlier time (Fig. 3).
Figure 3.
Principal component analysis of peptide 1 folding trajectory. Three thousand structures (1 every 2 psec) is projected onto the first two principal components to produce a two-dimensional plot of the trajectory. The yellow circle denotes the position of the starting unfolded structure, and the red circle denotes the position of the final structure after 6 nsec. The red X denotes the position of the target structure. Structures corresponding to the last 2 nsec of the trajectory are outlined with a black oval. We note that, for this simulation, more than 96% of the variance in structural positions is accounted for by the first two components, suggesting that this representation is an adequate picture of the overall folding pathway.
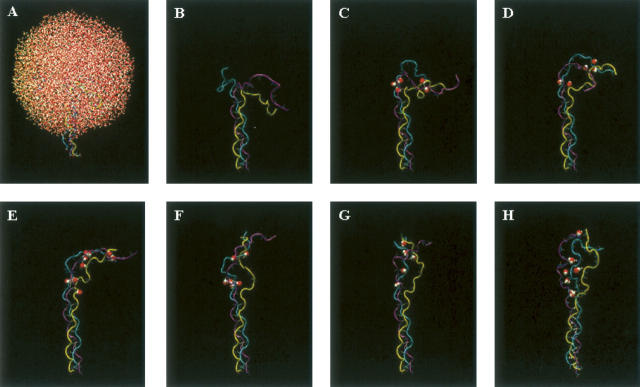
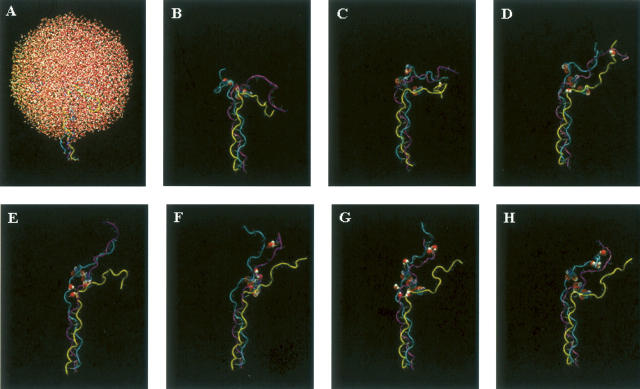
Representative structures, obtained after each nanosecond of the trajectory, provide insight into the conformational changes that occur along the folding trajectory (Fig. 4A–H). Early in the process, the chain adopts a kinked conformation (Fig. 4C). In regions where the chains are in close proximity, inter-chain hydrogen bonds form between atoms in the protein backbone, all of which are mediated by water molecules. As folding proceeds, the backbone of the two polypeptide chains develop an extensive array of water-mediated hydrogen bonds without the formation of direct inter-chain hydrogen bonds (Fig. 4C–F, cyan and purple chains). Toward the end of the trajectory, the third chain begins to form close contacts with the other two chains, again through water-mediated hydrogen bonds (Fig. 4H). Interestingly, these data suggest that the three peptide chains do not come together simultaneously, rather two of the chains first associate quickly, and they are later joined by the third chain—a finding consistent with data obtained from folding studies on single-chain collagen-like peptides (Boudko et al. 2002).
Figure 4.
Representative structures from the folding trajectory of peptide 1. (A) Solvated structure of unfolded peptide 1. (B) Peptide 1 structure without solvent. A total of 8552 water molecules were included in the simulation. B–H depict structures arising from the folding simulation of peptide 1 taken at 1-nsec intervals so that C is the structure obtained after 1 nsec and H is the structure obtained after 6 nsec. Only water molecules involved in water-mediated inter-strand hydrogen are shown in B–H and are represented as van der Waals surfaces.
Interestingly, there is qualitative agreement between the data obtained from the explicit solvent simulation and the implicit solvent simulations. In both simulations, the peptide folds from an unfolded state to a region of conformational space characterized by close association between two of the three chains. In addition, in both sets of simulations, folding from this state occurs over a long time scale. As these simulations were performed under very different conditions, these data suggest that our qualitative findings are not secondary to the parameters chosen for the simulations, but rather capture characteristics that may be intrinsic to the folding pathway of this peptide.
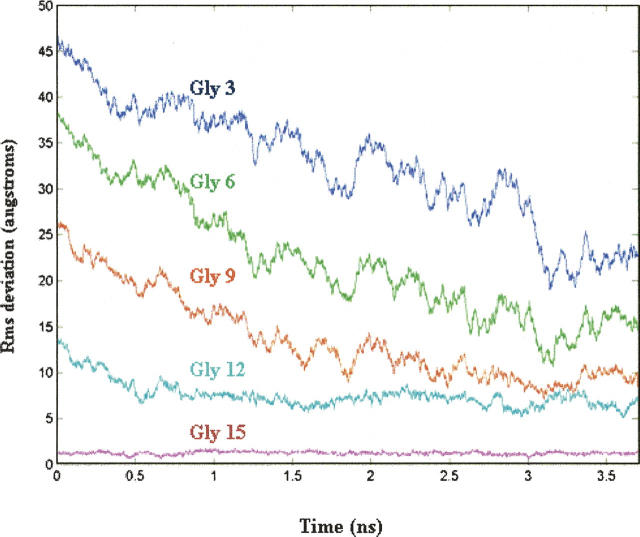
NMR experiments on 15N-labeled collagen-like peptides suggest a particular folding pathway. Measurement of the time-dependent change in trimer intensity at specific amide nitrogens after rapid temperature quench reveals that residues near the C terminus recover trimer intensity faster than residues near the N terminus. This is consistent with the notion that residues near the C terminus fold before residues near the N-terminal region (Buevich and Baum 2001). To determine if our simulations are compatible with these data, we calculated the average RMSD from the target structure of amide nitrogens in Gly residues within the N-terminal region of peptide 1 (Fig. 5). During the first 3.7 nsec of the simulation, when the peptide folds in a direct manner, Gly residues near the C terminus fold to a triple-helical conformation before residues near the N terminus—a finding consistent with the NMR data. To some degree, this observation is secondary to the fact that residues near the nucleated trimer begin with smaller RMSDs relative to residues near the N terminus. That is, this behavior is a consequence of the fact that folding begins with the formation of a C-terminal nucleated trimer.
Figure 5.
RMSD from the target structure of amide nitrogen atoms in Gly residues of peptide 1. Only data from the first 3.7 ns is shown—the period when “direct” folding is observed.
During the last 2.3 nsec of the simulation, the peptide samples conformations containing two chains that associate through water-mediated hydrogen bonds, while the third chain makes varying amounts of contact with the other two (Fig. 4G,H). As a result, little progress is made in the overall folding during this time. Therefore, folding from this intermediate state appears to be quite slow from the standpoint of our biased simulations.
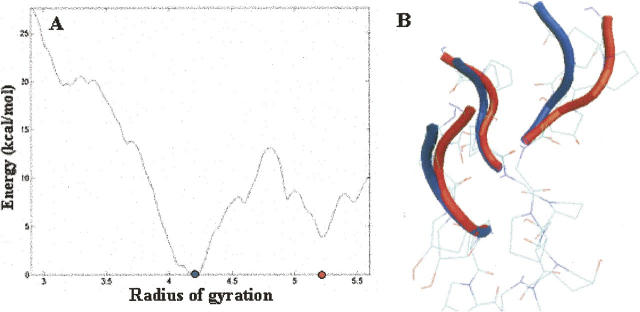
To explore the energetic barriers associated with the final stages of folding, we computed the potential of mean force (pmf) for folding a triplet located immediately adjacent to the N-terminal region with umbrella sampling. As we are interested in calculating the free energy of adding one additional triplet to a preformed C-terminal trimer, N-terminal residues were deleted from the system and this truncated peptide was resolvated and used for the umbrella sampling calculations (Fig. 6A). In addition, given that we are interested in the barriers associated with folding at the site of the potential mutation, G12, was kept and used to define the reaction coordinate for the umbrella sampling calculations (Fig. 6A). Use of a truncated peptide reduces the number of different conformations that need to be sampled during umbrella sampling calculations, making the calculations tractable. Therefore, while these calculations do not provide a complete assessment of the barriers associated with folding from our observed intermediate to the folded conformation, they do estimate the energy required to completely fold a triplet that is N-terminal to a preformed C-terminal nucleated region. The reaction coordinate for this transformation consisted of the radius of gyration of the Cα atoms within each of the three Gly residues that are immediately N-terminal to the C-terminal trimer (Fig. 6B).
Figure 6.
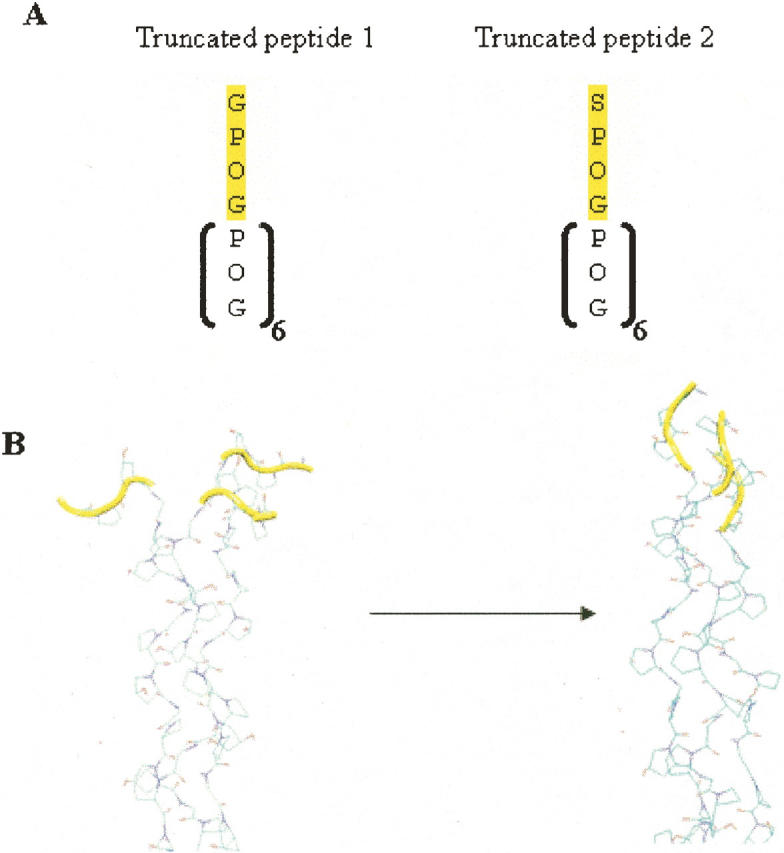
(A) Sequence of truncated peptides, represented with the one-letter amino acid code, used in the umbrella sampling calculations. (B) A schematic showing the reaction coordinate for the pmf calculations. The residues which were flexible during the simulations are colored in yellow.
The final pmf contains a local energy minimum at 5.2 Å (Fig. 7A). Interestingly, our biased simulations suggest that the triplet immediately adjacent to the C-terminal nucleated trimer in the observed intermediate (Fig. 4H) has a radius of gyration of ∼5.5 Å, a value in agreement with the pmf calculations. This is consistent with the notion that our observed intermediate corresponds to a local free energy minimum. The lowest free energy state for this truncated peptide is more compact, and representative structures from this state are similar to the backbone structure of the reference structure (Fig. 1A). The barrier associated with a transition from the open structure to the relatively compact structure is on the order of 13 kcal/mol. Rough estimates of the time needed to cross a barrier of this magnitude are easily obtained from transition state theory. In particular, the average time required to traverse a barrier of height ΔG, is given by νκ exp(−ΔG/RT)−1, where ν is the frequency factor, and κ is the transmission coefficient (Steinfeld et al. 1988). Assuming a frequency factor of 1 psec−1 (a rough estimate for the frequency of slow molecular vibrations at 300 K) and a transmission coefficient of 1, we obtain a lower bound for the transition time on the order of 1 msec at room temperature.
Figure 7.
(A) Potential of mean force for adding a triplet to a preformed C-terminal nucleated domain. The positions of the two local energy minima are of interest are denoted with red and blue dots. (B) Superimposed structures of the two minima.
Interestingly, in representative structures corresponding to the local energy minimum at 5.2 Å, one of the three polypeptide chains is more separated from the common axis of the helical rod than the other two chains (Fig. 7B, red tracing). This occurs even though we use a reaction coordinate that consists of atoms from all three chains. These data are consistent with the results of our biased simulations in that two chains of peptide 1 associate first and the third chain joins them at a later stage.
The folding trajectory of peptide 2
Implicit solvent simulations with peptide 2 yielded trajectories that end in structures that were not significantly different from the starting structure. Therefore, we conducted folding trajectories using explicit solvent, with the same value for the biasing constant, as described above.
Unlike the results for peptide 1, our model of an OI mutant does not fold in a “direct” manner. A principal component analysis of the 6-nsec folding trajectory suggests that a number of intermediates exist along the folding pathway (Fig. 8). We note that as >96% of the variance in structural positions is accounted for by the first two principal components, the data shown in Figure 8 is an adequate two-dimensional representation of the folding trajectory. While such plots well characterize the relative distances between different conformations, it is difficult to infer absolute distances between structures using this method (Levitt 1983). For instance, although the ending structure appears to be quite close to the final folded conformation in this representation, its RMSD is more than 19 Å from the target.
Figure 8.
Principal component analysis of folding trajectories of peptide 2. As in the case of the peptide 1 simulation, more than 96% of the variance in structural positions is accounted for by the first two components.
An analysis of representative structures chosen at equally spaced times provides insights into events underlying the formation of intermediate structures. Unlike the trajectory of our model of native collagen, peptide 2 does not show signs of early chain association and water-mediated hydrogen bonding (Fig. 9B,C) and the structure of the peptide remains “kinked” at the Ser residues. This finding is secondary to the fact that the relatively large Ser side chains prevent the polypeptide chains from packing closely together at the site of the mutation.
Figure 9.
Representative structures from the folding trajectory of peptide 2 taken at 1-nsec intervals (see Fig. 4 legend). Ser residues are shown as solvent-accessible spheres.
The states that are sampled during the trajectory correspond to (1) structures where the chain is kinked at approximately a 90° angle (Fig. 9C, 0–1 nsec), (2) structures that contain N-terminal regions that have essentially random conformations (Fig. 9D,E, 3–4 nsec), and (3) structures where the three chains form close contacts near the N terminus. In the latter state, two of the chains interact via water-mediated hydrogen bonds (Fig. 9G,H, 5–6 nsec). These data suggest that further folding of the peptide occurs near the N terminus and away from the position of the mutation. This late chain association near the N terminus likely represents the beginning of a renucleation event—a phenomenon that has been postulated to explain folding in regions N-terminal to positions corresponding to OI mutations (Buevich and Baum 2001; Frank et al. 2003; Buevich et al. 2004).
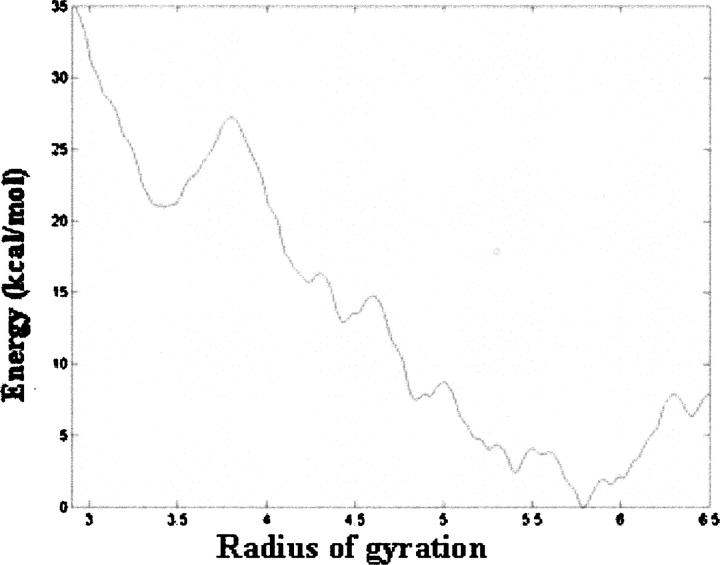
To explore the energetic barriers associated with folding the Ser containing triplet from an unfolded state to its corresponding folded triple-helical conformation, we again computed the pmf, using a truncated form of peptide 2, in a manner analogous to that previously described (Fig. 6A). The resulting pmf has a minimum energy conformation with a radius near 5.7 Å (Fig. 10). As before, this value corresponds to the radius of gyration of the triplet adjacent to the C-terminal nucleated trimer shown in Figure 9H. More importantly, compact states have higher energies relative to the state at 5.7 Å (Fig. 10). A broad minimum is seen at a low value for the radius of gyration (3.4 Å) and backbone conformations of representative structures with this radius of gyration are similar to that of the reference structure. However, the free energy of this state is more than 20 kcal/mol higher than that of the state located at 5.7 Å, suggesting that further folding at this site does not occur. Therefore, these data suggest that even after renucleation the structure does not fold to a collagen-like triple-helical conformation at the position corresponding to the Ser residue.
Figure 10.
Potential of mean force for adding a triplet containing a Gly → Ser mutation to a preformed C-terminal nucleated domain.
Discussion
BMD simulations typically draw conclusions from multiple simulations, where each trajectory uses a different set of initial conditions. Features that are common to multiple trajectories suggest that the resulting observations are characteristic of the true folding/unfolding pathway. However, to run multiple MD trajectories in a reasonable amount of CPU time, a number of approximations are usually employed, such as an implicit model of solvent (Paci and Karplus 1999; Paci et al. 2001, 2005). It is generally assumed that qualitative features of the folding pathway can be obtained with approximate models of solvation if many different trajectories are run.
In the present study, simulations with an implicit solvent model failed to yield trajectories where peptide 1 folded to a native-like conformation, even when relatively large values for the biasing constant were employed. Therefore, we focused on calculating folding trajectories with BMD and an explicit model of solvent. With these choices folding to structures in the vicinity of the native state occurs on a nanosecond time scale. As computing multiple trajectories with explicit solvent, where each simulation is on the order of 5–10 nsec, is computationally intensive, we ran a single trajectory per peptide with explicit solvent (∼8 wk of CPU time per simulation), taking care to minimize the effects of the external bias and to allow for solvent relaxation during the simulation.
In general, results drawn from a single folding trajectory, or a small number of trajectories, need to be interpreted with care as these data may be specific to the parameters used to obtain the trajectories and not representative of the true folding pathway. However, several observations suggest that the trajectories generated in this study capture important characteristics of the folding pathway of collagen-like model peptides. Although the implicit solvent simulations do not lead to trajectories where the peptides fold to native-like structures, folding in these simulations begins with the formation of close contacts between two of the three chains, that is, the same behavior is observed in the explicit solvent simulations. As both sets of simulations were performed under very different conditions, these data are consistent with the notion that the formation of a dimer is an early step in the folding process.
More importantly, experimental observations are consistent with our data. In a prior work, Boudko et al. (2002) studied the kinetics of triple-helix formation from single collagen-like chains. It was found that at low concentrations, (Pro-Pro-Gly)10 folded according to a third-order reaction scheme, whereas at high concentrations, the folding reaction is consistent with a first-order kinetic scheme. Boudko et al. (2002) demonstrated that the concentration dependence of these data are explained by a reaction scheme where two chains associate to form a relatively unstable dimer that then combines with a third peptide chain to form a triple-helical structure. In addition, the association of the third chain forms the rate-limiting step (Boudko et al. 2002). The same scheme also explains experimental observations for (Pro-Hyp-Gly)10, peptide 1, although the predicted rate constants for triple-helical formation are significantly higher—presumably because of the stabilizing affect of hydroxyproline residues (Boudko et al. 2002). These data suggest that the formation of intermediate structures consisting of two associated chains may be a common theme in the folding mechanism of collagen-like peptides.
Our findings are in agreement with these observations as the folding simulations suggest that the three peptide chains do not fold simultaneously. Two of the chains associate first, and only after this event does the third chain join them. Moreover, the observation that the addition of a third chain is the rate-limiting step is consistent with our data as folding from this intermediate state, consisting of two closely associated chains, is a relatively slow process. In addition, our simulations are consistent with NMR data on the folding kinetics of 15N-labeled collagen-like peptides as the amide nitrogens near the C terminus fold prior to N-terminal amide nitrogens (Fig. 5).
The data from the folding simulations on peptide 2 suggest that when a Gly is mutated to a Ser residue, the orderly folding pattern observed in the simulations with peptide 1 is impaired for residues N-terminal to the mutation site. After 6 nsec of BMD, the N-terminal residues remain separated at the mutation site. However, the structure does form close contacts in the region near the N terminus, suggesting that further folding proceeds through the establishment of a renucleation site (Frank et al. 2003; Buevich et al. 2004). Prior studies have shown that nucleation of collagen-like peptides can occur at either the C or the N terminus, and that folding can occur N-terminal to the G → S mutation, if the N-terminal region contains an imino-rich segment (Frank et al. 2003; Buevich et al. 2004). It is known that peptide 2 folds to a triple-helical-like structure under the appropriate experimental conditions (Beck et al. 2000), and our data suggest a mechanism that would enable such folding to occur. However, it should be noted that as the precise three-dimensional structure of this folded conformation is not known, the detailed conformation in the vicinity of the serine residue remains unknown. The results of our potential of mean force calculations suggest that the conformation of the peptide in this region will not resemble a collagen-like structure.
Overall our results suggest that inter-chain water-mediated hydrogen bonds play a role in the folding pathway of these peptides. In this regard, collagen-folding has some similarity to other reactions that involve the association of distinct polypeptide chains; i.e., extensive water-mediated hydrogen bonds have been observed in a number of X-ray structures of protein complexes (Ikura et al. 2004; Rodier et al. 2005; Sangita et al. 2005).
Lastly, it should be noted that our findings were obtained with peptides that are relatively rich in proline and hydroxyproline residues. As the stability of collagen-like peptides is a function of their hydroxyproline content, these results may not be generalizable to other peptides with different hydroxyproline content (Brodsky and Persikov 2005).
Experimental studies on collagen-like peptides have clarified important events in the folding mechanism of collagen (Buevich and Baum 2001; Brodsky and Persikov 2005). Molecular simulations complement these results by providing a window into the essential interactions underlying macroscopically observable phenomena. These data provide a window into the folding process of native collagen and a peptide model of an OI mutant. Such studies help to clarify the molecular interactions underlying the folding of native collagen and mutants associated with important connective-tissue diseases.
Materials and methods
Construction of the initial model
To run a BMD simulation, we need to first construct a model of the triple-helical structure of native collagen as this will be the target structure for the trajectory. We began with the structure of a collagen-like peptide, solved to 1.9 Å resolution (PDB ID 1cag) (Bella et al. 1994; Berman et al. 2000). This crystallographic structure is of the sequence (Pro-Hyp-Gly)4(Pro-Hyp-Ala)(Pro-Hyp-Gly)5 and therefore contains a Gly → Ala mutation. A polar hydrogen model of the protein was constructed using the CHARMM19 parameter set (Brooks et al. 1983). To construct a model of the structure of (Pro-Hyp-Gly)10, the Ala residue was mutated to a Gly residue using the patch facility of CHARMM (Brooks et al. 1983). This structure was then energy minimized for 100 steps of steepest descent in vacuum to relieve any internal strain in the molecule and to optimize the hydrogen bonding pattern in the vicinity of the mutant residue position. Energy minimizations employed a nonbond cutoff of 13 Å. Electrostatic interactions were shifted to zero at 12 Å and van der Waals interactions were switched to zero between 10 Å and 12 Å. A constant dielectric constant of 1 was used. These nonbond specifications were employed for the solvent equilibration steps and the BMD simulations. Parameters for Hyp parameters were obtained by modifying the parameters for Pro in the CHARMM 19-parameter set. We note that these Hyp parameters have been used in other simulations of collagen-like peptides and useful insights have been obtained with these data (Stultz 2002).
Construction of unfolded models of peptides 1 and 2
A model for the unfolded state was generated from high-temperature simulations with an implicit solvent model (EEF1) (Lazaridis and Karplus 1999). Simulations began with the folded model of peptide 1 described above. As we are interested in unfolded structures that contain a C-terminal nucleated trimer, the C-terminal 15 residues were fixed during the simulation. After 100 psec, the N-terminal 15 residues adopted a predominately extended conformation (Fig. 1B). An initial structure for the unfolded form of peptide 2 was generated by mutating residue 12 from a Gly to a Ser, again with the patch facility of CHARMM. The resulting structure was energy minimized for 100 steps of steepest descent to relieve any poor contacts that may arise between the side chain and the other atoms in the structure.
A visual analysis of the unfolded structure revealed that the N-terminal residues could be solvated with a sphere of water molecules of radius 42 Å where the origin corresponded to the center of mass of the N-terminal region. This sphere size was sufficient to solvate the 15 N-terminal residues of both the unfolded structure and the final folded conformation (i.e., the target structure), thereby ensuring that the peptide would remain solvated during the entire folding simulation.
Each structure was solvated by overlaying it with a set of TIP3P water molecules that had been equilibrated at 298 K (Brooks et al. 1983). Waters that overlapped with the protein and that were outside the 42-Å sphere were removed. To equilibrate the water molecules in the field of the protein, these waters were subjected to 5000 steps of energy minimization followed by 5 psec of molecular dynamics using a 1-fsec time step and a fixed protein structure. The Berendsen method was used to couple the system to a heat bath at 300 K, and SHAKE was used to constrain covalent hydrogen bond distances to their equilibrium values (Ryckaert et al. 1977; Berendsen et al. 1984). Additional solvent overlays were performed to ensure that the final system would have a density close to that of bulk solvent. In subsequent overlays, water molecules that overlapped with the protein and with existing water molecules were removed. The system was then subjected to energy minimization followed by 5 psec of molecular dynamics with a fixed protein structure as described above. A total of three solvent overlays were performed for both peptide 1 and 2 and 8552 water molecules were added to the each of the two structures. The final system for peptide 1 contained a total of 26,295 atoms and for peptide 2 contained total of 26,304 atoms.
BMD simulations
BMD simulations were performed using the method of Paci and Karplus (1999) as implemented in the HQBM facility of CHARMM . The simulations began with the unfolded structures of peptides 1 and peptide 2. The C-terminal 15 residues were held fixed, and the N-terminal 15 residues were allowed to move during the MD simulations. Implicit solvent simulations were performed with the GBSW (Im et al. 2003) and EEF1 (Lazaridis and Karplus 1999) functions in CHARMM. For the GBSW simulations, the nonbond cutoffs were the same as those listed above, with a half-smoothing length of 0.3 Å, a nonpolar surface tension of sgamma 0.03 kcal/mol-Å2 and a grid spacing of 1.5 Å. Parameters for the EEF1 runs are a part of the model and therefore are as previously described (Lazaridis and Karplus 1999).
For the explicit solvent simulations, a stochastic boundary potential was applied to the water molecules to prevent them from moving outside the 42Å boundary (Brooks and Karplus 1989). As before, SHAKE was used to hold all covalent bonds involving hydrogen atoms to their equilibrium interatomic distances, and a 2-fsec time step was used (Berendsen et al. 1984). These simulations employed a constant dielectric constant of 1 and the nonbond specifications were as described above.
For each of the folding simulations of peptide 1 and 2, the backbone of the unfolded conformation was biased toward the backbone of the target structure shown in Figure 1A. For peptide 1, a solvated model structure of the triple-helical conformation was loaded into the comparison coordinate set of CHARMM and used as the target. For peptide 2, the same structure, with a Ser residue placed at position 12, was used as the target. Note that the target structures for peptides 1 and 2 have exactly the same backbone structure. The reaction coordinate for the biased simulations was the distance between the C-α coordinates of the peptide structure and the C-α coordinates of the target. The parameter α was chosen as outlined in the Results section.
Representative structures from the simulation were chosen at 1-nsec intervals and figures of these structures were made with VMD (Humphrey et al. 1996). Waters involved in water-mediated hydrogen bonds are explicitly represented in these figures. These waters are found amidst the 8552 waters in the simulation by selecting all waters that make at least two hydrogen bonds where each hydrogen bond is to a different polypeptide chain. For these calculations, a hydrogen bond is identified when the interatomic distance between the acceptor and the hydrogen atom of the donor is less than 2.6 Å.
Principal component analysis
To generate a representative set of coordinates that could be used for principal component analyses, the Cartesian coordinates of 3000 structures for the explicit solvent simulations (one structure every 2 psec) were recorded from each folding simulation. Only coordinates of the protein, without any solvent molecules, were used for the principal component analyses. For the implicit solvent simulations one structure every 4 psec was chosen. We note that since C-terminal 15 residues in all simulations are fixed (half the peptide sequence) the structures are already aligned prior to the principal component analyses. Cartesian coordinates for each of the 3000 structures generated with CHARMM were saved to disk and imported into MATLAB (Mathworks, Natick, MA) for principal component analysis. A covariance matrix was generated from the Cartesian coordinates and was diagonalized to generate the principal components as previously described (Levitt 1983).
Umbrella sampling
The goal of these simulations is to calculate the free energy of adding another triplet to a preformed C-terminal nucleated region. In practice these simulations began with the folded structure and computed the free energy as the N-terminal triplet is unfolded; that is, the reverse, unfolding, reaction is simulated. As the free energy is a state function, the order in which the transition is simulated should not, in principle, affect the results. We chose to simulate the reverse reaction because the conformation of the folded state is well defined, whereas this is not the case for the unfolded state.
For these calculations we focused on a model consisting of a C-terminal trimer, which remains fixed, and one additional triplet immediately N-terminal to the C-terminal region, plus the residue corresponding to the site of the mutation (Fig. 6A). For peptide 1, the reaction coordinate for this transformation consisted of the radius of gyration of the C-α atoms within each of the three Gly residues that are N-terminal to the C-terminal trimer. For peptide 2, the reaction coordinate consisted of the radius of gyration of the C-α atoms within each of the three Ser residues adjacent to the C-terminal trimer. The N-terminal residues were solvated in a manner similar to what was described above. One exception is that a stochastic boundary potential of radius 20 Å was used where the origin corresponded to the center of mass of the N-terminal residues in question. A total of 1008 water molecules were added to each of the peptide 1 and 2 structures. All simulations employed the nonbond cutoffs noted above, and SHAKE was used to restrain all covalent hydrogen bond lengths to their equilibrium values (Ryckaert et al. 1977). A time-step of 2 fsec was used. The N-termini of the peptides were left in their unprotonated state as this provides a more realistic representation of the charge of a folding triplet located in the middle of the chain.
Umbrella sampling was performed by running a series of simulations (i.e., windows) where each window employed a harmonic biasing potential to ensure that conformational sampling would occur near a prespecified radius of gyration. By performing simulations over a range of windows, the pmf can be constructed as previously described (Brooks et al. 1988). The first window was centered at 3.2 Å. The last structure from this simulation was the initial structure for a subsequent simulation centered at 3.3 Å. Similarly, each subsequent simulation began with the ending structure of the prior window.
For both peptides 1 and 2 windows were centered at 3.2, 3.3, 3.4,…, 6.0 Å and at radii of gyration centered at 3.1, 3.0, 2.9, and 2.8 Å. At each window, the reaction coordinate was restrained to the specified center point using a harmonic biasing potential with a force constant of 500 kcal mol2/Å. Each window consisted of 20 psec of equilibration followed by 80 psec of production dynamics. The value of the reaction coordinate during the simulations was saved every 0.02 psec; this yielded 4000 data points per window. The potential of mean force at window i, Wi(ζ), where ζ is the reaction coordinate, was calculated from the resulting frequency distribution, pi(ζ), and the biasing potential, Vi(ζ), using the equation: Wi(ζ) = −kT ln pi(ζ) − Vi(ζ) + Ci, where Ci is a constant that is a function of the temperature, T, and the biasing potential, Vi(ζ). The results of the simulations yielded 33 separate potential of mean forces, that is, one for each window.
To create one continuous potential of mean force, the individual potentials need to be linked together. The pmfs from two sequential windows were linked by first comparing the overlapping regions to find a common point where the potentials had similar slopes. The second potential was then adjusted to agree with the first at this common point. The procedure for linking potentials together to form one continuous potential of mean force has been automated in the program SPLICE (C.M. Stultz, unpubl.). The final potential of mean force was smoothed using a cubic spline algorithm available in MATLAB. Smoothing did not significantly affect the positions of saddle points or energy minima for either potential of mean force. Initial data for peptide 1 showed sharp turns in the pmf consistent with local discontinuities, suggesting that sampling was inadequate in these regions. Therefore, for peptide 1, additional simulation windows were performed at 3.05, 3.35, 3.55, 3.85, 3.95, 4.55, and 5.75Å. The pmf for peptide 1 was recalculated using all windows, that is, the new intermediate windows above and the 33 windows previously described.
To ensure that the resulting pmf had converged, we ran additional umbrella sampling simulations at intermediate points including 2.85, 2.95, 3.15, 3.25 Å, etc. After each calculation, a new pmf was constructed with SPLICE using the data from these additional windows. For both peptide 1 and peptide 2, the simulation was said to converge when the inclusion of additional windows did not affect the relative positions of minima and the relative barrier heights.
Footnotes
Reprint requests to: Collin M. Stultz, Massachusetts Institute of Technology, The Stata Center, 32-310, 32 Vassar St., Cambridge, Massachusetts 02319, USA; e-mail: cmstultz@mit.edu; fax: (617) 253-2516.
Article and publication are at http://www.proteinscience.org/cgi/doi/10.1110/ps.062124606.
References
- Bachmann A., Kiefhaber T., Boudko S., Jurgen Engel J., Bachinger H.P. 2005. Collagen triple-helix formation in all-trans chains proceeds by a nucleation/growth mechanism with a purely entropic barrier. Proc. Natl. Acad. Sci. 102: 13897–13902. [DOI] [PMC free article] [PubMed] [Google Scholar]
- Bateman J.F., Moeller I., Hannagan M., Chan D., Cole W.G. 1992. Characterization of three osteogenesis imperfecta collagen α1(I) glycine to serine mutations demonstrating a position-dependent gradient of phenotypic severity. Biochem. J. 288: 131–135. [DOI] [PMC free article] [PubMed] [Google Scholar]
- Beck K., Chan V.C., Shenoy N., Kirkpatrick A., Ramshaw J.A.M., Brodsky B. 2000. Destabilization of osteogenesis imperfecta collagen-like model peptides correlates with the identity of the residue replacing glycine. Proc. Natl. Acad. Sci. 97: 4273–4278. [DOI] [PMC free article] [PubMed] [Google Scholar]
- Bella J., Eaton M., Brodsky B., Berman H.M. 1994. Crystal and molecular streucture of a collagen-like peptide at 1.9 Å resolution. Science 266: 75–81. [DOI] [PubMed] [Google Scholar]
- Berendsen H.J.C., Postma J.P.M., van Gunsteren W.F., DiNola A., Haak J.R. 1984. Molecular dynamics with coupling to an external bath. J. Chem. Phys. 81: 3684–3690. [Google Scholar]
- Berman H.M., Westbrook J., Feng Z., Gilliland G., Bhat T.N., Weissig H., Shindyalov I.N., Bourne I.N. 2000. The Protein Data Bank. Nucleic Acids Res. 28: 235–242. [DOI] [PMC free article] [PubMed] [Google Scholar]
- Boudko S., Frank S., Kammerer R.A., Stetefeld J., Schulthess T., Landwehr R., Lustig A., Bachinger H.P., Engle J. 2002. Nucleation and propagation of the collagen triple helix in single-chain and trimerized peptides: Transition from third to first order kinetics. J. Mol. Biol. 317: 459–470. [DOI] [PubMed] [Google Scholar]
- Brodsky B. and Persikov A.V. 2005. Molecular structure of the collagen triple helix. Adv. Protein Chem. 70: 301–339. [DOI] [PubMed] [Google Scholar]
- Brooks C. and Karplus M. 1989. Solvent effects on protein motion and protein effects on solvent motion—Dynamics of the active-site region of lysozyme. J. Mol. Biol. 208: 159–181. [DOI] [PubMed] [Google Scholar]
- Brooks B., Bruccoleri R., Olafson B., States D., Swaminathan S., Karplus M. 1983. CHARMM—A program for macromolecular energy, minimization, and dynamics calculations. J. Comput. Chem. 4: 187–217. [Google Scholar]
- Brooks C.L., Karplus M., Pettitt B.M. 1988. Proteins: A theoretical perspective of dynamics, structure, and thermodynamics. In Advances in chemical physics . John Wiley, New York Vol. 71:.
- Buevich A. and Baum J. 2001. Nuclear magnetic resonance characterization of peptide models of collagen-folding diseases. Philos. Trans. R. Soc. Lond. B Biol. Sci. 356: 159–168. [DOI] [PMC free article] [PubMed] [Google Scholar]
- Buevich A., Dai Q., Liu X., Brodsky B., Baum J. 2000. Site-specific NMR monitoring of cis-trans isomerization in the folding of the proline-rich collagen triple helix. Biochemistry 39: 4299–4308. [DOI] [PubMed] [Google Scholar]
- Buevich A., Silva T., Brodsky B., Baum J. 2004. Transformation of the mechanism of triple-helix peptide folding in the absence of a C-terminal nucleation domain and its implications for mutations in collagen disorders. J. Biol. Chem. 279: 46890–46895. [DOI] [PubMed] [Google Scholar]
- Frank S., Boudko S., Mizuno K., Schulthess T., Engel J., Bachinger H.P. 2003. Collagen triple helix formation can be nucleated at either end. J. Biol. Chem. 278: 7747–7750. [DOI] [PubMed] [Google Scholar]
- Harvey S.C. and Gabb H.A. 1993. Conformational transitions using molecular-dynamics with minimum biasing. Biopolymers 33: 1167–1172. [DOI] [PubMed] [Google Scholar]
- Humphrey W., Dalke A., Schulten K. 1996. VMD: Visual molecular dynamics. J. Mol. Graph. 14: 33–38. [DOI] [PubMed] [Google Scholar]
- Ikura T., Urakubo Y., Ito N. 2004. Water-mediated interaction at a protein–protein interface. Chem. Phys. 307: 111–119. [Google Scholar]
- Im W.P., Lee M.S., Brooks C.L. 2003. Generalized born model with a simple smoothing function. J. Comput. Chem. 24: 1691–1702. [DOI] [PubMed] [Google Scholar]
- Lazaridis T. and Karplus M. 1999. Effective energy function for proteins in solution. Proteins 35: 133–152. [DOI] [PubMed] [Google Scholar]
- Levitt M. 1983. Molecular dynamics of native protein. J. Mol. Biol. 168: 621–657. [DOI] [PubMed] [Google Scholar]
- Li Y., Zhou A., Post C. 2005. Dissociation of an antiviral compound from the internal pocket of human rhinovirus 14 capsid. Proc. Natl. Acad. Sci. 102: 7529–7534. [DOI] [PMC free article] [PubMed] [Google Scholar]
- Marchi M. and Ballone P. 1999. Adiabatic bias molecular dynamics: A method to navigate the conformational space of complex molecular systems. J. Chem. Phys. 110: 3697–3702. [Google Scholar]
- Mark P. and Nilsson L. 2001. Structure and dynamics of the TIP3P, SPC, and SPC/E water models at 298 K. J. Phys. Chem. A 105: 9954–9960. [Google Scholar]
- Morra G., Hodoscek M., Knapp E. 2003. Unfolding of the cold shock protein studied with biased molecular dynamics. Proteins 53: 597–606. [DOI] [PubMed] [Google Scholar]
- Paci E. and Karplus M. 1999. Forced unfolding of fibronectin type 3 modules: An analysis by biased molecular dynamics simulations. J. Mol. Biol. 288: 441–459. [DOI] [PubMed] [Google Scholar]
- Paci E., Caflisch A., Pluckthun A., Karplus M. 2001. Forces and energetics of hapten-antibody dissociation: A biased molecular dynamics simulation study. J. Mol. Biol. 314: 589–605. [DOI] [PubMed] [Google Scholar]
- Paci E., Greene L.H., Jones R.M., Smith L.J. 2005. Characterization of the molten globule state of retinol-binding protein using a molecular dynamics simulation approach. FEBS J. 272: 4826–4838. [DOI] [PubMed] [Google Scholar]
- Price W.S., Ide H., Arata Y.J. 1999. Self-diffusion of supercooled water to 238 K using PGSE NMR diffusion measurements. J. Phys. Chem. A 103: 448–450. [Google Scholar]
- Prockop D.L. and Ala-Kokko L. 2004. Inherited disorders of connective tissue. In Harrison's principles of internal medicine (eds. Kasper D.L. et al.) . pp. 2324–2331. McGraw-Hill Companies, New York.
- Rauch F. and Glorieux F.H. 2004. Osteogenesis imperfecta. Lancet 363: 1377–1385. [DOI] [PubMed] [Google Scholar]
- Rodier F., Bahadur R.P., Chakrabarti P., Janin J. 2005. Hydration of protein–protein interfaces. Proteins 60: 36–45. [DOI] [PubMed] [Google Scholar]
- Ryckaert J.P., Ciccotti G., Berendsen H.J.C. 1977. Numerical integration of cartesian equations of motion of a system with constraints: Molecular-dynamics of n-alkanes. J. Comput. Phys. 23: 327–341. [Google Scholar]
- Sangita V., Satheshkumar P.S., Savithrib H.S., Murthy M.R.N. 2005. Structure of a mutant T=1 capsid of Sesbania mosaic virus: Role of water molecules in capsid architecture and integrity. Acta Crystallogr. D Biol. Crystallogr. 61: 1406–1412. [DOI] [PubMed] [Google Scholar]
- Steinfeld J.I., Francisco J.S., Hase W.L. In Chemical kinetics and dynamics. . 1988. Prentice Hall, West Nyack, New York.
- Stryer L. In Biochemistry . 1988. W.H. Freeman, New York.
- Stultz C.M. 2002. Localized unfolding of collagen explains collagenase cleavage near imino-poor sites. J. Mol. Biol. 319: 997–1003. [DOI] [PubMed] [Google Scholar]
- Westerhausen A., Kishi J., Prockop D.J. 1990. Mutations that substitute serine for glycine αl–598 and glycine αl–631 in type I procollagen. J. Biol. Chem. 265: 13995–14000. [PubMed] [Google Scholar]


