

Abstract
Antisocial behavior, substance use, and impulsive and aggressive personality traits often co-occur, forming a coherent spectrum of personality and psychopathology. In the current research, the authors developed a novel quantitative model of this spectrum. Over 3 waves of iterative data collection, 1,787 adult participants selected to represent a range across the externalizing spectrum provided extensive data about specific externalizing behaviors. Statistical methods such as item response theory and semiparametric factor analysis were used to model these data. The model and assessment instrument that emerged from the research shows how externalizing phenomena are organized hierarchically and cover a wide range of individual differences. The authors discuss the utility of this model for framing research on the correlates and the etiology of externalizing phenomena.
Keywords: drug, alcohol, impulsivity, aggression, classification
The existence of individual differences in the tendency to contain versus express impulses has been recognized in academic psychology since its inception as a discipline (James, 1890/1983). In more recent times, this domain has been instantiated in psychological constructs ranging from disinhibition (Clark & Watson, 1999; Gorenstein & Newman, 1980) to impulsivity (Barratt, 1994; Dickman, 1990; Gray, 1981; Whiteside & Lynam, 2001), ego control (J. Block, 1965; J. H. Block & Block, 1980), constraint (Tellegen, 1985), the problem behavior syndrome (Jessor & Jessor, 1977), sensation seeking (Zuckerman & Kuhlman, 2000), and novelty seeking (Cloninger, Svrakic, & Przybeck, 1993). In addition, a dimension of effortful control is a salient feature of childhood temperament that likely relates to these disinhibitory personality characteristics in adulthood (Rothbart, Ahadi, & Evans, 2000). Robust correlations have also been observed between these disinhibitory personality constructs and mental disorders involving substance problems and antisocial behavior (for a review, see Sher & Trull, 1994).
In spite of these rich interrelations, many of these constructs continue to be studied and conceptualized as separate entities, in separate literatures. A major reason for this fragmentation is the lack of an integrative model of this domain (Widiger & Clark, 2000). The purpose of the current research is to further the development of an empirically based model of this broad domain of personality and psychopathology, which we term the externalizing spectrum (Krueger, Markon, Patrick, & Iacono, 2005).
Origins of the Externalizing Spectrum Conceptualization
As applied to adult psychopathology, the externalizing spectrum conceptualization emerged initially from research on mental disorders defined within current nosologies. In the Diagnostic and Statistical Manual of Mental Disorders (4th ed., text. rev.; DSM–IV–TR; American Psychiatric Association, 2000), various forms of substance problems are conceptualized as discrete disorders that are separate from antisocial behavior disorders. Serious antisocial behavior earlier in life is labeled conduct disorder and is considered a disorder usually first diagnosed in infancy, childhood, or adolescence; serious antisocial behavior that persists into adulthood is labeled antisocial personality disorder; and antisocial behavior that originates in adulthood is listed as an “other condition that may be a focus of clinical attention” and is not considered a disorder per se. Although substance problems, conduct disorder, and antisocial personality disorder are conceptualized as distinct and are listed in separate sections of the DSM–IV–TR, extensive research shows that these disorders co-occur at well beyond chance levels (see, e.g., Armstrong & Costello, 2002, and Waldman & Slutske, 2000, for reviews). Indeed, multivariate analyses of patterns of co-occurrence among these disorders have revealed a factor—a coherent liability dimension—that links these disorders and distinguishes them from other commonly occurring disorders (e.g., mood and anxiety or internalizing disorders; Kendler, Davis, & Kessler, 1997; Krueger, 1999; Krueger, Caspi, Moffitt, & Silva, 1998). Similar internalizing and externalizing factors have been highly replicable in literature on the empirical organization of psychopathology in children (e.g., Achenbach & Edelbrock, 1984), and the terms internalizing and externalizing recognize this structural connection between the child and adult psychopathology literatures.
Given well-replicated evidence for the existence of a coherent externalizing liability, recent research has focused on better understanding the nature of this liability. Two major approaches have been pursued. A first approach has focused on studying the genetic and environmental origins of externalizing liability. Krueger et al. (2002) examined the genetic and environmental origins of externalizing liability in a sample of twins in late adolescence. The adult criteria of the antisocial personality disorder diagnosis—conduct disorder, alcohol dependence, drug dependence, and an unconstrained personality style—were successfully modeled as indicators of a single liability continuum, and variation along that continuum was found to be primarily attributable to genetic influences. Hicks, Krueger, Iacono, McGue, and Patrick (2004) extended this model by also including these twins’ parents and found that parent–offspring resemblance could be attributed to transmission of the general externalizing liability, as opposed to separate transmission of risk for individual externalizing disorders. Young, Stallings, Corley, Krauter, and Hewitt (2000) also obtained evidence for a genetically coherent externalizing continuum linking conduct disorder, substance experimentation, attention-deficit/hyperactivity disorder, and the personality trait of novelty seeking in a sample of adolescent twins. A study by Kendler, Prescott, Myers, and Neale (2003) presented evidence that alcohol dependence, other drug abuse or dependence, adult antisocial behavior, and conduct disorder were well modeled as indicators of a genetically coherent externalizing continuum in adults. Thus, across a number of studies and research groups, externalizing liability has been found to be substantially heritable and coherent at a genetic level.
A second approach to better understanding the nature of externalizing liability has focused on comparisons of dimensional and categorical models of externalizing disorders. Recent developments in statistical modeling facilitate the direct comparison of models that posit different accounts of the occurrence and co-occurrence of psychopathological syndromes. One type of model (a latent class model) posits a categorical account of the occurrence and co-occurrence of externalizing disorders. This type of model would fit the data if there were evidence of a categorical distinction between specific externalizing disorders or groups of disorders (e.g., substance use problems vs. antisocial behavior). Another type of model (the latent trait model) posits a continuous account of the occurrence and co-occurrence of externalizing disorders. This type of model would fit the data if there were evidence of continuity between separate externalizing disorders, such that the various disorders could be linked to a unifying continuum. These models are not generally equivalent and may therefore be compared in their ability to fit observed data (Lubke & Neale, 2006; Markon & Krueger, 2006).
Krueger, Markon, et al. (2005) fitted these models to data on conduct disorder, antisocial behavior (the adult criterion of antisocial personality disorder), alcohol dependence, marijuana dependence, and drug dependence, as defined by the Diagnostic and Statistical Manual of Mental Disorders (3rd ed., rev.; DSM–III–R; American Psychiatric Association, 1987), in a sample of Minnesota adults. Markon and Krueger (2005) fitted the same models to data on nicotine dependence, alcohol dependence, antisocial personality disorder, marijuana dependence, cocaine dependence, and other substance dependence, as defined by the Diagnostic and Statistical Manual of Mental Disorders (4th ed.; DSM–IV; American Psychiatric Association, 1994), in a nationally representative sample of adults in the United States. In both studies, the best fitting model was a latent trait model positing a continuous account of the occurrence and co-occurrence of externalizing disorders, in which the unifying externalizing liability was normally distributed. Thus, externalizing liability has been found to be well modeled as a coherent and normally distributed dimension of risk, as opposed to as a set of separate categories corresponding to separate disorders or classes of disorder.
In sum, the current literature supports a number of interrelated conclusions. Co-occurrence patterns of DSM-defined externalizing disorders are well fitted by models that posit a unifying externalizing liability, and etiologic factors of a mostly genetic nature undergird the phenotypic coherence of this liability. In addition, direct comparisons of categorical and continuous accounts of externalizing liability support the idea that the liability is continuous in nature.
Taken together, these findings indicate that DSM-defined substance and antisocial behavior disorders are well conceptualized as elements within a coherent externalizing spectrum. The spectrum concept is apt for linking these findings because it captures the idea of a continuously varying domain of problems united by substantial etiologic commonalities, yet it also accommodates distinctive features of specific elements within the domain. Although substance and antisocial behavior disorders are linked by the shared externalizing liability, other etiologic factors contribute to the precise expression of these factors—for example, in contributing to the use of one substance versus another (Kendler et al., 2003; Tsuang et al., 1998).
Connecting Externalizing Psychopathology and Personality Traits
Given the continuous nature of the externalizing liability, the externalizing spectrum may transcend the putative distinction between “abnormal” or psychopathological phenomena and more “normal” phenomena, such as specific personality traits. Current conceptualizations of psychopathology tend to recognize personality traits only to the extent that they are elements of personality disorders—when they are extreme, inflexible, or maladaptive. However, evidence for the continuity of the externalizing spectrum brings into question the idea that abnormality is a feature inherent to externalizing phenomena. That is, there is better empirical evidence for the continuity, as opposed to the discreteness, of specific externalizing syndromes and the overarching externalizing liability (Krueger, Markon, et al., 2005; Markon & Krueger, 2005). This leads to the possibility that the externalizing spectrum extends into the realm of more normal-range individual differences, such as those typically categorized under the rubric of personality traits.
Along these lines, extensive evidence documents significant correlations between personality traits and externalizing forms of psychopathology. In particular, the most relevant specific traits entail aggression and impulsivity (Acton, 2003; Casillas & Clark, 2002; Lynam, Leukefeld, & Clayton, 2003; Sher, Bartholow, & Wood, 2000; Slutske et al., 2002). In the higher order structure of personality, these specific traits fall in the domains of Disagreeableness and Unconscientiousness at the five-factor level, and these five-factor-level domains combine to form the broader domain of disinhibition, or lack of constraint (Markon, Krueger, & Watson, 2005). Thus, the personality correlates of externalizing problems make psychological sense: Disinhibitory traits, such as aggression and impulsivity, are consistently associated with externalizing forms of psychopathology.
A persistent question, however, is how to best conceptualize these personality–psychopathology correlations. One compelling possibility that flows directly from the externalizing spectrum model (ESM) is that disinhibitory personality traits are elements within the externalizing spectrum, alongside more patently psychopathological phenomena, such as “diagnosable” antisocial behavior and substance use problems. Although this hypothesis is compelling, existing conceptual and assessment models serve as a barrier to direct evaluation. Personality traits and mental disorders tend to be studied in distinct literatures and, hence, constructed and assessed in distinct ways. Mental disorders are typically studied as dichotomies (presence vs. absence of a diagnosis), constructed by complex diagnostic algorithms. Personality traits are typically studied as continuous variables, constructed by adding up the number of indicators endorsed. A direct test would be facilitated by mixing concepts from psychopathology and personality in the same assessment and evaluating the extent to which these concepts are empirically organized into a coherent spectrum of individual differences, as opposed to being organized into personality constructs versus psychopathology constructs.
Toward a Comprehensive Model of the Externalizing Spectrum
The current literature shows that DSM-defined substance use disorders and antisocial behavior disorders can be understood as elements within a genetically coherent, continuously varying liability spectrum. The literature also shows that these problems are closely associated with disinhibitory personality traits. This suggests that these various constructs—substance use problems, antisocial behavior problems, and disinhibitory personality traits—and their associated literatures might be usefully brought together under a single, unifying model.
If this could be accomplished, it would have wide-ranging implications for how these constructs are thought about and studied. For example, rather than organizing the study of these constructs on the basis of their apparent surface manifestations (e.g., as substance use problems vs. antisocial behavior), they could be studied based on their underlying empirical structure (e.g., in terms of a continuum of liability for a variety of problems in this realm as well as specific etiologic contributions to specific manifestations of this liability).
In constructing this type of spectrum model, a number of more specific considerations also become salient. As described earlier, a major barrier to integration involves the distinct ways candidate elements within the externalizing spectrum are constructed and assessed. For example, DSM-defined diagnoses collapse information about a number of more narrow constructs (e.g., impulsivity and aggression) into single categories (e.g., antisocial personality disorder). Similarly, personality constructs of various levels of breadth versus specificity have been studied in relation to externalizing problems, from broad domains, such as disagreeableness and unconscientiousness (Lynam et al., 2003) or behavioral undercontrol (Slutske et al., 2002), to more narrow domains, such as a lack of compliance (J. D. Miller, Lynam, & Leukefeld, 2003).
In construction of a comprehensive, empirically based model of the externalizing spectrum, therefore, it would be useful to begin at the most specific level possible with all target elements, regardless of their origin in a specific literature or domain or their putative status as a cause versus a consequence. This step is important because it places all candidate elements, or facets, on the same level playing field, thereby allowing data to determine how these elements are organized. In the current research, we therefore began by identifying target externalizing spectrum facets at a very specific level, guided by our current understanding of externalizing phenomena from the existing literature. For example, rather than starting with constructs such as antisocial personality disorder, we began by identifying specific elements within those aggregate constructs, such as specific forms of aggression and impulsivity.
The next step in the process was to instantiate these constructs in a specific assessment approach that was amenable to exploratory empirical analysis so that we could use data to work from the ground up in determining how these constructs are organized into a coherent model. Although these constructs can be measured in numerous ways, the practical starting point we chose was self-report. Self-reports have various strengths and weaknesses (Stone et al., 1999), but a major strength in the current context is that such approaches allow the efficient collection of extensive information from the perspective of the self—that is, the perspective of the individual who has the most exposure to his or her own behavioral tendencies.
A next step was to identify groups to target in data collection. Often, when models are first developed, they are developed for application to relatively specific populations (e.g., prisoners). This is a very practical strategy, but it can also serve as a barrier to the integration of constructs across a wide range of individual differences. With regard to the externalizing spectrum, this is a particularly salient issue because the construct is hypothesized to cover a wide range, transcending normal personality and abnormal phenomena. We therefore sampled from groups across a wide range of putative externalizing behavioral tendencies, including both university students and incarcerated prisoners. In addition, we took an iterative approach to developing our models by sampling independently from these groups over the course of three waves of data collection. That is, we began with an initial sample of students and prisoners and allowed our analyses of data collected from this initial sample to guide our construction of questions to be asked in the next wave, repeating this process over three waves of data collection from nonoverlapping groups of research participants.
A final step involved the identification of appropriate statistical approaches to the data, as these approaches provide the means to link raw data with conceptual models of the externalizing spectrum. Statistical approaches have grown exponentially in both their utility and their sophistication in recent years, and, hence, a final step in the current research was to identify relevant statistical innovations (e.g., item response theory [IRT] models and new approaches to factor analysis) and demonstrate their application to modeling the externalizing spectrum. This serves two purposes. It provides the means of linking our data with conceptual models, but it also serves the purpose of outlining how recent developments in modeling can be critically useful in providing a close link between data and conceptual models of the organization of psychopathology and personality.
Method
Facets of the externalizing spectrum were developed through an iterative process involving generation of items describing specific externalizing phenomena, factor and cluster analysis of these items, and item selection. In each wave of data collection, items were written to target specific constructs; items targeting each construct were factor and cluster analyzed to identify unidimensional item sets, and items within each set were selected via IRT criteria. In this way, the results of each wave of data collection were used to formulate new constructs or generate new items for the next wave of data collection. Specific details regarding analytic techniques used in this iterative process are explained below in the contexts in which they were used in this research.
Participants and Procedure
Participants in the current research were recruited from undergraduate psychology courses, a male medium-security state prison, and a female minimum–medium-security prison. Candidate items were administered in questionnaire form to students in classrooms and auditoriums and to prisoners in gymnasiums or community areas of the prisons, which were temporarily furnished with chairs and tables. The questionnaire administration sessions involving students were monitored by research assistants, and prison administration sessions were also monitored by at least one correctional officer in addition to research assistants. Written informed consent was obtained from all participants prior to administration of the questionnaires. Participants were encouraged to complete the questionnaires honestly, and prisoners were made aware of methods of validity evaluation available to us (e.g., the ability to compare questionnaire responses and information contained in prison records). Confidentiality of responses was emphasized orally and in the study consent forms. Student participants were compensated with extra credit toward their psychology course grade or a payment of $10, and prison participants were each paid $10.
Data were collected in three separate waves, which resulted in three nonoverlapping samples. A small number of participants’ inventories (n = 22) were removed prior to analyses because their pattern of responding appeared obviously invalid upon visual inspection (e.g., zigzag patterns of responses, several pages of all “false” responses). The analyses presented here are based on all remaining data. Questionnaire responses were collected from 289 students and 286 prisoners in the first wave of data collection, 299 students and 314 prisoners in the second wave, and 283 students and 316 prisoners in the third wave. There were 1,787 participants (49% male) in the sample, collapsed across the three waves. The mean participant age was 26.8 years (SD = 9.4, range = 18–63; see Table 1 for additional demographic information).
Table 1.
Sample Demographics
| Demographic | % |
|---|---|
| Gender | |
| Male | 49.0 |
| Female | 51.0 |
| Ethnicity | |
| African American | 14.3 |
| Caucasian | 68.8 |
| Asian | 6.4 |
| Hispanic | 2.5 |
| Native American | 4.1 |
| Middle Eastern | 0.3 |
| Mixed ethnicity | 3.3 |
| Other | 0.3 |
| Marital status | |
| Never married/single | 76.5 |
| Divorced | 10.6 |
| Widowed | 1.3 |
| Married | 10.6 |
| Engaged | 1.0 |
| Education | |
| < 8th grade | 0.7 |
| 8th grade | 1.0 |
| 9th grade | 2.1 |
| 10th grade | 3.0 |
| 11th grade | 4.4 |
| GED | 14.9 |
| High school diploma | 6.5 |
| Some college | 58.2 |
| AA or vocational | 5.8 |
| BA or RN | 2.2 |
| Some graduate school | 0.9 |
| MA | 0.2 |
| PhD, MD, or JD | 0.1 |
Note. GED = general equivalency diploma; AA = associate of arts; BA = bachelor of arts; RN = registered nurse; MA = master of arts; Ph.D. = doctor of philosophy; MD = doctor of medicine; JD = juris doctor.
Item Content
Items were written by project personnel who were familiar with the target constructs under consideration. Various sources were consulted during initial item writing, including existing literature on targeted constructs and their instantiation in diverse existing instruments (Alcohol Dependence Scale; Skinner & Allen, 1982; Barratt Impulsiveness Scale; Barratt, 1994; Buss–Perry Aggression Questionnaire; Buss & Perry, 1992; Dickman Impulsivity Inventory; Dickman, 1990; Eysenck Impulsivity-7 Scale; Eysenck, Pearson, Easting, & Allsopp, 1985; Michigan Alcoholism Screening Test; Selzer, 1971; Psychopathy Checklist—Revised; Hare, 2003; Psychopathic Personality Inventory; Lilienfeld & Andrews, 1996; Substance Abuse Module; Robins, Babor, & Cottler, 1987; Short Drug Abuse Screening Test; Skinner, 1982; State–Trait Anger Expression Inventory; Spielberger, 1988; Sensation Seeking Scale; Zuckerman, 1979; Urgency–Premeditation–Perseverance–Sensation Seeking–Impulsivity Questionnaire; Whiteside & Lynam, 2001), as well instruments designed to assess multiple constructs of potential relevance (Emotionality–Activity–Sociability–Impulsivity Questionnaire; Buss & Plomin, 1975; Multidimensional Personality Questionnaire; Tellegen, in press; Neuroticism–Extraversion–Openness Personality Inventory–Revised; Costa & McCrae, 1995). We also consulted diagnostic criteria listed in the DSM–IV–TR (American Psychiatric Association, 2000), with particular attention to criteria for disorders that have externalizing features: oppositional defiant disorder, conduct disorder, attention-deficit/hyperactivity disorder, intermittent explosive disorder, antisocial personality disorder, borderline personality disorder, and substance abuse and dependence criteria. Items were selected for inclusion in data collection on the basis of rated estimated severity and relevance to constructs, existing literature on similar items, and readability. All items included for data collection were required to have a readability level of no higher than eighth grade.
Constructs targeted during item generation changed somewhat over the course of the three waves of data collection, because of the iterative nature of the study design. For the initial wave of data collection, 11 construct domains were targeted: aggression, lack of remorse, blame externalization, alcohol use, marijuana use, drug use, antisocial behavior, impulsivity, irresponsibility, rebelliousness, and sensation seeking. For the second wave of data collection, no additional constructs were targeted, although new items were generated as additional indicators of existing constructs on the basis of the item and factor analytic results of the first wave of data collection. For the third wave of data collection, 4 new constructs were targeted: affiliation, dependability, obedience, and need for routine. The targeting of these new constructs during the third wave of data collection coincided with a general effort to generate items assessing the opposite pole of the hypothesized general externalizing factor.
Item Analyses
Analyses corresponding to each wave proceeded in two broad phases. In the first phase, an initial set of structural analyses was conducted to identify or confirm unidimensional subfactors within each targeted domain. In the second phase, IRT analyses were conducted to identify items that had desirable measurement characteristics for each subfactor.
In each wave, all data available for an analysis were used, to maximize the amount of information available about each item. The total sample size used in each wave was therefore cumulative, including data from prior waves in addition to data from the current wave. Although we are not aware of methodological research directly supporting either this strategy or alternative strategies (e.g., estimation of final parameters in an independent sample) in psychometrics, other recent methodological work (Skol, Scott, Abecasis, & Boehnke, 2006) showed that it is more efficient to jointly analyze all the data simultaneously when estimating model parameters, as opposed to limiting final parameter estimates to the second stage of a two-stage design, when the first stage involves obtaining initial estimates and the second stage involves independent reestimation of a subset of parameters in an independent sample. As new items were introduced in each wave, responses of individuals from prior waves were treated as missing on the new items. The missing data were then treated with full-information missing data analytic methods, which have been recommended for modeling data that are missing by design, such as our data (Graham, Hofer, & MacKinnon, 1996; Schafer & Graham, 2002).
Item structural modeling
Initial item structural analyses were conducted to identify unidimensional subfactors within each targeted domain. These initial item structural analyses were conducted via exploratory factor analysis (EFA) and cluster analysis. EFA was conducted on the item polychoric correlation matrices via the Mplus computer package (Muthén & Muthén, 1998–2004) with maximum likelihood estimation and varimax and promax rotation. Estimated polychoric correlations between items in each domain were used to avoid spurious identification of “difficulty factors”—that is, factors consisting of items that had similar response category endorsement frequencies (McDonald, 1965). EFAs were generally conducted within each construct domain (e.g., EFAs were conducted on aggression items, impulsivity items, etc.). Additional EFAs were also conducted on combined item sets of conceptually similar domains, to test for discriminant relations between item sets (e.g., in the first wave of data collection, the marijuana and drug items were treated as a single domain in an additional EFA, to ensure that the items were not better modeled as a single domain).
Cluster analysis is increasingly advocated as a means of exploring the structure of relationships among measures. Exploring the structural relations among measures can be conceptualized as a cluster analytic task in that the goal of the analysis is to identify clusters of similar, correlated measures and to explore relationships among those clusters. The flexibility and accuracy of cluster analytic techniques have led to increasing recognition and recommendation of their use in the delineation of factor structure, especially in cases in which variables are highly correlated (Bacon, 2001; Tate, 2003; van Abswoude, Vermunt, Hemker, & van der Ark, 2004).
In the present cluster analyses, we used polychoric correlations or angular distances as indexes of similarity between items.1 Clustering via Ward’s (1963) method was then used to examine the hierarchical structure of the externalizing items. Ward’s method has been shown to be effective in delineating factor structure relative to other hierarchical agglomerative clustering techniques (Kim, 2002; Siok-Hoon, 1999).
In conducting structural analyses, domain factor models were retained on the basis of item clustering, scree plot considerations, and replicability of factor solutions across waves of data collection. In initial waves of data collection, we favored factor models that contained more factors over factor models that contained fewer factors, to maintain a primary-level representation of externalizing phenomena. We favored factor models that contained fewer factors in later waves of data collection if the lower level factors did not replicate across waves.
Item response modeling
Following identification of unidimensional factors within each domain, item responses were modeled via IRT methodology. For these IRT analyses, items were assigned to the factors on which they had the greatest loadings in the EFAs. For all items, the graded response model (GRM; Samejima, 1969) was used, as implemented in MULTILOG (Thissen, 1991). The GRM is an extension of a two-parameter logistic IRT model for dichotomous (e.g., true–false) items to ordered polytomous items (i.e., items with multiple response options; e.g., our items, which were rated on a 4-point scale with response options of true, somewhat true, somewhat false, and false). The two parameters of the GRM refer to (a) the discrimination, or the strength of the association between the item and the factor it measures, and (b) the locations of specific response options for an item, or the level along the factor that a response option best measures, from low to high levels of the factor. These concepts are explained in greater detail in a variety of sources (e.g., Embretson & Reise, 2000).
For our current purpose of developing scales to measure the externalizing spectrum, the discrimination and location parameters from the GRM were also combined to index the information provided by specific items. Information refers to the precision with which an item measures a specific factor at a specific level (see, e.g., Embretson & Reise, 2000). In particular, items were selected with the goal of maximizing information over a wide range of locations (i.e., severity or extent of externalizing tendencies, from low to high levels). Items were retained if they had relatively larger discrimination parameter estimates and if the maximum of the item information function occurred in an area of the trait distribution that was not sufficiently represented by other items. In this regard, items with relatively low discriminations—although still above a reasonable threshold—might be retained if their information function was centered on a range of the trait distribution that was not represented by other items. Similarly, in domains with a large number of items, items with relatively large discriminations might not have been retained if their information functions overlapped substantially with other items.
We also considered the possibility that specific items marked for potential deletion might contain content relevant to another domain. That is, we analyzed items that did not meet initial selection criteria together with items from other domains to determine whether they might function better in a different item set. These “orphan items” were correlated with maximum likelihood trait estimates in other domains. If an orphan item correlated highly with a trait estimate from another domain, we included that item in an IRT analysis with items in that domain to determine whether it met criteria for inclusion in that domain.
Additionally, following initial item selection, structural analyses were conducted to determine the relevance of each subfactor to the overall externalizing spectrum, and items indexing subfactors that were not relevant to externalizing were removed. That is, following item selection at each wave of data collection, preliminary maximum likelihood scale score estimates were obtained for each subfactor via MULTILOG. A one-factor model was then fitted to these estimates with maximum likelihood estimation. Hierarchical cluster analyses were also conducted on the estimates. Items indexing factors that had small loadings in a one-factor model and did not cluster with the bulk of other subfactors (suggesting lack of relevance to the general externalizing construct) were dropped from further waves of data collection.
Results
Item analyses conducted across the three iterative waves of data collection delineated a final set of 23 unidimensional scales, comprising a total of 415 items. These scales represent subfactors of the original 11 targeted construct domains, plus 1 of the new constructs targeted in the third wave of data collection (dependability). The 23 subfactor scales cover a range of content as well as a range of severity of externalizing behavior.
Scale Content
Example items from each of the 23 subfactor scales are given in Table 2. Items in Table 2 were selected according to the location of maximum item information in terms of latent trait value, symbolized by the Greek letter eta (η). Items shown are those with the minimum, median, and maximum eta location of the information peak among items in each subscale. The example items thus represent the range of severity for each subscale. Examination of the items represented in Table 2 indicates that the subfactor scales cover a relatively broad range of severity within each construct.
Table 2.
Items Delineating Facets of the Externalizing Spectrum
| Scale | No. items | ρ | Item |
|---|---|---|---|
| Relational Aggression | 19 | .94 | “I’ve made fun of someone who annoyed me.” |
| “I’ve made a fool of someone because it made me feel good.” | |||
| “When someone upsets me, I make sure no one else will have anything to do with them.” | |||
| Physical Aggression | 21 | .92 | “If someone hit me, I would probably walk away without fighting.” (−) |
| “One or more times in my life, I have beaten someone up for bothering me.” | |||
| “I’ve held someone down to get what I wanted from them.” | |||
| Destructive Aggression | 15 | .84 | “I have damaged someone’s property because I was angry with them.” |
| “I vandalized someone’s house or things because they were rude to me.” | |||
| “I’ve started a fire that caused damage to get back at someone who hurt me.” | |||
| Empathy | 31 | .96 | “I am an understanding person.” |
| “It doesn’t bother me to see someone else in pain.” (−) | |||
| “At times I don’t really care how others feel.” (−) | |||
| Blame Externalization | 14 | .92 | “I’ve been accused of things I never did.” |
| “I get unfairly blamed for things.” | |||
| “I have been charged for crimes that weren’t my fault.” | |||
| Alienation | 9 | .87 | “I rarely feel used.” (−) |
| “People have avoided blame by taking advantage of me.” | |||
| “I have often been disappointed by placing too much trust in others.” | |||
| Alcohol Problemsa | 30 | .98 | “I’ve often ended up drinking more than I should.” |
| “People have told me they’re worried about my drinking too much alcohol.” | |||
| “After cutting down on alcohol, I saw or heard things that weren’t really there.” | |||
| Alcohol Usea | 23 | .90 | “I don’t need alcohol to have a good time.” (−) |
| “A little alcohol makes a good time even better.” | |||
| “I have not tried drinking hard liquor.” (−) | |||
| Marijuana Problemsa | 18 | .97 | “I’ve taken breaks from work or school to get high on marijuana.” |
| “My marijuana use has led to problems at home, work, or school.” | |||
| “I spent a long time recovering from the effects of marijuana.” | |||
| Marijuana Usea | 17 | .97 | “I have tried smoking marijuana.” |
| “I have rolled a marijuana joint.” | |||
| “Sometimes I function better with marijuana than without it.” | |||
| Drug Problemsa | 25 | .98 | “I’ve used hard drugs.” |
| “At some point in my life, I couldn’t get high from a drug dose that worked before.” | |||
| “I’ve accidentally overdosed on drugs.” | |||
| Drug Usea | 13 | .96 | “I’ve never taken illegal drugs.” (−) |
| “I don’t like being around people who are using drugs.” (−) | |||
| “I have inhaled the fumes of something to get high, like paint or glue.” | |||
| Problematic Impulsivity | 20 | .93 | “I have made someone angry with me by doing something without thinking.” |
| “I have lost valuable goods or money because I decided things too quickly.” | |||
| “I have done things on impulse that led to others getting badly hurt or killed.” | |||
| Planful Control | 11 | .90 | “I plan my life carefully.” |
| “I think about things before I do them.” | |||
| “Most of the time, I have good self control.” | |||
| Impatient Urgency | 12 | .90 | “I have no problem waiting for things I want.” (−) |
| “I have a hard time waiting patiently for things I want.” | |||
| “My wants often feel more like needs.” | |||
| Theft | 15 | .80 | “I have taken items from a store without paying for them.” |
| “I have broken into a house, school, or other building.” | |||
| “I have taken a purse or wallet from someone who was carrying it.” | |||
| Fraud | 14 | .89 | “I have lied to get out of things I didn’t want to do.” |
| “I have lied to get benefits I didn’t deserve.” | |||
| “I have gotten money from people by threatening to tell their secrets.” | |||
| Honesty | 15 | .93 | “I am a truthful person.” |
| “I tell the truth whenever others are involved.” | |||
| “I lie sometimes without even thinking about it.” (−) | |||
| Irresponsibility | 25 | .93 | “I’ve let people down who trusted me.” |
| “I’ve missed a rent or mortgage payment.” | |||
| “I’ve missed a child support payment.” | |||
| Dependability | 23 | .95 | “I keep my word.” |
| “I let others know if I’m running behind.” | |||
| “I’ve often missed things I promised to attend.” (−) | |||
| Rebelliousness | 15 | .93 | “I usually do what I’m supposed to do.” (−) |
| “Many people consider me a rule breaker.” | |||
| “Having rules hasn’t kept me from breaking them.” | |||
| Excitement Seeking | 18 | .93 | “I try to fill my life with action and excitement whenever possible.” |
| “I seek out thrills almost everywhere I go.” | |||
| “I would enjoy being in a high-speed chase.” | |||
| Boredom Proneness | 12 | .93 | “I lose interest in things if they’re not exciting.” |
| “I often get bored quickly and lose interest.” | |||
| “It takes a lot to keep me entertained.” |
Note. Reverse-keyed items are indicated by a minus sign in parentheses following item text. Example items were selected according to the location of maximum item information in terms of eta, the latent trait underlying each scale. Items shown are those with the minimum, median, and maximum eta location of the information peak, among items in each subscale.
The reliability estimate (ρ) was computed via an assumed variance of 0.5 instead of 1.0, as explained in the text.
Relational, Physical, and Destructive Aggression
These three scales measure aggressive behavior in various forms. Behaviors represented in the Relational Aggression scale include spreading rumors or lies about others, insulting them, and interfering in their relationships as a way to aggress. Behaviors represented in the Physical Aggression scale include hitting and striking others, participating in fights, and using physical restraint aggressively. The Physical Aggression scale also includes items reflecting use of weapons as well as aggressive rumination and threat. Items in the Destructive Aggression scale largely reflect property destruction; representative behaviors include vandalism, property destruction, and fire setting.
Empathy
This scale measures sympathy or lack of sympathy for others and sensitivity or lack of sensitivity to the effects of one’s actions on other people. Items keyed in one direction on this scale reflect callousness and a lack of remorse with regard to one’s actions; items keyed in the other direction reflect empathy and concern about the effect of one’s actions on others. Extreme responders on this scale are unusually empathetic or, at the other pole, express little regard for the consequences of their actions with respect to other individuals. The Empathy scale was derived from items targeting the lack of remorse domain.
Blame Externalization
Items on this scale reflect externalization of blame and denial of wrongdoing. Item content includes beliefs that one has been accused of behaviors that one did not do or has been accused of things one did not do wrong. Constituent items also reflect a sense of being unfairly blamed or accused of something wrong. Extreme responders would likely describe themselves as largely innocent individuals who have been unfairly blamed for things they did not do.
Alienation
Items on this scale largely reflect feelings of alienation from others. Item content includes feelings that one has been manipulated, used, or otherwise mistreated by others as well as feelings of being betrayed and mistrusting others. The Alienation scale comprises items that originally targeted blame externalization, together with additional items targeting alienation as a distinct construct. In contrast to the Blame Externalization items, which convey a simple denial of responsibility, Alienation items convey a sense that one has been mistreated.
Alcohol Use and Problems
Derived from the same item set, these two scales assess use and problems associated with alcohol. The two scales differ in their reference to negative consequences of alcohol use. Items on the Alcohol Use scale reflect experience with alcohol, without reference to the problematic consequences reflected in the Alcohol Problems subscale. Items on the Alcohol Use scale also reflect enjoyment of alcohol or inexperience with alcohol. Items on the Alcohol Problems scale, in contrast, reflect abusive or dependent use of alcohol or, more generally, alcohol use that has problematic consequences. Items on the Alcohol Problems scale contain various abuse and dependence content, including withdrawal; tolerance; and use associated with medical, legal, and social problems.
Marijuana Use and Problems
These two scales originally derived from the same item set. Items on the Marijuana Use scale reflect experience with marijuana, largely without reference to the problematic consequences reflected in the Marijuana Problems subscale. Some item content on the Marijuana Use scale does reflect hazardous use; there is also content reflecting enjoyment of marijuana. Items on the Marijuana Problems scale reflect abusive or dependent use of marijuana or, more generally, marijuana use that has problematic consequences. Items on the Marijuana Problems scale comprise various abuse and dependence content, including tolerance and use associated with legal and social problems.
General Drug Use and Problems
These two scales originally derived from the same item set. Items on the Drug Use scale reflect experience with drugs, without reference to the problematic consequences reflected in the Drug Problems subscale. Rather than dealing with specific drugs, most of the items make reference to classes of drugs, either by referencing effects or by giving multiple examples in a single item. Some items on the Drug Use scale also reflect inexperience with drugs. Items on the Drug Problems scale, in contrast, reflect abusive or dependent use of drugs or, more generally, drug use that has problematic consequences. Items contain various abuse and dependence content, including withdrawal, tolerance, and use associated with legal and social problems.
Problematic Impulsivity
Items in this scale originally targeted the impulsivity domain. These items reflect lack of control associated with negative consequences. Item content includes references to impulsivity with negative consequences or impulsivity experienced as unpleasant because of a subjective sense of lacking control over one’s own actions.
Planful Control
Items in this scale originally targeted the impulsivity domain and reflect adaptive planning, foresight, and restraint. High scorers would tend to describe themselves as being thoughtful and inclined to weigh consequences before acting.
Impatient Urgency
This scale was the third to emerge from items written to target the impulsivity domain. Item content includes references to impatience and a sense that desires must be satisfied immediately. High scorers describe themselves as often feeling strong urges that are outside their control.
Criminal Theft and Fraud
Items on these two scales target the antisocial behavior domain. Items on the Criminal Theft scale reflect various forms of theft, including theft, burglary, and robbery involving property or money. Items on the Fraud scale reflect swindling, conning, lying, and other forms of dishonesty and deceptiveness. Item content on the Fraud scale reflects a general tendency to lie or otherwise misrepresent oneself to receive benefits of various sorts (e.g., sex, status, money).
Honesty
Although the Honesty scale originally comprised a small number of items written to target the antisocial behavior domain, additional items were later added to expand the content of the scale. Items on this scale reflect general honesty and truthfulness. An extreme scorer on this scale would describe him or herself as someone for whom truthfulness is important and as someone who rarely, if ever, lies.
Irresponsibility
Items on this scale reflect irresponsibility as manifested in various ways, including failure to meet formal agreements or social or vocational expectations. Many items reference failure to honor financial contracts (e.g., loan payments, taxes) or other formal obligations (e.g., court appearances)—circumstances in which the person had some specific responsibility that he or she then failed to live up to.
Dependability
Items on this scale reflect general dependability and conscientiousness. Item content includes completing goals set or projects started as well as a sense of commitment. A few items are reversed in content, reflecting tardiness or lack of punctuality. High scorers on this scale describe themselves as being committed to goals and as being individuals that others see as reliable and dependable.
Rebelliousness
Items in this scale reflect rebelliousness. High scorers describe themselves as having a tendency to violate rules and to disobey others.
Excitement Seeking and Boredom Proneness
These two scales originally derived from the sensation seeking item set. Items in the Excitement Seeking scale reflect thrill- or excitement-seeking behavior, including enjoyment of arousal and excitement. Many items in the Excitement Seeking scale reflect enjoyment of risk and dangerous behavior because of the arousal it provides. Items in the Boredom Proneness scale reflect a tendency to become bored easily. Extreme scorers on the Boredom Proneness scale would likely describe themselves as becoming bored easily and as having difficulty remaining entertained.
Scale Measurement Properties
Figure 1 presents test information functions for each of the 23 scales. It is important to note that, while the range of the latent trait eta (depicted on the x-axis in z score units, i.e., with a mean of zero and a standard deviation of one) remains constant across the 23 panels, the range of the test information (depicted on the y-axis) changes. The difference in range of test information across the 23 subscales is due to a variety of factors, including differences in the number of items per scale, as well as differences in the measurement properties of constituent items.
Figure 1.
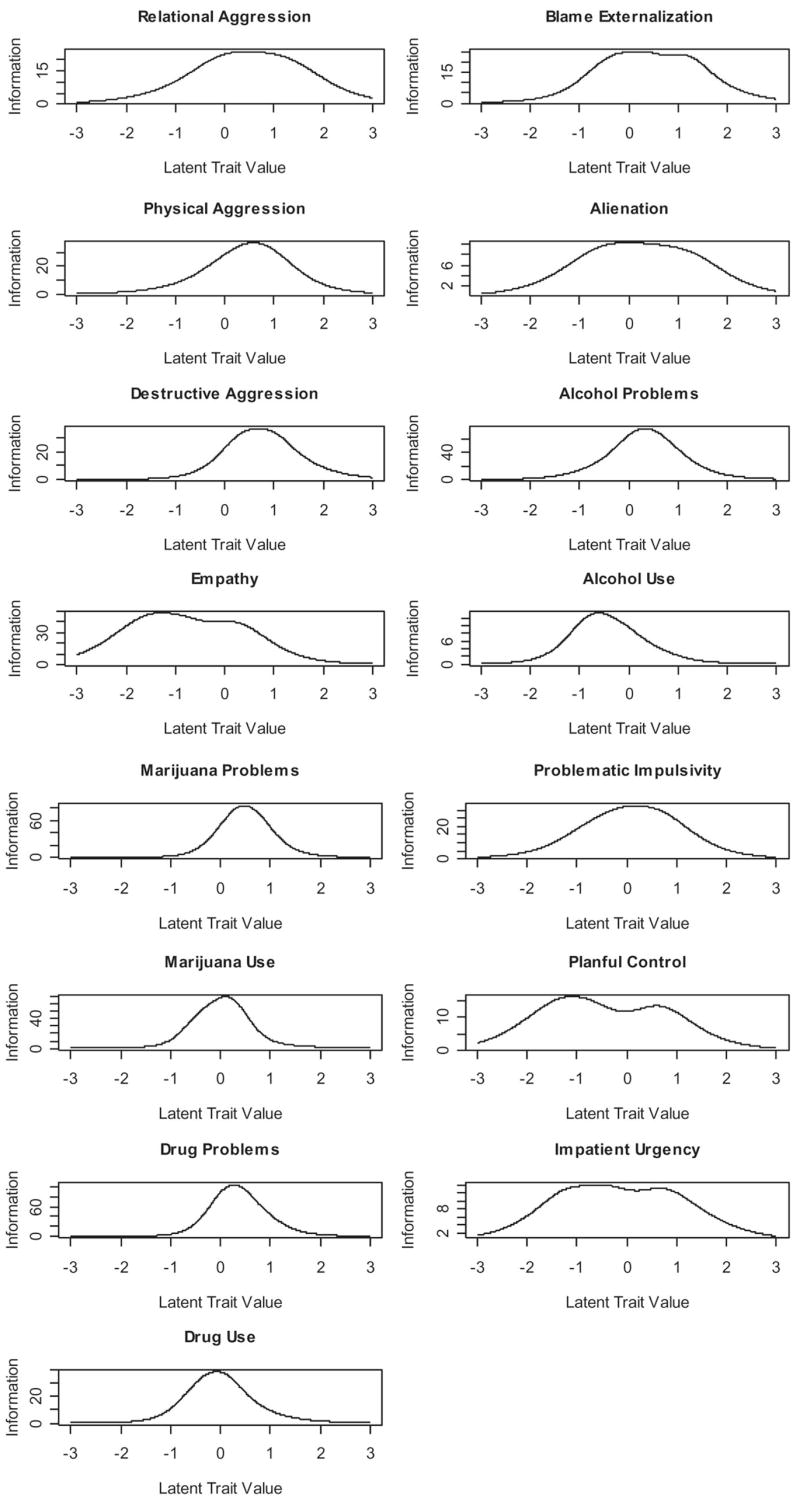
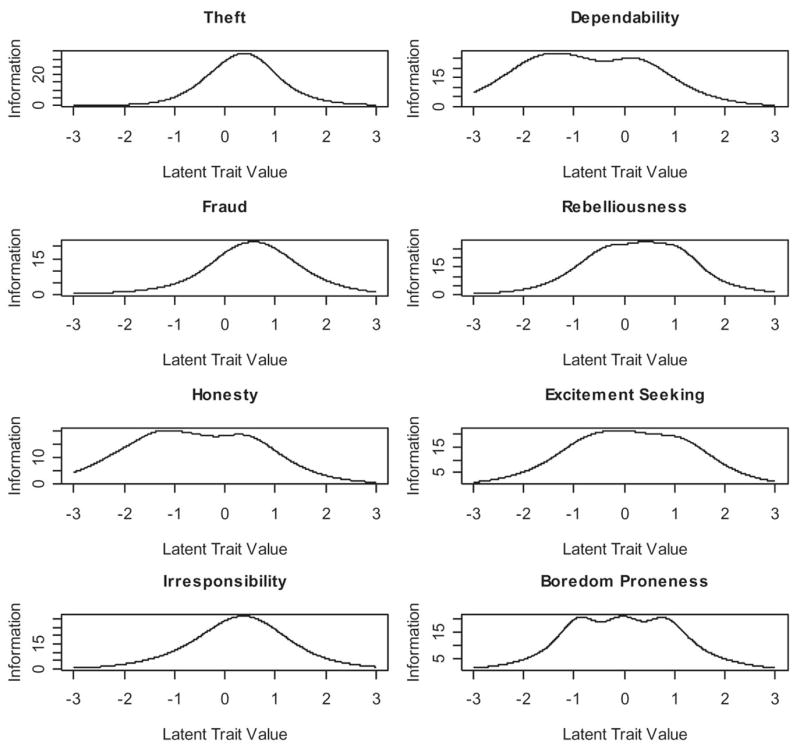
Test information of externalizing subscales. Latent trait values are given in a standardized (i.e., z) metric.
The test information functions for different scales are consistent with each scale’s content. For example, the substance problem scales are characterized by greater measurement information at the high end of their trait distributions than the substance use scales. This is consistent with interpretation of substance problems as being more severe than substance use per se.
The test information functions also suggest that certain scales provide effective measurement information over a greater range of their trait distribution than other scales. The Empathy scale, for example, provides effective measurement information over a wider range of its trait distribution than other scales centered on the same range of their trait distributions, such as Alcohol Use. Similarly, the Relational Aggression scale provides information about the latent trait over a wider range of its trait distribution than other aggression scales, including the Physical and Destructive Aggression scales. Inasmuch as our strategy in developing these scales was to cover a wide range across each of the unidimensional constructs portrayed in Figure 1, a reasonable interpretation is that, in addition to varying in their location or severity, the constructs also vary somewhat in their breadth. For example, relational aggression encompasses a wider range of aggressive content than destructive aggression (cf. the items in Table 2).
Reliability
Reliability estimates for the scales (ρ) are also provided in Table 2. Reliability estimates were calculated via formulas provided by Mellenbergh (1996) and reflect the proportion of observed trait estimate variance due to latent trait variance. That is, the reliability is given by
| (1) |
where var(η) is the variance of the latent trait η (fixed at 1.0 or 0.5 on the basis of theoretical considerations explained below), and var(x|η) is the variance of the trait estimate conditional on the value of the latent trait. The quantity var(x|η) is equal to the inverse of the test information in IRT and reflects the measurement error at a given level of the latent trait (i.e., lack of information). The expected value (i.e., mean) of the conditional variance, E[var(x|η)], is taken over the latent trait distribution. It is approximated by
| (2) |
where p(ηk) is the probability of latent trait value ηk and the sum is taken over a number of latent trait values k. The value in Equation 2 represents the average or typical measurement error in a sample.
It is important to note that reliability estimates are specific to a given sample, in that they depend on the latent trait distribution in a specific sample of individuals in addition to scale characteristics. In this regard, actual reliabilities will change depending on a particular sample and could increase or decrease depending on the extent to which a sample “matches” the scales in severity and shape. Consistent with the notion that measures ideally should match a latent trait distribution, in calculating the reliability estimates in Table 2, we assumed that each sample latent trait distribution was normally distributed, with a mean equal to the location of maximum test information and a variance equal to 1 (or 0.5 in some cases, as explained below). These reliability estimates are provided as a heuristic index of reliabilities likely to be encountered in applications of the scales delineated in Table 2 to samples that match the scales in distribution.
The substance scales illustrate the impact of sample characteristics on reliability estimates. For example, although the substance scales considered as a whole have the greatest information (see Figure 1), they had lower estimated reliabilities with an assumed variance of 1.0. This is due to the fact that, although the substance scales provide a substantial amount of measurement information, each scale measures a trait over a relatively restricted range of severity. Individuals outside of the effective measurement range of the scale will not be measured well. Consistent with this, restricting the assumed variance of the latent trait from 1 to 0.5—thereby decreasing the number of individuals outside the effective range of the scale—increased the estimated reliability of the Alcohol Problems and Use scales from .93 and .64, respectively, to .98 and .90; increased the estimated reliability of the Marijuana Problems and Use scales from .42 and .82, respectively, to .97 and .97; and increased the Drug Problems and Use scale reliabilities from .50 and .79, respectively, to .98 and .96. Alternatively, by combining the pairs of substance use and problem scales—thereby covering a greater range of the latent trait—we obtained an overall reliability for an Alcohol Behaviors scale of .94, an overall reliability for a Marijuana Behaviors scale of .88, and an overall reliability for a Drug Behaviors scale of .89. Thus, although these domains can be treated in terms of separate problem and use scales and these scales are reliable within their specific ranges, effective measurement over a wider range can be achieved by combining use and problems in a wider range scale. The preferred approach depends on whether the goal of the assessment enterprise is to tap into a narrower or broader range of the construct.
In general, the scales were reliable in our sample, as the majority had estimated reliabilities of .90 or greater. Table 3 elaborates on the reliability findings for the overall sample by reporting scale means, standard deviations, and reliabilities separately for students and prisoners in our sample. For purposes of estimating reliability separately in the student and prisoner subgroups, we used a non-parametric kernel approach, applied to the students’ and prisoners’ maximum likelihood-estimated IRT scores, to estimate the latent trait densities p(ηk)—and therefore the latent trait variances var(η). In this approach, we estimated the density at a latent trait value by determining the proportion of scores near that value, where near was defined according to the weighted distance from the value. The purpose of this approach was to determine the extent to which the scales, which were found to be reliable in the overall sample, were also reliably capturing the variation present in these specific subgroups.
Table 3.
Scale Means, Standard Deviations, and Reliabilities in Student and Prisoner Subgroups
|
M |
SD |
ρ
|
||||
|---|---|---|---|---|---|---|
| Externalizing facet | Student | Prisoner | Student | Prisoner | Student | Prisoner |
| Relational Aggression | −0.372 | 0.125 | 0.698 | 1.030 | 0.928 | 0.926 |
| Physical Aggression | −0.642 | 0.328 | 0.609 | 0.859 | 0.899 | 0.940 |
| Destructive Aggression | −0.422 | 0.121 | 0.541 | 0.825 | 0.819 | 0.870 |
| Empathy | 0.420 | −0.037 | 0.690 | 0.886 | 0.957 | 0.963 |
| Blame Externalization | −0.399 | 0.312 | 0.732 | 0.873 | 0.921 | 0.941 |
| Alienation | −0.305 | 0.293 | 0.656 | 0.692 | 0.891 | 0.900 |
| Alcohol Problems | −0.744 | 0.119 | 0.659 | 0.969 | 0.912 | 0.940 |
| Alcohol Use | 0.148 | −0.214 | 0.929 | 0.790 | 0.686 | 0.822 |
| Marijuana Problems | −0.559 | 0.329 | 0.502 | 0.767 | 0.822 | 0.912 |
| Marijuana Use | −0.430 | 0.577 | 0.698 | 0.672 | 0.921 | 0.922 |
| Drug Problems | −0.728 | 0.490 | 0.427 | 0.686 | 0.854 | 0.954 |
| Drug Use | −0.550 | 0.529 | 0.621 | 0.640 | 0.916 | 0.917 |
| Theft | −0.674 | 0.516 | 0.487 | 0.709 | 0.862 | 0.933 |
| Fraud | −0.560 | 0.474 | 0.561 | 0.829 | 0.863 | 0.916 |
| Honesty | 0.212 | −0.184 | 0.653 | 0.851 | 0.940 | 0.940 |
| Irresponsibility | −0.799 | 0.524 | 0.534 | 0.671 | 0.916 | 0.954 |
| Dependability | 0.378 | −0.269 | 0.680 | 0.853 | 0.944 | 0.953 |
| Problematic Impulsivity | −0.744 | 0.660 | 0.601 | 0.731 | 0.941 | 0.948 |
| Planful Control | 0.379 | −0.355 | 0.714 | 0.909 | 0.915 | 0.923 |
| Impatient Urgency | −0.403 | 0.391 | 0.700 | 0.933 | 0.925 | 0.909 |
| Rebelliousness | −0.492 | 0.414 | 0.671 | 0.834 | 0.939 | 0.950 |
| Boredom Proneness | −0.326 | 0.319 | 0.721 | 0.981 | 0.942 | 0.926 |
| Excitement Seeking | −0.244 | 0.160 | 0.765 | 1.050 | 0.943 | 0.934 |
Note. Subscales were scored via maximum likelihood item response theory scoring, as described in the text, such that they have a mean of zero and a standard deviation of one in the overall sample.
Generally speaking, students showed lower average externalizing tendencies than prisoners, but prisoners showed somewhat greater standard deviations on most scales. Students and prisoners showed similar scale reliabilities. These descriptive findings support our strategy of combining individuals from both subgroups in our endeavor to sample a broad range of externalizing tendencies, as both subgroups contain variability that is also coherent (reliable), but in somewhat different ranges.
Scale Structural Modeling
Following the development of scales to measure externalizing facets, the scales themselves were structurally modeled to identify superordinate externalizing factors and subfactors. Structural analyses of the externalizing scales were conducted in two phases, an exploratory phase followed by a confirmatory phase. In the first exploratory phase, cluster analyses and EFAs of the subscales were conducted to identify models of interest. In the second confirmatory phase, confirmatory factor analyses (CFAs) were conducted to identify a best fitting model. All structural analyses were conducted on maximum likelihood estimates of subscale scores (calculated via MULTILOG).
Exploratory Structural Modeling: Analytic Approach
Hierarchical cluster analyses were conducted with the angular distances among the scales, on the basis of Pearson correlations, via Ward’s (1963) criterion for combining clusters. In addition to hierarchical cluster analyses, maximum likelihood EFAs with varimax and promax rotation were conducted via Mplus (Muthén & Muthén, 1998–2004) to explore subscale factor structure. Models comprising between 1 and 12 factors were fitted. The fit of these exploratory factor models was examined with scree plot and other conventional fit criteria (e.g., root-mean-square residual).
Exploratory Structural Modeling: Results
Results of the clustering analysis are presented in the dendrogram (tree diagram) displayed in Figure 2. The tree in Figure 2 shows how the scales merge empirically into clusters representing more specific (toward the bottom of the tree) to more general (toward the top of the tree) groupings of correlated subscales within the overarching externalizing spectrum. At a more superordinate level, the results of the cluster analysis suggest a bifurcation of the scales into two superordinate clusters: one superordinate cluster comprising aggression, impatience, and alienation content, and another superordinate cluster comprising substance use, theft, and impulsivity content. These two superordinate clusters roughly correspond to a distinction between more aggressive and more substance-related content, respectively.
Figure 2.
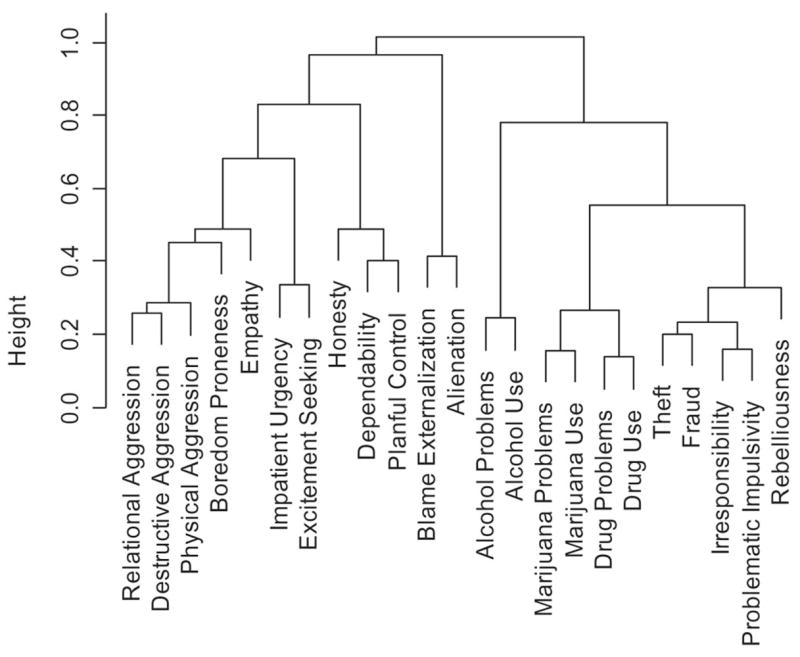
Dendrogram representing hierarchical clustering of externalizing scales. Scales were clustered via methods described in the text. Branches of the dendrogram merge at a height that is inversely proportional to the degree of correlation between the scales in each branch. Branches formed at the bottom of the dendrogram thus represent clusters of more highly correlated scales; branches formed at the top of the dendrogram represent clusters of less highly correlated scales.
EFAs also supported the bifurcation of the broad externalizing factor into two correlated subfactors comprising aggressive and substance-related content. Scree plots indicated two prominent factors accounting for covariation among subscales, and Zwick and Velicer’s (1986) minimum average partial criterion also indicated two factors. Promax rotation of the two-factor EFA model loadings indicated that one factor comprised prominent loadings on aggression and impatience content; the other factor comprised prominent loadings on substance use and theft content. Other rotations (oblimin, quartimin, simplimax, oblique infomax, and oblique Bentler’s [1977], simplicity criterion) also produced the same pattern matrix, in the sense of producing the same pattern of highest loadings on each of the variables in the analysis as was produced by promax. The promax solution also indicated that these two factors were strongly correlated (.66). Although parallel analysis suggested a three-factor solution, factor solutions containing more factors than two did not improve fit substantially (i.e., for the one-, two-, three-, and four-factor solutions, root-mean-square residuals were .084, .056, .047, and .041, respectively). Furthermore, factor solutions containing more than two factors were not as consistent with the cluster analytic results. Further details regarding results of the EFAs are available on request.
Confirmatory Structural Modeling: Analytic Approach
Semiparametric maximum likelihood (SPML) estimation was used for CFAs rather than traditional parametric maximum likelihood methods. SPML estimation is a form of maximum likelihood estimation in which parameters of the latent distribution are estimated jointly with those of the structural model. SPML is an appealing approach to CFA in the current context because it is less restrictive than traditional maximum likelihood estimation of CFA models, which assume that the observed variables have a multivariate normal distribution. When incorrect, these assumptions may lead to inaccurate conclusions in model comparisons.2 Because this method is relatively novel, we explain the method and pertinent technical details so that interested readers can understand exactly how we approached our analyses. Nevertheless, results from the method can be interpreted similarly to results from more traditional approaches to CFA, such that readers who are interested in the results but not in the technical details of parameter estimation can move ahead to details of the models and results.
SPML CFA
SPML factor models are nonparametric in the latent distribution but parametric in the structural model. In SPML factor analysis, the observed continuous responses are assumed to be independently and normally distributed, conditional on the latent factors. That is, the factor model is assumed to account for scale scores observed in the sample, with the remaining variation in those scores accounted for by random errors that are unique to each scale and normally distributed.
Assuming that there are k levels of a latent factor, the probability of a response vector (a specific combination of scale scores) is given by
| (3) |
where p(x|ηk) is the probability of an individual having observed response vector x, conditional on having the latent trait vector ηk, and Φ(μk, Θ) indicates the probability distribution function for a multivariate normal distribution that has mean μk and covariance matrix Θ. Whereas the mean observed responses μk depend on the level of the latent factor vector, the covariance matrix Θ does not. Θ is assumed to have residual variances on the diagonal and zeros on the off-diagonal; Θ can therefore be interpreted as a residual variance–covariance matrix containing stochastic errors of estimation that are unaccounted for by the latent factors.
The structural component of the model is given by
| (4) |
where μk is again the mean vector of the observed responses for individuals with latent factor value ηk. Λ can be interpreted as a loading matrix, and ν can be interpreted as a vector of intercepts, similar to standard confirmatory factor models that model mean structures in addition to covariance structures.
In addition to the structural parameters of the model, given in Equations 3 and 4, the probability of each latent factor value ηk is estimated. The latent distribution is therefore estimated empirically and is not restricted to be multivariate normal. In this regard, SMPL estimation can be thought of as a form of structural equation mixture modeling in which structural parameters are constrained to be equal across the k mixture populations and the mixture populations are constrained to be ordered, each having a corresponding estimated latent factor value ηk. By increasing the number of latent factor values k, one can obtain a nonparametric approximation to a continuous latent distribution.3
SPML CFAs were conducted via the software package Latent GOLD, with default identifying constraints (Vermunt & Magidson, 2000). In all CFAs, the number of latent factor values was set equal to 9 (k = 9); this is similar to related defaults in parametric IRT software packages. By default, Latent GOLD constrains the values of the latent factor to equally spaced values along the interval (0,1). To aid in interpretation, parameter estimates were restandardized to reflect a latent factor distribution with a mean of zero and a standard deviation of one (i.e., in a z score metric). In the estimation of each model, the maximum likelihood solution from 10 different random starting values was used, to help minimize the possibility of encountering local minima in parameter estimation.
Confirmatory factor models
Given that the cluster analysis and EFAs both suggested an overarching externalizing factor as well as the possibility of aggression and substance-related subfactors, a one-factor confirmatory model and two different two-subfactor confirmatory models were fitted. That is, three distinct confirmatory models were fitted: a one-factor model, a higher order two-subfactor model, and a hierarchical two-subfactor model.
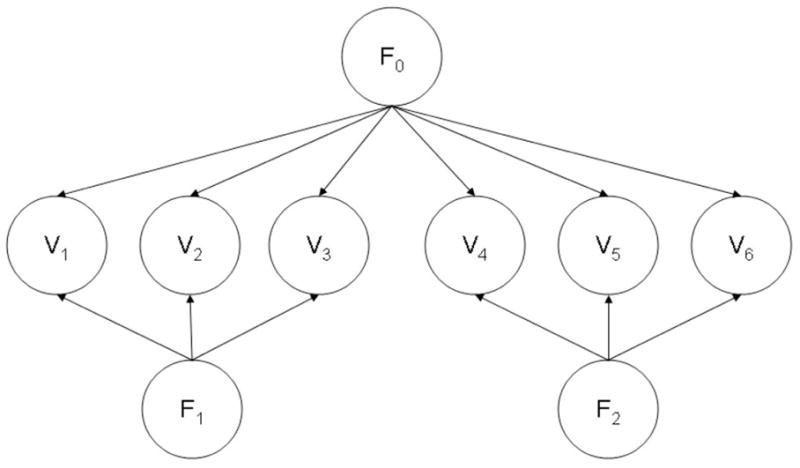
Although related, the higher order and hierarchical factor models represent two empirically and conceptually distinct accounts of the relationship between factors in a multilevel factor model (Yung, Thissen, & McLeod, 1999). A sample higher order model is portrayed in Figure 3, and a sample hierarchical model is portrayed in Figure 4; both involve six observed measures (V1 to V6) and three factors (F0, F1, and F2). As portrayed in Figure 3, the higher order model conceptualizes a domain in terms of a general factor (F0) that bifurcates into two distinct factors (F1 and F2), which, in turn, are further subdivided into specific scales (V1 to V6). In this model, correlations among the scales (V1 to V6) are accounted for by the two higher order subfactors (F1 and F2), and the correlation between those subfactors is accounted for by the general, overarching factor (F0). If this model provides superior fit to the data, it indicates that the domain being modeled consists of a single broad, coherent construct that can be broken down into increasingly specific instantiations.
Figure 3.
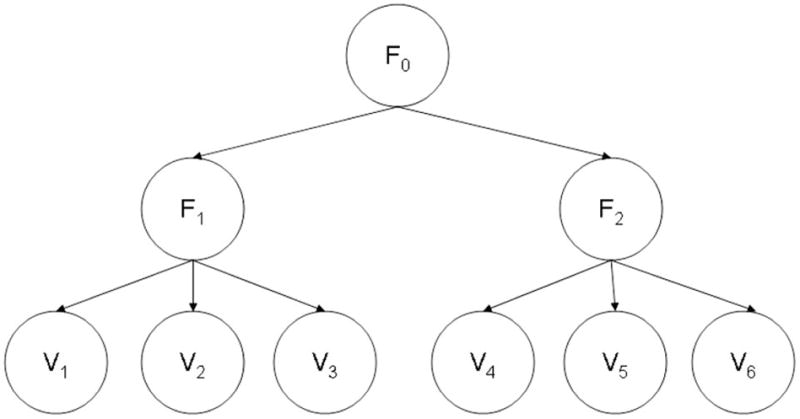
Example higher order factor model. V1 through V6 are the observed measures, and F0 through F2 are the factors.
Figure 4.
Example hierarchical factor model. V1 through V6 are the observed measures, and F0 through F2 are the factors.
The hierarchical model, portrayed in Figure 4 also posits a broad general factor that saturates each specific scale (F0). However, in contrast to the higher order model, in the hierarchical model, this factor does not bifurcate into correlated subfactors. Rather, specific measures are saturated with both the general factor (F0) and other, specific factors (F1 and F2), and these factors are mutually uncorrelated. If this model provides a superior fit to the data, it indicates that the domain being modeled is saturated by a single broad, coherent construct but that specific scales in the domain (V1 to V6) are also saturated by other, specific factors (F1 and F2) that vary independently of the general factor. Thus, in this model, each scale is a measure of the general factor, but some scales also measure other, more specific factors that are not correlated with the general factor.
Models were compared via three information-theoretic criteria: Akaike’s information criterion (AIC), the Bayesian information criterion (BIC), and Draper’s information criterion (DIC; see, e.g., Markon & Krueger, 2004, for detailed descriptions of these fit indexes). AIC and BIC were used because of their extensive use in the statistical and psychological literature. DIC is a relatively newer criterion that is similar to BIC but replaces the sample size N in the formula for BIC by N/2π. This correction of the sample size by 2π appears in theoretical derivations of BIC and has been shown to improve performance of the criterion in many cases (Draper, 1995; Markon & Krueger, 2004). Smaller values of AIC, BIC, and DIC correspond to better fitting models.
Confirmatory Structural Modeling: Results
In the one-factor model, a single externalizing factor was modeled as having loadings on all subscales. The two-subfactor higher order model was parameterized as a correlated two-factor model.4 In this higher order or correlated two-subfactor model, loading patterns were specified according to the maximum loadings of subscales on the two factors in a two-factor EFA model with promax rotation. That is, each subscale was assumed to have a single loading on one of the two subfactors, and the maximum loadings from a two-factor EFA were used to specify the pattern of these loadings. The hierarchical two-factor model comprised three uncorrelated factors: a single externalizing factor with loadings on all subscales, and two additional factors with loadings on specific subscales. Loading patterns for these factors were specified according to the maximum loadings of subscales on the two factors in a two-factor EFA model with varimax rotation.
The total number of parameters in each model was equal to the total number of parameters used to model the latent distribution plus the total number of parameters used to model the relationship between latent and observed variables. In the one-factor model, 8 parameters were used to model the latent distribution (the density at 9 latent values was estimated, as described above, but the sum of the 9 parameters must sum to 1, leaving 8 free parameters), and 69 parameters were used to model the relationship between latent and observed variables (23 loadings, 23 residual variances, and 23 intercepts), for a total of 77 parameters. In the higher order model, similarly, there were 17 distributional parameters (8 parameters for each factor, plus 1 parameter for the correlation between factors) and 69 structural parameters, for a total of 86 parameters. In the hierarchical model, there were 24 distributional parameters (8 parameters for each of the factors) and 92 structural parameters (46 loadings, 23 residual variances, and 23 intercepts), for a total of 116 parameters.
Model fit statistics for the one-factor, higher order two-subfactor, and hierarchical two-subfactor models are given in Table 4. As shown in the table, according to all criteria, the best fitting model was the hierarchical two-subfactor model, as AIC, BIC, and DIC were all lowest for this model. Standardized model parameter estimates for this model are presented in Table 5. Note that in Table 5, the general externalizing factor loadings are given in the column labeled λ1, the two subordinate factor loadings are in the columns labeled λ2 and λ3, and residual variances are in the column labeled theta. Loadings listed as 0.000 were fixed at that value and not estimated. Thus, the subordinate factors loaded only on specific scales, as portrayed heuristically in Figure 4. These standardized parameter estimates can be interpreted in much the same way as values from traditional CFA models (e.g., models estimated via standard maximum likelihood estimation). That is, the sum of the squared loadings and the residual variance equals the total variance in each scale, which was standardized to 1.0; for each row in Table 5, λ12 + λ22 + λ32 + θ= 1.0, the total variance of each scale (with tolerance for rounding error).
Table 4.
Confirmatory Factor Model Fit Statistics
| Model | k | ln(L) | AIC | BIC | DIC |
|---|---|---|---|---|---|
| One general factor | 77 | −38,582.69 | 77,319.38 | 77,741.98 | 77,600.47 |
| Higher order two-subfactor | 86 | −37,288.33 | 74,748.66 | 75,220.65 | 75,062.59 |
| Hierarchical two-subfactor | 116 | −35,871.88 | 71,975.75 | 72,612.40 | 72,399.20 |
Note. Lower fit criterion values indicate better fit. ln(L) = natural log likelihood; AIC = Akaike’s information criterion; BIC = Bayesian information criterion; DIC = Draper’s information criterion.
Table 5.
Standardized Hierarchical Two-Subfactor Model Parameter Estimates
| Externalizing facet | λ1 | λ2 | λ3 | Θ |
|---|---|---|---|---|
| Relational Aggression | 0.619 | 0.676 | 0.000 | 0.198 |
| Physical Aggression | 0.740 | 0.412 | 0.000 | 0.311 |
| Destructive Aggression | 0.654 | 0.551 | 0.000 | 0.301 |
| Empathy | −0.482 | −0.554 | 0.000 | 0.485 |
| Blame Externalization | 0.508 | 0.238 | 0.000 | 0.697 |
| Alienation | 0.487 | 0.012 | 0.000 | 0.763 |
| Alcohol Problems | 0.690 | 0.000 | 0.237 | 0.478 |
| Alcohol Use | 0.449 | 0.000 | 0.357 | 0.681 |
| Marijuana Problems | 0.751 | 0.000 | 0.476 | 0.232 |
| Marijuana Use | 0.727 | 0.000 | 0.613 | 0.125 |
| Drug Problems | 0.870 | 0.000 | 0.303 | 0.168 |
| Drug Use | 0.790 | 0.000 | 0.490 | 0.160 |
| Theft | 0.872 | 0.000 | 0.129 | 0.230 |
| Fraud | 0.870 | 0.264 | 0.000 | 0.195 |
| Honesty | −0.541 | −0.305 | 0.000 | 0.629 |
| Irresponsibility | 0.925 | 0.000 | −0.011 | 0.143 |
| Dependability | −0.661 | −0.152 | 0.000 | 0.549 |
| Problematic Impulsivity | 0.913 | 0.000 | −0.036 | 0.164 |
| Planful Control | −0.661 | −0.074 | 0.000 | 0.562 |
| Impatient Urgency | 0.726 | 0.215 | 0.000 | 0.441 |
| Rebelliousness | 0.794 | 0.305 | 0.000 | 0.300 |
| Boredom Proneness | 0.593 | 0.283 | 0.000 | 0.584 |
| Excitement Seeking | 0.555 | 0.457 | 0.000 | 0.506 |
Note. General externalizing factor loadings are given in the column labeled λ1, the two subordinate factor loadings are in the columns labeled λ2 and λ3, and residual variances are in the column labeled Θ. Loadings listed as 0.000 were fixed at that value and not estimated.
The largest loadings for the general externalizing factor were on the Irresponsibility and Problematic Impulsivity subscales. The largest loadings on the first subfactor were on the Relational Aggression, Destructive Aggression, and Empathy subscales. Finally, the largest loadings on the second subfactor were on the Marijuana Use, Marijuana Problems, and Drug Use subscales.
The residual variance estimates in Table 5 are also notable. That is, the subscales ranged substantially in the degree to which they contained residual, unique variance, as opposed to variation delineating factors (i.e., variation in common with other subscales). The Marijuana Use, Irresponsibility, Drug Use, and Problematic Impulsivity scales, for example, had the smallest residual variance estimates (i.e., these scales demonstrated the greatest amount of factor-relevant, or shared, variance among the subscales). In contrast, the Alienation, Blame Externalization, Alcohol Use, and Honesty scales demonstrated substantial residual variance after the general externalizing factor and two subordinate factors were accounted for.
The pattern of estimates in Table 5 also provides insight into why the hierarchical model fitted better than the higher order factor model. Hierarchical models are appropriate for factor structures in which certain measures have loadings from superordinate factors but not subordinate factors—that is, there are measures that directly assess superordinate factors without assessing independent aspects of subordinate factors. Higher order models, in contrast, assume that there are no such measures—that all measures assess subordinate factors in addition to superordinate factors. Along these lines, in Table 5, it is clear that certain subscales assess the general externalizing factor well, without assessing the independent subfactors. In particular, Irresponsibility and Problematic Impulsivity are subscales that effectively measure general externalizing directly and do not also measure the aggressive or substance-related latent variables.
Discussion
Substance use problems, antisocial behavior problems, and disinhibitory personality traits commonly co-occur. The goal of the current research is to develop a unifying model of these domains—a comprehensive, quantitative model of the adult externalizing spectrum. Working with an iterative research design in which diverse participants provided extensive information about their externalizing behaviors and tendencies, we developed a quantitative model through extensive statistical analysis of these data. The resulting model indicates that the externalizing spectrum is broad but also coherent, encompassing a diverse array of individual differences within a variegated hierarchical structure. Before discussing theoretical and applied implications of this model, we first address some limitations of the research.
Limitations
In our consideration of the limitations of the current research, our sampling strategy deserves comment. For a project designed to bootstrap an empirically based model encompassing the full range of the externalizing spectrum, we felt that recruiting a diverse sample encompassing both male and female prisoners and students was a useful strategy because the resulting model should be applicable to a wide range of people. Moreover, in estimation of the parameters of psychometric (e.g., IRT) models, the critical consideration is having a sufficient range of responses to various items, as opposed to ensuring sample representativeness per se (e.g., of the overall community-dwelling population; Embretson & Reise, 2000). In addition, the SPML factor models we used were selected because they do not make stringent assumptions. Nevertheless, it is important in future research to evaluate the applicability of the ESM delineated here to other samples from other populations. Existing research showing that psychometric models tend to generalize well across diverse samples (O’Connor, 2002) suggests that it is reasonable to expect that the model will be broadly applicable, but this remains an open question until it can be addressed directly through the collection of additional data. Related to this, statistical modeling involves numerous choices, and the universe of tractable models is ever increasing. We believe that our approach has resulted in a reasonable representation of our data, but we also look forward to other extensions and elaborations of the work we present here.
The model developed in this article is also limited to the self-report domain. Given the need for a great deal of detailed information on numerous persons as a starting point for developing a comprehensive, empirically based model of the externalizing spectrum, this seemed a logical starting point for the current research. It is important to note, however, that the modeling techniques described herein are not limited to the self-report modality. In addition, although self- and informant reports of adult psychopathology show reasonable agreement (and somewhat better agreement for more “objective” elements of the externalizing spectrum, e.g., substance use), agreement is far from perfect (Achenbach, Krukowski, Dumenci, & Ivanova, 2005). Obtaining data from multiple informants and modalities is therefore desirable. Further articulation of the ESM would thus benefit from incorporating data from different modalities and informants, and this process would logically promote refinement of the model itself. By way of example, the model could be interpreted as suggesting some specific ideas about potential biological underpinnings of externalizing propensities and ways to conceptualize these underpinnings. Nevertheless, until data from other modalities are modeled directly, the model is a model of people’s self-reports of their own externalizing tendencies.
Along these same lines, although we consulted extensive literature in developing the content of our model, additional content may also belong in the externalizing spectrum, and exploring potential additional content is an important goal for future research. For example, pathological gambling shares significant genetic variance with alcohol dependence (Slutske et al., 2000), which suggests that future research could be pursued on the extent to which gambling phenomena may be conceptualized as elements within the externalizing spectrum. Similarly, future research should focus on elaborating the current model in the context of other putatively distinct spectrums of personality and psychopathology, such as the internalizing spectrum (Krueger & Markon, 2006; Watson, 2005) or the psychosis spectrum (Sbrana et al., 2005). The inclusion of indicators of these other psychopathology spectrums, along with the indicators of the externalizing spectrum developed here, will be very helpful in working toward a comprehensive, empirically based model of psychopathology. For example, the inclusion of indicators from other spectrums could enhance our understanding of the “specificity” (Sher & Trull, 1996) of various externalizing constructs, potentially revealing how these constructs also delineate spectrums beyond externalizing (e.g., how specific alcohol-related phenomena might be not only elements in the externalizing spectrum but also meaningfully related to the internalizing and psychotic spectrums).
Finally, our model development endeavor was limited to cross-sectional data covering a wide adult age range. As such, we do not have the longitudinal data needed to characterize developmental patterns within the externalizing spectrum. Nevertheless, the current project resulted in instrumentation that seems well suited to developmental inquiry. To pick a specific example, alcohol problems show a general developmental trajectory, but some people do not fit the general trajectory, and some of these unusual developmental patterns are of particular clinical importance (e.g., alcohol problems that persist throughout adult life; Sher, Grekin, & Williams, 2005). Determining how the externalizing facets jointly define developmental patterns should help in further elucidating such phenomena. For example, persistent alcohol problems might exemplify a developmental trajectory also characterized by elevation on other externalizing facets, and measurement of the complete set of externalizing facets in multivariate longitudinal research could help evaluate such possibilities.
Similarly, the meaning of externalizing behaviors likely changes across demographic groups, underlining the need for future research to examine the extent to which the model described here also generalizes to more specific demographic contexts. For example, because alcohol problems decline with increasing age (Sher et al., 2005), such problems may signal greater deviance in older age groups. As such, the association between alcohol problems and the general externalizing factor, and therefore the parameters of the model described here, may be moderated by age. Similar moderating effects may also exist for other demographic distinctions, and these possibilities should be explored in future research.
Other modeling approaches could also be pursued in future longitudinal research and compared with our cross-sectional model. Longitudinal data, for example, could be used to test causality models in a way not possible with cross-sectional data. A particularly interesting question concerns the extent to which externalizing phenomena result from latent externalizing factors, as opposed to through other manifest externalizing constructs. For example, substance use and substance problems may both develop from latent factors. It may also be the case, however, that substance use at a first time point predicts substance problems directly at a second time point; a joint explanation is that some combination of both latent externalizing factors and manifest substance use leads to substance problems. We believe that these questions are best addressed in the context of longitudinal study designs, where, together with novel developments in structural modeling (e.g., tetrad models; Bollen & Ting, 1993), such issues can be compellingly explored. Related to this, some constructs in our model may be more primary or endophenotypic foundations of the externalizing spectrum that may be less likely to fluctuate over time, whereas others may be more paroxysmal, acute manifestations of externalizing propensities. Researchers can also explore this possibility by collecting fine-grained longitudinal data on the externalizing facets and modeling variability in those facets over time.
A Bottom-Up Approach to Modeling the Externalizing Spectrum
Bearing these limitations in mind, the current research advances our understanding of a number of phenomena and suggests directions for research on the etiology and correlates of substance use problems, antisocial behavior problems, and disinhibitory personality. Our current understanding of the externalizing spectrum in adults has been derived primarily from research relying on the categories of mental disorder described in the DSM. This research has shown that the externalizing spectrum is etiologically coherent, in the sense that genetic contributions to externalizing disorders are mostly in common (Hicks et al., 2004; Kendler et al., 2003; Krueger et al., 2002; Young et al., 2000), and the spectrum is undergirded by a continuous, normally distributed dimension of liability (Markon & Krueger, 2005; Krueger, Markon, et al., 2005).
This understanding would not have been possible without the definitions of disorders in the DSM. The DSM–III (American Psychiatric Association, 1980) and its offspring (DSM–III–R, DSM–IV, DSM–IV–TR) have been fundamentally important in psychopathology research because they have provided reliable and consensual definitions of specific mental disorders. Nevertheless, these definitions have been limited to a specific type: categories defined by requisite combinations of symptoms. The process generating these categories has been characterized as top-down in the sense that a model is specified in advance and specific symptoms and algorithms that translate symptoms into diagnoses are inserted in this model (Achenbach & McConaughy, 1997; Helzer, Kraemer, & Krueger, 2006).
The model presented in the current research was developed via a more bottom-up process. An extensive assessment battery was refined over the course of three waves of data collection, and we bootstrapped a formal quantitative model from these data. The model we generated is thus distinctive from the model of substance abuse–dependence and antisocial personality described in the DSM. Statistical analysis of extensive data played a direct and primary role in the generation of the ESM, as opposed to playing a role in informing the choice of symptoms and diagnostic algorithms, under the constraint that the resulting construct had to be categorical and polythetic. The ESM may thereby offer a useful alternative perspective on the conceptualization of psychopathology.
Advantages of the ESM
Comorbidity
The ESM provides an empirically based account of the comorbidity of problems within the externalizing spectrum. Comorbidity among mental disorders has been an impediment to progress because researchers are forced to make a number of confusing choices regarding fundamental issues in research design. For example, in work on the etiology of alcohol use and problems, should persons with antisocial features be included or excluded?
The ESM resolves these problems by reconceptualizing the targets for empirical inquiry in a manner derived directly from data on the empirical organization of externalizing phenotypes. Consider the ESM as portrayed in Table 5. Each row represents a specific unitary phenotype influenced by the general externalizing factor (λ1), and each column represents an underlying construct that influences variation in the rows (λ1, λ2, λ3, θ). Traditionally, psychopathology research has focused on specific row-level constructs, or complex combinations of the row constructs, as opposed to the columns or reliable residual variation in specific rows. Antisocial personality disorder, for example, is defined in the DSM–IV–TR as involving seven criteria that relate to diverse facets of the externalizing spectrum listed in Table 5 in complex combinatorial ways. For example, Criterion 3, impulsivity or failure to plan ahead, could be interpreted as combining two separable facets (problematic impulsivity and irresponsibility) in one criterion.
The ESM resolves the problem of comorbidity versus specificity among the row constructs (externalizing facets) by delineating an empirically based, hierarchical model of these facets; it points research toward the columns and toward reliable residual variation in the rows in Table 5. Alcohol use and problems serve as a good example of this general point. In the ESM, these phenotypes, although internally coherent, are nevertheless influenced by multiple underlying factors that account for their tendency to be comorbid. Alcohol use and problems are influenced by the general externalizing factor (λ1), the factor that accounts for shared risk among multiple forms of substance use and problems (λ3), as well as factors unique to alcohol (θ).5 Studying alcohol problems without reference to the ESM presents a complex problem because the sources of variation in alcohol problems are unarticulated. According to the findings of the current research (the ESM), a person could have extensive alcohol problems because of general risk for externalizing problems that also manifests in an impulsive and irresponsible personality style (Krueger et al., 2002), a risk for problems with multiple substances (Wise, 1996), a specific risk for problems with alcohol (Wall, Carr, & Ehlers, 2003), or, in many cases, a combination of these factors (Zucker, Chermack, & Curran, 2000).
The ESM pulls these factors apart and delineates specific strategies for studying externalizing facets in a way that resolves the traditional conceptual problems posed by the comorbidity phenomenon. To study the general externalizing factor, one could seek highly externalizing cases—persons with high scores on λ1. Similarly, if one were interested in the physiology of polysubstance use and problems, one could study persons with high scores on λ3. Finally, if one were interested in the physiology of alcohol problems in particular, one could study persons with high scores on the reliable variance in the alcohol problems and use scales (θ) once λ1 and λ3 are controlled for. Note also that the ESM indicates that these domains vary independently of each other (see Figure 4), although all can present in the form of alcohol problems. Thus, an intriguing research strategy would be to study people with high scores on either λ1, λ3, or θ but low scores on the other two dimensions (e.g., high scores on λ1 along with low scores on λ3 and θ). All of these persons with high scores on only one of these dimensions would be predicted to have high levels of alcohol problems, but for different reasons. This relates to the idea of “phenocopies,” or multiple pathways to the same clinical outcome (e.g., Moffitt, 1993). This is a compelling idea (cf. the idea of multiple pathways to alcoholism; Cloninger, 1987), but it is difficult to pursue in research framed by polythetic categories of mental disorder because these categories are not accompanied by a model and associated research strategy for disambiguating the multiple latent sources of variation underlying manifest mental disorder. The ESM provides this kind of model and suggests corresponding research strategies. It may therefore prove useful in framing future research on complex patterns of co-occurrence within the externalizing spectrum as well as research focused on specific etiologic factors that differentiate specific externalizing facets.
Dimensions
Extensive discussion focuses on the extent to which categorical and dimensional constructs provide more optimal ways of conceptualizing psychopathology (Helzer et al., 2006; Kraemer, Noda, & O’Hara, 2004; Krueger, Watson, & Barlow, 2005). For much basic research on psychopathology, however, dimensions have some straightforward advantages. For example, in the absence of compelling data to suggest a categorical distinction in nature, dimensions provide enhanced statistical power relative to categories (Cohen, 1983). Nevertheless, DSM-derived categories remain influential constructs because they provide uniform definitions that can be applied by multiple investigators.
This uniformity, however, comes at the cost of being able to realize some of the advantages of dimensional phenotypes for psychopathology research. As Clark, Watson, and Reynolds (1995) noted over a decade ago, the potential utility of dimensions in psychopathology research is clear, but research is needed to articulate specific and tractable dimensional alternatives to categories of psychopathology in specific areas (see also Widiger & Samuel, 2005). Along these lines, the ESM provides specific empirically derived dimensions that may prove to be useful alternatives to categories as targets for psychopathology research.
First, the externalizing facet scales represent dimensions developed to be as phenotypically unidimensional as possible; they represent highly specific domains. In contrast, the polythetic nature of mental disorder categories may, in some cases, lead to phenotypic heterogeneity within putatively unitary categories. That is, some categories may represent mixtures of distinguishable phenotypic domains that may, in some cases, also correspond with underlying etiological heterogeneity. Consider DSM-defined conduct disorder as an example. Although conduct disorder is defined as a single category of mental disorder, its criteria delineate two dimensions with distinct etiologies (Tackett, Krueger, Sawyer, & Graetz, 2003). The first dimension reflects aggressive behavior and is influenced by genetic and person-specific environments, whereas the second dimension reflects delinquent and rule-breaking behavior and, in comparison with aggressive behavior, is relatively more influenced by shared family-level environment factors (Tackett, Krueger, Iacono, & McGue, 2005). This phenotypic and etiologic distinction within the criteria for conduct disorder may reflect the distinction in the externalizing spectrum between the general externalizing factor (λ1) and the aggressive subfactor (λ2), a possibility that could be useful in framing future research and conceptions of conduct disorder.
Second, the externalizing facet scales represent dimensions developed to be as wide ranging as possible. The scales were developed with data from a diverse group of participants and were designed to provide information across a wide range of individual differences (see Figure 1). In contrast, criteria from specific diagnostic systems may provide information within more specific ranges of underlying dimensions. For example, Krueger et al. (2004) studied how the criteria from specific diagnostic systems map onto a broad dimension encompassing a diverse array of alcohol problems. They found that many criteria sets (e.g., DSM-defined alcohol dependence, Feighner et al., 1972, and RDC [Research Diagnostic Criteria] for alcoholism) index a relatively narrow band within the broad alcohol problems continuum, centered around two standard deviations above the mean level of alcohol problems in men from the general population. Other research on alcohol problems has come to a similar conclusion, in that problems studied to date cluster in a relatively narrow band of a broader underlying alcohol problems continuum (Kahler, Strong, Read, Palfai, & Wood, 2004; Langenbucher et al., 2004; Saha, Chou, & Grant, 2006). This finding is in some ways not surprising; the purpose of a set of clinically relevant diagnostic criteria is to distinguish putative “cases” from “noncases.” Inasmuch as those criteria map onto a broad underlying dimension, it seems likely that their informativeness centers around relatively high levels of that dimension. For example, consider the information functions for the substance problems scales in Figure 1, as opposed to the functions for the substance use scales, which tap a lower range of their respective dimensions. A broader range of reliable assessment could be achieved by combining use and problems, something also suggested by our reliability analysis, in which the reliability of these scales was enhanced by concatenating use and problems.
The possibility of a restricted information range for diagnostic criteria points to a potential limitation of relying solely on such criteria as markers of target constructs for psychopathology research. If such criteria provide information only about a limited range of an underlying construct, they likely provide reduced power to detect correlates of that construct, because much of the total range of the construct is not well measured. In contrast, the ESM facet scales were designed to cover as wide a range as feasible and may therefore provide greater informativeness and power for investigations designed to detect correlates of externalizing phenomena. Along these same lines, the factors underlying the ESM facet scales should also provide enhanced informativeness and power relative to diagnostic criteria sets, inasmuch as they are delineated via the ESM facet scales themselves.
In considering these advantages of dimensions, it is also important to note that the dimensional nature of the ESM facets and factors does not preclude setting cutoffs on these constructs that may be helpful in clinical decision making. Much of the debate regarding categories and dimensions in the conceptualization of psychopathology centers on the putative advantages of diagnostic categories in clinical case conceptualization. Categories are seen as facilitating clinical decisions because knowing about the presence versus absence of a specific diagnosis indicates a specific intervention (e.g., First, 2005). These putative advantages of diagnostic categories, however, can be readily translated into the dimensional ESM framework. Cutoff scores can be placed on both the ESM facets and factors to facilitate categorical clinical decisions. For example, multiple cutoffs could be generated for the drug, marijuana, and alcohol use and problem facets to inform decisions regarding various available interventions (e.g., outpatient detoxification, partial hospitalization, inpatient detoxification). Setting these cutoffs is a matter of using data on the social and occupational correlates of the ESM constructs as well as clinical judgment to inform professional understanding of the costs and benefits of different forms of intervention. This process would eventuate in recommendations regarding interventions appropriate for different levels of externalizing phenomena. Dimensional clinical constructs and categorical clinical decision-making processes can and should be integrated in this manner.
Transcendence of constructs and literatures
In formulating target domains in the development of the ESM, we made no a priori distinction between constructs derived from putatively distinct literatures. For example, many of the ESM facets would be considered elements of Axis II (personality) disorders, whereas other facets would be considered elements of Axis I (clinical) disorders. Yet the ESM shows how these elements belong in the same spectrum, inasmuch as all are indicators of the general externalizing factor (λ1). This finding dovetails well with other evidence suggesting that various putative distinctions between Axis I and Axis II disorders (i.e., in terms of stability, age of onset, treatment response, insight, comorbidity and symptom specificity, or etiology) are not well supported by the existing literature (Krueger, 2005). The findings suggest that thinking of psychopathology as falling neatly into specific groups or categories (e.g., personality pathology vs. other pathology) is not likely to be accurate or productive.
Along these same lines, some of the ESM facets might be thought of as constructs situated more in the literature on “normal” personality, whereas other facets might be thought of as constructs situated more in the literature on “abnormality,” or psychopathology. Within psychology, the domains of personality and psychopathology, and the parallel domains of normality and abnormality, have been historically separate. The current findings suggest that, akin to the problematic Axis I–Axis II distinction, this historical separation is also not accurate with regard to externalizing phenomena and therefore is not likely to be helpful or productive (Krueger & Tackett, 2006).
We are not the first investigators to recognize that these various literatures would profit from cross-fertilization (cf. Watson, Clark, & Harkness, 1994). Nevertheless, the ESM may be useful in facilitating the process of bringing these literatures together by providing an explicit empirical model of how and where these literatures intersect. Consider the cluster analytic results in Figure 2 along these lines. Figure 2 shows that the degree of distinction between specific externalizing constructs can be conceptualized as a continuous phenomenon. At the level of very fine-grained similarities and distinctions among constructs (low on the tree), some phenomena emerged in our data that fitted with what might be expected on a rational basis. For example, marijuana and drug use and problems tended to cluster together closely, supporting the idea of substance use and problems as a classificatory rubric. Yet some other similarities and distinctions portrayed in Figure 2 run counter to what might be expected on a purely rational basis. For example, from a rational perspective, one might expect substance use and problems to cluster more tightly with alcohol use and problems than with personality-related constructs (e.g., in the DSM–IV–TR, diverse substance problems are listed in a single chapter, on a distinct axis from personality constructs). However, substance use and problems tended to cluster more tightly with personality-related markers of the general externalizing factor (e.g., problematic impulsivity) as opposed to alcohol use and problems in Figure 2. In the more formal SPML CFA portrayed in Table 5, this phenomenon shows up as drug and marijuana use and problems being saturated with general externalizing variance (strong loadings on λ1), with little variation left over, whereas alcohol use and problems contain relatively more unique, residual variation. The implication is that illicit substance use and problems reflect more of the general deviance tapped into by the general externalizing factor (as well as liability for substance problems in general, λ3), whereas licit use and problems (alcohol) are comparatively more influenced by factors unique to alcohol (cf. McGue, Slutske, & Iacono, 1999).
In sum, the structure of the externalizing domain is an empirical matter, and some aspects of that structure cannot be discerned on a purely rational basis. In spite of the way the literature in psychology and psychiatry tends to be organized, there was little evidence of an empirical organizational structure based on personality constructs versus psychopathology constructs, substance use constructs versus psychopathology constructs, or Axis I versus Axis II constructs. Such rational organizational schemes are pervasive in their impact, affecting the foci of scientific societies, journals, and institutes and thereby balkanizing research on these empirically interrelated constructs. Our findings suggest that these rational distinctions need to be reconsidered within the externalizing domain. The ESM ties these constructs together by providing an organizational scheme based more directly on the empirical structure of the externalizing domain.
Instantiation in an assessment instrument
The ESM was developed through the analysis of extensive item-level self-report data. As a result, it is instantiated in a specific self-report assessment instrument. In contrast, although the categories of the DSM have often provided consensual targets for inquiry in psychopathology research, the DSM is not an assessment instrument per se. As a result, DSM-derived constructs can be assessed with a diversity of specific instruments. This can be problematic because distinct instruments can be used to assess the same construct. This situation has been particularly problematic with reference to DSM-defined personality disorders. Kappa coefficients computed on distinct interview-based instruments designed to assess the same personality disorders tend to be poor (Clark & Harrison, 2001). A variety of issues could contribute to this poor convergent validity, ranging from details of the instruments themselves to conceptual problems in the way the DSM defines personality pathology. Regardless of the exact explanation of these results, the lack of convergent validity between instruments limits the ability to construct a cumulative science of psychopathology (Clark, Livesley, & Morey, 1997).
The ESM circumvents some of these issues because its constructs emerged from—and are thereby instantiated in—a specific and reliable assessment instrument. To work with the ESM at this point would logically involve using the assessment instrument from which that model was derived. This is not to say that the current operationalization of the ESM is the only possible operationalization or necessarily the most optimal one for every purpose. Rather, when one is developing a conceptual, empirically based model of personality and psychopathology, close links among statistical modeling, theoretical conceptualization, and assessment per se are desirable. This is because the result is an integrated package incorporating an empirically based conceptual model and a corresponding assessment instrument.
Conclusion
The ESM has a number of features that we feel may be generative of advances in our understanding of externalizing phenomena. It provides a specific model of comorbidity among manifest externalizing phenotypes, it explicitly models the latent sources of variation influencing manifest externalizing phenotypes, it conceptualizes and allows assessment of these manifest and latent phenotypes in a dimensional manner, and it brings together literatures and constructs that are historically but not empirically distinct. As such, it provides an organizing framework that should be generative of novel hypotheses and findings regarding the etiology, correlates, and consequences of these highly consequential forms of personality and psychopathology.
Acknowledgments
This work was supported by U.S. Public Health Service Grant MH65137. We are thankful for the support of the Minnesota Department of Corrections and the staff of the Lino Lakes and Shakopee Minnesota Correctional Facilities, without whom this work would not have been possible.
Footnotes
In the present analyses, using the correlation as a similarity metric is equivalent to using the angular distance between measures on the basis of standardized principal-component loadings from a full (untruncated) component analysis in which there are as many components as items. The angular distance is a quantity directly proportional to the distance between two measures in this type of component loading space and has been proposed as a useful metric for psychometrically oriented cluster analyses (T. R. Miller & Hirsch, 1992). Because using the correlation as a similarity metric is equivalent to using the angular distance in the current analyses, our cluster analyses can be interpreted as clustering measures on the basis of the extent to which they occupy the same location in full component loading space.
It is important to note that incorrect normality assumptions can introduce significant bias in parameter estimates (van den Oord, 2005). However, literature suggests that this bias is not severe (Lei & Lomax, 2005; Markon, 2006) and that use of different estimation methods typically does not result in substantially different parameter estimates (Lei & Lomax, 2005; Markon, 2006). In contrast, there is evidence in the literature to suggest that nonnormality can severely bias conclusions about model selection, especially in favor of more complex models, and that estimation method often significantly affects model fit statistics (Lei & Lomax, 2005; Markon, 2006; Markon & Krueger, 2004). Because model selection, rather than parameter estimation, was the focus of superordinate CFAs, we chose to adopt semiparametric ML estimation to avoid problems in interpretation of results.
This approach to approximating a continuous distribution is similar in logic to that of quadrature methodology used in IRT marginal maximum likelihood estimation. Here, however, the observed variables are assumed to be continuous, and the distribution of the latent factor is freely estimated rather than being fixed to some a priori distribution (cf. Heinen, 1996).
Parameterizing the higher order factor model as a correlated two-factor model was possible because only one higher order factor loading was identified (i.e., the two higher order factor loadings must equal one another). This single higher order factor loading is equal to the square root of the factor correlation in a correlated two-factor model. In the present case, a higher order factor model and a correlated two-factor model will have the same number of parameters and the same fit.
Technically, the theta estimates in Table 5 confound reliable residual variation in specific externalizing facets with stochastic errors. However, given the high reliabilities of the externalizing facet scales (see Table 2) combined with the evidence in Table 5 that the factors (λ1, λ2, λ3) do not exhaust all the variation in the facets, a nontrivial portion of theta is likely to be meaningfully correlated with specific etiologic contributions that distinguish specific externalizing facets from each other.
References
- Achenbach TM, Edelbrock CS. Psychopathology of childhood. Annual Review of Psychology. 1984;35:227–256. doi: 10.1146/annurev.ps.35.020184.001303. [DOI] [PubMed] [Google Scholar]
- Achenbach TM, Krukowski RA, Dumenci L, Ivanova MY. Assessment of adult psychopathology: Meta-analyses and implications of cross-informant correlations. Psychological Bulletin. 2005;131:361–382. doi: 10.1037/0033-2909.131.3.361. [DOI] [PubMed] [Google Scholar]
- Achenbach TM, McConaughy SH. Empirically based assessment of child and adolescent psychopathology: Practical applications. 2. Thousand Oaks, CA: Sage; 1997. [Google Scholar]
- Acton GS. Measurement of impulsivity in a hierarchical model of personality traits: Implications for substance use. Substance Use and Misuse. 2003;38:67–83. doi: 10.1081/ja-120016566. [DOI] [PubMed] [Google Scholar]
- American Psychiatric Association. Diagnostic and statistical manual of mental disorders. 3. Washington, DC: Author; 1980. [Google Scholar]
- American Psychiatric Association. Diagnostic and statistical manual of mental disorders. 3. Washington, DC: Author; 1987. [Google Scholar]
- American Psychiatric Association. Diagnostic and statistical manual of mental disorders. 4. Washington, DC: Author; 1994. [Google Scholar]
- American Psychiatric Association. Diagnostic and statistical manual of mental disorders. 4. Washington, DC: Author; 2000. [Google Scholar]
- Armstrong TD, Costello EJ. Community studies on adolescent substance use, abuse, or dependence and psychiatric comorbidity. Journal of Consulting and Clinical Psychology. 2002;70:1224–1239. doi: 10.1037//0022-006x.70.6.1224. [DOI] [PubMed] [Google Scholar]
- Bacon DR. Evaluation of cluster analytic approaches to initial model specification. Structural Equation Modeling. 2001;8:397–429. [Google Scholar]
- Barratt ES. Impulsiveness and aggression. In: Monahan J, Steadman HJ, editors. Violence and mental disorder: Developments in risk assessment. Chicago: University of Chicago Press; 1994. pp. 61–79. [Google Scholar]
- Bentler PM. Factor simplicity index and transformations. Psychometrika. 1977;42:277–295. [Google Scholar]
- Block J. The challenge of response sets. New York: Appleton-Century-Crofts; 1965. [Google Scholar]
- Block JH, Block J. The role of ego-control and ego-resiliency in the organization of behavior. In: Collins WA, editor. Minnesota symposia on child psychology. Vol. 13. Hillsdale, NJ: Erlbaum; 1980. pp. 39–101. [Google Scholar]
- Bollen KA, Ting KF. Confirmatory tetrad analysis. In: Marsden P, editor. Sociological methodology. Washington, DC: American Sociological Association; 1993. pp. 147–175. [Google Scholar]
- Buss AH, Perry M. The Aggression Questionnaire. Journal of Personality and Social Psychology. 1992;63:452–459. doi: 10.1037//0022-3514.63.3.452. [DOI] [PubMed] [Google Scholar]
- Buss AH, Plomin R. A temperament theory of personality development. New York: Wiley; 1975. [Google Scholar]
- Casillas A, Clark LA. Dependency, impulsivity, and self-harm: Traits hypothesized to underlie the association between Cluster B personality and substance use disorders. Journal of Personality Disorders. 2002;16:424–436. doi: 10.1521/pedi.16.5.424.22124. [DOI] [PubMed] [Google Scholar]
- Clark LA, Harrison JA. Assessment instruments. In: Livesley WJ, editor. Handbook of personality disorders. New York: Guilford Press; 2001. pp. 277–306. [Google Scholar]
- Clark LA, Livesley WJ, Morey L. Personality disorder assessment: The challenge of construct validity. Journal of Personality Disorders. 1997;11:205–231. doi: 10.1521/pedi.1997.11.3.205. [DOI] [PubMed] [Google Scholar]
- Clark LA, Watson D. Temperament: A new paradigm for trait psychology. In: Pervin LA, John OP, editors. Handbook of personality: Theory and research. 2. New York: Guilford Press; 1999. pp. 399–423. [Google Scholar]
- Clark LA, Watson D, Reynolds S. Diagnosis and classification of psychopathology: Challenges to the current system and future directions. Annual Review of Psychology. 1995;46:121–153. doi: 10.1146/annurev.ps.46.020195.001005. [DOI] [PubMed] [Google Scholar]
- Cloninger CR. Neurogenetic adaptive mechanisms in alcoholism. Science. 1987 April 24;236:410–416. doi: 10.1126/science.2882604. [DOI] [PubMed] [Google Scholar]
- Cloninger CR, Svrakic DM, Przybeck TR. A psychobiological model of temperament and character. Archives of General Psychiatry. 1993;50:975–990. doi: 10.1001/archpsyc.1993.01820240059008. [DOI] [PubMed] [Google Scholar]
- Cohen J. The cost of dichotomization. Applied Psychological Measurement. 1983;7:249–253. [Google Scholar]
- Costa PT, McCrae RR. Neuroticism Extraversion Openness—Personality Inventory—Revised. Port Huron, MI: Sigma Assessment Systems; 1995. [Google Scholar]
- Dickman SJ. Functional and dysfunctional impulsivity: Personality and cognitive correlates. Journal of Personality and Social Psychology. 1990;58:95–102. doi: 10.1037//0022-3514.58.1.95. [DOI] [PubMed] [Google Scholar]
- Draper D. Assessment and propagation of model uncertainty. Journal of the Royal Statistical Society: Series B (Methodology) 1995;57:45–97. [Google Scholar]
- Embretson SE, Reise S. Item response theory for psychologists. Mahwah, NJ: Erlbaum; 2000. [Google Scholar]
- Eysenck S, Pearson P, Easting G, Allsopp J. Age norms for impulsivity, venturesomeness, and empathy in adults. Personality and Individual Differences. 1985;6:613–619. [Google Scholar]
- Feighner JP, Robins E, Guze SB, Woodruff RA, Winokur G, Munoz R. Diagnostic criteria for use in psychiatric research. Archives of General Psychiatry. 1972;26:57–63. doi: 10.1001/archpsyc.1972.01750190059011. [DOI] [PubMed] [Google Scholar]
- First MB. Clinical utility: A prerequisite for the adoption of a dimensional approach in DSM. Journal of Abnormal Psychology. 2005;114:560–564. doi: 10.1037/0021-843X.114.4.560. [DOI] [PubMed] [Google Scholar]
- Gorenstein EE, Newman JP. Disinhibitory psychopathology: A new perspective and a model for research. Psychological Review. 1980;87:303–315. [PubMed] [Google Scholar]
- Graham JW, Hofer SM, MacKinnon DP. Maximizing the usefulness of data obtained with planned missing value patterns: An application of maximum likelihood procedures. Multivariate Behavioral Research. 1996;31:197–218. doi: 10.1207/s15327906mbr3102_3. [DOI] [PubMed] [Google Scholar]
- Gray JA. A critique of Eysenck’s theory of personality. In: Eysenck HJ, editor. A model for personality. Berlin: Springer; 1981. pp. 246–277. [Google Scholar]
- Hare RD. The Hare Psychopathy Checklist—Revised. 2. Toronto, Canada: Multi-Health Systems; 2003. [Google Scholar]
- Heinen T. Latent class and discrete latent trait models: Similarities and differences. Thousand Oaks, CA: Sage; 1996. [Google Scholar]
- Helzer JE, Kraemer HC, Krueger RF. The feasibility and need for dimensional psychiatric diagnoses. Psychological Medicine. 2006;36:1671–1680. doi: 10.1017/S003329170600821X. [DOI] [PubMed] [Google Scholar]
- Hicks BM, Krueger RF, Iacono WG, McGue M, Patrick CJ. Family transmission and heritability of externalizing disorders: A twin-family study. Archives of General Psychiatry. 2004;61:922–928. doi: 10.1001/archpsyc.61.9.922. [DOI] [PubMed] [Google Scholar]
- James W. The principles of psychology. Cambridge, MA: Harvard University Press; 1983. (Original work published 1890) [Google Scholar]
- Jessor R, Jessor SL. Problem behavior and psychosocial development: A longitudinal study of youth. New York: Academic Press; 1977. [Google Scholar]
- Kahler CW, Strong DR, Read JP, Palfai TP, Wood MD. Mapping the continuum of alcohol problems in college students: A Rasch model analysis. Psychology of Addictive Behaviors. 2004;18:322–333. doi: 10.1037/0893-164X.18.4.322. [DOI] [PubMed] [Google Scholar]
- Kendler KS, Davis CG, Kessler RC. The familial aggregation of common psychiatric and substance use disorders in the National Comorbidity Survey: A family history study. British Journal of Psychiatry. 1997;170:541–548. doi: 10.1192/bjp.170.6.541. [DOI] [PubMed] [Google Scholar]
- Kendler KS, Prescott CA, Myers J, Neale MC. The structure of genetic and environmental risk factors for common psychiatric and substance use disorders in men and women. Archives of General Psychiatry. 2003;60:929–937. doi: 10.1001/archpsyc.60.9.929. [DOI] [PubMed] [Google Scholar]
- Kim J. Proximity measures and cluster analysis in multidimensional item response theory. (Doctoral dissertation, Michigan State University, 2001) Dissertation Abstracts International. 2002;62:4137. [Google Scholar]
- Kraemer HC, Noda A, O’Hara R. Categorical versus dimensional approaches to diagnosis: Methodological challenges. Journal of Psychiatric Research. 2004;38:17–25. doi: 10.1016/s0022-3956(03)00097-9. [DOI] [PubMed] [Google Scholar]
- Krueger RF. The structure of common mental disorders. Archives of General Psychiatry. 1999;56:921–926. doi: 10.1001/archpsyc.56.10.921. [DOI] [PubMed] [Google Scholar]
- Krueger RF. Continuity of Axes I and II: Toward a unified model of personality, personality disorders, and clinical disorders. Journal of Personality Disorders. 2005;19:233–261. doi: 10.1521/pedi.2005.19.3.233. [DOI] [PMC free article] [PubMed] [Google Scholar]
- Krueger RF, Caspi A, Moffitt TE, Silva PA. The structure and stability of common mental disorders (DSM–III–R): A longitudinal–epidemiological study. Journal of Abnormal Psychology. 1998;107:216–227. doi: 10.1037//0021-843x.107.2.216. [DOI] [PubMed] [Google Scholar]
- Krueger RF, Hicks BM, Patrick CJ, Carlson SR, Iacono WG, McGue M. Etiologic connections among substance dependence, antisocial behavior, and personality: Modeling the externalizing spectrum. Journal of Abnormal Psychology. 2002;111:411–424. [PubMed] [Google Scholar]
- Krueger RF, Markon KE. Reinterpreting comorbidity: A model-based approach to understanding and classifying psychopathology. Annual Review of Clinical Psychology. 2006;2:111–133. doi: 10.1146/annurev.clinpsy.2.022305.095213. [DOI] [PMC free article] [PubMed] [Google Scholar]
- Krueger RF, Markon KE, Patrick CJ, Iacono WG. Externalizing psychopathology in adulthood: A dimensional-spectrum conceptualization and its implications for DSM–V. Journal of Abnormal Psychology. 2005;114:537–550. doi: 10.1037/0021-843X.114.4.537. [DOI] [PMC free article] [PubMed] [Google Scholar]
- Krueger RF, Nichol PE, Hicks BM, Markon KE, Patrick CJ, Iacono WG, McGue M. Using latent trait modeling to conceptualize an alcohol problems continuum. Psychological Assessment. 2004;16:107–119. doi: 10.1037/1040-3590.16.2.107. [DOI] [PubMed] [Google Scholar]
- Krueger RF, Tackett J, editors. Personality and psychopathology. New York: Guilford Press; 2006. [Google Scholar]
- Krueger RF, Watson D, Barlow D. Introduction to the special section: Toward a dimensionally based taxonomy of psychopathology. Journal of Abnormal Psychology. 2005;114:491–493. doi: 10.1037/0021-843X.114.4.491. [DOI] [PMC free article] [PubMed] [Google Scholar]
- Langenbucher JW, Labouvie E, Martin CS, Sanjuan PM, Bavly L, Kirisci L, Chung T. An application of item response theory analysis to alcohol, cannabis, and cocaine criteria in DSM–IV. Journal of Abnormal Psychology. 2004;113:72–80. doi: 10.1037/0021-843X.113.1.72. [DOI] [PubMed] [Google Scholar]
- Lei M, Lomax RG. The effect of varying degrees of nonnormality in structural equation modeling. Structural Equation Modeling. 2005;12:1–27. [Google Scholar]
- Lilienfeld SO, Andrews BP. Development and preliminary validation of a self-report measure of psychopathic personality traits in noncriminal populations. Journal of Personality Assessment. 1996;66:488–524. doi: 10.1207/s15327752jpa6603_3. [DOI] [PubMed] [Google Scholar]
- Lubke GH, Neale MC. Distinguishing between latent classes and continuous factors: Resolution by maximum likelihood? Multivariate Behavioral Research. 2006;41:499–532. doi: 10.1207/s15327906mbr4104_4. [DOI] [PubMed] [Google Scholar]
- Lynam DR, Leukefeld C, Clayton RR. The contribution of personality to the overlap between antisocial behavior and substance use/misuse. Aggressive Behavior. 2003;29:316–331. [Google Scholar]
- Markon KE. Semiparametric maximum likelihood estimation using mixture moment structure models. Twin Research and Human Genetics. 2006;9:360–366. doi: 10.1375/183242706777591245. [DOI] [PubMed] [Google Scholar]
- Markon KE, Krueger RF. An empirical comparison of information-theoretic selection criteria for multivariate behavior genetic models. Behavior Genetics. 2004;34:593–610. doi: 10.1007/s10519-004-5587-0. [DOI] [PubMed] [Google Scholar]
- Markon KE, Krueger RF. Categorical and continuous models of liability to externalizing disorders: A direct comparison in NESARC. Archives of General Psychiatry. 2005;62:1352–1359. doi: 10.1001/archpsyc.62.12.1352. [DOI] [PMC free article] [PubMed] [Google Scholar]
- Markon KE, Krueger RF. Information-theoretic latent distribution modeling: Distinguishing discrete and continuous latent variable models. Psychological Methods. 2006;11:228–243. doi: 10.1037/1082-989X.11.3.228. [DOI] [PubMed] [Google Scholar]
- Markon KE, Krueger RF, Watson D. Delineating the structure of normal and abnormal personality: An integrative hierarchical approach. Journal of Personality and Social Psychology. 2005;88:139–157. doi: 10.1037/0022-3514.88.1.139. [DOI] [PMC free article] [PubMed] [Google Scholar]
- McDonald RP. Difficulty factors and non-linear factor analysis. British Journal of Mathematical and Statistical Psychology. 1965;18:11–23. doi: 10.1111/j.2044-8317.1965.tb00690.x. [DOI] [PubMed] [Google Scholar]
- McGue M, Slutske W, Iacono WG. Personality and substance use disorders: II. Alcoholism versus drug use disorders. Journal of Consulting and Clinical Psychology. 1999;67:394–404. doi: 10.1037//0022-006x.67.3.394. [DOI] [PubMed] [Google Scholar]
- Mellenbergh GJ. Measurement precision in test score and item response models. Psychological Methods. 1996;1:293–299. doi: 10.1037/1082-989X.9.1.116. [DOI] [PubMed] [Google Scholar]
- Miller JD, Lynam D, Leukefeld C. Examining antisocial behavior through the lens of the five factor model of personality. Aggressive Behavior. 2003;29:497–514. [Google Scholar]
- Miller TR, Hirsch TM. Cluster analysis of angular data in applications of multidimensional item response theory. Applied Measurement in Education. 1992;5:193–212. [Google Scholar]
- Moffitt TE. Adolescent-limited and life-course-persistent antisocial behavior: A developmental taxonomy. Psychological Review. 1993;100:674–701. [PubMed] [Google Scholar]
- Muthén B, Muthén L. Mplus user’s guide. 3. Los Angeles: Muthén & Muthén; 1998–2004. [Google Scholar]
- O’Connor BP. The search for dimensional structure differences between normality and abnormality: A statistical review of published data on personality and psychopathology. Journal of Personality and Social Psychology. 2002;83:962–982. [PubMed] [Google Scholar]
- Robins LN, Babor TF, Cottler LB. Composite International Diagnostic Interview: Expanded Substance Abuse Module. St. Louis, MO: Washington University, Department of Psychiatry; 1987. [Google Scholar]
- Rothbart MK, Ahadi SA, Evans DE. Temperament and personality: Origins and outcomes. Journal of Personality and Social Psychology. 2000;78:122–135. doi: 10.1037//0022-3514.78.1.122. [DOI] [PubMed] [Google Scholar]
- Saha TD, Chou SP, Grant BF. Toward an alcohol use disorder continuum using item response theory: Results from the National Epidemiologic Survey on Alcohol and Related Conditions. Psychological Medicine. 2006;36:931–941. doi: 10.1017/S003329170600746X. [DOI] [PubMed] [Google Scholar]
- Samejima F. Estimation of latent ability using a response pattern of graded scores. Psychometrika Monograph Supplement. 1969;34:100–114. [Google Scholar]
- Sbrana A, Dell’Osso L, Benvenuti A, Rucci P, Cassano P, Banti S, et al. The psychotic spectrum: Validity and reliability of the Structured Clinical Interview for the Psychotic Spectrum. Schizophrenia Research. 2005;75:375–387. doi: 10.1016/j.schres.2004.09.016. [DOI] [PubMed] [Google Scholar]
- Schafer JL, Graham JW. Missing data: Our view of the state of the art. Psychological Methods. 2002;7:147–177. [PubMed] [Google Scholar]
- Selzer ML. The Michigan Alcoholism Screening Test: The quest for a new diagnostic instrument. American Journal of Psychiatry. 1971;127:1653–1658. doi: 10.1176/ajp.127.12.1653. [DOI] [PubMed] [Google Scholar]
- Sher KJ, Bartholow BD, Wood MD. Personality and substance use disorders: A prospective study. Journal of Consulting and Clinical Psychology. 2000;68:818–829. [PubMed] [Google Scholar]
- Sher KJ, Grekin ER, Williams NA. The development of alcohol use disorders. Annual Review of Clinical Psychology. 2005;1:493–523. doi: 10.1146/annurev.clinpsy.1.102803.144107. [DOI] [PubMed] [Google Scholar]
- Sher KJ, Trull TJ. Personality and disinhibitory psychopathology: Alcoholism and antisocial personality disorder. Journal of Abnormal Psychology. 1994;103:92–102. doi: 10.1037//0021-843x.103.1.92. [DOI] [PubMed] [Google Scholar]
- Sher KJ, Trull TJ. Methodological issues in psychopathology research. Annual Review of Psychology. 1996;47:371–400. doi: 10.1146/annurev.psych.47.1.371. [DOI] [PubMed] [Google Scholar]
- Siok-Hoon TL. Assessing the dimensionality of constructed-response tests using hierarchical cluster analysis: A Monte Carlo study with application. (Doctoral dissertation, University of Pittsburgh, 1999) Dissertation Abstracts International. 1999;61:147. [Google Scholar]
- Skinner HA. The Drug Abuse Screening Test. Addictive Behaviors. 1982;7:363–371. doi: 10.1016/0306-4603(82)90005-3. [DOI] [PubMed] [Google Scholar]
- Skinner HA, Allen BA. Alcohol dependence syndrome: Measurement and validation. Journal of Abnormal Psychology. 1982;91:199–209. doi: 10.1037//0021-843x.91.3.199. [DOI] [PubMed] [Google Scholar]
- Skol AD, Scott LJ, Abecasis GR, Boehnke M. Joint analysis is more efficient than replication-based analysis for two-stage genome-wide association studies. Nature Genetics. 2006;38:209–213. doi: 10.1038/ng1706. [DOI] [PubMed] [Google Scholar]
- Slutske WS, Eisen S, True WR, Lyons MJ, Goldberg J, Tsuang M. Common genetic vulnerability for pathological gambling and alcohol dependence in men. Archives of General Psychiatry. 2000;57:666–673. doi: 10.1001/archpsyc.57.7.666. [DOI] [PubMed] [Google Scholar]
- Slutske WS, Heath AC, Madden PAF, Bucholz KK, Statham DJ, Martin NG. Personality and the genetic risk for alcohol dependence. Journal of Abnormal Psychology. 2002;111:124–133. [PubMed] [Google Scholar]
- Spielberger CD. State–Trait Anger Expression Inventory (STAXI) Orlando, FL: Psychological Assessment Resources; 1988. [Google Scholar]
- Stone AA, Turkkan JS, Bachrach CA, Jobe JB, Kurtzman HS, Cain VS, editors. The science of self report. Mahwah, NJ: Erlbaum; 1999. [Google Scholar]
- Tackett JL, Krueger RF, Iacono W, McGue M. Symptom-based subfactors of DSM-defined conduct disorder: Evidence for etiologic distinctions. Journal of Abnormal Psychology. 2005;114:483–487. doi: 10.1037/0021-843X.114.3.483. [DOI] [PMC free article] [PubMed] [Google Scholar]
- Tackett JL, Krueger RF, Sawyer MG, Graetz BW. Subfactors of DSM–IVconduct disorder: Evidence and connections with syndromes from the Child Behavior Checklist. Journal of Abnormal Child Psychology. 2003;31:647–654. doi: 10.1023/a:1026214324287. [DOI] [PubMed] [Google Scholar]
- Tate R. A comparison of selected empirical methods for assessing the structure of responses to test items. Applied Psychological Measurement. 2003;27:159–203. [Google Scholar]
- Tellegen A. Structure of mood and personality and their relevance to assessing anxiety, with an emphasis on self-report. In: Tuma AH, Maser JD, editors. Anxiety and the anxiety disorders. Hillsdale, NJ: Erlbaum; 1985. pp. 681–706. [Google Scholar]
- Tellegen A. Manual for the Multidimensional Personality Questionnaire. Minneapolis: University of Minnesota Press; in press. [Google Scholar]
- Thissen D. MULTILOG user’s guide. Chicago: Scientific Software; 1991. [Google Scholar]
- Tsuang MT, Lyons MJ, Meyer JM, Doyle T, Eisen SA, Goldberg J, et al. Co-occurrence of abuse of different drugs in men: The role of drug-specific and shared vulnerabilities. Archives of General Psychiatry. 1998;55:967–972. doi: 10.1001/archpsyc.55.11.967. [DOI] [PubMed] [Google Scholar]
- van Abswoude AAH, Vermunt JK, Hemker BT, van der Ark LA. Mokken scale analysis using hierarchical clustering procedures. Applied Psychological Measurement. 2004;28:332–354. [Google Scholar]
- van den Oord EJCG. Estimating Johnson curve population distributions in MULTILOG. Applied Psychological Measurement. 2005;29:45–64. [Google Scholar]
- Vermunt JK, Magidson J. Latent GOLD user’s manual. Boston: Statistical Innovations, Inc; 2000. [Google Scholar]
- Waldman ID, Slutske WS. Antisocial behavior and alcoholism: A behavioral genetic perspective on comorbidity. Clinical Psychology Review. 2000;20:255–287. doi: 10.1016/s0272-7358(99)00029-x. [DOI] [PubMed] [Google Scholar]
- Wall TL, Carr LG, Ehlers CL. Protective association of genetic variation in alcohol dehydrogenase with alcohol dependence in native American Mission Indians. American Journal of Psychiatry. 2003;160:41–46. doi: 10.1176/appi.ajp.160.1.41. [DOI] [PubMed] [Google Scholar]
- Ward JH. Hierarchical grouping to optimize an objective function. Journal of American Statistical Association. 1963;58:236–244. [Google Scholar]
- Watson D. Rethinking the mood and anxiety disorders: A quantitative hierarchical model for DSM–V. Journal of Abnormal Psychology. 2005;114:522–536. doi: 10.1037/0021-843X.114.4.522. [DOI] [PubMed] [Google Scholar]
- Watson D, Clark LA, Harkness AR. Structures of personality and their relevance to psychopathology. Journal of Abnormal Psychology. 1994;103:18–31. [PubMed] [Google Scholar]
- Whiteside SP, Lynam DR. The five factor model and impulsivity: Using a structural model of personality to understand impulsivity. Personality and Individual Differences. 2001;30:669–689. [Google Scholar]
- Widiger TA, Clark LA. Toward DSM–Vand the classification of psychopathology. Psychological Bulletin. 2000;126:946–963. doi: 10.1037/0033-2909.126.6.946. [DOI] [PubMed] [Google Scholar]
- Widiger TA, Samuel DB. Diagnostic categories or dimensions? A question for the Diagnostic and Statistical Manual of Mental Disorders. Journal of Abnormal Psychology. (Fifth) 2005;114:494–504. doi: 10.1037/0021-843X.114.4.494. [DOI] [PubMed] [Google Scholar]
- Wise RA. Addictive drugs and brain stimulation reward. Annual Review of Neuroscience. 1996;19:319–340. doi: 10.1146/annurev.ne.19.030196.001535. [DOI] [PubMed] [Google Scholar]
- Young SE, Stallings MC, Corley RP, Krauter KS, Hewitt JK. Genetic and environmental influences on behavioral disinhibition. American Journal of Medical Genetics (Neuropsychiatric Genetics) 2000;96:684–695. [PubMed] [Google Scholar]
- Yung Y, Thissen D, McLeod LD. On the relationship between the higher-order factor model and the hierarchical factor model. Psychometrika. 1999;64:113–128. [Google Scholar]
- Zucker RA, Chermack ST, Curran GM. Alcoholism: A life span perspective on etiology and course. In: Sameroff AJ, Lewis M, editors. Handbook of developmental psychopathology. 2. Dordrecht, the Netherlands: Kluwer Academic; 2000. pp. 569–587. [Google Scholar]
- Zuckerman M. Sensation seeking: Beyond the optimal level of arousal. Hillsdale, NJ: Erlbaum; 1979. [Google Scholar]
- Zuckerman M, Kuhlman DM. Personality and risk-taking: Common biosocial factors. Journal of Personality. 2000;68:999–1029. doi: 10.1111/1467-6494.00124. [DOI] [PubMed] [Google Scholar]
- Zwick WR, Velicer WF. Comparison of five rules for determining the number of components to retain. Psychological Bulletin. 1986;117:253–269. doi: 10.1207/s15327906mbr1702_5. [DOI] [PubMed] [Google Scholar]