

Abstract
Chlorhexidine salts are available in various formulations for dental applications. This study tested the hypothesis that the release of chlorhexidine from a urethane dimethacrylate and triethylene glycol dimethacrylate resin system can be effectively controlled by the chlorhexidine diacetate content and pH. The filler concentrations were 9.1, 23.1, or 33.3 wt%, and the filled resins were exposed to pH 4 and pH 6 acetate buffers. The results showed that Fickian diffusion was the dominant release mechanism. The rates of release were significantly higher in pH 4 buffer, which was attributed to the increase of chlorhexidine diacetate solubility at lower pH. The higher level of filler loading reduced the degree of polymerization, leading to a greater loss of organic components and higher chlorhexidine release rates.
Keywords: chlorhexidine, chlorhexidine diacetate, controlled release, UDMA-TEGDMA resin, pH-dependent release
INTRODUCTION
Chlorhexidine is a potent oral antimicrobial agent that can suppress mutans streptococci levels, and potentially reduce the caries increment in humans (Emilson, 1994). It has been incorporated into mouthrinses and shown to be effective in inhibiting dental plaque and gingivitis in human subjects (Axelsson and Lindhe, 1987; Sreenivasan and Gittins, 2004).
The use of a mouthrinse containing chlorhexidine salt was found to be ineffective in suppressing subgingival plaque in pockets with a 3-mm or greater depth (Flotra, 1973). This shortcoming led to the use of controlled-release devices for the long-term release of chlorhexidine within periodontal pockets (Coventry and Newman, 1982). Later development yielded devices made of an acrylic-based strip (Addy et al., 1982), a cross-linked collagen chip (Jeffcoat et al., 1998), and biodegradable polyesters (Yue et al., 2004).
Chlorhexidine salts have also been incorporated into glass-ionomer cements and resin-modified glass-ionomer cements to improve their antimicrobial properties (Ribeiro and Ericson, 1991; Sanders et al., 2002; Palmer et al., 2004). However, only a small portion of chlorhexidine salt (3 to 5%) was released from an experimental glass ionomer over a period of 240 days (Palmer et al., 2004). Studies have also showed that a relatively higher percentage of chlorhexidine release can be achieved. A self-curing system based on poly(ethyl methacrylate) and tetrahydrofurfuryl methacrylate exhibited a release of 6 to 12% of incorporated chlorhexidine diacetate over 14 days (Patel et al., 2001). Fifty percent of incorporated chlorhexidine diacetate was released in 1 wk from a composite based on hydroxyethyl methacrylate (Leung et al., 2005).
Polymeric materials are known to degrade as a function of pH (Göpferich, 1996) during immersion, and subsequently affect the release of fluoride ions from filled resins (Anusavice et al., 2005). Organic components can also be eluted over time from resin-based composite stored in pH buffers (Örtengren et al., 2001). To our knowledge, studies of chlorhexidine release from polymeric materials as a function of pH and chlorhexidine content have not been previously reported.
The objective of this study was to test the hypothesis that the chlorhexidine release rate from a urethane dimethacrylate (UDMA)-triethylene glycol dimethacrylate (TEGDMA) resin system can be controlled effectively by the chlorhexidine content and solution pH.
MATERIALS & METHODS
Chlorhexidine diacetate (98% pure; SIGMA, St. Louis, MO, USA) was ground to finer particles by a Retsch MM 200 grinding machine (Retsch Inc., Newtown, PA, USA) for incorporation with resin, and the particle size was determined with the use of a Particle Size Distribution Analyzer M3603 (TSI, St. Paul, MN, USA). A light-curable resin mixture containing 70 wt% UDMA (Esschem Inc., Linwood, PA, USA), 30 wt% TEGDMA (Aldrich Co., Milwaukee, WI, USA), and appropriate amounts of light-sensitive initiator and co-catalyst were used to produce 3 filled resins. Three levels of chlorhexidine diacetate loading (9.1, 23.1, and 33.3 wt%) were prepared by the addition of 10, 30, and 50 parts of chlorhexidine diacetate to 100 parts of resin.
We created the specimens by pouring the filled resin into a mold (10 mm diameter × 2 mm thick) and light-cured them (Visilux 2, Model 5520 AA; 3M/ESPE, St. Paul, MN, USA) through a Mylar® matrix for 30 sec on each side. Twenty discs were made for each filled resin. The disks were washed, dried, and weighed. Acetate buffer solutions were prepared and adjusted to pH 4 and pH 6 for the release studies. Ten discs from each filled resin group were stored individually in 15-mL vials with 5 mL of buffer solution, and the vials were stored in a water bath at 37°C. The buffer solutions were replaced after exposure for a total of 4 mos at 1, 5, 15, 35, 65, 105, 155, 215, 287, 383, 503, 647, 815, 1000, 1230, 1463, 1727, 2015, 2327, 2663, and 2880 hrs.
A series of solutions containing 1, 2, 5, 10, 20, 30, and 40 ppm chlorhexidine diacetate was prepared with each buffer solution. A UV-Vis Spectrophotometer (UV160U, Shimadzu, Kyoto, Japan) confirmed the absorption peak of chlorhexidine at 255 nm. A linear relationship between absorbance peak height obtained from UV-Vis spectrophotometry and the chlorhexidine concentration in the reference solutions was established for each buffer solution. The absorbance peak heights of the replaced solutions at 255 nm were converted to the quantities of chlorhexidine released, based on the linear relationship.
The rates of release per unit surface area of the specimen between consecutive measurements were calculated. Analysis of variance (ANOVA) was used to examine the effects of chlorhexidine diacetate loading, pH of storage buffer solution, and time on the release rate. The cumulative release per unit area was also calculated at each prescribed time of solution replacement. The cumulative release data (Y in μg/cm2) over time, t, were fit to the following equation (De Moor et al., 1996) for each specimen,
where a is the quantity of short-term release, t½ is the time at which one-half of a has been released, and b is the coefficient for long-term Fickian release. We used two-way ANOVA to examine the effects of pH and chlorhexidine diacetate loading on the value of b.
The solubility of chlorhexidine diacetate in acetate buffer solutions (pH 4, pH 5, pH 6, and pH 7) was determined by the equilibrium solution method. After equilibration, the concentration of chlorhexidine in each solution was determined in triplicate as described earlier.
At the conclusion of the experiments, all specimens were allowed to dry in ambient air and were weighed. The mean weight loss and change with respect to the original weight for each group were calculated. The differences between the total weight loss and total release of chlorhexidine diacetate of each group were calculated as the released quantity of other species.
Two randomly selected specimens from each group were cut in half, and the cross-section surfaces were polished and carbon-coated for examination by a scanning electron microscope (JSM 6400; Jeol USA Inc., Peabody, MA, USA).
RESULTS
The mean particle size (SD) of the chlorhexidine diacetate powder was reduced from 44.2 (1.8) μm to 13.5 (1.6) μm. The solubility of chlorhexidine diacetate in pH 4, pH 5, pH 6, and pH 7 buffer solutions was 10.1, 6.9, 3.6, and 3.3 g/L, respectively.
After an initial rapid decrease, the mean release rate of chlorhexidine reduced gradually over time (Fig. 1). Three-way ANOVA showed that the differences in mean release rates were significantly greater at pH 4 and with chlorhexidine diacetate loading, but decreased over time (P < 0.0001). One-way ANOVA and Tukey's HSD tests showed that the difference among release rates for chlorhexidine diacetate loadings of 9.1, 23.1, and 33.3 wt% became insignificant (P > 0.05) after 1230, 1000, and 1000 hrs in pH 6 buffer, and after 1463, 1230, and 1727 hrs in pH 4 buffer.
Figure 1.
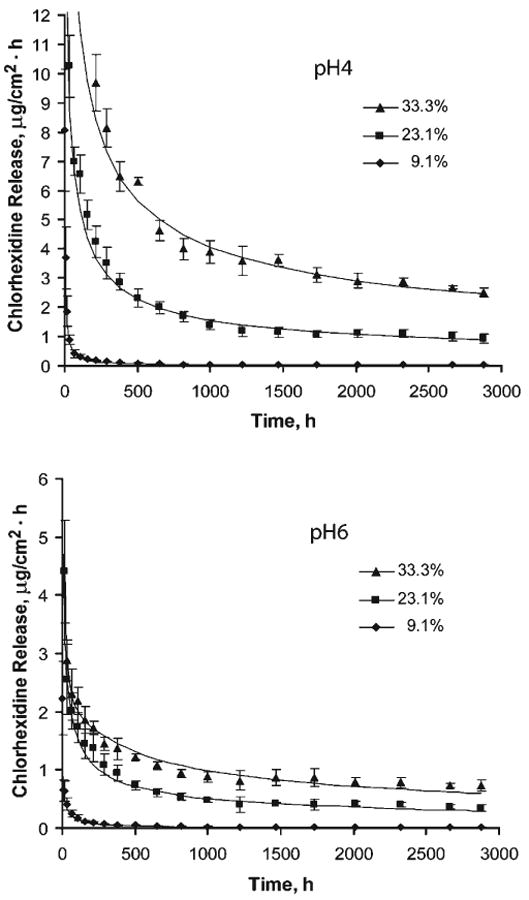
Mean chlorhexidine release rate (μg/cm2·hr) as a function of time from filled resin specimens containing 9.1, 23.1, and 33.3 wt% of chlorhexidine diacetate in pH 4 (left) and pH 6 (right) buffer solutions. Each datapoint is the mean of release rates (n = 10) between consecutive measurements, and the error bars represent ± 1 SD of the release rates. The release rates above 12 μg/cm2·hr in pH 4, and 6 μg/cm2·hr in pH 6 buffer solutions are not shown, as a better illustration of the release rate at later times. The datapoints that appear to overlap the baseline of the plots represent a mean release rate less than 0.1 μg/cm2·hr. The solid line represents the release rate vs. time based on the best-fit curve of the equation of the respective group. We obtained it by substituting the values of coefficients in Table 1 into the first derivative of the equation with respect to time, and plotting the rate over the entire experimental period.
Regression analyses yielded a goodness of fit of > 95% for each specimen. The mean and SD of a, t½, and b values were calculated for each group (Table 1). Two-way ANOVA revealed that the effects of pH and filler loading on the b values were highly significant (P < 0.0001), and that there was no interaction among variables.
Table 1.
Composition of Groups Tested and the Group Mean (n = 10) and SD (in parentheses) of a, t½, and b, Determined by the Regression of Individual Specimens of the Group
| Composition of Filled Resin in wt%
|
|||||||
|---|---|---|---|---|---|---|---|
| Group | UDMA | TEGDMA | Chlorhexidine Diacetate | pH | a, μg/cm2 | t½, hr | b, μg/cm2·hr½ |
| 1 | 63.6 | 27.3 | 9.1 | 4 | 39 (11) | 33 (14) | 3.7 (0.4) |
| 2 | 53.8 | 23.1 | 23.1 | 4 | 3 (70) | 95 (15) | 97.4 (8.5) |
| 3 | 46.7 | 20.0 | 33.3 | 4 | -630 (131) | 10 (6) | 233.3 (12.0) |
| 4 | 63.6 | 27.3 | 9.1 | 6 | 11 (5) | 90 (26) | 2.0 (0.2) |
| 5 | 53.8 | 23.1 | 23.1 | 6 | -25 (15) | 15 (40) | 30.9 (3.5) |
| 6 | 46.7 | 20.0 | 33.3 | 6 | -204 (37) | 115 (17) | 53.9 (4.2) |
Note: We fitted the data of cumulative chlorhexidine release over time from each specimen into the equation to estimate 3 coefficients: a is the total quantity of short-term release, t½ is the time needed to release half of a, and b is the coefficient of long-term Fickian release. The value of b·(time)½ represents the total agent released over a long time. Values for individual specimens were used to calculate the mean and SD of each group.
The quantity of weight loss before and after exposure to buffer solutions increased with chlorhexidine diacetate content but decreased with an increase in pH, except for the 33.3 wt% group in pH 6 buffer solution (Table 2). A significant amount of chlorhexidine diacetate remained in the specimens, and the release of other species also contributed to weight loss.
Table 2.
Specimen Weight Changes (n = 10) Before and After the Experiment
| pH | Content of Chlorhexidine Diacetate, wt% | Average Weight (SD)
|
Average Weight Change (SD), wt% | Average Total Chlorhexidine Diacetate Release (SD), mg | Average Chlorhexidine Diacetate Retained, wt% | Average Weight Loss by Other Species
|
|||
|---|---|---|---|---|---|---|---|---|---|
| Before test, mg | After test, mg | Total loss, mg | mg | wt% | |||||
| 4 | 9.1 | 158.5 (6.3) | 155.0 (6.5) | 3.5 (0.6) | 2.2 (0.4) | 0.5 (0.1) | 96.5 | 3.0 | 1.9 |
| 4 | 23.1 | 162.3 (6.1) | 148.1 (5.9) | 14.2 (2.7) | 8.7 (1.6) | 10.9 (1.1) | 70.9 | 3.3 | 2.0 |
| 4 | 33.3 | 157.9 (7.2) | 127.6 (6.1) | 30.3 (2.3) | 19.2 (1.2) | 26.6 (1.4) | 49.5 | 3.7 | 2.4 |
| 6 | 9.1 | 157.8 (7.2) | 155.2 (8.8) | 2.6 (0.6) | 1.7 (0.4) | 0.2 (0.0) | 98.6 | 2.4 | 1.5 |
| 6 | 23.1 | 159.5 (7.6) | 153.0 (9.0) | 6.6 (2.6) | 4.2 (1.8) | 3.6 (0.3) | 90.2 | 3.0 | 1.9 |
| 6 | 33.3 | 158.4 (12.5) | 151.8 (12.5) | 6.6 (0.9) | 4.2 (0.7) | 6.1 (0.5) | 88.4 | 0.5 | 0.3 |
Note: (1) The values of average weight, average weight change, and average total chlorhexidine diacetate release are based on individual specimens in each group. (2) The values of average chlorhexidine diacetate retained, and average weight loss of other species are based on the differences in the means; therefore, there is no SD. (3) The weight loss is greater than the loss occurring through the release of chlorhexidine. The difference is designated as the loss by other species, i.e., the release organic compounds that are not detected near 255 nm of the UV/Vis spectrophotometry.
SEM images of the filled resin discs containing 9.1, 23.1, and 33.3 wt% of chlorhexidine diacetate after 4 months' exposure to ambient air (control), pH 4, and pH 6 buffers exhibited the presence of fillers and voids (Fig. 2). The voids in the control group were likely caused by the loss of filler particles during polishing. The density of voids increased with filler content and a decrease in pH. For specimens containing 23.1 and 33.3 wt% chlorhexidine diacetate in pH 4 buffers, areas of significant filler are visible as bands.
Figure 2.
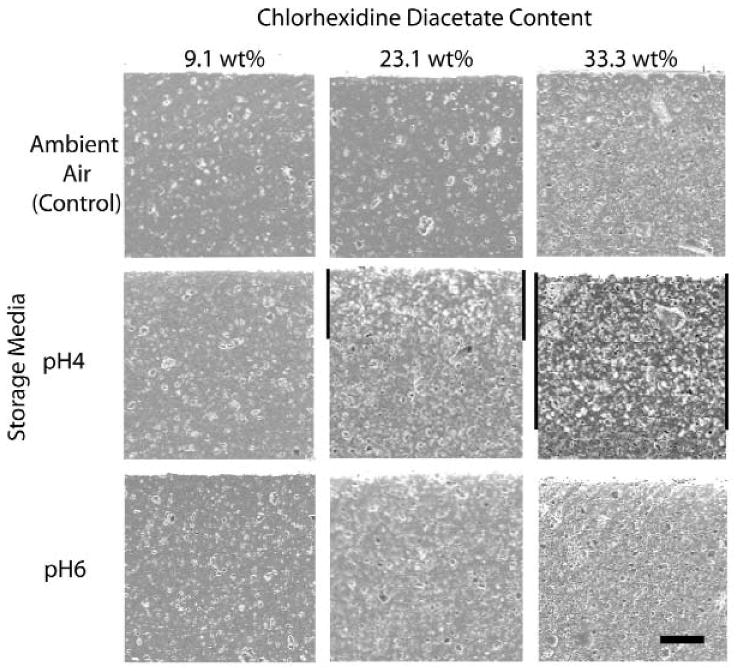
SEM images of the filled resin discs containing 9.1, 23.1, and 33.3 wt% of chlorhexidine diacetate after exposure for 4 mos in ambient air (control), and in pH 4 and pH 6 buffer solutions. The top edges of the images are the exposed surface. The pairs of vertical black bars with 23.1 and 33.3 wt% loading of the pH 4 group highlight the band of lighter areas. The specimen size shown is 0.5 × 0.5 mm. The horizontal black bar at the lower right corner represents a width of 100 μm.
DISCUSSION
The data plots show 3 distinct phases of release rates: a rapid decrease, a transition to moderate decrease, and a plateau. The plateau region suggests that the difference in the rate has become insignificant. The time needed to reach the plateau stage increased over time, but decreased with an increase in pH. Since all specimens were washed initially with distilled water, the release from residual chlorhexidine diacetate on the surface should be small during the initial period. In addition to the negligible duration of short-term release, Fickian diffusion rapidly became the dominant mechanism of release.
Storage buffer pH exhibited a significant influence on the values of b. The solubility of chlorhexidine diacetate in pH 4 buffer (10.1 g/L) was about 3 times that in pH 6 buffer (3.6 g/L). A previous study (Anusavice et al., 2005) of the effect of pH on fluoride release from CaF2-filled resin showed a higher release rate in pH 4 than in pH 6 buffer, even though the solubility of CaF2 decreased slightly as the pH decreased. This effect was attributed to surface erosion caused by the lower pH buffer. SEM images revealed only slight surface erosion of the specimens filled with chlorhexidine diacetate. In addition, there were lighter bands beneath the surface exposed to pH 4 buffer. Judged by the average amount of chlorhexidine diacetate remaining in the specimens, these bands are an indication of the active release of chlorhexidine diacetate from the specimens. The lack of lighter-color bands and the relatively higher wt% of chlorhexidine diacetate retained in specimens in pH 6 buffer indicate that the release of chlorhexidine from chlorhexidine-diacetate-filled resins is pH-dependent.
Our results show that about 50% of chlorhexidine diacetate in the 33.3 wt% group was released over a four-month period in pH 4 buffer. If one assumes that the experiments continued, and that Fickian diffusion remained as the dominating release mechanism, the length of time for the remaining groups to attain 50% of release can be calculated from the equation without the first term. The results show that it would take approximately 1 yr for the 23.1 wt% group and > 10 yrs for the 9.1 wt% groups to attain a 50% release in pH 4 buffer. In pH 6 buffer, the 50% release time is much longer—6, 9, and > 10 yrs for the 33.3, 23.1, and 9.1 wt% groups, respectively. One would expect the release rate to increase with higher loading level, and the times needed to reach the same degree of depletion to be similar. Thus, there must be one or more additional factors that enhance the release.
Unreacted monomers and additives may be released from cured dental resins (Sideridou et al., 2003) and composites (Ferracane, 1994; Örtengren et al., 2001; Michelsen et al., 2003). The quantity of release can be as high as 2 wt% of the resin component of the composite (Ferracane, 1994) and from 0.2 to 1.4 wt% from cured resins (Sideridou et al., 2003). Since the wt% of resin decreases with an increase in chlorhexidine diacetate, the amount of leachable monomers should decrease. In contrast, our results showed that the mass of leachable components increased with the chlorhexidine diacetate content, except for the 33.3 wt% group in pH 6 buffer. Studies have suggested that incorporating chlorhexidine diacetate into resin could hinder the polymerization process and result in a higher level of residual monomers (Wilson and Wilson, 1993; Riggs et al., 2000). A higher level of residual monomer would result in a greater weight loss from the resin matrix, which was observed in our study. This situation would increase the void volume and result in faster depletion of chlorhexidine diacetate.
Unprotected ester linkages of methacrylate-based resin can hydrolyze in acid, base, or the presence of certain enzymes (Coury, 2004), yielding low-molecular-weight species. One may speculate that these new species could release readily and contribute to higher weight loss by other species associated with pH 4. Surface-softening and surface erosion of composites by the hydrolytic action of enzymes have been reported (Santerre et al., 2001). However, the use of an acidic pH 4 medium to mimic in vivo conditions did not yield comparable results (Prakki et al., 2005).
While the calculations show that the release of chlorhexidine can extend for long periods of time, the rate of release decreased as a function of time. For example, the release rates from 33.3 wt% specimens in pH 6 buffer will decrease from 0.50 μg/cm2·hr at 4 mos to 0.29, 0.20, 0.17, 0.14, 0.13, and 0.12 μg/cm2·hr after 1, 2 3, 4, 5, and 6 yrs, respectively. For the 23.1 wt% group, the rate will be 0.12 μg/cm2·hr after 2 yrs in pH 6 buffer. The 9.1 wt% groups released less than 0.02 μg/cm2·hr at 4 mos in both pH buffers, and the release decreased over time. The level of release and decreased level of pH dependence, compared with those of higher-loading specimens, suggest that they may not be useful for clinical applications. The use of filler loading above 23.1 wt% will yield a minimum release of 0.12 μg/cm2·hr over 2 yrs at pH 6 buffer. It is possible to formulate filled resins with specific ranges of release rates and release lifetimes by altering the filler content. Since any shifts to low pH in the oral cavity will be for short times, the influence on the overall performance should not change significantly. The release pattern near pH 7 should be comparable with that at pH 6, since the solubilities of chlorhexidine diacetate are 3.6 and 3.3 g/L, respectively, at these pHs. Should the minimum required rate of release and the duration of release be found to be outside the present range, other means of manipulating the material systems are still possible.
Previous investigators have identified various factors that can influence the rate of chlorhexidine release from resin matrices. For glass-ionomer cement, the formation of a low-solubility chlorhexidine salt is the likely cause of a low release rate (Palmer et al., 2004). In contrast, complexing of chlorhexidine diacetate with cyclodextrin can yield a complex with increased solubility that exhibits a greater release of chlorhexidine from biodegradable PLGA chips (Yue et al., 2004). Complete replacement of dimethacrylate in a composite with hydroxyethyl methacrylate resulted in a 10-fold increase of chlorhexidine release over a one-week period (Leung et al., 2005). Additional diffusion channels within resins can be generated from the incorporation of water-absorbing monomers, which are essential for increasing chlorhexidine release rates (Riggs et al., 2000; Patel et al., 2001). Therefore, it should be possible to develop a broad range of controlled-release options for high-caries-risk patients.
Acknowledgments
This study was supported by NIH/NIDCR Grant DE13412.
References
- Addy M, Rawle L, Handley R, Newman HN, Coventry JF. The development and in vitro evaluation of acrylic strips and dialysis tubing for local drug delivery. J Periodontol. 1982;53:693–699. doi: 10.1902/jop.1982.53.11.693. [DOI] [PubMed] [Google Scholar]
- Anusavice KJ, Zhang NZ, Shen C. Effect of CaF2 content on rate of fluoride release from filled resins. J Dent Res. 2005;84:440–444. doi: 10.1177/154405910508400508. [DOI] [PubMed] [Google Scholar]
- Axelsson P, Lindhe J. Efficacy of mouthrinses in inhibiting dental plaque and gingivitis in man. J Clin Periodontol. 1987;14:205–212. doi: 10.1111/j.1600-051x.1987.tb00968.x. [DOI] [PubMed] [Google Scholar]
- Coury A. Chemical and biochemical degradation of polymers. In: Ratner BD, Hoffman AS, Schoen FJ, Lemons JE, editors. Biomaterials science. 2nd. San Diego: Elsevier Academic Press; 2004. pp. 411–430. [Google Scholar]
- Coventry J, Newman HN. Experimental use of a slow release device employing chlorhexidine gluconate in areas of acute periodontal inflammation. J Clin Periodontol. 1982;9:129–133. doi: 10.1111/j.1600-051x.1982.tb01228.x. [DOI] [PubMed] [Google Scholar]
- De Moor RJ, Verbeeck RM, De Maeyer EA. Fluoride release profiles of restorative glass ionomer formulations. Dent Mater. 1996;12:88–95. doi: 10.1016/S0109-5641(96)80074-1. [DOI] [PubMed] [Google Scholar]
- Emilson CG. Potential efficacy of chlorhexidine against mutans streptococci and human dental caries. J Dent Res. 1994;73:682–691. doi: 10.1177/00220345940730031401. [DOI] [PubMed] [Google Scholar]
- Ferracane JL. Elution of leachable components from composites. J Oral Rehabil. 1994;21:441–452. doi: 10.1111/j.1365-2842.1994.tb01158.x. [DOI] [PubMed] [Google Scholar]
- Flotra L. Different modes of chlorhexidine application and related local side effects. J Periodontal Res Suppl. 1973;12:41–44. doi: 10.1111/j.1600-0765.1973.tb02162.x. [DOI] [PubMed] [Google Scholar]
- Göpferich A. Mechanisms of polymer degradation and erosion. Biomaterials. 1996;17:103–114. doi: 10.1016/0142-9612(96)85755-3. [DOI] [PubMed] [Google Scholar]
- Jeffcoat MK, Bray KS, Ciancio SG, Dentino AR, Fine DH, Gordon JM, et al. Adjunctive use of a subgingival controlled-release chlorhexidine chip reduces probing depth and improves attachment level compared with scaling and root planing alone. J Periodontol. 1998;69:989–997. doi: 10.1902/jop.1998.69.9.989. [DOI] [PubMed] [Google Scholar]
- Leung D, Spratt DA, Pratten J, Gulabivala K, Mordan NJ, Young AM. Chlorhexidine-releasing methacrylate dental composite materials. Biomaterials. 2005;26:7145–7153. doi: 10.1016/j.biomaterials.2005.05.014. [DOI] [PubMed] [Google Scholar]
- Michelsen VB, Lygre H, Skalevik R, Tveit AB, Solheim E. Identification of organic eluates from four polymer-based dental filling materials. Eur J Oral Sci. 2003;111:263–271. doi: 10.1034/j.1600-0722.2003.00033.x. [DOI] [PubMed] [Google Scholar]
- Örtengren U, Andersson F, Elgh U, Terselius B, Karlsson S. Influence of pH and storage time on the sorption and solubility behaviour of three composite resin materials. J Dent. 2001;29:35–41. doi: 10.1016/s0300-5712(00)00055-5. [DOI] [PubMed] [Google Scholar]
- Palmer G, Jones FH, Billington RW, Pearson GJ. Chlorhexidine release from an experimental glass ionomer cement. Biomaterials. 2004;25:5423–5431. doi: 10.1016/j.biomaterials.2003.12.051. [DOI] [PubMed] [Google Scholar]
- Patel MP, Cruchley AT, Coleman DC, Swai H, Braden M, Williams DM. A polymeric system for the intra-oral delivery of an anti-fungal agent. Biomaterials. 2001;22:2319–2324. doi: 10.1016/s0142-9612(00)00367-7. [DOI] [PubMed] [Google Scholar]
- Prakki A, Cilli R, Mondelli RF, Kalachandra S, Pereira JC. Influence of pH environment on polymer based dental material properties. J Dent. 2005;33:91–98. doi: 10.1016/j.jdent.2004.08.004. [DOI] [PubMed] [Google Scholar]
- Ribeiro J, Ericson D. In vitro antibacterial effect of chlorhexidine added to glass-ionomer cements. Scand J Dent Res. 1991;99:533–540. doi: 10.1111/j.1600-0722.1991.tb01066.x. [DOI] [PubMed] [Google Scholar]
- Riggs PD, Braden M, Patel M. Chlorhexidine release from room temperature polymerising methacrylate systems. Biomaterials. 2000;21:345–351. doi: 10.1016/s0142-9612(99)00187-8. [DOI] [PubMed] [Google Scholar]
- Sanders BJ, Gregory RL, Moore K, Avery DR. Antibacterial and physical properties of resin modified glass-ionomers combined with chlorhexidine. J Oral Rehabil. 2002;29:553–558. doi: 10.1046/j.1365-2842.2002.00876.x. [DOI] [PubMed] [Google Scholar]
- Santerre JP, Shajii L, Leung BW. Relation of dental composite formulations to their degradation and the release of hydrolyzed polymeric-resin-derived products. Crit Rev Oral Biol Med. 2001;12:136–151. doi: 10.1177/10454411010120020401. [DOI] [PubMed] [Google Scholar]
- Sideridou I, Tserki V, Papanastasiou G. Study of water sorption, solubility and modulus of elasticity of light-cured dimethacrylate-based dental resins. Biomaterials. 2003;24:655–665. doi: 10.1016/s0142-9612(02)00380-0. [DOI] [PubMed] [Google Scholar]
- Sreenivasan PK, Gittins E. The effects of a chlorhexidine mouthrinse on culturable microorganisms of the tongue and saliva. Microbiol Res. 2004;159:365–370. doi: 10.1016/j.micres.2004.08.002. [DOI] [PubMed] [Google Scholar]
- Wilson SJ, Wilson HJ. The release of chlorhexidine from modified dental acrylic resin. J Oral Rehabil. 1993;20:311–319. doi: 10.1111/j.1365-2842.1993.tb01613.x. [DOI] [PubMed] [Google Scholar]
- Yue IC, Poff J, Cortes ME, Sinisterra RD, Faris CB, Hildgen P, et al. A novel polymeric chlorhexidine delivery device for the treatment of periodontal disease. Biomaterials. 2004;25:3743–3750. doi: 10.1016/j.biomaterials.2003.09.113. [DOI] [PubMed] [Google Scholar]