

Abstract
Endogenous nitric oxide (NO) plays important physiological roles in the body. As a small diatomic molecule, NO has been assumed to freely diffuse in tissues with a diffusion rate similar to that in water. However, this assumption has not been tested experimentally. In this study, a modified Clark-type NO electrode attached with a customized aorta holder was used to directly measure the flux of NO diffusion across the aortic wall at 37°C. Experiments were carefully designed for accurate measurements of the apparent NO diffusion coefficient D and the partition coefficient α in the aortic wall. A mathematical model was presented for analyzing experimental data. It was determined that α = 1.15 ± 0.11 and D = 848 ± 45 μm2/s (n = 12). The NO diffusion coefficient in the aortic wall is nearly fourfold smaller than the reported diffusion coefficient in solution at 37°C, indicating that NO diffusion in the vascular wall is no longer free, but markedly dependent on the environment in the tissue where these NO molecules are. These results imply that the NO diffusion rate in the vascular wall may be upregulated and downregulated by certain physiological and/or pathophysiological processes affecting the composition of tissues.
Introduction
It is well known that nitric oxide (NO) is a potent vasodilator. Endothelium-derived NO, which plays an important role in regulating vascular tone, can diffuse from the endothelium of blood vessels in two directions: one direction toward the lumen of the blood vessel, and the other direction toward the vascular wall. The lumen of the blood vessel contains a large concentration of red blood cells (RBCs). It is known that the effective NO concentration in the vascular wall is not only dependent on the NO diffusion and reaction in the vascular wall, but also dependent on the rate of NO consumption by hemoglobin in the blood (1). During the past 10 years, much progress has been made in understanding the process of NO consumption and transport in the blood or in solution containing RBCs. Experimental observations and theoretical analyses have demonstrated that although each RBC contains nearly 20 mM heme and the rate of NO reaction with hemoglobin within RBCs is extremely rapid, the unstirred layer surrounding each RBC (2,3) greatly slows down the rate of NO transfer into the RBCs (4–6). Additionally, the cell free layer on the endothelium further reduces NO consumption (7,8). Such physical resistances limit the rate of NO consumption by the RBC-encapsulated hemoglobin. Theoretical analyses show that the NO concentration at the endothelium is primarily affected by the rate of NO generation from endothelial NO synthase, and the rate of NO consumption by RBCs in the lumen of blood vessels (1). The effective NO concentration in the vascular wall is proportional to the NO concentration at the endothelium surface. In principle, the effective NO concentration distribution in the vascular wall can be calculated from diffusion-reaction equation based on the NO concentration at the endothelium if the NO diffusion coefficient, consumption rate, and diffusion distance in the vascular wall are known (1,7,9–12). Many mathematical models have been proposed for the simulation of NO concentration profile in the vasculature (9,10,13–17). These theoretical studies with computer simulations largely extend the range of knowledge about the NO transport process in the vasculature where measurement of NO concentration distribution remains difficult with presently available techniques.
Compared to the rapid progress in the theoretical analysis on NO diffusion, experimental work in measuring important parameters related to NO diffusion and reactions in the vasculature is very limited. For example, in computer simulations, the NO diffusion coefficient in the vascular wall is one of the most important parameters, as it helps determine the time course of NO transport and the profile of NO concentration; however, this parameter has not been experimentally measured. To simulate NO diffusion process in the vascular system, researchers use the concept of free diffusion to assume that the NO diffusion coefficient in tissues is close to that obtained from buffer solutions (18–21). This assumption has not been tested yet. In this study, an electrochemical technique and experimental methods combined with computer simulations were developed to determine NO diffusion coefficient in the aortic wall, which enable us to directly test the concept of free diffusion.
Materials and methods
Isolation of rat aorta
WKY Rats were anaesthetized with pentobarbital (100 mg/kg, i.p.). A segment of thoracic aorta (∼3 cm in length) was rapidly dissected and placed into an ice-cold phosphate buffer solution (pH 7.4) of the following composition: 137 mM NaCl, 2.5 mM KCl, 0.9 mM CaCl2, 0.5 mM MgSO4, 1.5 mM KH2PO4, 0.8 mM Na2HPO4 and 5.6 mM glucose. The blood in the aorta was immediately flushed, and loosely adhered fat and connective tissue were removed. After the weight and length of the aorta was measured, the aorta was incubated in tissue buffer solution at 37°C for 3 × 20 min. After incubation, two short aortic rings (∼3 mm long) were cut from the two ends of the aortic segment to measure the thickness of the aortic wall. Then the remaining segment (∼2.4 cm) was cut into two aortic rings of equal length. Each ring was longitudinally opened and flatly placed on a modified Clark-type NO electrode with the endothelium, the inner cell layer of the aortic wall, facing the solution (Fig. 1 A). The use of animals and the animal protocol were approved by the Institutional Lab Animal Care and Use Committee of The Ohio State University.
Figure 1.
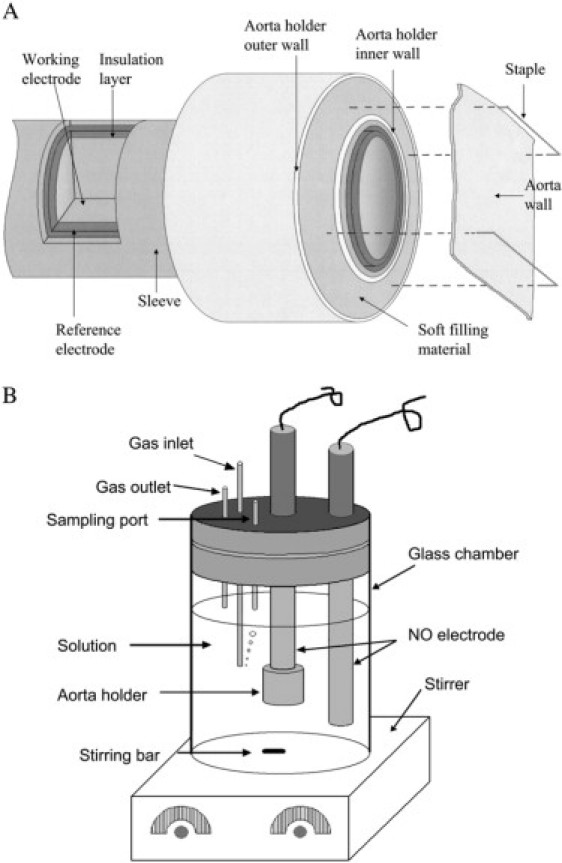
Experimental device for measuring NO diffusion coefficient in the aortic wall. (A) Clark-type NO electrode and the attached aorta holder. The top surface of the aorta holder is on the same plane with the tip of the Clark-type electrode so that the aortic wall can be flatly placed on the working electrode surface. (B) The experimental setup for measuring NO diffusion coefficient in the aortic wall. The Clark-type NO electrode with the aorta holder is used to detect NO that diffuses across the aortic wall, and the additional NO electrode is used to monitor NO concentration in the solution. The gas inlet port is used for bubbling argon or N2 gas into the solution to remove O2. The gas outlet port allows oxygen to go out of the chamber. The sampling port is used for adding NO stock solution to chamber by a Hamilton syringe with a bolus injection.
Measurements of aortic wall thickness
Aortic wall thickness was measured under a Precision Stereo Zoom Trinocular Microscope (World Precision Instruments, Sarasota, FL) equipped with a color video camera. The images captured by the camera can be output to a TV monitor directly or output to a computer through a composite/USB converter. To clearly observe the aortic section, the two short aortic rings (∼3 mm long) were immersed into staining solution (0.1% Evans Blue dye) for ∼20 s. Each ring was then cut into two 1.5-mm-long rings and placed on the plate under the microscope. The aortic wall was aligned perpendicular to the plate with the fresh-cut surface facing upward. A scale with known length was placed under the aortic wall. After regulating the microscope to clearly show the cross section of the aorta on the computer screen, a picture was taken. From the picture, the wall thicknesses at five different locations on the cross section of the aortic ring were measured. The same protocol was performed on the other short aortic ring to obtain the other five readings of wall thicknesses. The final wall thickness was given by the mean and standard error from the 10 readings.
Experimental device for measuring the flux of NO diffusion across the aortic wall
In Fig. 1 A, we demonstrate a modified Clark-type NO electrode and its inner structure. The modified Clark-type NO electrode was constructed in the form of coaxial cylinders. The cylinders (from the core to outside) were composed of a working electrode, an insulation layer, a counter electrode, and an outer sleeve. The space between the counter electrode and the outer sleeve was filled with an electrolyte solution. Unlike the conventional Clark-type electrode, the modified Clark-type NO electrode did not contain a gas-permeable membrane at the tip of the electrode. An aorta holder was installed outside of the modified Clark-type electrode. The tip surface of the modified Clark-type electrode was aligned on the same plane with the surface of aorta holder. The aorta holder was constructed with an inner wall, an outer wall, and a soft filling material (shown in pink) between the two walls. A metal pin could be easily inserted into the soft material for fixing the aortic wall. To measure NO diffusion across the aortic wall with the modified Clark-type NO electrode, a segment of the aortic wall was flatly placed on the surface of the working electrode and the aorta holder. Two staples were used to pin the aortic wall on the aorta holder. Since the gas-permeable membrane was removed, the aortic wall directly contacted the surface of the working electrode. To the best of our knowledge, there are no published results showing that NO diffusion coefficient in the aortic wall can be affected significantly by opening the aorta. Therefore, we have assumed that the NO diffusion coefficient in the aortic wall does not change by opening the aortic ring.
The experimental setup for measuring the NO diffusion across the aortic wall is shown in Fig. 1 B. Two modified Clark-type NO electrodes were placed in a water-jacketed (not shown in the figure) chamber at 37°C. The modified Clark-type NO electrode with aorta holder was used to measure NO diffusion across the aortic wall while the other modified electrode (without the aorta holder) monitored the NO concentration in the solution. A cap that permitted the addition of samples or the purging of argon or N2 gases into the solution enclosed the chamber. To measure the flux of NO diffusion coefficient in the aortic wall, a certain amount of NO stock solution was taken by a Hamilton syringe (Fisher Scientific, Hanover Park, IL) and added into the chamber with a bolus injection. The NO concentration in the stock solution is ∼2 mM, which was prepared using the method described in the literature (10,22). Since the solution in the chamber was rapidly stirred by a magnetic stir throughout the experiment, the added NO was rapidly distributed in the solution and was rapidly diluted to the desired concentration. Because the current recorded by the electrode is proportional to the flux of NO diffusion, we use the current at the electrode to represent the flux of NO diffusion across the aortic wall, or vice versa.
Measurement of oxygen permeability in contact lens
Contact lens (Biomedics 55, Ocular Sciences, Concord, CA) with known oxygen permeability Dk were used to validate our experimental device described above. The value of Dk claimed by the company is 19.7 × 10⁻¹¹ (cm2/s)[ml O2/(mmHg × cm3)]. In the experiment, the central portion of a contact lens was placed on the electrode by use of the aorta holder. The potential of the electrode was held at the potential region of the diffusion-limited current for the reduction of O2 to H2O. Electrode currents were recorded with CHI 800 Electrochemical Analyzer (CH Instruments, Austin, TX). Before the experiments, O2 in the solution was removed by bubbling N2 into the solution. After the baseline of the electrode with the lens was stabilized under anaerobic conditions, the N2 gas flow was closed and 10% O2 gas was bubbled into the solution for ∼10 min. The current at the electrode, which is proportional to the O2 flux at the electrode surface or proportional to the O2 permeability in the contact lens, increased and reached a current plateau in ∼5 min. After the current plateau was reached, N2 was bubbled into the solution again to remove O2 in the solution until the current was back to the baseline.
Mathematical model for NO diffusion-reaction in the aortic wall
Assuming that NO consumption in the aortic wall follows first-order kinetics, NO diffusion across the aortic wall on the modified NO Clark-type electrode can be described by
| (1) |
| (2) |
| (3) |
| (4) |
where D and α are NO diffusion coefficient and partition coefficient in the aortic wall, respectively; L is the thickness of the aortic wall, and cs is NO concentration in the buffer solution. The interface between the working electrode tip and the aortic wall is at x = 0, and the interface between the aortic wall and the solution is at x = L. The Clark type NO electrodes were connected to a Free Radical Analyzer 4000 (World Precision Instruments). For detecting NO, the instrument applies a positive potential on the electrode to oxidize all NO that reaches the electrode surface. Under this condition, NO concentration on the electrode surface, ce, would be much smaller than cs. Thus it is usually assumed that ce = 0 at x = 0 because the ratio ce/cs is very close to 0. Solving Eqs. 1–4 gives
| (5) |
The current at the electrode can be obtained from Eq. 5,
| (6) |
where N is the number of electrons taking part in the electrochemical oxidation of NO on the working electrode, F is the Faraday constant, and S is the surface area of the working electrode. When the diffusion reaches steady-state (t→∞), Eqs. 5 and 6 change into
| (7) |
| (8) |
where id is the diffusion-limited current. Comparison of Eq. 6 with 8 yields
| (9) |
The normalized current i/id is a function of D/L2, k1, and t. If the current at the working electrode is obtained experimentally, we can use the calculated normalized i/id at different D/L2 and k1 to fit the experimental normalized current I/Id with the least-square method,
| (10) |
where I and Id are the experimental current and the experimental diffusion-limited current, respectively. If NO is not consumed in the aortic wall (i.e., k1 = 0), then Eq. 9 can be simplified as
| (11) |
where id0 is the diffusion-limited current at k1 = 0,
| (12) |
In this case, D/L2 is the only undetermined parameter in Eq. 11. After D/L2 is determined from experimental curves, D can be further determined because L can be measured under a microscope separately. Since N, F, S, L, cs, and id0 are already known or measured, α can be easily obtained from Eq. 12.
Results
Validation of the experimental device for measuring the flux of NO diffusion across the aortic wall
To the best of our knowledge, there is no commercial material with a known NO diffusion coefficient that is suitable to be placed on the electrode similar to the aortic wall. However, there are many commercial materials such as contact lenses, which have known oxygen permeability and thicknesses (∼100 μm) that are comparable to the thickness of aortic walls (100–200 μm). To confirm the accuracy of our experimental device (Fig. 1), we performed experiments to measure the flux of O2 across a section of contact lens (Biomedics 55) with a known Dk. The experiments were performed at 35°C. A typical experimental curve is demonstrated in Fig. 2. It can be seen that when the oxygen partial pressure increases from 0 to 76 mmHg (10% O2), the oxygen current at the electrode increases with time and reaches its plateau in ∼5 min. When the O2 gas flow is closed and N2 is bubbled into the solution to remove O2, the current at the electrode returns back to the baseline. From the experimentally measured O2 current (Ioxy), we can determine the oxygen permeability using the formula
| (13) |
Figure 2.
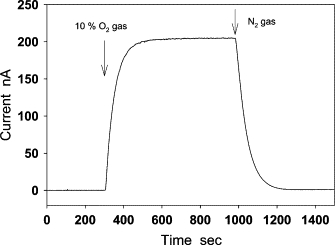
Measurement of O2 diffusion across a piece of contact lens (Biomedics 55) at 35°C. The central part of a contact lens was placed on the modified Clark-type electrode with the aorta holder. This electrode can be used for measuring O2 diffusion flux by setting the potential of the electrode in the potential region of diffusion-limited current for the reduction of O2 to H2O. After the baseline of the electrode was stabilized, 10% O2 gas was bubbled into the solution. The O2 current increased and reached a plateau in ∼5 min. By closing the O2 gas and bubbling N2 into the solution, O2 in the solution was removed, and the O2 current was back to the baseline.
where L is the thickness of the contact lens and PO2 is the oxygen partial pressure. The thickness of the lens was 104 ± 1 μm, which was measured under the microscope. The mean and standard error of Dk determined from our experimental data is 20.9 ± 1.2 (cm2/s)(ml O2/ml × mmHg), which is close to the value 19.7 (cm2/s)(ml O2/ml × mmHg) that is claimed by the company.
Response current of the modified Clark-type NO electrode to a sudden change of NO concentration
Four typical experimental curves are shown in Fig. 3. They were recorded by modified Clark-type NO electrodes with and without the aortic wall under aerobic and anaerobic conditions. In the absence of aortic wall, the response current (curves a and a′) of the modified Clark-type NO electrode to an immediate change in NO concentration (3 μM) was extremely fast, and reached the diffusion-limited current within 0.2 s. The peak of the two current curves exhibited little difference. However, after the attachment of the aortic wall, the peak heights of the two response currents (curves b and b′) were significantly different. The current recorded under aerobic conditions (b′) was 2–3 times smaller than the one recorded under anaerobic conditions (b). Moreover, under anaerobic conditions, the peak height of the current (curve b) recorded by the aorta-covered electrode was ∼10–13 times smaller than that (curve a) recorded by the electrode without aorta covering. Comparison of curve b with curve b′ shows that oxygen can markedly affect the flux of NO diffusion across the aortic wall. To eliminate the effect of oxygen on measurements of NO diffusion across the aortic wall, all of the following experiments were performed under anaerobic conditions.
Figure 3.
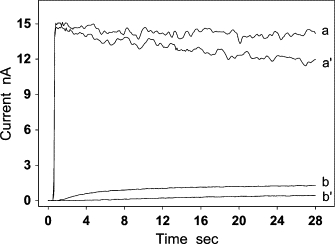
The response currents of the modified Clark-type NO electrode without (a and a′) and with (b and b′) the aortic wall. Experiments were performed under anaerobic (a and b) and aerobic (a′ and b′) conditions. After 3 μM NO was injected into the solution, the current of the electrode reached the diffusion-limited current plateau in ∼0.2 s at the uncovered electrode (a and a′). In contrast, when the electrode was covered by a piece of aortic wall, a delay of >15 and 25 s was observed upon reaching the limit current under anaerobic conditions (b) and aerobic conditions (b′), respectively.
The flux of NO diffusion across the aortic wall under anaerobic conditions
The modified Clark-type NO electrode was used in measuring the flux of NO diffusion across the aortic wall under anaerobic conditions. NO (3 μM) was repeatedly added to the solution five times in a short time interval. The addition of NO produced a five-step current curve with a staircase-shape (not shown). To compare the current response to each single NO injection, we used the time and the current at the NO injection as the initial time (t = 0) and the initial current (I = 0) to put all the five single-step curves together. In this way, we observed that all single-step current curves overlapped except the one measured at the first NO addition (Fig. 4). The curve at the first NO injection (curve a) had a relatively long lag time (∼2.5 s). During the lag time, the modified Clark-type NO electrode could not detect any NO flux (the current at the electrode was nearly zero). The lag time of other current curves from the second NO addition to the fifth NO addition was reduced to ∼1.5 s. As these curves overlap, only two of them are shown in Fig. 4 (curves b and c). These results suggest the existence of anaerobic NO consumption in the aortic wall. Since the last four single-step current curves showed no appreciable difference, it might indicate that the anaerobic NO consumption had been eliminated by the first addition of NO. By assuming that the rate of NO consumption in the aortic wall from the second to the fifth NO addition was small enough to be ignored, we used the least-square method defined by Eq. 10 to determine NO diffusion coefficient D based on Eq. 11 (Fig. 5). The calculation was performed on a personal computer with a program written in MatLab 7.0. In the calculation of Eq. 10, the normalized current I/Id was obtained from an experimental current curve, and the normalized i/id0 was calculated from Eq. 11 at different D. The thickness of the aortic wall, L, in Eq. 11 was previously measured under a microscope. The NO diffusion coefficient was determined from the normalized current i/id0 that was the best-fitting curve to the normalized experimental current I/Id. After D was obtained, the NO partition coefficient α was calculated from the experimentally measured diffusion-limited current using Eq. 12. For the experimental curve shown in Fig. 5, L was measured to be 163 ± 4 μm; D and α were determined to be 880 μm2/s and 1.1, respectively. The mean and standard deviation of NO diffusion coefficients and NO partition coefficients determined are 848 ± 45 μm2/s and 1.15 ± 0.11 (n = 12), respectively.
Figure 4.
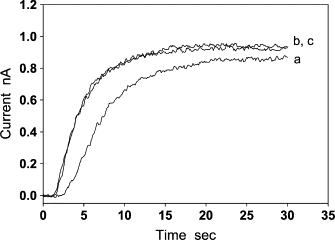
The flux of NO diffusion across the aortic wall under anaerobic conditions. When NO was repeatedly added into the solution in a short interval, the current curve recorded after the first NO addition had a lag time of ∼2.5 s (a). The current curves recorded from the second to the fifth NO additions overlap, so only two of them are shown (b and c). The lag time of these curves was reduced to ∼1.5 s, and the shape of these curves is significantly different from curve a.
Figure 5.
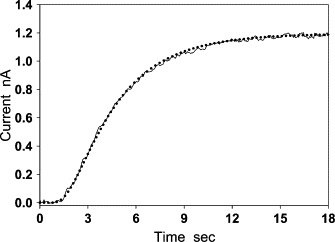
Determination of NO diffusion coefficient D and partition coefficient α from experimental curves. The current curve (solid line) was obtained by the modified Clark-type NO electrode covered with a segment of aortic wall (L = 163 ± 4 μm). The dotted line is the best-fitting curve calculated using Eqs. 10–12. The diffusion coefficient and partition coefficient determined from the best-fitting procedure are D = 880 μm2/s, α = 1.1. The mean and standard derivations of the two parameters are D = 848 ± 45 μm2/s and α = 1.15 ± 0.11 (n = 12).
In the above data analyses, we assumed that the rate of NO consumption in the aortic wall under anaerobic conditions was small enough to be ignored. To test whether this assumption is true, a mathematical analysis was used to examine how the vascular NO consumption affects the flux of NO diffusion across the aortic wall, and an experimental method was developed to identify whether a small NO consumption existed in the aortic wall.
The effect of vascular NO consumption on the flux of NO diffusion across the aortic wall
We performed computer simulations based on Eq. 6 using the following parameters: D = 850 μm2/s, α = 1, L = 160 μm, cs = 3 μM, and k1 = 0, 0.015, 0.060, and 0.300 s−1. It was shown that the diffusion-limited current plateau could also be seen when NO was consumed in the aortic wall (k1 ≠ 0). However, the diffusion-limited current rapidly decreased as the first-order rate constant k1 increased (Fig. 6 A). From the normalized current, it can be seen that the time to reach the diffusion-limited current plateau was markedly reduced as k1 increased (Fig. 6 B). These differences in shapes and amplitude of current curves can be used to identify the possible vascular NO consumption. We demonstrate two current curves in Fig. 6, C and D. The solid lines were simulated by using Eqs. 8 and 9 assuming that NO was consumed in the aortic wall with a rate constant k1 = 0.300 s−1 (Fig. 6 C) and k1 = 0.015 s−1 (Fig. 6 D). Other parameters chosen were the same as those used in Fig. 6 A. We then used the curves calculated from Eq. 11 assuming no vascular NO consumption (k1 = 0) to fit the two solid curves with the least-square method. The dotted lines in Figs. 6, C and D, were the best-fitting curves. It can be seen that the two curves in Fig. 6 C have appreciable difference in their shapes. The apparent diffusion coefficient D determined from the best-fitting curve was 1237 μm2/s, which is 46% greater than the original value of D (850 μm2/s) used in the simulation of the solid line. The apparent partition coefficient α determined from the best-fitting curve was 0.21, which is ∼5 times smaller than the original partition coefficient (α = 1) used in the simulation of the solid line. In contrast, when k1 is reduced to 0.015 s−1 (Fig. 6 D), the two curves almost overlap. The apparent D- and α-values determined from the best-fitting curve were 874 μm2/s and 0.90, respectively. Both the apparent parameters were close to the values of original parameters used in the simulation with a relative error of 2.8% in the apparent D and 10% in the apparent α. Since the best-fitting curve is almost the same as curve b at the small k1, it becomes difficult to tell whether a small vascular NO consumption exists in the aortic wall solely based on the best-fitting result. Therefore, a more sensitive experimental method was developed for identifying this small NO consumption as described below.
Figure 6.
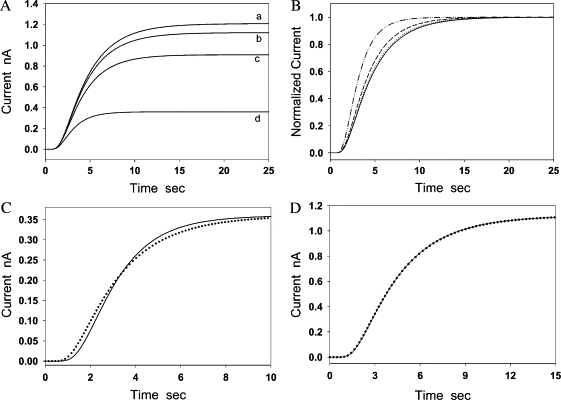
Simulations of the flux of NO diffusion across the aortic wall in the presence/absence of vascular NO consumption. (A) Current curves were calculated from Eq. 6 at four different values of k1 (0, 0.015 s−1, 0.06, and 0.3 s−1). Other parameters were the same in calculations for the four curves, which were D = 850 μm2/s, α = 1, L = 160 μm, and cs = 3 μM. (B) The four curves were obtained by converting the four curves in panel A into normalized currents. (C) The solid line was calculated from Eqs. 8 and 9, assuming k1 = 0.3 s−1. Other parameters used in the calculation of the two curves were D = 850 μm2/s, α = 1, L = 160 μm, and cs = 3 μM. Current curves calculated from Eqs. 11 and 12 (k1 = 0) with different D and α were used to fit the solid line (k1 = 0.3 s−1) based on the least-square method. The dotted line was the best-fitting curve. The parameters determined from the best-fitting curve were D = 1237 μm2/s, α = 0.205. (D) The solid line was obtained from Eqs. 8 and 9, assuming k1 = 0.015 s−1. Other parameters used in the calculation of the two curves were D = 850 μm2/s, α = 1, L = 160 μm, and cs = 3 μM. Current curves calculated from Eqs. 11 and 12 with different D- and α-values assuming k1 = 0 were used to fit the solid line based on the least-square method. The dotted line was the best-fitting curve that matches with the solid line very well. From the best-fitting curve, it was determined that D = 874 μm2/s and α = 0.90.
The flux of NO diffusion across two layers of aortic wall
To examine potential vascular NO consumption in the aortic wall, we observed how the thickness of diffusion layers affects the flux of NO diffusion across the aortic wall in the presence/absence of vascular NO consumption by computer simulations. The effect of vascular NO consumption on the distribution of NO concentration and the flux of NO diffusion in the aortic wall is shown in Fig. 7, A and B, respectively. It can be seen that when k1 = 0 (no vascular NO consumption), NO concentration has a linear distribution in both the single aortic wall and the double aortic walls (curves a and a′ in Fig. 7 A). With the increase of k1, NO concentration in the aortic wall appreciably deviates from the linear distribution and the slope of NO concentration curve at x = 0 markedly decreases. In Fig. 7 B, we demonstrated how the flux of NO diffusion across the single-layer aortic wall (IS) and the double-layer aortic wall (ID) changes with k1. The predicted ID at k1 = 0 is 50% of IS. In other words, 1/2 is the theoretical value of the ratio ID/IS, assuming k1 = 0. The ratio ID/IS markedly decreases as k1 increases. To quantify the extent of the flux ratio ID/IS deviating from the theoretical value 1/2 when k1 > 0, we used the following formula to calculate the relative deviation from the theoretical value:
| (14) |
Figure 7.
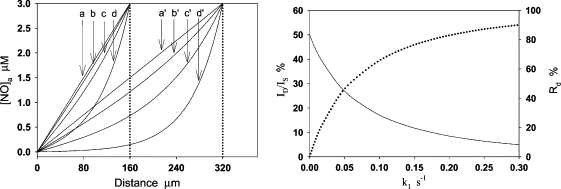
NO concentration distribution and the flux of NO diffusion in a single-layer aortic wall and double-layer aortic walls at different k1. (A) NO concentration has a linear distribution in both the single and double aortic walls at k1 = 0 (a and a′). The concentration significantly deviates from the linear distribution as k1 increases: k1 = 0.015 s−1 (b and b′), 0.06 s−1 (c and c′), and 0.3 s−1 (d and d′). At the same k1, the change of NO concentration distribution in the double-layer aortic walls is markedly greater than the corresponding ones in the single-layer aortic wall. (B) Fluxes of NO diffusion across the single-layer aortic wall and double-layer aortic walls, which are represented by IS and ID, respectively. The predicted flux ratio ID/IS is 0.5 and the relative deviation (Rd) is 0 at k1 = 0. Then, ID/IS (solid line) rapidly decreases and Rd (dotted line) rapidly increases as k1 increases. At k1 = 0.015 s−1, ID/IS decreases to 40%, and Rd increases to 20%.
As shown in Fig. 7 B (dotted line), Rd largely increases while k1 increases. It can be seen from Fig. 7 A that, at k1 = 0.015 s−1, NO concentration distribution slightly deviated from the linear distribution in the single aortic wall; however, it markedly deviated from the linear distribution in the double-layer aortic walls. Thus, Rd is no longer a value close to 0, but rapidly increases with k1. At k1 = 0.015 s−1, Rd is ∼20%. The relatively larger Rd can be easily identified from the experimental current curves. This simulation indicates that the effect of a small vascular NO consumption on the NO flux in the vascular wall can be magnified by doubling the wall thickness. Based on this result, we designed an experiment to directly measure the flux of NO diffusion across the single-layer aortic wall and the double-layer aortic wall. In the experiment, two pieces of aortic walls were transversely cut from the middle of a segment of aortic wall so that the two pieces of aortic wall have almost the same thickness. It was observed that the measured ID/IS is 0.48 ± 0.01 (n = 6), so Rd is only 4%, which is much smaller than the predicted Rd (20%) at k1 = 0.015 s−1 (Fig. 8), indicating that the vascular NO consumption in the aortic wall was small enough to be ignored under the anaerobic experimental conditions in our measurements.
Figure 8.
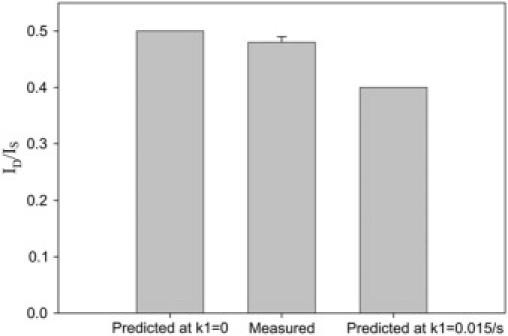
The predicted and measured current ratios ID/IS. The predicted current ratio at k1 = 0.015 s−1 is 20% smaller than the current ratio at k1 = 0. The measured ratio is 0.48 ± 0.01 (n = 6), which is close to the predicted ID/IS at k1 = 0.
In the above simulation, we assumed that D and k remain the same in different cell layers of the aortic wall; however, it is very likely that the two parameters vary from cell layer to cell layer as reported for O2 (23,24). Thus, the actual NO concentration distribution curve would not appear smooth as shown in Fig. 7 A. Instead, an appreciable difference in NO concentration gradient may exist at the interface between two cell layers (endothelium/smooth muscle and smooth muscle/adventitia). Therefore, we should consider the NO concentration distribution curves in Fig. 7 A as the average NO concentration distribution in the whole aortic wall.
The inhibition of anaerobic NO binding/consumption is helpful in simplifying mathematical analysis of the NO diffusion process in the aortic wall. If the anaerobic NO binding/consumption rate cannot be ignored and the reaction rate is not zero-order or first-order, we may need to deal with a nonlinear diffusion-reaction equation. However, although an accurate analytical solution of the nonlinear diffusion-reaction equation may not be obtained, the diffusion-reaction equation can still be solved by numerical methods.
Discussion
The vascular wall consists of three main cell layers. The endothelium is the inner lining composed mostly of endothelial cells. Surrounding the endothelial layer is the smooth muscle layer followed by the outer adventitial layer, composed of supportive collagen fibers. For dilation to occur, it is necessary for the endothelium-derived NO to diffuse from the endothelium into the smooth muscle cells to activate soluble guanylate cyclase.
The modified Clark-type NO electrode with an aorta holder (Fig. 1) can be used in measuring the flux of NO diffusion across the aortic wall. After validation of our experimental device by contact lenses (Fig. 2), we measured the flux of NO diffusion across the aortic wall. It was observed that oxygen concentration will markedly change the flux of NO diffusion across the aortic wall (curves b and b′ in Fig. 3). It is well known that NO can be directly oxidized by oxygen. However, the rate of NO autoxidation (directly reacting with oxygen), which is second-order with respect to [NO] (25–27), is very small when NO concentration is at physiological range (1 nM to 1 μM). Although the NO oxidation can be accelerated in biological membranes (28), the accelerated oxidation rate is still too small to be counted as a significant factor of vascular NO consumption. It was reported that NO consumption by several types of cells is dependent on oxygen, but the consumption is not caused by the direct reaction between NO and oxygen (10,29). Our results indicate that this oxygen-dependent NO consumption also occurs in the vascular wall.
When experiments were performed under anaerobic conditions, it was observed that the current of the electrode without the aortic wall (curve a in Fig. 3) is ∼10–13 times greater than that with the aortic wall (curve b in Fig. 3). This indicates that the aortic wall is the major diffusion layer responsible for almost all reduction in NO concentration from the bulk solution to the electrode surface. Therefore, a mathematical model for the single diffusion layer was used for analyzing experimental data. By repeatedly adding 3 μM NO into the solution, we observed an oxygen-independent NO consumption in the aortic wall (Fig. 4), which was inhibited after the first NO addition. Since NO can bind to some proteins such as soluble guanylate cyclase (30–32) and cytochrome c oxidase (33), it is likely that this oxygen-independent NO consumption was caused by the binding of NO to these proteins. After these proteins become saturated with NO, no more NO could be further bound in the aortic wall, so the anaerobic NO consumption was inhibited. Although the oxygen-independent NO consumption was inhibited in our experiments for measurements of NO diffusion coefficient D and partition coefficient α, it should be noted that D and α can be determined in the presence of NO consumption. This has been well demonstrated in determining O2 diffusion coefficient and partition coefficient in tissues.
To test whether any other uninhibitable NO consumption exists in the vascular wall under the anaerobic conditions from the second to the fifth NO addition, we designed a specific experiment to measure the flux of NO diffusion across double-layer aortic walls and compared the result with the one predicted from computer simulation assuming k1 = 0 and the one assuming k1 = 0.015 s−1, a small rate constant that would cause a measurement error <10% in determining D and α (Fig. 6 D). It was demonstrated that the measured NO flux was very close to the one predicted at k1 = 0 (Fig. 8), indicating that the measurement error caused by an uninhibitable vascular NO consumption should be much <10% if the uninhibitable vascular NO consumption still existed in the aortic wall.
After eliminating the oxygen-dependent and independent NO consumption, the NO diffusion coefficient D and partition coefficient α were determined as 848 μm2/s and 1.1 (Fig. 5), respectively. Since α is close to one, the apparent NO solubility in the aortic wall should be close to that in water or in the buffer solution. In published mathematical models, researchers have assumed that NO partition coefficient is equal to one (7–9,14,34,35). Our experimental results provide supporting evidence for this assumption.
NO is one of the smallest neutral molecules, making NO one of fastest molecules to diffuse in water. It has been assumed that NO diffusion in tissues should be as fast as NO diffusion in water. However, this assumption has not been tested although it seems reasonable because tissues contain nearly 70% water. It was reported that the NO diffusion coefficient in RBC membrane at 20°C is 400 μm2/s (21), whereas the reported NO diffusion coefficients in water or buffer solution range from 2000 to 4500 μm2/s at the same temperature (21,36). This indicates that the NO diffusion coefficient in RBC membrane is several times smaller than in the water or buffer solution. The small diffusion coefficient in cell membrane implies that NO diffusion is not always as fast as in water or in the buffer solution. However, the small NO diffusion coefficient in cell membranes may not have a significant effect on the rate of NO diffusion through the cell because the thickness of cell membrane (∼10 nm) is only 1/1000 of the thickness of a cell (∼10 μm). Thus, it is necessary to consider the NO diffusion resistance in the cytoplasm. Although there is no published experimental data about NO diffusion coefficient in the cytoplasm to date, the diffusion coefficient of O2 in the solution containing proteins has been measured experimentally. Since O2 is a small diatomic molecule similar to NO, their diffusivity in different mediums should be comparable. It was reported that O2 diffusion coefficient in the water containing 30–40 g/100 mL metmyoglobin or hemoglobin, which is comparable with the hemoglobin content in the cytoplasm of RBCs, is ∼3–4 times smaller than that in pure water (37,38). Therefore, like O2, NO diffusion coefficients in RBCs or in the solution containing a large amount of proteins should be severalfold smaller than that in the pure water. It is worth noting that a value of 880 μm2/s for the NO diffusion coefficient inside RBCs has been adopted by several research groups in computer simulations (14,15,39). Furthermore, by using recessed O2 microelectrodes, it was observed that D for O2 in the intimal side and in the adventitial side of the aortic wall at 37°C were 23.6% and 37.2% relative to D for O2 in saline, respectively (24), indicating that D for O2 in the aortic wall is ∼3–5 fold smaller than that in water.
Strong evidence has shown that the slow diffusion rate of molecules in cells is a general phenomenon. In all mammalian cells, the cytoplasm is crowded with large molecules such as proteins, nucleic acids, and complex sugars (40–42). Thus, the cytoplasm is no longer a simple dilute solution but instead, a gelatinous mass within a network of cytoskeletal filaments (27). In this intracellular environment, it was observed that the diffusion coefficient of small molecules in cytoplasm (Dcyto) compared to the diffusion coefficient in water (Dwater) can be reduced severalfold, and the size of the small molecules has little effect on the ratio Dcyto/Dwater (42). The slow diffusion rate can be caused by different factors including fluid phase viscosity, binding, and crowding (43). Among these factors, crowding may be responsible for the major drop in diffusion coefficient (42,44,45).
Our results show that the apparent NO diffusion coefficient in the aortic wall at 37°C is approximately fourfold smaller than the published data in water or buffer solution (18–20). Thus, the slow rate of NO diffusion also occurs in the tissue level. Since crowding is not only limited in cellular interiors, but also occurs in the interstitial space between cells in the tissue, it is possible that the rate of NO diffusion in the vascular wall is slow in both the intracellular and the extracellular space.
The difference between NO diffusion coefficients in the aortic wall and in the water indicates that the NO diffusion coefficient is markedly dependent on the environment in the medium where the NO molecules act. This may imply that the NO diffusion rate in the vascular wall can be upregulated and downregulated by certain physiological and/or pathophysiological processes affecting the composition of tissues. For example, NO bioavailability is reduced in the development of atherosclerosis. Atherosclerosis is a disease of large and midsize arteries, which is caused by a buildup of plaque in the inner lining of an artery. Plaque is made up of deposits of fatty substances, cholesterol, cellular waste products, calcium, and fibrin (46,47). In atherosclerosis, the arterial wall becomes thickened, loses its elasticity, and reduces its ability to supply blood to tissues. This biochemical composition of the plaque is distinctly different from the normal vascular wall. The rate of NO diffusion through the plaque should be also different from that through the normal vessels. Furthermore, the thickened arterial wall will force NO to diffuse a longer distance to the smooth muscle cells in the arterial wall, and the enhanced superoxide production in the development of atherosclerosis (48) will accelerate NO consumption on its diffusion pathway. Thus, the reduced NO bioavailability in the development of atherosclerosis is not simply due to the raised consumption rate by reacting with superoxide as generally thought in literature, but a consequence caused by the combination of changes in the consumption rate, diffusion rate, and the distance between the NO source and the NO target. NO is considered as an antiatherogenic molecule (49). The lack of NO bioavailability results in the accelerated development of atherosclerosis (50).
The modified Clark-type NO electrode cannot be directly used to measure the flux of NO diffusion across the wall of small resistance artery because the size of these resistance arteries is too small. The techniques and methods used for direct measuring the flux of NO diffusion across the small resistance arterial wall are under development in our laboratory. However, it is still instructive to use the NO diffusion coefficient obtained from aortas in simulating NO diffusion process in different sizes of blood vessels. For the rat aortic wall, if we assume that D = 850 μm2/s, k = 0.9/s (a value in the range reported in literature(10)), NO concentration at endothelial surface c = 1 μM, and the wall thickness L = 160 μm, it can be calculated that when NO diffuses to the adventitial surface, its concentration will drop to ∼5 nM. In contrast, for the small resistance artery, if we use all the parameters for the aorta except assuming the wall thickness to be L = 25 μm, it can be calculated that the NO concentration at the adventitial surface will be as high as 440 nM. This value is ∼50% of the NO concentration at the endothelial surface. This indicates that the endothelium-derived NO in resistance arteries can affect not only these small arteries but also their surrounding tissues and microvessels. However, the affected range of NO can be regulated by the parameter k/D. The NO diffusion distance will be shorter for a greater consumption rate constant k and/or a smaller diffusion coefficient D.
In summary, the newly developed technique and experimental methods combined with computer simulations enable us to test the concept of free diffusion. It was observed that the NO diffusion coefficient in the aortic wall is approximately fourfold smaller than that in the water. This small NO diffusion coefficient suggests that NO diffusion rate can be regulated in the vascular wall and may vary with age and in the development of vascular diseases.
Acknowledgments
The authors thank Dr. Schaeffer for providing us the sample contact lens (Biomedics 55).
This work is partially supported by the National Science Foundation under agreement No. 0112050, and National Institutes of Health grants No. HL-38324, HL-63744, and HL-65608.
Footnotes
Editor: Jason M. Haugh.
References
- 1.Lancaster J.R., Jr. Simulation of the diffusion and reaction of endogenously produced nitric oxide. Proc. Natl. Acad. Sci. USA. 1994;91:8137–8141. doi: 10.1073/pnas.91.17.8137. [DOI] [PMC free article] [PubMed] [Google Scholar]
- 2.Coin J.T., Olson J.S. The rate of oxygen uptake by human red blood cells. J. Biol. Chem. 1979;254:1178–1190. [PubMed] [Google Scholar]
- 3.Huxley V.H., Kutchai H. The effect of the red cell membrane and a diffusion boundary layer on the rate of oxygen uptake by human erythrocytes. J. Physiol. 1981;316:75–83. doi: 10.1113/jphysiol.1981.sp013773. [DOI] [PMC free article] [PubMed] [Google Scholar]
- 4.Liu X., Miller M.J., Joshi M.S., Sadowska-Krowicka H., Clark D.A., Lancaster J.R., Jr. Diffusion-limited reaction of free nitric oxide with erythrocytes. J. Biol. Chem. 1998;273:18709–18713. doi: 10.1074/jbc.273.30.18709. [DOI] [PubMed] [Google Scholar]
- 5.Vaughn M.W., Huang K.T., Kuo L., Liao J.C. Erythrocytes possess an intrinsic barrier to nitric oxide consumption. J. Biol. Chem. 2000;275:2342–2348. doi: 10.1074/jbc.275.4.2342. [DOI] [PubMed] [Google Scholar]
- 6.Azarov I., Huang K.T., Basu S., Gladwin M.T., Hogg N., Kim-Shapiro D.B. Nitric oxide scavenging by red blood cells as a function of hematocrit and oxygenation. J. Biol. Chem. 2005;280:39024–39032. doi: 10.1074/jbc.M509045200. [DOI] [PubMed] [Google Scholar]
- 7.Vaughn M.W., Kuo L., Liao J.C. Effective diffusion distance of nitric oxide in the microcirculation. Am. J. Physiol. Heart Circ. Physiol. 1998;274:H1705–H1714. doi: 10.1152/ajpheart.1998.274.5.H1705. [DOI] [PubMed] [Google Scholar]
- 8.Butler A.R., Megson I.L., Wright P.G. Diffusion of nitric oxide and scavenging by blood in the vasculature. Biochim. Biophys. Acta. 1998;1425:168–176. doi: 10.1016/s0304-4165(98)00065-8. [DOI] [PubMed] [Google Scholar]
- 9.Buerk D.G., Lamkin-Kennard K., Jaron D. Modeling the influence of superoxide dismutase on superoxide and nitric oxide interactions, including reversible inhibition of oxygen consumption. Free Radic. Biol. Med. 2003;34:1488–1503. doi: 10.1016/s0891-5849(03)00178-3. [DOI] [PubMed] [Google Scholar]
- 10.Thomas D.D., Liu X., Kantrow S.P., Lancaster J.R., Jr. The biological lifetime of nitric oxide: implications for the perivascular dynamics of NO and O2. Proc. Natl. Acad. Sci. USA. 2001;98:355–360. doi: 10.1073/pnas.011379598. [DOI] [PMC free article] [PubMed] [Google Scholar]
- 11.Tsoukias N.M., Popel A.S. Erythrocyte consumption of nitric oxide in presence and absence of plasma-based hemoglobin. Am. J. Physiol. Heart Circ. Physiol. 2002;282:H2265–H2277. doi: 10.1152/ajpheart.01080.2001. [DOI] [PubMed] [Google Scholar]
- 12.Lamkin-Kennard K.A., Jaron D., Buerk D.G. Impact of the Fahraeus effect on NO and O2 biotransport: a computer model. Microcirculation. 2004;11:337–349. doi: 10.1080/10739680490437496. [DOI] [PubMed] [Google Scholar]
- 13.Buerk D.G. Can we model nitric oxide biotransport? A survey of mathematical models for a simple diatomic molecule with surprisingly complex biological activities. Annu. Rev. Biomed. Eng. 2001;3:109–143. doi: 10.1146/annurev.bioeng.3.1.109. [DOI] [PubMed] [Google Scholar]
- 14.Chen K., Pittman R.N., Popel A.S. Vascular smooth muscle NO exposure from intraerythrocytic SNOHb: a mathematical model. Antioxid. Redox Signal. 2007;9:1097–1110. doi: 10.1089/ars.2007.1594. [DOI] [PubMed] [Google Scholar]
- 15.Jeffers A., Xu X., Huang K.T., Cho M., Hogg N., Patel R.P., Kim-Shapiro D.B. Hemoglobin mediated nitrite activation of soluble guanylyl cyclase. Comp. Biochem. Physiol. A Mol. Integr. Physiol. 2005;142:130–135. doi: 10.1016/j.cbpb.2005.04.016. [DOI] [PubMed] [Google Scholar]
- 16.El-Farra N.H., Christofides P.D., Liao J.C. Analysis of nitric oxide consumption by erythrocytes in blood vessels using a distributed multicellular model. Ann. Biomed. Eng. 2003;31:294–309. doi: 10.1114/1.1553454. [DOI] [PubMed] [Google Scholar]
- 17.Condorelli P., George S.C. vivo control of soluble guanylate cyclase activation by nitric oxide: a kinetic analysis. Biophys. J. 2001;80:2110–2119. doi: 10.1016/S0006-3495(01)76184-X. [DOI] [PMC free article] [PubMed] [Google Scholar]
- 18.Malinski T., Taha Z., Grunfeld S., Patton S., Kapturczak M., Tomboulian P. Diffusion of nitric oxide in the aorta wall monitored in situ by porphyrinic microsensors. Biochem. Biophys. Res. Commun. 1993;193:1076–1082. doi: 10.1006/bbrc.1993.1735. [DOI] [PubMed] [Google Scholar]
- 19.Zacharia I.G., Deen W.M. Diffusivity and solubility of nitric oxide in water and saline. Ann. Biomed. Eng. 2005;33:214–222. doi: 10.1007/s10439-005-8980-9. [DOI] [PubMed] [Google Scholar]
- 20.Liu X., Yan Q., Baskerville K.L., Zweier J.L. Estimation of nitric oxide concentration in blood for different rates of generation. Evidence that intravascular nitric oxide levels are too low to exert physiological effects. J. Biol. Chem. 2007;282:8831–8836. doi: 10.1074/jbc.M611684200. [DOI] [PubMed] [Google Scholar]
- 21.Denicola A., Souza J.M., Radi R., Lissi E. Nitric oxide diffusion in membranes determined by fluorescence quenching. Arch. Biochem. Biophys. 1996;328:208–212. doi: 10.1006/abbi.1996.0162. [DOI] [PubMed] [Google Scholar]
- 22.Yan Q., Liu Q., Zweier J.L., Liu X. Potency of authentic nitric oxide in inducing aortic relaxation. Pharmacol. Res. 2007;55:329–334. doi: 10.1016/j.phrs.2007.01.001. [DOI] [PubMed] [Google Scholar]
- 23.Buerk D.G., Goldstick T.K. Arterial wall oxygen consumption rate varies spatially. Am. J. Physiol. 1982;243:H948–H958. doi: 10.1152/ajpheart.1982.243.6.H948. [DOI] [PubMed] [Google Scholar]
- 24.Buerk D.G., Goldstick T.K. Spatial variation of aortic wall oxygen diffusion coefficient from transient polarographic measurements. Ann. Biomed. Eng. 1992;20:629–646. doi: 10.1007/BF02368610. [DOI] [PubMed] [Google Scholar]
- 25.Liu X., Liu Q., Gupta E., Zorko N., Brownlee E., Zweier J.L. Quantitative measurements of NO reaction kinetics with a Clark-type electrode. Nitric Oxide. 2005;13:68–77. doi: 10.1016/j.niox.2005.04.011. [DOI] [PubMed] [Google Scholar]
- 26.Wink D.A., Darbyshire J.F., Nims R.W., Saavedra J.E., Ford P.C. Reactions of the bioregulatory agent nitric oxide in oxygenated aqueous media: determination of the kinetics for oxidation and nitrosation by intermediates generated in the NO/O2 reaction. Chem. Res. Toxicol. 1993;6:23–27. doi: 10.1021/tx00031a003. [DOI] [PubMed] [Google Scholar]
- 27.Alberts B., Bray D., Lewis J., Raff M., Roberts K., Watson J.D. Garland Publishing; New York: 1994. Molecular Biology of the Cell. [Google Scholar]
- 28.Liu X., Miller M.J., Joshi M.S., Thomas D.D., Lancaster J.R., Jr. Accelerated reaction of nitric oxide with O2 within the hydrophobic interior of biological membranes. Proc. Natl. Acad. Sci. USA. 1998;95:2175–2179. doi: 10.1073/pnas.95.5.2175. [DOI] [PMC free article] [PubMed] [Google Scholar]
- 29.Gardner P.R., Martin L.A., Hall D., Gardner A.M. Dioxygen-dependent metabolism of nitric oxide in mammalian cells. Free Radic. Biol. Med. 2001;31:191–204. doi: 10.1016/s0891-5849(01)00569-x. [DOI] [PubMed] [Google Scholar]
- 30.Friebe A., Koesling D. Regulation of nitric oxide-sensitive guanylyl cyclase. Circ. Res. 2003;93:96–105. doi: 10.1161/01.RES.0000082524.34487.31. [DOI] [PubMed] [Google Scholar]
- 31.Ballou D.P., Zhao Y., Brandish P.E., Marletta M.A. Revisiting the kinetics of nitric oxide (NO) binding to soluble guanylate cyclase: the simple NO-binding model is incorrect. Proc. Natl. Acad. Sci. USA. 2002;99:12097–12101. doi: 10.1073/pnas.192209799. [DOI] [PMC free article] [PubMed] [Google Scholar]
- 32.Roy B., Garthwaite J. Nitric oxide activation of guanylyl cyclase in cells revisited. Proc. Natl. Acad. Sci. USA. 2006;103:12185–12190. doi: 10.1073/pnas.0602544103. [DOI] [PMC free article] [PubMed] [Google Scholar]
- 33.Cooper C.E., Giulivi C. Nitric oxide regulation of mitochondrial oxygen consumption II: molecular mechanism and tissue physiology. Am. J. Physiol. Cell Physiol. 2007;292:C1993–C2003. doi: 10.1152/ajpcell.00310.2006. [DOI] [PubMed] [Google Scholar]
- 34.Lancaster J.R., Jr. A tutorial on the diffusibility and reactivity of free nitric oxide. Nitric Oxide. 1997;1:18–30. doi: 10.1006/niox.1996.0112. [DOI] [PubMed] [Google Scholar]
- 35.Lamkin-Kennard K.A., Buerk D.G., Jaron D. Interactions between NO and O2 in the microcirculation: a mathematical analysis. Microvasc. Res. 2004;68:38–50. doi: 10.1016/j.mvr.2004.03.001. [DOI] [PubMed] [Google Scholar]
- 36.Wise D.L., Houghton G. Diffusion coefficients of neon, krypton, xenon, carbon monoxide and nitric oxide in water at 10–60°C. Chem. Eng. Sci. 1968;23:1211–1216. [Google Scholar]
- 37.Lamers-Lemmers J.P., Hoofd L.J., Oeseburg B. Non-steady-state O2 diffusion in metmyoglobin solutions studied in a diffusion chamber. Biochem. Biophys. Res. Commun. 2000;276:773–778. doi: 10.1006/bbrc.2000.3525. [DOI] [PubMed] [Google Scholar]
- 38.Bouwer S.T., Hoofd L., Kreuzer F. Diffusion coefficients of oxygen and hemoglobin measured by facilitated oxygen diffusion through hemoglobin solutions. Biochim. Biophys. Acta. 1997;1338:127–136. doi: 10.1016/s0167-4838(96)00197-5. [DOI] [PubMed] [Google Scholar]
- 39.Vaughn M.W., Huang K.T., Kuo L., Liao J.C. Erythrocyte consumption of nitric oxide: competition experiment and model analysis. Nitric Oxide. 2001;5:18–31. doi: 10.1006/niox.2000.0328. [DOI] [PubMed] [Google Scholar]
- 40.Ellis R.J., Minton A.P. Cell biology: join the crowd. Nature. 2003;425:27–28. doi: 10.1038/425027a. [DOI] [PubMed] [Google Scholar]
- 41.Luby-Phelps K. Cytoarchitecture and physical properties of cytoplasm: volume, viscosity, diffusion, intracellular surface area. Int. Rev. Cytol. 2000;192:189–221. doi: 10.1016/s0074-7696(08)60527-6. [DOI] [PubMed] [Google Scholar]
- 42.Verkman A.S. Solute and macromolecule diffusion in cellular aqueous compartments. Trends Biochem. Sci. 2002;27:27–33. doi: 10.1016/s0968-0004(01)02003-5. [DOI] [PubMed] [Google Scholar]
- 43.Kao H.P., Abney J.R., Verkman A.S. Determinants of the translational mobility of a small solute in cell cytoplasm. J. Cell Biol. 1993;120:175–184. doi: 10.1083/jcb.120.1.175. [DOI] [PMC free article] [PubMed] [Google Scholar]
- 44.Ellis R.J. Macromolecular crowding: an important but neglected aspect of the intracellular environment. Curr. Opin. Struct. Biol. 2001;11:114–119. doi: 10.1016/s0959-440x(00)00172-x. [DOI] [PubMed] [Google Scholar]
- 45.Minton A.P. The influence of macromolecular crowding and macromolecular confinement on biochemical reactions in physiological media. J. Biol. Chem. 2001;276:10577–10580. doi: 10.1074/jbc.R100005200. [DOI] [PubMed] [Google Scholar]
- 46.Bural G.G., Torigian D.A., Chamroonrat W., Alkhawaldeh K., Houseni M., El-Haddad G., Alavi A. Quantitative assessment of the atherosclerotic burden of the aorta by combined FDG-PET and CT image analysis: a new concept. Nucl. Med. Biol. 2006;33:1037–1043. doi: 10.1016/j.nucmedbio.2006.08.005. [DOI] [PubMed] [Google Scholar]
- 47.Ross R. The pathogenesis of atherosclerosis: a perspective for the 1990s. Nature. 1993;362:801–809. doi: 10.1038/362801a0. [DOI] [PubMed] [Google Scholar]
- 48.Warnholtz A., Nickenig G., Schulz E., Macharzina R., Brasen J.H., Skatchkov M., Heitzer T., Stasch J.P., Griendling K.K., Harrison D.G., Böhm M., Meinertz T., Münzel T. Increased NADH-oxidase-mediated superoxide production in the early stages of atherosclerosis: evidence for involvement of the renin-angiotensin system. Circulation. 1999;99:2027–2033. doi: 10.1161/01.cir.99.15.2027. [DOI] [PubMed] [Google Scholar]
- 49.Lloyd-Jones D.M., Bloch K.D. The vascular biology of nitric oxide and its role in atherogenesis. Annu. Rev. Med. 1996;47:365–375. doi: 10.1146/annurev.med.47.1.365. [DOI] [PubMed] [Google Scholar]
- 50.Schafer A., Alp N.J., Cai S., Lygate C.A., Neubauer S., Eigenthaler M., Bauersachs J., Channon K.M. Reduced vascular NO bioavailability in diabetes increases platelet activation in vivo. Arterioscler. Thromb. Vasc. Biol. 2004;24:1720–1726. doi: 10.1161/01.ATV.0000138072.76902.dd. [DOI] [PubMed] [Google Scholar]