

Abstract
The mechanism of the all-or-none release of the contents of phospholipid vesicles induced by the antimicrobial peptide cecropin A was investigated. A detailed experimental study of the kinetics of dye release showed that the rate of release increases with the ratio of peptide bound per vesicle and, at constant concentration, with the fraction of the anionic lipid phosphatidylglycerol in neutral, phosphatidylcholine membranes. Direct measurement of the kinetics of peptide binding and dissociation from vesicles revealed that the on-rate is almost independent of vesicle composition, whereas the off-rate decreases by orders of magnitude with increasing content of anionic lipid. A simple, exact model fits all experimental kinetic data quantitatively. This is the first time that an exact kinetic model is implemented for a peptide with an all-or-none mechanism. In this model, cecropin A binds reversibly to vesicles, which at a certain point enter an unstable state. In this state, a pore probably opens and all vesicle contents are released, consistent with the all-or-none mechanism. This pore state is a state of the whole vesicle, but does not necessarily involve all peptides on that vesicle. No peptide oligomerization on the vesicle is involved; alternative models that assume oligomerization are inconsistent with the experimental data. Thus, formation of well-defined, peptide-lined pores is unlikely.
Introduction
Since their discovery over two decades ago (1), antimicrobial peptides have received considerable attention (2–6) because of their potential use in the development of alternatives to traditional antibiotics. The amino-acid sequences of antimicrobial peptides from different organisms vary widely, but many form an amphipathic α-helix upon binding to membranes. No cell-surface receptors are involved in recognition (7,8), indicating that target-cell specificity is determined by the lipid bilayer itself. The antimicrobial peptides in this class are cationic, which has led to the proposal that membrane charge plays a crucial role in determining specificity of eukaryotic peptides against bacterial cells (2), but this idea has been challenged (9–11). Among the most studied peptides are magainins, melittin, mastoparans, and cecropins, which are all cationic. However, charge and amphipathicity are the only similarities these peptides share, and the mechanism of specificity remains elusive.
Amphipathic α-helical peptides elicit the release of contents from lipid vesicles and cells. Originally, they were thought to form pores in membranes. According to the barrel-stave model (12), α-helical bundles of six or more peptides would insert into the membrane and form a water-filled pore, exposing the hydrophilic face of the helices to water and the hydrophobic face to the lipid bilayer interior. The model was believed to apply to alamethicin, melittin, and δ-lysin. However, it was subsequently shown that it is unlikely for melittin (13) and incorrect for δ-lysin (14,15). It now appears that most peptides follow other mechanisms (6,16), including the toroidal hole model (17–19), the carpet model (3,16,20), the sinking raft model (14,15), and other less structured types of pores (21).
The question of whether membrane disruption is the function of these peptides is also still under debate (11,22). It is possible that the real targets are intracellular components and that membrane perturbation might be only a side effect. Nevertheless, interaction with the bilayer is essential for the function of these peptides.
Cecropin A is an amphipathic, antibacterial peptide synthesized by Hyalophora cecropia, composed of 37 amino-acid residues (1,24). Eight of these residues are basic (seven Lys and one Arg) and two are acidic (Glu and Asp), which, together with the N-terminus, produce a net +7 charge at neutral pH. The C-terminus contributes no charge because it is amidated. Cecropin A is monomeric (25) and unstructured in water (26), but in aqueous solution containing 15% hexafluoroisopropanol it adopts a structure consisting of two α-helical regions, one involving residues 5–21, and the other, residues 24–37, separated by a Gly-Pro break (26,27). The helical wheel projections of these two regions are shown in Fig. 1, using the water/octanol transfer scale to assign hydrophilic and hydrophobic residues (28). In its membrane-bound form, cecropin A retains the helix-break-helix motif found in solution, and both helices lie parallel to the membrane surface (29,30).
Figure 1.
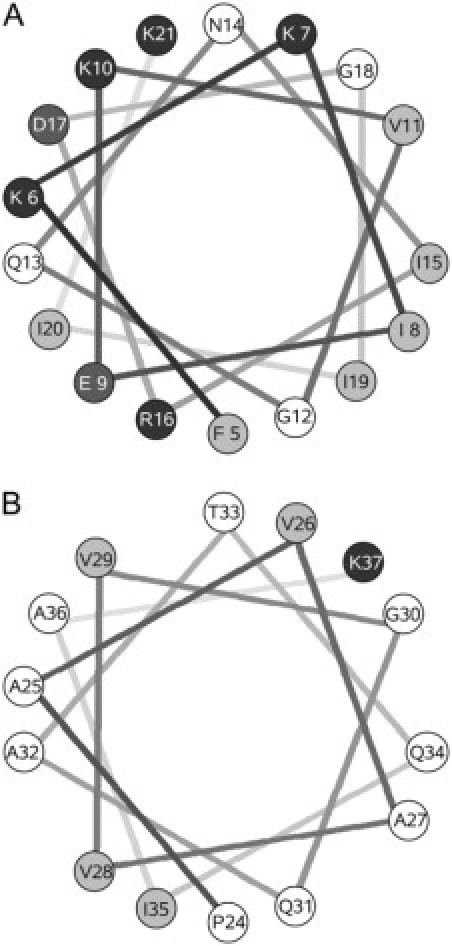
Helical wheel projection of cecropin A. Residues 5–21 (A) and 24–37 (B). Solid symbols represent basic residues; dark shading, acidic residues; light shading, hydrophobic residues; and open areas, hydrophilic residues, according to the water/octanol transfer scale (28).
Cecropin A kills Gram-negative bacteria, but mammalian erythrocytes are resistant to it, probably because this polycationic peptide does not bind well to zwitterionic, mammalian cell membranes (31). However, the importance of anionic lipids in Gram-negative bacteria, such as Escherichia coli, for the activity of cecropin is still controversial (11). The effects of cecropin A on membranes depend on concentration (25). At high concentrations, cecropin A releases the contents from synthetic vesicles, but lower concentrations are sufficient to dissipate electrochemical gradients. Similarly, in E. coli, the peptide concentrations required to dissipate membrane potential and kill the bacteria are lower than those required to release cytoplasmic contents. This led to the conclusion that its bactericidal activity stems from dissipation of transmembrane electrochemical ion gradients (25). On the other hand, more recent experiments in E. coli revealed a similar concentration dependence for membrane permeabilization, depolarization, and bactericidal activity (32), suggesting that the antimicrobial effect is related to membrane permeability changes induced by the peptide. In any case, it is clear that the site of interaction of cecropin A with membranes is the lipid bilayer, not a protein receptor, since cecropin A composed of D-amino acids functions as well as the natural, all-L form (7).
Computer modeling was used to propose that cecropin A forms large ion channels in bilayers, consisting of 12 peptide molecules each (33). More recent work also suggested ion channel formation (25,32). On the other hand, cecropins (34–36) and dermaseptins (20) were the peptides for which the carpet model was originally proposed. Cecropin A, in particular, was proposed to insert into the bilayer retaining the parallel orientation to the membrane that it has on the surface (29). This is consistent with the sinking raft model (14,15) and conceptually similar to less structured types of pores (21).
In the past few years, we have been examining the kinetics of peptide-membrane interactions using a unified approach that includes the quantitative analysis of experimental kinetics with rigorous models expressed as sets of (nonlinear) differential equations, which are numerically solved and directly fit to the data. We have used this approach to study the hemolytic peptide δ-lysin from Staphylococcus aureus (14,15) and, more recently, the cell-penetrating peptide transportan 10, tp10 (37). Both of these peptides are also amphipathic and α-helical, but cause graded dye release from lipid vesicles. Here, we use the same methods to investigate the antimicrobial peptide cecropin A, which behaves very differently from δ-lysin and tp10. On the basis of a rigorous analysis of peptide binding and dye efflux kinetics, we propose a very simple model that describes all our experimental data quantitatively. The model proposed is in agreement with the concept that pore formation and dye release are a consequence of a global, unstable state of the vesicle (38,39), which results from its interaction with the peptides (19,40).
Methods
Chemicals
Cecropin A (KWKLFKKIEKVGQNIRDGIIKAGPAVAVVGQATQIAK-amide) was purchased from American Peptide (Sunnyvale, CA). A stock solution was prepared by dissolving lyophilized cecropin A in deionized water/ethyl alcohol 1:1 (v/v) (AAPER Alcohol and Chemical, Shelbyville, KY). Stock peptide solutions were stored at −20°C, and kept on ice during experiments. 1-Palmitoyl-2-oleoyl-sn-glycero-3-phosphocholine (POPC), 1-palmitoyl-2-oleoyl-sn-glycero-3-phosphatidylethanolamine (POPE), and 1-palmitoyl-2-oleoyl-sn-glycero-3-[phospho-rac-(1-glycerol)] (POPG), in chloroform solution, were purchased from Avanti Polar Lipids (Alabaster, AL). 7-Methoxycoumarin-3-carboxylic acid (7MC), 1-[[(6,8-difluoro-7-hydroxy-4-methyl-2-oxo-2H-1-benzopyran-3-yl)acetyl]oxy] (Marina Blue (trademark), MB) succinimidyl ester, 4-chloro-7-nitrobenz-2-oxa-1,3-diasole (NBD) chloride, 8-aminonaphtalene-1,3,6-trisulfonic acid (ANTS) disodium salt, and p-xylene-bis-pyridinium bromide (DPX) were purchased from Molecular Probes/Invitrogen (Carlsbad, CA). Carboxyfluorescein (99% pure, lot A015252901) was purchased from ACROS (Morris Plains, NJ). Dimethylformamide was purchased from Mallinckrodt Baker (Paris, KY), 4-dimethylaminopyridine from Sigma-Aldrich (St. Louis, MO), and n,n′-dicyclohexylcarbodiimide from ACROS. Organic solvents (high performance liquid chromatography/American Chemical Society grade) were purchased from Burdick & Jackson (Muskegon, MI). Lipids and fluorophores were tested by thin-layer chromatography (TLC) and used without further purification.
Synthesis of fluorescent probes
The syntheses of NBD-POPE and MB-POPE were performed as described in detail before in Frazier et al. (41), following the general method of Vaz and Hallmann (42). 7MC-POPE (POPE labeled with 7MC, through an amide bond to the amino group of the ethanolamine headgroup) was synthesized in a similar way, with the following specific procedures. Organic solvents were dried with molecular sieves (Sigma-Aldrich). POPE solutions in CHCl3 were first dried in a rotary evaporator and the lipid film was dissolved in ∼0.5 mL of dry CHCl3. Approximately 13 mg of 7MC dissolved in dry dimethylformamide, 30 μL of 4 M 4-dimethylaminopyridine in dry CHCl3, and 25 mg of n,n′-dicyclohexylcarbodiimide were sequentially added to a test tube wrapped in aluminum foil, at room temperature. POPE (60 μmol in ∼2 mL of dry CHCl3) was then added to the reaction mixture, which was stirred in the dark for ∼16 h. The course of the reaction was monitored by TLC using CH2Cl2/methanol (MeOH)/water 65:25:4 (v/v/v). The fluorescent probes were identified with UV light and the phosphorus-containing lipids with Zinzade's reagent (43). Purification was performed on preparatory TLC, and the product band was eluted from the silica with the same solvent system. An approximate azeotrope (44) was then prepared by adding a volume of CHCl3 equal to 2.6× the volume of the probe solution, and the solvent was removed by rotary evaporation at 60°C. Finally, the product, 7MC-POPE, was dissolved in a minimal amount of dry CHCl3 and kept under nitrogen at −20°C. Absorbances were determined in MeOH (basic for MB) in a spectrophotometer (Cary 1E UV-Vis; Varian, St. Helens, Australia) and lipid concentrations were determined by the Bartlett phosphate assay (45). The absorption maximum of 7MC-POPE occurs at 348 nm (ϵ = 2.9 × 10⁴ M−1 cm−1 in MeOH) and the emission maximum at 396 nm.
Preparation of large unilamellar vesicles
Large unilamellar vesicles (LUVs) were prepared by mixing the lipids in chloroform in a round-bottom flask. For vesicles containing MB-POPE, NBD-POPE, or 7MC-POPE, the probes were added in chloroform solutions together with the lipids. The solvent was rapidly evaporated using a rotary evaporator (model No. R-3000; Büchi Labortechnik, Flawil, Switzerland) at 60–70°C. The lipid film was then placed under vacuum for 4 h and hydrated by the addition of buffer containing 20 mM MOPS, pH 7.5, 0.1 mM EGTA, 0.02% NaN3, and 100 mM KCl or appropriately modified as indicated below. The suspension of multilamellar vesicles was subjected to five freeze-thaw cycles to increase the degree of dye (carboxyfluorescein or ANTS/DPX) encapsulation. The suspension was then extruded 10× through two stacked polycarbonate filters of 0.1 μm pore size (Nucleopore; Whatman, Florham, NJ), using a water-jacketed high pressure extruder (Lipex Biomembranes, Vancouver, Canada) at room temperature. Lipid concentrations were assayed by the Bartlett phosphate method (45), modified as previously described in Pokorny et al. (14).
Kinetics of cecropin A association with, and dissociation from lipid vesicles
The kinetics of association of cecropin A with LUVs of POPC/POPG mixtures were recorded on a stopped-flow fluorimeter (model No. SX-18MV; Applied Photophysics, Leatherhead, Surrey, UK). Fluorescence resonance energy transfer (FRET) between the intrinsic Trp residue of cecropin A and 7MC-POPE incorporated in the lipid membrane were used to monitor peptide binding and dissociation from LUVs. The Trp was excited at 280 nm and transferred energy to 7MC-POPE, which absorbs maximally at 348 nm. The emission of 7MC, with maximum at 396 nm, was measured using a cutoff filter (model No. GG-385; Edmund Industrial Optics, Barrington, NJ). After mixing, the concentration of peptide was 1 μM and the lipid varied between 25 and 400 μM.
ANTS/DPX assay
Steady-state fluorescence measurements were performed in a spectrofluorimeter (model No. 8100; SLM-Aminco, Urbana, IL) upgraded by software (ISS, Champaign, IL). In the ANTS/DPX assay (46), which was performed as described in detail by Ladokhin et al. (47,48), excitation was at 365 nm (8 nm slit-width) and emission was at 515 nm (16 nm slit-width). The solution encapsulated in the LUVs contained 5 mM ANTS, 8 mM DPX, 20 mM MOPS, pH 7.5, 0.1 mM EGTA, 0.02% NaN3, and 70 mM KCl. The titrating solution contained 45 mM DPX, 20 mM MOPS, pH 7.5, 0.1 mM EGTA, 0.02% NaN3, and 30 mM KCl. After extrusion, the LUVs with encapsulated ANTS and DPX were passed through a Sephadex-G25 column to separate the dye in the external buffer from the vesicles. Typical concentrations were of the order of 0.1–2 μM peptide and 500 μM lipid.
Carboxyfluorescein efflux experiments
Carboxyfluorescein (CF) efflux kinetics measurements were performed as described before in the literature (15,37). Briefly, LUVs were prepared by hydration of the lipid film in 20 mM MOPS buffer, pH 7.5, containing 0.1 mM EGTA, 0.02% NaN3, and 50 mM CF, to give a final lipid concentration of 10 mM. After extrusion, CF-containing LUVs were passed through a Sephadex-G25 column to separate the dye in the external buffer from the vesicles. For fluorescence measurements, the suspension was diluted to the desired lipid concentration in buffer containing 20 mM MOPS, pH 7.5, 100 mM KCl, 0.1 mM EGTA, and 0.02% NaN3, which has the same osmolarity as the CF-containing buffer. The kinetics of CF efflux, measured by the relief of self-quenching of CF fluorescence, were recorded in a spectrofluorimeter (model No. 8100; SLM-Aminco) upgraded by ISS (Champagne, IL) with excitation at 470 nm and emission measured at 520 nm. The fastest curves were recorded using a stopped-flow fluorimeter (model No. SX.18MV; Applied Photophysics). The excitation was at 470 nm and the emission was recorded through a long-pass filter (model No. OG 530; Edmund Industrial Optics). The peptide concentration was 1 μM after mixing, in all experiments. The fraction of CF released was determined by comparison of the fluorescence with that obtained upon addition of Triton X-100, which dissolves the vesicles and releases all the dye.
Analysis of binding kinetics
The reversible binding of peptides to lipid vesicles is described by Eq. 1. The term Pw represents peptide in water, L represents lipid vesicles, and PL represents peptide bound to the membrane; kon is the on-rate constant and koff is the off-rate constant.
| (1) |
The corresponding differential equations,
| (2) |
| (3) |
have the solution
| (4) |
| (5) |
where the apparent rate constant is
| (6) |
and the constant C = 1/(1 + KD/[L]), where KD = koff/kon is the equilibrium dissociation constant. In these equations, [L] is the vesicle concentration, which is expressed in terms of lipid concentration (1 LUV ⋍ 105 lipids). Because the number of peptides bound per vesicle is always small, and vesicles do not disappear when peptides bind, [L] is considered constant.
The binding kinetics was analyzed using Eq. 5. The apparent rate constants, obtained from single-exponential fits to the experimental binding kinetic curves, were plotted against the lipid concentration, yielding a linear plot whose slope is kon and y-intercept is koff (Eq. 6).
Analysis of dissociation kinetics
The dissociation kinetics experiment is represented by Eq. 7. Peptide (PL) initially bound to donor vesicles (L) dissociates and irreversibly binds to acceptor vesicles (L′). In the experiment, the donors are mixed vesicles of POPC/POPG, whereas the acceptors are pure POPG. Irreversible peptide binding to the acceptors is assumed because the affinity of cecropin A for pure POPG is much greater than for POPC/POPG mixtures and the acceptors are in excess.
| (7) |
The solution of this equation is a decay function with a main apparent rate constant that is a function of kon, koff, , and the concentrations of vesicles,
| (8) |
If the concentration of donor vesicles is decreased while the concentration of acceptor vesicles remains the same, the likelihood of peptide returning to the donor vesicles decreases. In the limit of zero donor vesicle concentration, kapp becomes the real koff (Fig. 2). This limit is of course not physically realizable, but if the dissociation experiment is performed as a function of donor concentration and kapp is plotted against the donor lipid concentration [L], the y-intercept provides a more accurate estimate of koff.
Figure 2.
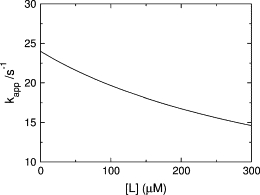
Theoretical plot of kapp for dissociation of peptide from vesicles as a function of the concentration of donor lipid (Eq. 8). The plot was generated with the experimental parameters for POPC/POPG 70:30 (Table 1).
When cecropin A dissociates from the donor vesicles, energy transfer from its Trp to 7MC-POPE on the membrane decreases, resulting in a decay of the fluorescence emission of 7MC-POPE as a function of time, F(t). The apparent rate constant (kapp) for this decay was obtained by fitting the experimental kinetic dissociation curves with a single-exponential decay function (Eq. 4). Given the magnitudes of the rate constants and the lipid concentrations, this is the expected behavior from the simple description provided by Eq. 7 and was found in most cases. (Strictly, a second apparent rate exists, but its amplitude is negligible with the experimental parameters.) Departures from this simple picture may lead to deviations from a single exponential; indeed, in some cases this did not yield an acceptable fit, though the approximate lifetime was still correct. Rather than using a more complicated analysis in those cases, kapp was obtained from the apparent mean lifetime (τ) defined by (49,50):
| (9) |
| (10) |
In practice, this is equivalent to an amplitude-weighted average of the time constants in a multiexponential decay. All curves could be reasonably well fit with, at most, a double-exponential decay,
| (11) |
yielding
| (12) |
Analysis of carboxyfluorescein efflux kinetics
The sets of differential equations describing the model used (Eqs. 13–17, below) and many other (nonlinear) models tested were solved by numerical integration with a fifth-order Runge-Kutta method with constant step size (51). The numerical solution was fit directly to the experimental data with a simplex algorithm (51) on a Linux workstation with in-house FORTRAN code programs, using the f95 compiler (Numerical Algorithms Groups, Oxford, UK).
In the analysis of carboxyfluorescein efflux, kon and koff were fixed at the values obtained from the binding and dissociation kinetics. Therefore, only three additional parameters are necessary: the rate constants for formation and relaxation of the pore state, k1 and k2, and the efflux rate constant keflx, which describes the rate at which dye escapes from the vesicle in the pore state (see next section for definitions). Because keflx strongly correlates with k2 it was fixed (at 100 M−1 s−1) in the analysis. That correlation arises because the shorter the lifetime of the pore state, the smaller the amount of dye that can escape until the vesicle relaxes. Therefore, if both of these rate constants are large enough, only the ratio keflx/k2 is significant. Furthermore, we found that k1 can also be fixed because, over a broad range of values of k1 and k2, the fits only depend on their ratio k1/k2, which we call β. Thus, the model has only one truly free parameter, β. (In practice, k1 was fixed at 0.01 s−1, and only k2 was allowed to vary.) The ratio β was adjusted by requiring that one value globally fit the CF efflux kinetics for all lipid concentrations pertaining to each lipid composition. Of course, β can be different for different compositions of the vesicles; but within each composition, it is the same for all lipid concentrations. It is thus a very constrained parameter. It turns out that β does not vary much with lipid composition of the vesicles, either. Then, a slight variation of β within each lipid composition was allowed to better fit the curves for the different lipid concentrations individually, and to obtain an estimate of the error. The mean values of those fits and their corresponding standard deviations are listed in Table 1. In addition, an amplitude factor (0.80–1.15) was allowed for each curve. This corrects for any experimental error in the determination of the maximum dye release.
Table 1.
Cecropin A on- and off-rate constants, equilibrium dissociation constants, and pore formation/relaxation ratio (β) for POPC/POPG vesicles
| Vesicle composition | Binding kinetics | Dissociation kinetics | Dissociation constant* | Pore state | |
|---|---|---|---|---|---|
| POPC/POPG | kon (M−1s−1) | koff (s−1) | koff (s−1) | Kd (μM) | β = k1/k2 |
| 50:50 | (5.2 ± 0.2) × 105 | 7 ± 2 | 0.125 ± 0.002 | 0.24 | (2.6 ± 0.3) × 10−3 |
| 70:30 | (4.3 ± 0.4) × 105 | 46 ± 4 | 24 ± 1 | 56 | (0.9 ± 0.2) × 10−3 |
| 80:20 | (3.9 ± 4.0) × 105 | 170 ± 40 | 105 ± 6 | 270 | (1.6 ± 0.1) × 10−3 |
| 90:10 | ND† | ND | 160 ± 15 | — | — |
| 100:0‡ | 2.8 × 10⁵ | 300 | 300 | 1000 | — |
The rate constants were obtained from the fits of experimental kinetics to the model. The error is estimated from the fits using the linear regression (kon and koff) or the variance in fitting the individual curves (β). The two other rate constants in model the were held fixed (keflx = 100 M−1 s−1 and k1 = 0.01 s−1).
Calculated using kon from binding and koff from dissociation kinetics.
Not detectable; binding was too weak to produce a signal.
Estimated by extrapolation (Fig. 8).
For the CF efflux reverse experiment, where donor (empty) vesicles were preequilibrated with cecropin A, an additional block of two equations was added, describing the time-dependence of the bound states initially present: peptide associated with the vesicle surface and peptide in the pore state of the vesicles. This block is similar to Eqs. 14–16, appropriately modified. The initial conditions were calculated from the integrated equations in the forward reaction, for a period equal to the preincubation time of cecropin with empty vesicles, as before (15,37).
The model
The model depicted in Fig. 3 was used to analyze the CF efflux kinetics. As shown experimentally below, cecropin A induces all-or-none dye release from vesicles, which means that vesicles are either full of CF or empty, and the state from which leakage occurs must be transient and not much populated. The model has four peptide states: Pw, cecropin as an unstructured monomer in water (Fig. 3 A); cecropin bound, as an α-helix, to the membrane surface of full vesicles (Fig. 3 B); P*, cecropin in the pore state of the vesicles (Fig. 3 C); and cecropin bound to empty vesicles (Fig. 3 D).
Figure 3.
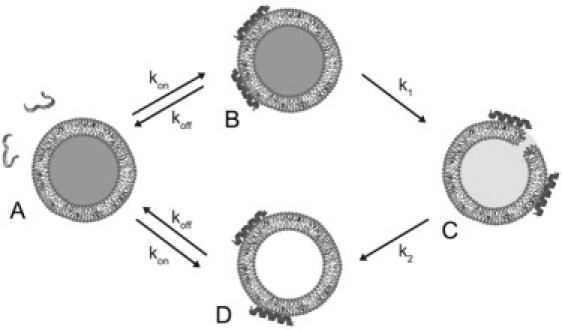
Model for the interaction between cecropin A and lipid vesicles. (A) Cecropin in solution, (B) bound to the membrane surface of dye-loaded vesicles, (C) associated with vesicles in the pore state, and (D) bound to the surface of empty vesicles. Dye efflux occurs only from the pore state.
The rate constants kon and koff describe binding to, and dissociation from, vesicles (full or empty). Then, there is a certain probability, proportional to a rate constant k1, that a vesicle with surface-associated peptides will enter a pore state. At this point, the membrane yields and all dye is released from that particular vesicle. The pore state is unstable and relaxes to an empty vesicle state with a rate constant k2. The peptide can dissociate from the membrane and bind to another vesicle, with the same rate constants kon and koff, continuing the cycle of vesicle permeabilization. Peptides can, of course, also bind to empty vesicles, or dissociate from full vesicles without having caused dye release. The existence of empty vesicles is important for the kinetics because they compete with the full vesicles for peptide binding, therefore slowing down the observed rate of dye release, especially at later times.
The efflux itself, which occurs from the pore state P*, is described by another rate constant, keflx. The efflux rate observed macroscopically, expressed as the increase in the fraction of CF outside (Eq. 17), is the product of three factors: keflx, the concentration of peptides in the pore state of the vesicle per unit of lipid membrane P*/[L], and the fraction of vesicles still full of CF, f full. Because dye release induced by cecropin A follows an all-or-none mechanism, the fraction of empty vesicles f empty is identical to the fraction of CF released, CFout. Similarly, the fraction of intact vesicles, f full, is identical to the fraction of CF still inside the vesicles, (1 − CFout). Thus, the fractions f full and f empty are not additional variables, but are directly determined from the normalized, experimental CF release.
The kinetic mechanism that corresponds to this model (Fig. 3) is expressed by the set of differential equations (13–17)13-17:
| (13) |
| (14) |
| (15) |
| (16) |
| (17) |
In this scheme, the superscripts full or empty indicate whether or not the vesicles contain CF. All concentrations of peptide species, in water- or membrane-bound, are expressed relative to the total aqueous solution volume. For example, the concentration of bound peptide relative to the lipid is pL = PL/(vo[L]), PL being its concentration relative to water. The factor vo = 0.6/2 M−1 is approximately one-half the specific molar volume of the hydrophobic portion of a lipid (∼0.6 M−1). Division by 2 corrects [L] for the two leaflets of the lipid bilayer. (However, the only effect of vo is to change slightly the numerical value of keflx.) The total concentration of lipid vesicles is [L], the concentration of full vesicles is f full[L], and the concentration of empty vesicles is fempty[L]. [L] is expressed in terms of lipid concentration and considered constant, because the vesicles do not disappear upon interaction with the peptide. Thus, P* is the concentration of peptide in the vesicle state that releases CF (Fig. 3 C), expressed relative to the solution volume. However, it is the concentration of P* per unit of membrane that is relevant for dye efflux, because the larger the number of pores per unit of membrane area, the faster the efflux. Therefore, in Eq. 17, P* is divided by the lipid concentration, [L].
As an example of the behavior of the model, Fig. 4 shows the fractions of the different states of the peptide as a function of time, using the parameters determined from an experiment where a 25 μM lipid sample of POPC/POPG 50:50 was mixed with 1 μM cecropin A at time zero. The fraction of peptide in the pore state (right side y-axis) is shown as the shaded curve, at a magnification of 100×. This pore state peaks close to the beginning but is always a very small fraction of the system. The other curves (left side y-axis) represent peptide in aqueous solution (dotted line), peptide bound to full vesicles (solid line), and peptide bound to empty vesicles (dashed line).
Figure 4.
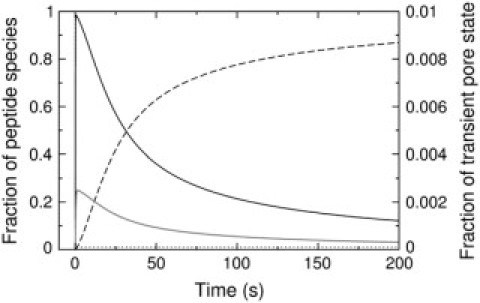
Fractions of the different states of the peptide as a function of time calculated from the model. The shaded line (scale on the right side y-axis) represents the fraction of peptide in the transient pore state, at a magnification of 100× compared to the other curves. The solid curves (scale on the left side y-axis) represent the states of the peptide in aqueous solution (dotted line), bound to full vesicles (solid line), and bound to empty vesicles (dashed line). The parameters used correspond to mixing 25 μM POPC/POPG 50:50 with 1 μM cecropin A.
Results
Binding and dissociation kinetics
The kinetics of binding of cecropin A to lipid vesicles were measured by stopped-flow fluorescence. Cecropin A contains a Trp residue close to the N-terminus, which shifts its emission maximum from 350 to 330 nm upon binding to the membrane (Fig. 5 A), indicating that the N-terminus becomes embedded in the acyl-chain region of the bilayer. This change in emission could be used to monitor binding, but the signal/noise ratio is not very large. Therefore, we used instead the Förster resonance energy transfer (FRET) between the Trp residue of cecropin A and a lipid fluorophore, 7MC-POPE, incorporated in the bilayer. This probe, with an absorption maximum at ∼350 nm and emission at ∼400 nm, functions as an energy transfer acceptor for the Trp (Fig. 5 B). When the Trp is excited at 280 nm, the emission intensity of 7MC-POPE increases upon cecropin A binding to the membrane.
Figure 5.
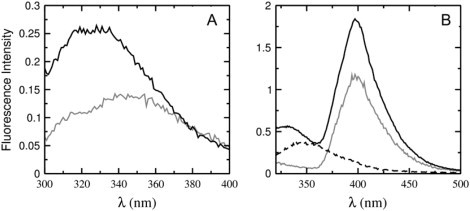
(A) Emission shift of the Trp of cecropin A upon binding to vesicles. The shaded line is 1 μM cecropin A in solution and the solid line is 1 μM cecropin A in the presence of 100 μM POPC/POPG 50:50 vesicles. (B) Energy transfer from the Trp to 7MC-POPE in vesicles. The dashed line is 1 μM cecropin A in solution; the solid line is 1 μM cecropin A in the presence of 100 μM POPC/POPG 50:50 vesicles containing 1 mol % 7MC-POPE; and the shaded line is 100 μM POPC/POPG 50:50 vesicles containing 1 mol % 7MC-POPE without cecropin A. Excitation is always at 280 nm. The intensity change at 400 nm was used to monitor binding and dissociation.
The increase in fluorescence emission intensity of 7MC-POPE was monitored upon mixing of peptide with vesicles (Fig. 6, left). The kinetic binding curves thus obtained were fit with a single exponential function (Eq. 5) to obtain the apparent rate constant (kapp). A plot of kapp against lipid concentration yields a linear fit (Fig. 6, right) in which the y-intercept is koff and the slope is kon (Eq. 6). The rate constants for cecropin A binding and dissociation for mixtures of POPC/POPG 50:50, 70:30, 80:20, and 90:10 were obtained from those fits and are listed in Table 1. The values of kon are just below the diffusion limit, which is ∼106 M−1 s−1, expressed in terms of lipid concentration, and they increase weakly with the POPG content of the vesicles, only doubling from the smallest (pure POPC) to the largest kon (POPC/POPG 50:50).
Figure 6.
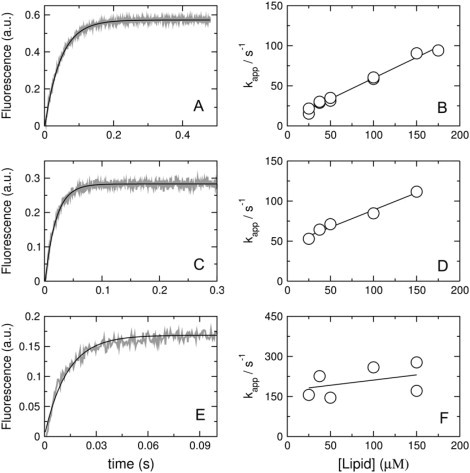
Kinetics of cecropin A binding to vesicles of POPC/POPG 50:50 (A and B), 70:30 (C and D), and 80:20 (E and F). On the left, the shaded curves are experimental binding kinetics recorded with 25 μM lipid and 1 μM cecropin A (∼10 traces were averaged to improve the signal/noise ratio); the solid line is a single-exponential fit to the data (Eq. 5). On the right, the apparent rate constant (kapp) is plotted against lipid concentrations to obtain kon from the slope and koff from the y-intercept (Eq. 6). Because cecropin binds weakly to POPC/POPG 80:20, these data have considerably larger scatter.
The value of koff obtained from the binding kinetics can have a considerable error, particularly if the y-intercept occurs close to the origin. Therefore, to better determine koff, a dissociation kinetics experiment was performed, using the same energy transfer pair. Cecropin A was preincubated with vesicles of POPC/POPG 50:50, 70:30, and 80:20 containing 1 mol % 7MC-POPE (donors), which were then mixed in the stopped-flow system with pure POPG vesicles containing no probe (acceptors). Because binding of cecropin A is much stronger to pure POPG, once dissociation from the donors occurs, the peptide is most likely to bind to the acceptors. To reinforce the irreversibility of the process, the concentration of acceptors was 500 μM, always larger than the donors concentration, which varied from 50 to 300 μM. These experiments were performed both with long and very short incubation times with donors; the results were the same. Representative kinetic curves for the various lipid compositions examined are shown in Fig. 7 (left). The plots of the apparent off-rate constant against the concentration of donor lipid are also shown in Fig. 7 (right). These plots are expected to exhibit the lipid concentration dependence shown in Fig. 2 (Eq. 8), and, by and large, they do. In the limit of zero donor concentration, kapp becomes koff. The values thus obtained are listed in Table 1. They are similar, within experimental error, to those obtained from the binding kinetics, but generally slightly smaller. We do not have a good explanation for this slight discrepancy, but we believe the values obtained from the dissociation experiment are more reliable because they are more direct. Clearly, the off-rate constants decrease sharply as the POPG content of the vesicles increases, varying from ∼300 s−1 for pure POPC to ∼0.1 s−1 for POPC/POPG 50:50.
Figure 7.
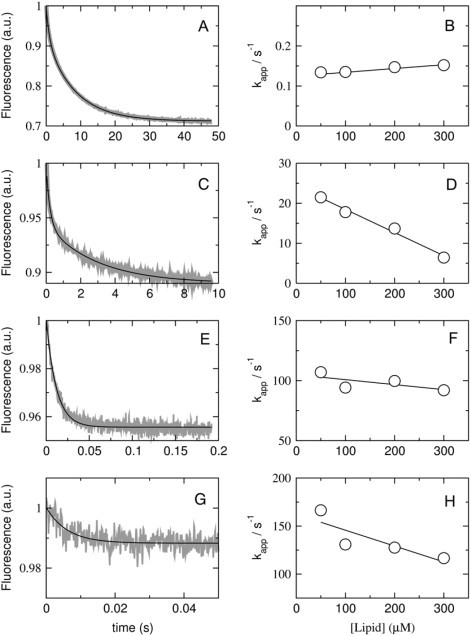
Kinetics of cecropin A dissociation from vesicles of POPC/POPG 50:50 (A and B), 70:30 (C and D), 80:20 (E and F), and 90:10 (G and H). Peptide, at a concentration of 2 μM, was incubated with 100–600 μM of POPC/POPG 50:50, 70:30, and 80:20, for 30, 40, and 60 min, respectively, and then mixed in the stopped flow with 1 mM POPG LUVs. The concentrations after mixing are half of those values. On the left, the shaded curves represent dissociation kinetics recorded with 50 μM lipid and 1 μM cecropin A (∼10 traces were averaged to improve the signal/noise ratio); the solid line is a one- or two-exponential fit to the data. On the right, the kapp obtained from those fits is plotted against the concentration of donor lipid to obtain koff from the y-intercept (compare with theoretical plot in Fig. 2).
Binding of cecropin A to pure POPC is extremely weak, consistent with a negligible efflux observed, and it was not possible to determine kon and koff from binding kinetics. However, it was possible to estimate those rate constants by extrapolating to pure POPC the values of kon and koff obtained for POPC/POPG mixtures as a function of POPC content (Fig. 8). As the fraction of POPC in POPC/POPG mixtures increases, kon decreases linearly (Fig. 8 A) and koff increases exponentially (Fig. 8 B). Extrapolation of those lines to 100% POPC yields estimates of kon and koff for pure POPC, which are also listed in Table 1. The equilibrium dissociation constant calculated from KD = koff/kon is ∼1 mM, confirming the very weak binding to pure POPC vesicles.
Figure 8.
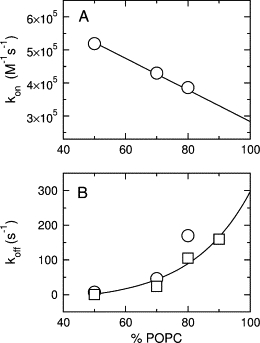
Cecropin A on- and off-rate constants as a function of the POPC content in POPC/POPG mixed vesicles. (A) kon and the extrapolation to 100% POPC. (B) koff and the extrapolation to 100% POPC. The circles are from binding kinetics (Fig. 6) and the squares are from dissociation kinetics experiments (Fig. 7).
Mechanism of dye release
The mechanism by which cecropin A causes dye to leak from lipid vesicles was determined using the ANTS/DPX assay (46–48). The dye release mechanism may be all-or-none, in which some vesicles lose all of their contents while others are not affected; or it may be graded, in which all vesicles lose part of their contents. In this assay, a fluorophore, ANTS, is encapsulated in the vesicles together with a fluorescence quencher, DPX. The peptide induces release of both, and the fluorescence from ANTS that escapes to the external solution is titrated by additional DPX. The observed fluorescence is then only due to ANTS remaining inside the vesicles. If the release is all-or-none, the degree of quenching in the vesicles is independent of the amount of ANTS and DPX released, because the vesicles are either intact or completely empty. Only the intact vesicles contribute to the signal, and since the DPX concentration in the intact vesicles does not change, neither does the degree of quenching. The assay was performed for cecropin A with vesicles of POPC/POPG 50:50 and 80:20. The experimental data clearly show that cecropin A induces all-or-none release (Fig. 9). As the fraction of fluorescence outside (fout) of the vesicles increases, the fluorescence from within the vesicles remains the same (Qin), resulting in a straight line with zero slope. If the release were graded, only some of the fluorophore would be released along with the quencher. The fluorescence of ANTS remaining in the vesicles would increase because the quencher concentration had also been lowered. The degree of quenching would then become a function of the amount of ANTS and DPX released. The dashed line in Fig. 9 represents qualitatively the type of function that would correspond to graded release.
Figure 9.
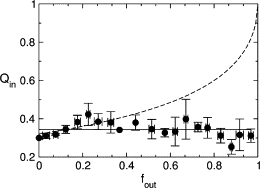
ANTS/DPX assay to determine the mechanism of release by cecropin A. The quenching function inside, which is the ratio of ANTS fluorescence inside the vesicle in the presence (Fi) and absence () of quencher (DPX), is plotted against the ANTS fraction outside the vesicles, fout, corrected for incomplete entrapment as described by Ladokhin et al. (48). The horizontal solid line is the result expected for all-or-none release and the dashed line for graded release. The concentrations encapsulated were 5 mM ANTS and 8 mM DPX. The data points correspond to experiments on 12 independent vesicle preparations. Because there are slight variations in the degree of encapsulation in different preparations, the Qin data were first normalized to the average initial fluorescence (in the absence of peptide), to bring all data sets to a common origin. The standard deviations for Qin and fout were calculated for each group of data points and are shown as error bars.
To ensure that the all-or-none dye release observed was not an artifact caused by vesicle fusion, the ANTS/DPX assay was repeated with tenfold lower concentrations of both lipid and peptide. The rationale is that fusion is less likely at lower lipid concentrations and, if the real outcome were graded release, it would be apparent under those conditions. Although the data had more scatter because of the small concentrations, the plot still indicated an all-or-none release (not shown).
However, because of the noisier data, we directly tested for peptide-induced vesicle fusion. Two populations of vesicles were labeled with either a lipid FRET donor, MB-POPE, or an acceptor, NBD-POPE (41), and equal amounts of those suspensions were mixed. If fusion occurred upon addition of cecropin A to this suspension, energy transfer would be expected, but none was observed (Fig. 10 A). As a control, peptide was added to vesicles labeled with both donor and acceptor probes at half the concentration, to determine the maximum possible amount of energy transfer between MB-POPE and NBD-POPE. Energy transfer is observed in this case (Fig. 10 B), and appears to decrease with addition of cecropin A. On closer examination, we found that what appears to be a change in energy transfer is in fact the result of a direct effect of cecropin A on the fluorescence of each lipid probe. In an additional control (not shown), peptide was added to vesicles containing either MB-POPE or NBD-POPE. These results showed that cecropin A directly increases the emission intensity of MB-POPE by ∼25% and decreases the intensity of NBD-POPE by ∼15%, with hardly any effect on energy transfer between them. In conclusion, cecropin A does not cause vesicle fusion under the conditions of the ANTS/DPX assay and induces all-or-none release from POPC/POPG vesicles.
Figure 10.
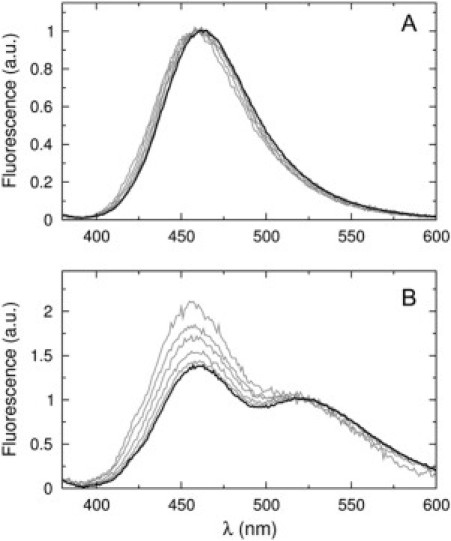
Test for possible vesicle fusion induced by cecropin A. (A) Cecropin A does not cause energy transfer when MB-POPE and NBD-POPE are located on separate vesicles. Identical volumes of vesicle suspensions of POPC/POPG 50:50 containing either 1 mol % MB-POPE or 1.5 mol % NBD-POPE were mixed and fluorescence emission spectra were collected before and after addition of cecropin A, exciting the MB at 367 nm. The solid line is the spectrum of vesicles without peptide (identical for all lipid concentrations after normalization by the MB peak at 463 nm). The shaded lines are spectra of vesicles for lipid concentrations of 25, 50, 100, 200, and 500 μM upon addition of 1 μM cecropin A. (B) Energy transfer between MB-POPE (0.5 mol %) and NBD-POPE (0.75 mol %) incorporated in the same vesicles (POPC/POPG 50:50) before and after addition of 1 μM cecropin A. The solid line is the spectrum of vesicles without peptide (identical for all lipid concentrations after normalization by the NBD peak at 530 nm). The shaded lines are normalized spectra of vesicles, upon addition of 1 μM cecropin A, for lipid concentrations of 25 (highest peak at 463 nm), 50, 100, 200, and 500 μM (closest to the solid line).
Carboxyfluorescein efflux kinetics
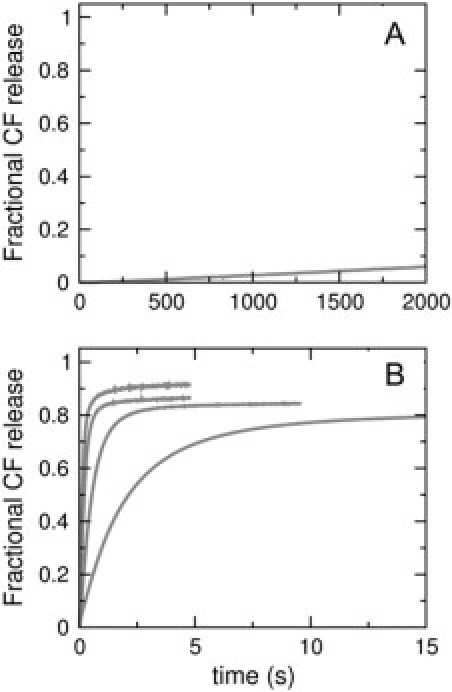
Addition of cecropin A to phospholipid vesicles containing CF encapsulated at high, self-quenching concentration causes efflux and consequent increase in fluorescence of CF that escapes from the vesicle lumen. The rate of CF fluorescence increase was used to follow the efflux kinetics. Cecropin A (1 μM) was mixed with LUVs, varying the lipid concentration from 25–400 μM, and the kinetics of dye efflux were monitored. This experiment was performed for pure POPC and POPG (Fig. 11), and for mixtures of POPC/POPG 50:50, 70:30, and 80:20 (Fig. 12, top panels). Efflux from pure POPC is almost zero (Fig. 11 A), while efflux from POPG is fast (Fig. 11 B). This was expected because POPC is zwitterionic and cecropin A requires anionic membranes to bind. As shown in Fig. 12 (top, shaded curves), increasing the content of anionic lipid (POPG) increases the efflux rate. It is also apparent that as the lipid concentration increases, the rate of efflux decreases, because the number of peptides bound per vesicle decreases.
Figure 11.
Carboxyfluorescein efflux induced by cecropin A (1 μM) from vesicles of (A) pure POPC (25 μM) and (B) pure POPG, for lipid concentrations of 25 μM (fastest), 50, 100, and 200 μM (slowest). The maximum possible fluorescence levels were determined by adding the detergent Triton X-100 to the vesicle suspension at a concentration of 1%, which dissolves the vesicles.
Figure 12.

Carboxyfluorescein efflux from POPC/POPG mixtures induced by direct addition of cecropin A (top panels) to POPC/POPG (A) 50:50, (C) 70:30, and (E) 80:20. In each top panel, the shaded curves correspond to lipid concentrations of 25, 50, 100, and 200 μM lipid (plus 400 μM in E). The fastest curve is always that for 25 μM lipid and the slowest is that for 200 μM lipid (400 μM in E). The peptide concentration is always 1 μM. The bottom panels show the CF efflux reverse experiments for the same vesicle compositions (shaded curves): POPC/POPG (B) 50:50, (D) 70:30, and (F) 80:20. Here, 60 μM donor vesicles containing no CF were incubated with 2 μM peptide for the amount of time required to reach a plateau in the fraction of dye released in the regular CF efflux experiments (top). This corresponded to incubation times of 30, 40, and 60 min for POPC/POPG 50:50, 70:30, and 80:20, respectively. After incubation with peptide, the empty donor vesicles were mixed with an equal volume of 40 μM, CF-containing acceptor vesicles, resulting in a final 50 μM total lipid and 1 μM peptide concentration. The maximum possible fluorescence levels were determined by adding the detergent Triton X-100 to the vesicle suspension at a concentration of 1%, which dissolves the vesicles. In all panels, the curves shown are averages of approximately four independent traces recorded on the same vesicle preparation. In addition, the data was reproduced at least twice in independent vesicle preparations. In the top three panels, the thin solid lines are the fits of the model of Fig. 3, and correspond to the integrated differential Eqs. 13–17. The values obtained for the only variable parameter in these fits, β = k1/k2, are listed in Table 1. The fits also used the values of kon and koff independently obtained from the binding and dissociation kinetics, and the fixed parameters keflx = 100 M−1 s−1 and k1 = 0.01 s−1. In the bottom three panels, the dashed line is calculated using the exact values obtained from the corresponding fits in the top panels (Table 1). Allowing for a slight adjustment of β to fit the reverse experiment curves, the solid line is obtained, which corresponds to the values β = 1.4 × 10⁻³ for (B) 50:50, (D) 1.0 × 10⁻³ for 70:30, and (F) 0.73 × 10⁻³ for 80:20.
To further constrain the analysis of the CF efflux data, a reverse experiment was carried out: the efflux kinetics was measured after cecropin A was preincubated for ∼1 h with empty vesicles (donors), which were then mixed with vesicles containing CF (acceptors). Now, cecropin must dissociate from the donor vesicles, back into solution, before it can bind to acceptor vesicles and induce CF release. This experiment was performed for POPC/POPG 50:50, 70:30, and 80:20, the lipid composition of both types of donor and acceptor vesicles being identical in each case (Fig. 12, bottom panels, shaded curves). The CF efflux kinetics in the reverse experiments are very similar to those in the direct addition experiments performed with the same lipid and peptide final concentrations (Fig. 12, top panels, 50 μM lipid curves). Thus, after incubation with empty vesicles, cecropin A is able to release CF with almost identical kinetics as if it were added directly to the full vesicles. This indicates that the peptides can readily desorb from the donors and are then free to act on the newly added acceptor vesicles. In Fig. 12, the thin solid lines are the fits to the CF efflux experiments, with the model represented in Fig. 3, as described in the next section.
Analysis of CF efflux kinetics
Many different models to explain the mechanism of cecropin A were conceived and quantitatively tested against the experimental CF efflux kinetics (Fig. 12, shaded curves). Among the model variations tested were several versions that included oligomerization of cecropin A in the membrane. None of those models could fit the data. Of all models, only the one depicted in Fig. 3 was able to fit all the data in a global manner. In this model, cecropin A, which is monomeric in aqueous solution (25), binds reversibly to lipid vesicles. At some point, the vesicle yields and releases all its contents, in agreement with the all-or-none mechanism. The peptide can still bind to, and dissociate from empty vesicles, with the same kon and koff that apply to full vesicles. The kinetic mechanism corresponding to this model is represented by Eqs. 13–17. These equations were numerically integrated and directly fit to the experimental CF efflux data. In those fits, the values of kon and koff obtained from the binding and dissociation kinetics, as well as keflx and k1, were used as fixed parameters. The model has only one truly variable parameter, β = k1/k2, which was adjusted by a global fit to the CF efflux kinetics for all lipid concentrations pertaining to each lipid composition. The solid lines in the top panels of Fig. 12 are the best fits to the data. The corresponding values for the complete set of parameters of the model and their standard deviations are indicated in Table 1. We find that β does not vary much with lipid composition, but is a minimum at POPC/POPG 70:30. The dashed lines in the bottom panels of Fig. 12 are not fits, but are the curves calculated for the reverse experiment using the exact average values of the parameters obtained in the direct addition experiment (Fig. 12, top panels). The agreement with the data is already very good, and only a small adjustment of β is necessary to produce the fits shown by the solid lines in the three bottom panels.
Discussion
Cecropin A binding to membranes
Binding of cecropin A to LUVs of pure POPC and POPC/POPG mixtures is entirely reversible, which argues against the peptide forming a stable pore. The on-rate constants for the POPC/POPG mixtures and for pure POPC are similar to each other and close to the diffusion limit. A slight trend for larger kon with increasing anionic lipid content of the vesicles is apparent, but kon only doubles from pure POPC to POPC/POPG 50:50. On the other hand, koff is very sensitive to the POPG content and decreases by three orders of magnitude from POPC to POPC/POPG 50:50. The dependence of the equilibrium dissociation constant, KD = koff/kon, on anionic lipid content is therefore determined by koff. Clearly, lipid charge plays a major role in binding, as already noticed by Silvestro et al. (25), who compared binding to pure POPC with binding to vesicles containing 20 mol % anionic lipid (1-palmitoyl-2-oleoyl-phosphatidic acid, POPA). The apparent KD from their data for POPC/POPA 80:20 vesicles is ∼300 μM, in good agreement with the value of KD = 270 μM determined here. The values of KD tabulated by Silvestro et al. (25) are much smaller, but that is because the model used to analyze their data defines discrete binding sites on the membrane. Our KD is conceptually equivalent to a partition coefficient (28), and does not involve defined binding sites; therefore, it should be compared directly with their apparent KD. For pure POPC, both studies estimate KD of ∼1 mM.
Thus, the negative charge on the lipid vesicles, imparted by the anionic lipid component (POPG), is important mainly for cecropin A binding, which is the single most important factor that determines the rate of CF release induced by cecropin A. In fact, it is koff that determines the differences between efflux from POPC/POPG 50:50, 70:30, and 80:20 vesicles. Vesicle charge, however, has a minimal effect on the other rate constants: keflx and k1 were kept fixed, and β = k1/k2 varies only weakly, and not monotonically, with POPG content (Table 1). Thus, charge does not seem to be important for the step that actually corresponds to pore formation and bilayer permeabilization in the pore state. This is in agreement with the observation that the permeabilization step for POPC membranes is not any slower than for anionic membranes (25). Suggestions have been made that a complex can form between an anionic amphiphile, such as POPG, and a cationic peptide, which could help translocate the peptide across the membrane (52). This possible mechanism does not seem to operate in the case of cecropin A. Thus, the electrostatic interaction between cecropin A and the lipid is essential for good binding but not for disruption of the bilayer. Cecropins should therefore act as broad-spectrum antimicrobials against organisms with anionic membranes. Consistent with this idea is the observation that their genes are not subject to high mutation rates, unlike other antimicrobial peptides (53).
Kinetics and mechanism of dye release
The rate of CF efflux increases with the P/L ratio, as is well known (25). The significant new finding is that the same model quantitatively describes the kinetics over a broad range of P/L for three different vesicle compositions (Fig. 12). This strongly suggests that the same mechanism operates over that entire concentration range. Experiments where cecropin was prebound to empty vesicles and then mixed with CF-loaded vesicles (reverse experiment) yielded CF efflux rates almost identical to those obtained by direct mixing with the loaded vesicles, indicating that desorption occurs rapidly and the peptide does not, in the main, occur in the form of stable pores.
Cecropin A causes all-or-none release of the contents of phospholipid vesicles (Fig. 9) and this is not an artifact due to vesicle fusion. Evidence for the all-or-none dye release had been presented before (25), but the range of induced release had only been examined up to a fraction of 0.27, which could be misleading. (Based on similarly limited data, the release mechanism of melittin was believed to be all-or-none (25), but subsequent data seems to indicate it is graded (54).) Now, examination of the full range of release definitely establishes the all-or-none mechanism for cecropin A. Knowing the release mechanism is essential to write a correct kinetic model for efflux because this information is explicitly used in the formulation of the differential equations (Eqs. 13–17).
The mechanism of the all-or-none release has been explained for situations where the average number of peptides bound per vesicle is very small, of the order of the number of peptides necessary to form a pore (55). Some of those vesicles have less than the average and retain their contents, while others have more and release all contents. This explanation, however, is not valid if the number of peptides bound per vesicle is very large, of order 100, which is the case for cecropin A in these experiments. A different molecular mechanism must therefore operate here. What we believe is happening is the following.
Mechanism of cecropin A
At low peptide concentration on the membrane the vesicles remain tight to leakage (Fig. 3 B). As more peptide is bound, the membrane accommodates it, oriented parallel to the surface (29,30). The bound peptides probably cause bilayer thinning (19,40,56) and positive curvature strain because of the excess mass on the outer monolayer of the membrane (15). A point of rupture is eventually reached where the bilayer yields, allowing the contents to leak out all at once (Fig. 3 C). The molecular conformation of the membrane in this pore state may very well be that of a bilayer with one or more toroidal pores (38–40,56,57). The usual concept is that the toroidal pore is lined by the peptides, oriented perpendicular to the membrane, and by the lipid headgroups (19). We posit, in contrary, that the pores are not neatly lined by the peptides, though a fraction of them also occurs in the pores. Rather, the arrangement of peptides in the pores is probably much more disorganized, and they occur also on the membrane surface even in the pore state of the vesicles. This is apparent in recent molecular dynamics (MD) simulations of a magainin analog (58). Experimentally, in most lipids, the estimated fraction of the peptide melittin in the pores is well below 1/2 for P/L ≤ 1:25 (56), which is the concentration range used here. The same is true for magainin in POPC even at P/L 1:20 (18). It should be pointed out, however, that the molecular arrangement of the peptides and lipids in the toroidal pore model is still entirely conjectural. The structure of these pores has never been determined.
The reason we believe the fraction of peptides in the pores is small is that they desorb very readily from the vesicles, as shown by the dissociation kinetics (Fig. 7) and the reverse CF efflux kinetics experiments (Fig. 12). If the peptides were mainly concentrated in the pore regions, they should be able to translocate to the inner monolayer with the same likelihood as returning to the top monolayer, as soon as the transient pore state of the vesicle relaxes. If this were to happen, the amount of peptide dissociation after preincubation with donor vesicles, as well as its rate, would significantly decrease, which is inconsistent with those two experiments. Furthermore, a concerted transition from a surface-associated to an inserted state would exhibit a cooperativity that is completely absent from the dye release kinetics. On the contrary, participation of some cecropin A molecules in a peptide/lipid toroidal pore that is mainly unstructured is consistent with the observation that cecropin A is always oriented parallel to the membrane surface (29).
Peptide binding parallel to the membrane is postulated by the carpet model (3,16,20); our results agree with this feature. However, no extensive coverage of the membrane surface by peptide occurs, nor is it required for function. Also, the vesicles do not disintegrate or micellize, at least at the P/L ratios used here. This is evident because the on- and off-rate constants are exactly the same for intact and empty vesicles, and for vesicles incubated with the peptides for as short a time as possible and for very long times. One set of values of kon and koff is sufficient to quantitatively describe all the data for binding, dissociation, and CF efflux kinetics. That neither extensive coverage nor membrane micellization occur is in disagreement with the most common picture of the carpet model.
It thus appears that the effect of cecropin A is the generation of strain on the membrane, which is relieved by formation of pores. Formation of toroidal pores in a bilayer under mechanical stress has been observed in MD simulations (59). We believe this pore state to be a transient state of the whole vesicle—hence the all-or-none mechanism of dye release. This is consistent with the ideas of Brochard-Wyart et al. (38), Karatekin et al. (39), and Huang (40). In this view, cecropin A may cause membrane thinning and positive curvature strain, which is relieved when the whole vesicle yields, opening up pores that allow complete release of contents. The unstable pore state of the vesicles relaxes when the mass imbalance across the bilayer is dissipated, mainly through lipid transport mediated by the pores, as also observed in MD simulations (60), although some peptide translocation probably occurs as well. If, for other peptides, dissipation of the imbalance occurs faster than the complete leakage, the model may also account for incomplete but all-or-none dye release.
Minimal sequence requirements may be sufficient for peptides to bind to, and permeabilize membranes by this mechanism. It is clear that interaction with bacterial membranes is necessary for function, and that it occurs at the level of the lipid bilayer. Our model provides a good description of this process. However, the question remains whether the negative charge on the membrane is sufficient, or interaction with intracellular targets is responsible for specificity (11).
Conclusion
The model developed for the interaction of cecropin A with membranes is extremely simple (Fig. 3). It involves only peptide monomers that bind reversibly and a pore state of the vesicle. Yet, this model can quantitatively account for the efflux kinetics as a function of lipid concentration and vesicle composition with only one variable fit parameter, the ratio between the rate of formation and relaxation of the pore state. Its value is β ∼10−3 for all vesicle compositions. In this infrequent state, the vesicles release essentially all their contents, as required by the all-or-none release mechanism. Large pores probably exist at this point, which eventually reseal. The molecular structure of the pore state still needs to be determined, but does not seem to involve any specific peptide arrangement. In this sense, we could call this a nonstoichiometric pore model.
Acknowledgments
This work was supported in part by National Institutes of Health grant No. GM072507.
Footnotes
Editor: Paul H. Axelsen.
This is an Open Access article distributed under the terms of the Creative Commons-Attribution Noncommercial License (http://creativecommons.org/licenses/by-nc/2.0/), which permits unrestricted noncommercial use, distribution, and reproduction in any medium, provided the original work is properly cited.
References
- 1.Hultmark D., Steiner H., Rasmuson T., Boman H.G. Insect immunity. Purification and properties of three inducible bactericidal proteins from hemolymph of immunized pupae of Hyalophora cecropia. Eur. J. Biochem. 1980;106:7–16. doi: 10.1111/j.1432-1033.1980.tb05991.x. [DOI] [PubMed] [Google Scholar]
- 2.Zasloff M. Antimicrobial peptides of multicellular organisms. Nature. 2002;415:389–395. doi: 10.1038/415389a. [DOI] [PubMed] [Google Scholar]
- 3.Shai Y. Mode of action of membrane active antimicrobial peptides. Biopolymers. 2002;66:236–248. doi: 10.1002/bip.10260. [DOI] [PubMed] [Google Scholar]
- 4.Lohner K., Blondelle S.E. Molecular mechanisms of membrane perturbation by antimicrobial peptides and the use of biophysical studies in the design of novel peptide antibiotics. Comb. Chem. High Throughput Screen. 2005;8:241–256. doi: 10.2174/1386207053764576. [DOI] [PubMed] [Google Scholar]
- 5.Bechinger B., Lohner K. Detergent-like actions of linear amphipathic cationic antimicrobial peptides. Biochim. Biophys. Acta. 2006;1758:1529–1539. doi: 10.1016/j.bbamem.2006.07.001. [DOI] [PubMed] [Google Scholar]
- 6.Chan D.I., Prenner E.J., Vogel H.J. Tryptophan- and arginine-rich antimicrobial peptides: structures and mechanisms of action. Biochim. Biophys. Acta. 2006;1758:1184–1202. doi: 10.1016/j.bbamem.2006.04.006. [DOI] [PubMed] [Google Scholar]
- 7.Wade D., Boman A., Wahlin B., Drain C.M., Andreu D., Boman H.G., Merrifield R.B. All-D amino acid-containing channel-forming antibiotic peptides. Proc. Natl. Acad. Sci. USA. 1990;87:4761–4765. doi: 10.1073/pnas.87.12.4761. [DOI] [PMC free article] [PubMed] [Google Scholar]
- 8.Bessalle R., Kapitkovsky A., Gorea A., Shalit I., Fridkin M. All-D-magainin: chirality, antimicrobial activity and proteolytic resistance. FEBS Lett. 1990;274:151–155. doi: 10.1016/0014-5793(90)81351-n. [DOI] [PubMed] [Google Scholar]
- 9.Wenk M., Seelig J. Magainin 2 amide interaction with lipid membranes: calorimetric detection of peptide binding and pore formation. Biochemistry. 1998;37:3909–3916. doi: 10.1021/bi972615n. [DOI] [PubMed] [Google Scholar]
- 10.Wieprecht T., Beyermann M., Seelig J. Binding of antibacterial magainin peptides to electrically neutral membranes: thermodynamics and structure. Biochemistry. 1999;38:10377–10387. doi: 10.1021/bi990913+. [DOI] [PubMed] [Google Scholar]
- 11.Hong R.W., Shchepetov M., Weiser J.N., Axelsen P.H. Transcriptional profile of the Escherichia coli response to the antimicrobial insect peptide cecropin A. Antimicrob. Agents Chemother. 2003;47:1–6. doi: 10.1128/AAC.47.1.1-6.2003. [DOI] [PMC free article] [PubMed] [Google Scholar]
- 12.Ehrenstein G., Lehar H. Electrically gated ionic channels in lipid bilayers. Q. Rev. Biophys. 1977;10:1–34. doi: 10.1017/s0033583500000123. [DOI] [PubMed] [Google Scholar]
- 13.Dempsey C.E. The actions of melittin on membranes. Biochim. Biophys. Acta. 1990;1031:143–161. doi: 10.1016/0304-4157(90)90006-x. [DOI] [PubMed] [Google Scholar]
- 14.Pokorny A., Birkbeck T.H., Almeida P.F.F. Mechanism and kinetics of δ-lysin interaction with phospholipid vesicles. Biochemistry. 2002;41:11044–11056. doi: 10.1021/bi020244r. [DOI] [PubMed] [Google Scholar]
- 15.Pokorny A., Almeida P.F.F. Kinetics of dye efflux and lipid flip-flop induced by δ-lysin in phosphatidylcholine vesicles and the mechanism of graded release by amphipathic, α-helical peptides. Biochemistry. 2004;43:8846–8857. doi: 10.1021/bi0497087. [DOI] [PubMed] [Google Scholar]
- 16.Papo N., Shai Y. Can we predict biological activity of antimicrobial peptides from their interactions with model phospholipid membranes? Peptides. 2003;24:1693–1703. doi: 10.1016/j.peptides.2003.09.013. [DOI] [PubMed] [Google Scholar]
- 17.Matsuzaki K., Murase O., Fujii N., Miyajima K. An antimicrobial peptide, magainin 2, induced rapid flip-flop of phospholipids coupled with pore formation and peptide translocation. Biochemistry. 1996;35:11361–11368. doi: 10.1021/bi960016v. [DOI] [PubMed] [Google Scholar]
- 18.Ludtke S.J., He K., Heller W.T., Harroun T.A., Yang L., Huang H.W. Membrane pores induced by magainin. Biochemistry. 1996;35:13723–13728. doi: 10.1021/bi9620621. [DOI] [PubMed] [Google Scholar]
- 19.Huang H.W. Action of antimicrobial peptides: two-state model. Biochemistry. 2000;39:8347–8352. doi: 10.1021/bi000946l. [DOI] [PubMed] [Google Scholar]
- 20.Pouny Y., Rapaport D., Mor A., Nicolas P., Shai Y. Interaction of antimicrobial dermaseptin and its fluorescently labeled analogues with phospholipid membranes. Biochemistry. 1992;31:12416–12423. doi: 10.1021/bi00164a017. [DOI] [PubMed] [Google Scholar]
- 21.Hancock R.E.W., Chapple D.S. Peptide antibiotics. Antimicrob. Agents Chemother. 1999;43:1317–1323. doi: 10.1128/aac.43.6.1317. [DOI] [PMC free article] [PubMed] [Google Scholar]
- 22.Nizet V., Ohtake T., Lauth X., Trowbridge J., Rudisill J., Dorschner R.A., Pestonjamasp V., Piraino J., Huttner K., Gallo R.L. Innate antimicrobial peptide protects the skin from invasive bacterial infection. Nature. 2001;414:454–457. doi: 10.1038/35106587. [DOI] [PubMed] [Google Scholar]
- 23.Reference deleted in proof.
- 24.Steiner H., Hultmark D., Engstrom A., Bennich H., Boman H.G. Sequence and specificity of two antibacterial proteins involved in insect immunity. Nature. 1981;292:246–248. doi: 10.1038/292246a0. [DOI] [PubMed] [Google Scholar]
- 25.Silvestro L., Gupta K., Weiser J.N., Axelsen P.H. The concentration-dependent membrane activity of cecropin A. Biochemistry. 1997;36:11452–11460. doi: 10.1021/bi9630826. [DOI] [PubMed] [Google Scholar]
- 26.Steiner H. Secondary structure of the cecropins: antibacterial peptides from the moth Hyalophora cecropia. FEBS Lett. 1982;137:283–287. doi: 10.1016/0014-5793(82)80368-2. [DOI] [PubMed] [Google Scholar]
- 27.Holak T.A., Engstrom A., Kraulis P.J., Lindeverg G., Bennich H., Jones A., Gronenborn A.M., Clore G.M. The solution conformation of the antibacterial peptide cecropin A: a nuclear magnetic resonance and dynamical simulated annealing study. Biochemistry. 1988;27:7620–7629. doi: 10.1021/bi00420a008. [DOI] [PubMed] [Google Scholar]
- 28.White S.H., Wimley W.C. Membrane protein folding and stability: physical principles. Annu. Rev. Biophys. Biomol. Struct. 1999;28:319–365. doi: 10.1146/annurev.biophys.28.1.319. [DOI] [PubMed] [Google Scholar]
- 29.Silvestro L., Axelsen P.H. Membrane-induced folding of cecropin A. Biophys. J. 2000;79:1465–1477. doi: 10.1016/S0006-3495(00)76398-3. [DOI] [PMC free article] [PubMed] [Google Scholar]
- 30.Marassi F.M., Opella S.J., Juvvadi P., Merrifield R.B. Orientation of cecropin A helices in phospholipid bilayers determined by solid-state NMR spectroscopy. Biophys. J. 1999;77:3152–3155. doi: 10.1016/S0006-3495(99)77145-6. [DOI] [PMC free article] [PubMed] [Google Scholar]
- 31.Steiner H., Andreu D., Merrifield R.B. Binding and action of cecropin and cecropin analogues: antibacterial peptides from insects. Biochim. Biophys. Acta. 1988;939:260–266. doi: 10.1016/0005-2736(88)90069-7. [DOI] [PubMed] [Google Scholar]
- 32.Silvestro L., Weiser J.N., Axelsen P.H. Antibacterial and antimembrane activities of cecropin A in Escherichia coli. Antimicrob. Agents Chemother. 2000;44:602–607. doi: 10.1128/aac.44.3.602-607.2000. [DOI] [PMC free article] [PubMed] [Google Scholar]
- 33.Durell S.R., Raghunathan G., Guy H.R. Modeling the ion channel structure of cecropin. Biophys. J. 1992;63:1623–1631. doi: 10.1016/S0006-3495(92)81730-7. [DOI] [PMC free article] [PubMed] [Google Scholar]
- 34.Gazit E., Miller I.R., Biggin P.C., Sansom M.S.P., Shai Y. Structure and orientation of the mammalian antibacterial peptide cecropin P1 within phospholipid membranes. J. Mol. Biol. 1996;258:860–870. doi: 10.1006/jmbi.1996.0293. [DOI] [PubMed] [Google Scholar]
- 35.Gazit E., Boman A., Boman H.G., Shai Y. Interaction of the mammalian antibacterial peptide cecropin P1 within phospholipid vesicles. Biochemistry. 1995;34:11479–11488. doi: 10.1021/bi00036a021. [DOI] [PubMed] [Google Scholar]
- 36.Gazit E., Lee W.J., Brey P.T., Shai Y. Mode of action of the antibacterial peptide cecropin B2: a spectrofluorometric study. Biochemistry. 1994;33:10681–10692. doi: 10.1021/bi00201a016. [DOI] [PubMed] [Google Scholar]
- 37.Yandek L.E., Pokorny A., Floren A., Knoelke K., Langel U., Almeida P.F.F. Mechanism of the cell-penetrating peptide Tp10 permeation of lipid bilayers. Biophys. J. 2007;92:2434–2444. doi: 10.1529/biophysj.106.100198. [DOI] [PMC free article] [PubMed] [Google Scholar]
- 38.Brochard-Wyart F., de Gennes P.G., Sandre O. Transient pores in stretched vesicles: role of leak-out. Physica A. 2000;278:32–51. [Google Scholar]
- 39.Karatekin E., Sandre O., Guitouni H., Borghi N., Puech P.H., Brochard-Wyart F. Cascades of transient pores in giant vesicles: line tension and transport. Biophys. J. 2003;84:1734–1749. doi: 10.1016/S0006-3495(03)74981-9. [DOI] [PMC free article] [PubMed] [Google Scholar]
- 40.Huang H.W. Molecular mechanism of peptide-induced pores in membranes. Phys. Rev. Lett. 2004;92:198304. doi: 10.1103/PhysRevLett.92.198304. [DOI] [PubMed] [Google Scholar]
- 41.Frazier M.L., Wright J.R., Pokorny A., Almeida P.F.F. Investigation of domain formation in sphingomyelin/cholesterol/POPC mixtures by fluorescence resonance energy transfer and Monte Carlo simulations. Biophys. J. 2007;92:2422–2433. doi: 10.1529/biophysj.106.100107. [DOI] [PMC free article] [PubMed] [Google Scholar]
- 42.Vaz W.L.C., Hallmann D. Experimental evidence against the applicability of the Saffman-Delbrück model to the translational diffusion of lipids in phosphatidylcholine bilayer membranes. FEBS Lett. 1983;152:287–290. [Google Scholar]
- 43.Kates M. Techniques in lipidology. In: Work T.S., Work E., editors. Laboratory Techniques in Biochemistry and Molecular Biology. North-Holland Publishing Company; Amsterdam, The Netherlands: 1972. [Google Scholar]
- 44.Horlsey L.H. Azeotropic data. In: Gould R.F., editor. Advances in Chemistry Series 116. Vol. III. American Chemical Society; Washington, DC: 1973. [Google Scholar]
- 45.Bartlett G.R. Phosphorous assay in column chromatography. J. Biol. Chem. 1959;234:466–468. [PubMed] [Google Scholar]
- 46.Wimley W.C., Selsted M.E., White S.H. Interactions between human defensins and lipid bilayers: evidence for formation of multimeric pores. Protein Sci. 1994;3:1362–1373. doi: 10.1002/pro.5560030902. [DOI] [PMC free article] [PubMed] [Google Scholar]
- 47.Ladokhin A.S., Wimley W.C., White S.H. Leakage of membrane vesicle contents: determination of mechanism using fluorescence requenching. Biophys. J. 1995;69:1964–1971. doi: 10.1016/S0006-3495(95)80066-4. [DOI] [PMC free article] [PubMed] [Google Scholar]
- 48.Ladokhin A.S., Wimley W.C., Hristova K., White S.H. Mechanism of leakage of contents of membrane vesicles determined by fluorescence requenching. Methods Enzymol. 1997;278:474–486. doi: 10.1016/s0076-6879(97)78025-x. [DOI] [PubMed] [Google Scholar]
- 49.Colquhoun D. Clarendon Press; Oxford, UK: 1971. Lectures on Biostatistics. [Google Scholar]
- 50.Colquhoun D., Hawkes A.G. The interpretation of single channel recordings. In: Ogden D., editor. Microelectrode Techniques. The Plymouth Workshop Handbook. 2nd Ed. The Company of Biologists Ltd.; Cambridge, UK: 1987, 1994. [Google Scholar]
- 51.Press W.H., Teukolsky S.A., Vetterling W.T., Flannery B.P. 2nd Ed. Cambridge University Press; New York, NY: 1994. Numerical Recipes in Fortran. [Google Scholar]
- 52.Sakai N., Takeuchi T., Futaki S., Matile S. Direct observation of anion-mediated translocation of fluorescent oligoarginine carriers into and across bulk liquid and anionic bilayer membranes. ChemBioChem. 2005;6:114–122. doi: 10.1002/cbic.200400256. [DOI] [PubMed] [Google Scholar]
- 53.Quesada H., Ramos-Onsins S.E., Aguadé M. Birth-and-death evolution of the cecropin multigene family in Drosophila. J. Mol. Evol. 2005;60:1–11. doi: 10.1007/s00239-004-0053-4. [DOI] [PubMed] [Google Scholar]
- 54.Rex S., Schwarz G. Quantitative studies on the melittin-induced leakage mechanism of lipid vesicles. Biochemistry. 1998;37:2336–2345. doi: 10.1021/bi971009p. [DOI] [PubMed] [Google Scholar]
- 55.Parente R.A., Nir S., Szoka F.C., Jr. Mechanism of leakage of phospholipid vesicle contents induced by the peptide GALA. Biochemistry. 1990;29:8720–8728. doi: 10.1021/bi00489a031. [DOI] [PubMed] [Google Scholar]
- 56.Lee M.T., Chen F.Y., Huang H.W. Energetics of pore formation induced by membrane active peptides. Biochemistry. 2004;43:3590–3599. doi: 10.1021/bi036153r. [DOI] [PubMed] [Google Scholar]
- 57.Puech P.H., Borghi N., Karatekin E., Brochard-Wyart F.. Line thermodynamics: adsorption at a membrane edge. Phys. Rev. Lett. 2003;90:128304. doi: 10.1103/PhysRevLett.90.128304. [DOI] [PubMed] [Google Scholar]
- 58.Leontiadou H., Mark A.E., Marrink S.J. Antimicrobial peptides in action. J. Am. Chem. Soc. 2006;128:12156–12161. doi: 10.1021/ja062927q. [DOI] [PubMed] [Google Scholar]
- 59.Tieleman D.P., Leontiadou H., Mark A.E., Marrink S.J. Simulation of pore formation in lipid bilayer by mechanical stress and electric fields. J. Am. Chem. Soc. 2003;125:6382–6383. doi: 10.1021/ja029504i. [DOI] [PubMed] [Google Scholar]
- 60.Tieleman D.P., Marrink S.J. Lipids out of equilibrium: energetics of desorption and pore mediated flip-flop. J. Am. Chem. Soc. 2006;128:12462–12467. doi: 10.1021/ja0624321. [DOI] [PubMed] [Google Scholar]