

Abstract
Almost each mammalian cell permanently applies forces to its environment. These forces are essential for many vital processes such as tissue formation or cell movement. In turn, the environmental conditions of cells strongly affect force production. Here we report on the development of an array of elastomeric micropillars as cellular environment. Within these micropillar arrays, we cultivated rat heart muscle cells (cardiac myocytes). For lattice constants between 20 and 30 μm, cells strongly preferred spanning between the elastic micropillars over adhering to the underlying flat substrate. In addition, the architectures of the cytoskeleton and of protein complexes formed for adhesion were strongly dependent on the environment of the cell. On flat parts of the substrates, we observed prominent stress fibers and focal adhesion sites. In contrast, cells suspended between micropillars exhibited well organized myofibers and costameric adhesions at the locations of Z-bands. These observations argue for close-to-nature environmental conditions within micropillar arrays. Resting as well as contraction forces of myocytes resulted in measurable pillar bending. Using an approximate theoretical treatment of elastically founded micropillars, we calculated average cell forces of 140 nN in the relaxed and 400 nN in the contracted state.
Introduction
The blood circulation of each mammal is driven by the mechanical activity of heart muscle cells, also called cardiac myocytes. These cells exhibit a defined morphology and create intense forces upon contraction. They are arguably the most physically energetic cell type in the body. Myocytes isolated from heart tissue can retain their ability to contract spontaneously and regularly. For these reasons, myocytes are important model systems to study force generation.
Cardiac myocyte force generation strongly depends on repetitive actin-myosin units merged in muscle-specific complexes called sarcomers (1). Within these structures, a strictly regulated interplay between actin and myosin takes place, enabling myosin bundles to slide along actin filaments, which causes a shortening of the sarcomer structure and thus eventually a contraction of the entire muscle. Actin filaments as well as myosin bundles are anchored within an optically dense structure called the Z-band or Z-disk, determining the boundaries of each sarcomer. Within the Z-disks, actin filaments are cross-linked by α-actinin. This protein forms an antiparallel homodimer with one actin binding site at each head and is one of the most prominent Z-band specific proteins (2,3). Consecutive sarcomers of cardiac myocytes form muscle fibrils spanning the whole cell. In cardiac myocytes from heart tissue, these muscle fibrils are oriented parallel with aligned sarcomers and fill almost the whole cytoplasmic space. For proper contraction of all muscle fibrils in a defined direction, connections between muscle fibrils within one cell as well as to the extracellular matrix (ECM) or other cardiac myocytes are essential. Here, costameric protein complexes come into play. The term costamere was first used by Pardo and co-workers (4) to describe vinculin containing, rib-like bands. Resembling the metal hoops of a wooden barrel, costameres flank the Z-bands. In adult tissue myocytes, the costamere consists of a complex protein network that physically connects the Z-bands of muscle cells to the surrounding ECM. Thereby costameres provide direct linkages between the contractile apparatus of the cell and ECM proteins (3). In addition to their role in cell attachment, Danowski et al. (5) first demonstrated that costameres are sites where contractile forces are directly transmitted to the surrounding ECM. Structurally, costameres share many of the features of cell-matrix adhesion sites found in nonmuscle cells. One example is that vinculin can be found in costameres as well as in focal adhesion sites. In both structures, it mainly functions as actin bundling protein or multidomain bridge factor. Together with several other proteins, vinculin connects integrins with the actin cytoskeleton (6). When isolated and plated on petri dishes as single cells, cardiac myocytes remodel their adhesive structures to adapt to the two-dimensional culture environment (7,8). This adaptation results in adhesive structures that resemble classical focal adhesion sites (9,10). Under physiological conditions, costameres form well-ordered stripes all over the myocyte, whereas on flat substrates, remodeled adhesion structures occur mostly at the outer rim of the cell substrate contact zone. In isolated cells on flat substrates, such costamere-specific proteins as vinculin and α-actinin can be found at Z-bands along myofibrils. However, it still remains elusive if these proteins mainly connect myofibrils to the outer membrane or if they are also used as mechanical interconnections between myofibrils and the ECM, i.e., it is not yet clear if they are able to transmit forces.
In the literature, force measurements on whole heart tissues as well as on single cells were reported. Especially for measurements on isolated cardiac myocytes, several setups were built (11–13). Cell force transducers (14), suction pipettes (15), glass needles (16), carbon fibers (17), or magnetic traps (18) are just some examples. In all, cited studies, myocytes from adult heart ventricles were used. Contraction forces in the range of 0.7 μN–10 μN were reported. Other techniques for cell force analyses depended on the use of cross-linked poly-dimethylsiloxane (PDMS) elastomers. Here, either flat substrates with embedded ordered micropatterns (10,19) or dense arrays of micropillars were used. The micropillars were chemically activated at the very top to promote cell adhesion exclusively at the micropillar capitals (20). These analyses revealed contraction forces for cardiac myocytes, isolated from neonatal rat fetuses, in the range of 300–600 nN. The large spread in reported forces originates, at least in a major part, from the fact that in some studies myocytes were externally activated by calcium or voltage applications, whereas in others spontaneous contractions were studied.
Many of the aforementioned techniques imply studying myocytes on flat or almost flat substrates. However, a number of studies have shown pronounced differences between cells cultivated on flat substrates and identical cells living in three-dimensional matrices. Effects on cell morphology were reported 35 years ago (21). In recent work, influences on numerous structures and processes were found (22). For fibroblasts, for example, a pronounced influence of the dimensionality of the substrate on size, shape, and molecular composition of cell matrix adhesion structures was reported (23). In line with these observations, heart muscle cells are also influenced by the nature of their substrates as they adhere to flat substrates via structures resembling focal adhesions and not via the physiologically relevant costameres. Therefore, the physiological relevance of force measurements on flat substrates needs to be clarified. For this reason, the main goal of our experiments was to establish an experimental setup that would combine close-to-nature conditions for cell culture with highly sensitive cell force analysis.
Former publications had shown dense arrays of micropillars to be highly sensitive force sensors (20,24,25). However, up to now, micropillars were mechanically described as beams with one end clamped and the other free. This is only an approximation, because PDMS micropillars emerge from a thick layer of identical material. Thus their foundation is not rigid but elastic. We showed by an approximate treatment that elastically founded beams are less stiff than clamped beams. For the pillar geometries used here, the softening amounts to ∼30%.
By increasing the lattice constant between the pillars to distances resembling approximately the size of myocytes, we succeeded in creating a three-dimensional environment for cell growth. To the micropillars forming this medium, cardiac myocytes adhered at their Z-bands. The presence of costameric adhesions as well as their overall morphology showed that cell conditions were close to physiological. Thus micropillar arrays combine some of the advantages of flat surfaces and of three-dimensional matrices for cell studies. On one hand, live cell imaging and analysis can be performed just as on flat substrates. On the other hand, close-to-nature cell behavior is expected for cells within three-dimensional matrices.
Materials and methods
Lithographic techniques
Silicon wafers (3-inch diameter, 〈1 0 0〉 crystallographic orientation, Silicon Materials, Landsberg, Germany) were overlayed with a 25–30 μm thick layer of photoresist (SU-8 Negative Tone Photoresist Formulation 2-25, Microchem, Newton, MA) using a spin coater at 2000 rpm for 30 s. Photoresist layers were prebaked at 90°C for 5 min and slowly cooled down to room temperature (5 min). Using ultraviolet-photolithography at 346 nm with a source power of 7 mW for 25 s, the structure of a photolithography mask was transferred into the photoresist layer. The lithography mask itself was written using an electron beam lithograph and consisted of a square lattice of chromium squares (10 μm width) with a lattice constant that varied over the sample (20, 25, 30, 35, 45, 60, 80, and 110 μm). The wafer was postbaked at 90°C for 30 s and for additional 15 min at room temperature to allow the resist to cross-link completely in exposed areas. Uncross-linked resist was removed by an SU-8 developer (Microchem) for at least 6 min. The developing process was stopped by immersion in isopropanol. Subsequently, the SU-8 molds were silanized by exposure to the vapor of 1H,1H′,2H,2H′-perfluorooctyl-trichlorosilane (Sigma, St. Louis, MO) in vacuum for 15 min at room temperature.
Fabrication of PDMS micropillars
PDMS elastomer Sylgard 184 (Dow Corning, Midland, MI) was carefully mixed in a 20:1 ratio (base/cross-linker). A small droplet (∼200 μl) of the mixed fluid was dispensed onto the microstructured SU-8 master and kept under vacuum for 30 min. This allowed the still fluid PDMS mixture to fill the pattern and removed air bubbles from holes. A 100 μm thick microscope coverslip (Menzel Gläser, Braunschweig, Germany) was put on top of the wafer. Uniform PDMS layer thickness was ensured by using 80 μm spacers. Samples were subsequently baked for 16 h at 60°C to cross-link the PDMS. Coverslips with PDMS micropillars on top were peeled off the silicone wafers in the presence of isopropanol and put into petri dishes. Keeping the sample wet for the whole time was crucial, as drying caused the collapse of PDMS columns. Over time, isopropanol was exchanged for distilled water under sterile conditions to avoid sample contamination. Coverslips with PDMS micropillars on top were glued with 10:1 PDMS to the bottom of perforated petri dishes. Immediately after attachment of the micropillar arrays, these dishes were filled again with sterile water. Samples were baked for 1 h at 60°C to cross-link the 10:1 PDMS. For storage, water was exchanged for sterile phosphate-buffered saline (PBS) (137 mM NaCl, 6.2 mM Na2HPO3, 1.5 mM KH2PO4, pH 7.2). Samples were stored at 4°C.
Microscopy of microstructures
For visualization of SU-8 structures, samples were cut in half, as a direct view into the deep structures was not possible. Structures were mounted onto scanning electron microscopy (SEM) stubs, gently blown with nitrogen to remove splitters and dust, and subsequently sputtered with gold. Scanning electron microscopy (Gemini 1550, Carl Zeiss, Jena, Germany) was performed at 10 kV at a 20° angle.
Pillars from PDMS collapsed during drying at the mixing ratio used for the experiments on cells (20:1 base/cross-linker). Therefore, micropillars from stiffer elastomer (10:1 ratio) were analyzed with the SEM. After peeling, PDMS micropillars were sputtered with gold, mounted onto SEM stubs, and visualized. Softer pillars were analyzed using a laser scanning confocal microscope (LSM510 with Axiovert 200M as microscope body, Carl Zeiss). For this purpose, PDMS structures were labeled with DiD (1,1′-dioctadecyl-3,3,3′,3′-tetramethylindodicarbocyanine 4-chlorobenzenesulfonate salt) Vybrant cell-labeling solution (Molecular Probes, Eugene, OR) in a 1:300 dilution. Staining was performed at 37°C for 2 days to allow diffusion of the dye into the elastomer. After staining, samples were washed twice in PBS and either directly analyzed at the LSM using a yellow HeNe laser (543 nm) or used as substrates for cultivating cells.
Mechanical characterization of the elastomer
The elastic properties of the elastomer were characterized as described before in detail (10). In brief, cylindrical test pieces of 1 mm diameter were produced from the same PDMS mixtures as the samples and stretched. Longitudinal elongation as well as transversal contraction of the test pieces was simultaneously determined by microimaging and subsequent digital image processing. The acting forces were measured with a precision scale. For these samples, we obtained a Young's modulus, E, of 608 kPa with a standard deviation of 20 kPa (six samples). In all cases, Poisson's number was close to 0.50. In earlier work, we showed that the mechanical properties of this elastomer were constant for at least 2 months (10). Thus aging played no role in our experiments.
Cell culture
Myocytes were isolated from 19-day-old Wistar rat fetal pups. In brief, CO2 anesthetized pregnant rats were decapitated, and the pups were removed and decapitated under sterile conditions. The heart of each fetus was quickly isolated, washed in Hanks’ balanced salt solution (Sigma), cut into small pieces and digested in a 0.5% Trypsin/0.2% EDTA solution in Hanks’ balanced salt solution to disintegrate the tissue. The resulting cell suspension was further incubated with 100 μl DNase-solution (10,000 u/ml, Sigma). Cells were collected by centrifugation at 200 × g. Cells were seeded on PDMS microstructures that were coated with 2.5 μg/cm2 human plasma fibronectin (BD Biosciences, San Jose, CA). After 60 min, nonadherent cells were removed with the supernatant. Cells were maintained at 37°C and 5% CO2 in a humidified incubator. The culture medium was F10 Ham's medium supplemented with 10% fetal bovine serum, a 1:100 dilution of an antibiotic solution (10,000 units penicillin and 10 mg/ml streptomycin in 0.9% NaCl, Sigma) and a 1:200 dilution of solution containing insulin (1 mg/ml), transferrin (0.55 mg/ml), and sodium selenite (0.5 μg/ml) in EBSS (Earle's balanced salt solution, Sigma).
Immunofluorescence
To stain adhesion sites and parts of the cytoskeleton, cells were fixed in 3.7% formaldehyde dissolved in cytoskeleton buffer (CB): 150 mM NaCl, 5 mM MgCl2, 5 mM EGTA, 5 mM glucose, 10 mM MES, pH 6.1) for 20 min at 37°C, followed by a rinsing step in 30 mM glycine-CB. Cells were permeabilized in 10% Triton X-100 in CB for 5 min and blocked in 10% normal goat serum for an additional 30 min. All antibodies were diluted in blocking solution. Antibody incubations were performed at 37°C for 45 min in a humidified chamber with thorough washing steps between the primary and secondary antibodies. Samples were mounted in Gel-Mount (Biomeda, Foster City, CA) containing 50 mg/ml 1,4-diazabicyclo[2.2.2]octane (Sigma). We used as primary antibodies a mouse monoclonal anti-vinculin (clone hVin-1, Sigma) and a mouse monoclonal anti α-actinin (clone EA-53, Sigma) antibody. The secondary antibody was a F(ab′)2 fragment against mouse IgGs produced in goat and conjugated to Cy3 (Dianova, Hamburg, Germany). To visualize filamentous actin, we used phalloidin coupled to fluorescein (Sigma).
Light microscopy
For light microscopy on living cells, petri dishes with DiD-labeled PDMS microstructures as the bottom were analyzed in a live cell imaging chamber (Incubator XL, Zeiss) mounted on the confocal microscope, which was equipped with a multi-immersion lens (LCI PlanNeofluar 63x/1.30 Ph3, Zeiss). Within this chamber, temperature and carbon dioxide concentration was maintained at cell culture conditions. Beating cells were selected in phase contrast microscopy. Subsequently, pillar bending was determined at a focus position of 15 μm above the base of the pillars in fluorescence mode. Few samples were imaged at a height of 20 μm. Please note that in this step, the index of refraction of the immersion fluid (65% glycerol in water, refractive index of 1.41) was not matched to the cell culture fluid (refractive index of 1.338). Therefore, the actual height of scanning is by a factor of 1.41/1.338 higher (26). Image sequences were taken at time intervals ranging from 0.1 to 0.17 s using a yellow HeNe laser (543 nm) and a 560 nm long pass filter.
Subsequently, cells were stained with calcein (1:200 in F10 Ham's medium, Invitrogen, Carlsbad, CA), which was added to the medium for 10 min at 37°C. After washing twice with PBS, the medium was replaced with minimal essential medium supplemented with 10% fetal bovine serum (Sigma), penicillin, and streptomycin (Penstrep, Sigma) and ITS supplement (insulin, transferrin, sodium selenite supplement, Sigma). Calcein stains living cells and had no obvious effect on cell morphology and behavior besides interrupting spontaneous contractions of most cells. The same cells as analyzed before were localized using the microstructure as a marker. All pillars neighboring the ones connected by the cells studied were included in the micrographs. Confocal micrographs were taken for calcein as well as DiD signals in two channels simultaneously using the yellow HeNe laser as given above and an argon laser (488 nm) with a 505–530 nm band pass filter. Image stacks (so-called Z-stacks) were collected at high spatial resolution in this configuration. From these stacks we determined the exact localization of the cell (by calcein staining) and the geometry of the micropillars (by DiD staining). For optimal optical resolution the refractive indices of the immersion fluid (65% glycerol in water) and the cell culture medium (addition of 32% BSA) were matched to the one of the elastomer (refractive index of 1.41). Geometrical parameters were read out from image stacks using the Zeiss LSM Image Browser (Version 3).
Immunofluorescently labeled cells were analyzed on the confocal microscope using a 63× Plan-Apochromat oil-immersion objective (differential interference contrast, NA = 1.4, Zeiss) equipped with appropriate excitation lasers and filter sets for Cy2, fluorescein, and Cy3.
Image processing
Digital image processing was used to determine the positions of the micropillars within the image sequences (algorithms written in MATLAB, The MathWorks, Natick, MA). Moreover, the moments of inertia of the micropillars were determined from the lowest image in the stack where interference with substrate inhomogeneities did not obscure the image (in most cases at a height of 1.5 μm).
As pillar positions were measured during cell contraction, scans were performed at high scanning speed with the drawback of increased noise levels. To overcome this problem, positions of the micropillars were determined by the deformable template matching technique.
The data were first filtered (median filter in a 3 × 3 × 3 neighborhood with 0.16 μm × 0.16 μm × 0.25μm as voxel size) and then transformed to the second step of a Gaussian pyramid (27). On these preprocessed data, the initial positions of moving and stationary pillars were interactively marked by rectangles. Position, size, and shape of the template were fitted for each pillar using the least-squares criterion. (28). Due to a flexible parameterization of the template, all shapes varying from circles over rounded squares to squares were possible. Rotation of the template was also parameterized. Positions of stationary pillars were used as reference points for drift correction. By these methods, we achieved an accuracy of the pillar positions of ∼34 nm.
The moments of inertia of the micropillars were calculated from the cross sections as follows. Micrographs of DiD labeled PDMS substrates and calcein labeled cells were acquired as described above. Calcein labeling blocked contraction of most myocytes but did not affect static cell contraction. Scans were performed for the region of interest (ROI) at low speed to reduce noise. For image processing, pillars were marked interactively. ROIs were filtered with a 3 × 3 median filter and smoothed with an 11 × 11 binomial filter (with a 0.07 μm × 0.07 μm × 0.25 μm as voxel size). To gain spatial resolution, ROIs were rescaled to threefold size by bicubic interpolation. Pillar segmentation was performed in two steps: a coarse segmentation as initialization and an exact boundary determination at the location of the maximum magnitude of the gradient. As the moment of inertia scales with size to the power of four, the accurate determination of the boundary was of major importance. For coarse segmentation, the Z-score Z was calculated for all square ROIs of 9 × 9 pixels to normalize the feature appearance (29). The Z-score of a random variable x is defined as with the mean of x and σ the standard deviation of x (30). Z was used for the binary segmentation with an interactively chosen threshold. Such segmentation yielded a mask image M of the pillar cross section. The boundary determination was performed by calculating the magnitude of the intensity gradient within the ROI, denoted in the following by G, as feature map of the pillar contour. The contour position of the pillar is located near the boundary of M. Thus the boundary coordinates of M were extracted to search for the maxima of G in normal direction to the pillar boundary. These coordinates were used to calculate the moments of inertia using (31), where x is the distance of the infinitesimal area dA to the axis of bending. The uncertainty of this method was ∼60 μm4.
Results
Properties of micropillar arrays
Micropillars from a PDMS elastomer were fabricated as described above. Their geometry was characterized by light microscopy and scanning electron microscopy. A typical electron micrograph is shown in Fig. 1 .
Figure 1.

Scanning electron micrograph of a micropillar array. Scale bar, 10 μm.
Micropillar geometry was fairly uniform over the sample. The exact morphology of the micropillars varied slightly from preparation to preparation. In most cases, the cross sections of the pillars were close to square at the base and rounded toward the apex. Moreover, the cross-sectional areas increased slightly with height. These shape imperfections are typical for photolithographically produced structures in thick resist and, more important, for molding of soft elastomers.
Effects of substrate geometry on primary cardiac myocytes
Myocytes were prepared from fetal rat pups 19 days after conception. Freshly isolated cells were seeded on PDMS micropillar arrays and cultivated. They were analyzed after 2–5 days. We found that myocytes attached preferentially to micropillars (Fig. 2, A and B ). If the distance between neighboring micropillars was 30 μm or less, with preferred smaller distances, many cells connected two adjacent micropillars without or with very little contact to the flat part of the substrate. In regions of the sample where the micropillars were further apart, most cells wrapped around one column with connections to the flat part of the substrate. We observed the formation of a loose cell layer on top of the flat substrate only in regions without columns. Examples for cell attachments are shown in Fig. 2 B.
Figure 2.
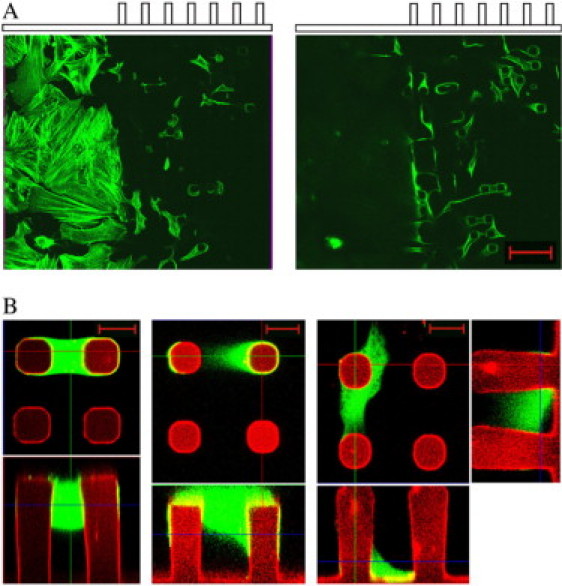
Freshly isolated cardiac myocytes were incubated for 2 days on PDMS substrates, which were partially covered by micropillar arrays. (A) Cells were fixed and subsequently stained for actin (FITC-phalloidin). Myocytes were analyzed at the border between flat substrate and micropillar array using confocal fluorescence microscopy. Note that the same substrate area is given twice: once focused on the flat surface (left) and once at a height of ∼20 μm above (right). Scale bar, 50 μm. (B) Living cells were labeled with calcein and image stacks were taken by a confocal microscope. Calcein (green) and DiD fluorescence (red) were collected simultaneously. Three possibilities of cell attachment to adjacent micropillars are given. Each image consists of a top view at the height indicated by a blue line in the side view given below. For the last cell, side views in both directions are given. Scale bars, 10 μm.
Cell morphologies varied dramatically with the local environment of cells. Although myocytes on flat substrates exhibited a spread-out, pancake-like shape, they were spindle-shaped and much more compact if they connected two micropillars (Fig. 2 A). Cells connecting a pillar to the flat substrate often displayed both morphologies at the same time.
In addition to these changes of the outer geometry of the cells, pronounced changes in the cytoskeleton and in the adhesion structures were seen. On flat substrates, the cytoskeleton displayed many prominent actin stress fibers. In addition, myofibers, responsible for cell contraction, were relatively unordered and mostly connected to stress fibers at their ends (Fig. 3 A ). These fibers connected the myofibers to the surface via classical focal adhesion sites (Fig. 3 B). However, these features were not observed for myocytes adhered between two micropillars. Here, actin stress fibers were basically absent. Instead, actin was mainly organized in sarcomeric myofibers spanning the whole cell. Sarcomeric organization was well defined by a regular pattern of prominent Z-bands labeled with α-actinin (Fig. 3, C and D). Moreover, this distribution of α-actinin indicated an absence of focal adhesion sites. Instead, adhesion between cell and column was mediated mainly by costameric protein complexes at the sites of Z-bands (Fig. 3, D–F). This type of adhesion as well as the absence of stress fibers resemble myocyte morphology in the myocardium of the heart and therefore indicate close to native growth conditions on our micropillar system.
Figure 3.
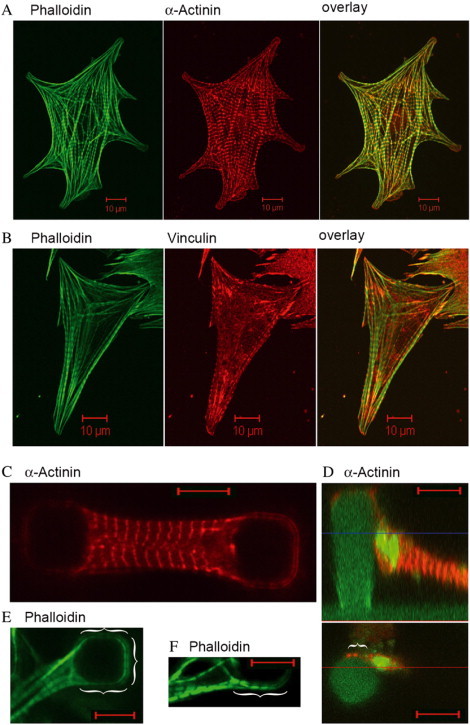
Cardiac myocytes were incubated for 2 days on either flat glass surfaces (A and B) or PDMS micropillar arrays (C–F). After fixation, cells were immunofluorescently labeled for actin (phalloidin, green) (A, B, E, and F), and α-actinin (red) (A, C, and D). Cells on glass were additionally labeled for vinculin (red) (B). Vinculin staining on PDMS micropillar substrates indicated a similar localization as α-actinin but are not shown because of an increased unspecific background staining. In D, micropillars were additionally stained with DiD (green). Green signals within the cell do not represent actin but DiD background staining. Actin organization was always found in myofibers all along the cells. Note, the lower part of D shows an optical slice at the height indicated by a blue line in the side view of the same cell given above. α-Actinin signals in the lower image therefore characterize only the protein localization at that height and do not represent the overall localization in the whole cell. Brackets mark close sarcomer (phalloidin) and Z-band/costamere (α-actinin) contact of myocytes to the micropillars. Scale bars, 10 μm.
In many cases, we observed beating myocytes. The beat frequencies ranged from 0.1 to 0.8 Hz with an average of 0.47 Hz (15 cells). No further analysis of beat frequencies was undertaken, as such an analysis should also include an investigation of the regularity of the contractions. Such an analysis would require a much longer time series than can be collected by fluorescence microscopy of living cells.
Cell contractions were accompanied by displacements of the micropillars. Positions of micropillars were recorded by collecting image sequences of DiD fluorescence micrographs and applying the image processing routines described in the Materials and Methods section. As the micropillars were arranged in a regular pattern, we could calculate the resting positions of the bent micropillars (i.e., the ones connected by cells) from the positions of undeflected micropillars close by, which were localized by the same methods (Fig. 4 A ). Lattice constants of micropillar arrays were measured on fluorescence micrographs showing several undeflected micropillars (typically 16). These calibration micrographs were taken after live cell staining with calcein. The results closely matched the input parameters of the respective photolithography masks. Amplitudes in the relaxed state as well as in the contracted state of cells are reported relative to these reference positions (Fig. 4 B). In a few cases, all columns in a field of view were connected by cells. In these instances, we calculated the distance between the observed columns and assumed that the deviation between this distance and the lattice constant was equally distributed between the displacements of both micropillars. In most cases, cell contractions ceased after calcein staining. However, cells often retained some resting tension as indicated by micropillar bending. Because calcein staining reduced cell contractility, all deflections and forces reported in this article were measured on unstained cells. An overview of column parameters and observed contraction amplitudes is given in Table 1 .
Figure 4.

Displacement of micropillars upon myocyte beating. (A) Micrographs at time 16.55 s (top) and 18.52 s (bottom). The inner two pillars are connected by a cell. The open arrows indicate the centers of undisplaced pillars. Scale bar, 10 μm. (B) Displacements of the pillar centers from their resting positions. (Solid) Left pillar, (shaded) right pillar, (solid lines) x coordinates, and (dotted lines) y coordinates.
Table 1.
Summary of the properties of the micropillars and the observed cells
| Column parameters | |
|---|---|
| Diameter at base (μm) | 9.2 (7.8; 10.0) |
| Moment of inertia at base (μm4) | 610 (240; 840) |
| Moment of inertia at scan height (μm4) | 830 (440; 980) |
| Young's modulus (kPa) | 608 |
| Poisson's number | 1/2 |
| Cell parameters | |
| Highest point of cell (μm) | 21.9 (17.8; 24.7) |
| Lowest point of cell (μm) | 5.0 (0; 13.8) |
| Observed amplitudes | |
| In relaxed state (μm) | 0.66 (0; 1.8) |
| In contracted state (μm) | 1.68 (0.7; 3.0) |
All results are given as averages (15 different cells exhibiting 15 contractions on average). Where applicable, lowest and highest observed values are given in parentheses.
Theoretical considerations
Although bending of slender beams is a standard topic in most textbooks on technical mechanics, our system displays several peculiarities that merit a closer look at the theory of beams for this specific case.
Most importantly, our micropillars reside on a substrate of identical material, thus their lower base is neither clamped nor free but “elastically founded” (Fig. 5 ). We will derive approximate equations for dealing with this peculiar boundary condition. Experiments on a magnified model were used to verify this approach. Moreover, the cross sections and thus the moments of inertia of most pillars varied with height. This can be easily incorporated into the equation for the shape of the bent beam. Finally, the distribution of transversal tensions applied by the cell to the pillars is not known a priori and cannot be determined by our experiments. Therefore, we will resort to two cases. One is denoted the “conservative estimate” and represents the lowest cell force compatible with all observations. It is calculated by assuming a point force at height l at the micropillar that is more bent. The other, more likely, loading case is distributing the load evenly over the whole contact zone between cell and pillar (see also Fig. 3 B, right).
Figure 5.
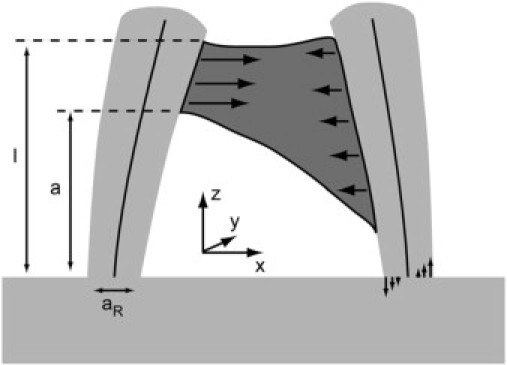
Basic features of our micropillar system. Two micropillars (light shaded) connected by a cell (dark shaded). Cells apply transversal tensions (solid arrows) to both beams (neutral axes depicted). The torque acting on each beam is balanced by normal tensions within the beam, depicted for the right beam. Further shown are the coordinate system and the geometrical parameters of the beams.
Approximation to the elastically founded beam
Far from the ends, a torque acting on a beam is balanced by a distribution of axial tensions,
| (1) |
where M denotes the torque and I the moment of inertia of the beam. For a square beam of side length a R , I is given by The origin of the coordinate system is placed into the neutral axis of the beam. A rigorous treatment of the elastically founded beam would require a finite element calculation of the entire system consisting of beam and substrate. However, such calculations depend strongly on the exact geometry of the system in the contact zone, which is unfortunately slightly varying from preparation to preparation. Thus we resorted to the following approximation. We assume that the distribution of tensions in the contact plane between micropillar and substrate, i.e., at the very base of the pillar, is given by Eq. 1. Using this assumption, the resulting deformation of the lower surface of the beam is calculated by the response of an elastic half space (32):
| (2) |
where denotes the displacement of the interface between beam and substrate, the force densities acting on this interface, and the Green's tensor of this problem. The integration is carried out over the cross section of the beam. The only nonvanishing component of is the z component given by The thickness of the flat elastomer film is at least three times the diameter of the beam. For this reason, we can approximate the elastic substrate of the beam by an elastic half space. The corresponding Green's tensor is given by (32)
| (3) |
with and Here, E denotes the Young's modulus of the elastomer, ν its Poisson's number, and The elastomer used by us exhibited a Poisson's number of 0.5. Therefore, which simplifies the calculations considerably.
Our microbeams exhibit a square cross section at the lower end. Thus is the only nonvanishing part of the displacement and is given by
| (4) |
Here the limits of integration are given by and The side length of the square is The integral possesses an analytical, albeit lengthy solution that will be not presented here. It is antisymmetric in x with respect to the center x = y = 0. The resulting surface deflection can be seen in Fig. 6 .
Figure 6.

Dimensionless surface deformation (Eq. 4). The curves were calculated at y/aR = 0, 0.1, 0.2, 0.3, 0.4, and 0.5 from top to bottom. The vertical broken line depicts the edge of the beam. The solid straight line depicts the result of least square fitting a plane to the deformation within the cross section of the beam.
The angle, Θ, between the tangent to the beam at its lower end and the normal to the undeformed surface is estimated from least-square fitting a plane to the calculated deformations. The result is
| (5) |
A similar calculation for a beam with a circular cross section yields minor changes in the result. Here the beam diameter replaces a R and the numerical prefactor of 1.18 is changed to 1.07. As most micropillars exhibited square cross sections close to the substrate, we used Eq. 5 for all experiments on cells. These relations replace the normal boundary condition of a clamped end for an elastically founded beam. However, several approximations entered the derivations. Therefore we considered it necessary to test Eq. 5 experimentally.
To this end, we fabricated a 500-fold magnified model of the micropillars from the same elastomer (Fig. 7 ). For ease of fabrication of this model, a cylindrical beam (diameter 5.1 mm) was used. This macro model was mounted vertically on a micromanipulator (MHW3, Narishige International, Tokyo, Japan) and lowered gently onto a chisel-shaped edge placed on a precision scale (Labstyle 204, Mettler Toledo, Giessen, Germany). Both the distance between the substrate and the edge as well as the loading force were varied to alter the torque acting on the macropillar. The whole assembly was observed with a stereomicroscope (Stemi2000, Carl Zeiss) equipped with a XCD-X710 CCD camera (Sony, Tokyo, Japan). Images were captured with ICcapture 1.l (The Imaging Source Europe GmbH, Bremen, Germany). The outer edges of the substrate and the macropillar were found by fitting lines through the maxima of the local variance of the images. From these lines the angle, Θ, was determined.
Figure 7.

Macroscopic pillar (P) was bent by pressing it down on a chisel-shaped point (C) mounted to a precision scale. The angle between substrate (S) surface and pillar contour was determined by tracing the outer contours of the pillar and substrate (see text). Scale bar, 3 mm.
In these experiments, we found a proportionality factor of 44 rad/(Nm) (Fig. 8 ). However, using Eq. 5 with the corresponding factor for a cylindrical beam yields a factor of 64 rad/(Nm). This finding implies that the correct proportionality factor in Eq. 5 may be only 70% of the values calculated by our approximate approach, which neglects transverse stresses. Within this publication, we used the calculated factor of 1.18. However, if this factor was overestimated by as much as indicated by the experimental calibration, all forces given in this publication would be underestimated by 10%. This is below the statistical uncertainty of the measurement. Therefore we didn’t try further to improve the accuracy of our calculation.
Figure 8.
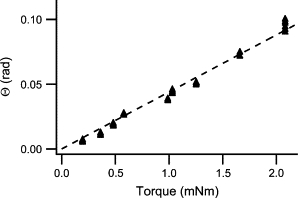
Results of the macropillar bending test (cf. Fig. 7). (Arrowheads) Measured data. (Straight line) Least-square fit. Slope, 44 rad/(Nm).
Calculation of the deflection curves
The bending curve, x(z), of the micropillars is calculated by integrating the differential equation of a bent beam (31)
| (6) |
with the boundary conditions
The moment is given by
| (7) |
where denotes the transversal force density (e.g., force per length) acting on the micropillar. For our two loading scenarios (point force and homogeneous loading from a to l), this equation is elementary.
The solution to Eq. 6 is best given in dimensionless variables (denoted by a tilde). All geometrical parameters (z, a, a R, cf. Fig. 5) are divided by the height of the highest contact point of the cell, l, the torque by Fl, and the deflection x is multiplied by Here F denotes the entire transversal force of the cell applied to the micropillar.
The variation of the moment of inertia of the micropillars with height is modeled by assuming a linear increase in diameter with height, i.e., In fact, the cross section of the micropillars increased with height and rounded considerably at the same time. However, the deviation of the measured I(z) from our approximation barely exceeded the accuracy of the determination of the moments of inertia (10% relative uncertainty). Thus, this approximation is justified.
Taken together, the dimensionless bending curve of our beam for a point force acting at l is given by
| (8) |
The corresponding result for homogeneous loading from a to l is given by
| (9a) |
and
| (9b) |
In the latter equation, the limiting case of a straight beam () is nontrivial and is therefore given explicitly:(9c)Equations 9a–9c hold for beams of an approximately square cross section. In case of a circular cross section, the factors 0.14 in the first term of all three equations should be replaced by 0.13.
In essence, a beam on an elastic foundation is softer than a clamped beam. The amount of softening depends on the aspect ratio of the beam. For the geometry of our micropillars, this effect amounted to ∼37%. Even if the proportionality factor in Eq. 5 were only 70% of its calculated value as indicated by our experimental calibration (Figs. 7 and 8), the elastically founded beam would still be 25% softer than the clamped one.
Calculation of forces
Calculation of cell forces is hampered by our lack of knowledge about the spatial distribution of these forces over the contact zone between cell and micropillar. Our attempts to narrow the possibilities by measuring the overall torque applied to one micropillar via the angle to the surface normal at the base of the micropillar (cf. Eq. 5) failed. The reason was that for all image processing algorithms we tested, blurred structures from the substrate interfered with the determination of the micropillar center on the lowest 1–2 μm. The resulting uncertainty in the micropillar shape caused unacceptably large errors of the angle. Thus, we resorted to two scenarios. First, we calculated the lowest cell force that was compatible with the observed displacements of both micropillars connected by this cell. This lower limit for the force is obtained assuming a point like force application at the very highest point of the cell-micropillar contact. By applying Eq. 8, we could then calculate forces from the observed displacements of the micropillars. Subsequently, we calculated at which height this force must have been applied to the second micropillar to produce its observed displacement. In all cases, this height was well within the observed contact zone between cell and micropillar. Thus, this scenario yielded force distributions consistent with all observations. The resulting forces are lower limits for the real cell forces. In this loading scenario, the cells applied on average a force of 90 nN in the relaxed state and 230 nN in the contracted state (Fig. 9 ).
Figure 9.
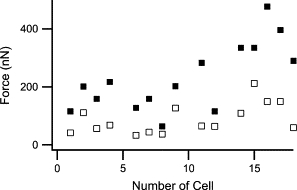
The lowest possible cell forces compatible with the observed pillar displacements. Open squares: myocytes in relaxed state, filled squares: cells in contracted state.
For an estimation of the experimental uncertainty, we estimated the uncertainties of all input parameters. Subsequently, we calculated the overall resulting uncertainty, assuming uncorrelated contributions and Gaussian propagation of uncertainties for a micropillar with average parameters as given in Table 1. The results are shown in Table 2 .
Table 2.
Error budget for the conservative estimate of the cell forces
| Parameter | Uncertainty | Contribution |
|---|---|---|
| aR | 0.25 μm | 0.9% |
| I0 | 60 μm4 | 9.8% |
| ρ | 0.03 | 1.5% |
| Scan height | 0.5 μm | 4.5% |
| E | 20 kPa | 3.2% |
| l | 2 μm | 10% |
| x | 0.1 μm | 6% |
Overall uncertainty of the forces is 17%. Here, values for contracted cells were used. For relaxed cells, the uncertainty of the forces is 21%.
Based on the distribution of myofibers in fixed cells (cf. Fig. 3 D), we considered it more likely that forces were applied over the whole height of the cell-micropillar contact. For this second loading scenario, Eq. (9a)–(9c)9 was used to calculate the respective cell forces. The heights of the lowest (a) and highest (l) contact points between a given cell and the respective micropillars were measured after live cell staining with calcein from confocal microscopy stacks showing micropillars (DiD fluorescence) and cells (calcein fluorescence) simultaneously. This was done using the display software supplied by the manufacturer of the confocal microscope (LSM5 image browser, Zeiss). Due to the different attachment parameters at both micropillars, we obtained independent forces for both micropillars connected by one cell. However, in a system in mechanical equilibrium, forces must balance. Therefore, we used the mean of the forces determined for both micropillars connected by the cell and checked if the differences between these forces were within the experimental uncertainty (Fig. 10 ).
Figure 10.
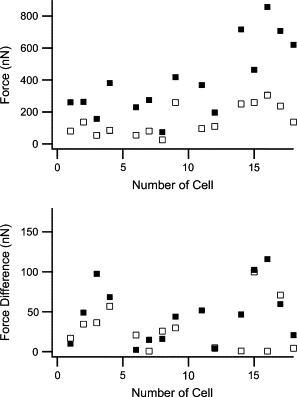
Contraction forces of cells assuming even force distribution over the whole contact zone between cell and micropillars. (Top) Forces averaged over both columns. (Solid squares) Contracted state. (Open squares) Relaxed state. (Bottom) Differences between the forces measured at both columns. Note the different scale.
As the height of the lowest contact point between cell and micropillar, a, does not influence the results very much, the estimates for the uncertainty are almost the same for both models of the force distribution, i.e., forces exhibit an experimental uncertainty of ∼20%. For contracted cells, the difference between forces at both microcolumns exceeded the expected uncertainty only for one cell. For this cell, one column was deflected nearly five times as much as the other. We assume that for this cell, the myofibers were attached to one column close to its lower end. However, as we did not label myofibers in living cells, we could not verify this assumption. This cell was excluded form all further evaluations. Based on the assumption of evenly distributed forces, we arrive at average cell forces of 140 nN in the relaxed state and 400 nN in the contracted state (Fig. 10).
Discussion
Morphology and structure of cells
Cells suspended between two micropillars were spindle-shaped and relatively compact (length <30 μm), whereas the identical cells on flat substrates exhibited a very flat and extended shape (diameter ∼50–100 μm), cf. Fig. 2. The actin cytoskeleton was also very dependent on substrate geometry. On flat substrates, actin stress fibers were abundant and prominent, whereas they were entirely absent in cells adhered exclusively to micropillars, cf. Fig. 3. In addition, the latter cells exhibited myofibers with distinct Z-bands. Additionally, the mode of surface adhesion was also strongly influenced by the cellular environment. Whereas myocytes on flat substrates displayed focal adhesion sites, we could not find any indications for such structures in cells connecting micropillars. In our micropillar system, cells always wrapped around micropillars. For these cases, the mechanical connection between cells and micropillars always seemed to be localized at Z-bands (costameric adhesion).
In summary, in all parameters studied (e.g., cell size, volume, adhesion, actin organization), we found striking differences between cells on flat substrate and those connecting micropillars. This is very surprising, because flat parts of the substrate and micropillars were identical in all parameters besides geometry. They consisted of the same elastomer and were coated with the same proteins of the extracellular matrix to promote adhesion. These different cell morphologies were consistently observed in all samples. They coexisted in the same sample and, for cells that connected a micropillar to the flat substrate, sometimes even within one cell. Thus, we concluded that myocytes react strongly to the geometry of their environment. Please note that here geometry and stiffness are connected because micropillars deflect much farther under the influence of a given force than the flat substrate. Moreover, myocytes adhered to micropillars appeared more like cells in the intact heart inasmuch as they adhered via costameres and exhibited spindle shape and prominent myofibrils.
Correlation of forces with control parameters
No matter in which scenario we evaluated contraction forces of cells, they always exhibited a large spread. In part this is caused by the fact that we used cells from the whole heart of rat fetuses. It is well known that myocytes from different regions of the heart exhibit different properties (33,34). We analyzed our data further for correlations of forces or micropillar deflections with some putative control parameters. In our experiments, the most important observable is the amplitude of micropillar deflections. The deflection amplitudes at maximum contraction (cf. Fig. 4 B) were not significantly correlated with the distances between micropillars. Stiffnesses of micropillars varied from sample to sample because the diameters of the pillars exhibited some spread and because the cells adhered at different heights. Pillar stiffness (applied force/observed displacement) depends on the model we used to analyze our data. In both models, amplitudes and micropillar stiffnesses were uncorrelated. Contraction forces were calculated from amplitudes by multiplication with pillar stiffness. As amplitudes and stiffnesses were uncorrelated, forces and stiffnesses had to be correlated, which was indeed observed. In Fig. 11 , the results for both scenarios are shown.
Figure 11.

Myocyte contraction forces (solid squares, contracted state; open squares, relaxed state) plotted versus the stiffness of micropillars. (Upper panel) Forces and stiffness evaluated assuming a point force at the highest cell point. (Lower panel) Forces assumed to be equally distributed over the cell-micropillar contact. The lines correspond to a proportional law: slope 1.7 μm for full line and 0.6 μm for broken line.
The dependence of cell forces on micropillar stiffness was modeled as proportionality. As proportionality constants, we found by least-squares fitting for the conservative estimate of forces 1.8 μm for contracted cells and 0.7 μm for relaxed cells. In the model of distributed forces, we found proportionality constants of 1.6 and 0.6 μm, respectively.
It is very striking that these values correspond exactly to the mean amplitudes of beam deflection in the respective states, cf. Table 1. During seeding of cells, attachment of cells to micropillars occurs statistically, i.e., cell properties and micropillar stiffnesses are not correlated. In other words, contraction amplitude and stiffness are uncorrelated random variables, whereas force is just the product of these two variables. In this situation, a fit of the dependence of force on stiffness to a proportional law must yield the average value of the amplitude just as observed.
Spontaneous cell contraction is controlled by a multitude of biochemical processes within the cell, which comprise an overall regulation mechanism. This mechanism can work in two alternative ways: either it causes contractions of certain amplitudes or of certain forces. Our results clearly imply that under the conditions of our experiments, cell contractions are regulated to achieve a certain amplitude. However, the “preferred” contraction amplitude varies from cell to cell, which masks this regulation mechanism if the standard deviations of measured amplitudes and measured forces are compared. A regulation of mechanical activity controlled by amplitudes was also found by Saez and co-workers for epithelial cells (24,25). The independence of contraction amplitude from micropillar stiffness can obviously hold only up to a certain point. Further support for this interpretation comes from the studies of Tesi and co-workers (35), who measured the contraction forces of isolated myofibers and arrived at contraction forces per cross section of ∼105 N/m2. Thus a total cross-sectional area of 4 μm2 of myofibers would be sufficient to produce the average forces observed here. Myocytes connecting two micropillars exhibited cross-sectional areas in the range from 50 to 100 μm2 and also a high density of myofibers. Thus, it seems very likely that myocytes spanning micropillars with stiffnesses in the several hundred mN/m range are not limited in force but in cell-specific contraction amplitude. Obviously, this situation would change if cells were excited externally by drugs or electrical pulses.
Moreover, cells show a large scatter of intrinsic amplitudes, action potentials, and contraction frequencies, most likely because they originate from different areas of the heart (for a review, see James (33,34)). For myocytes, self-generated contraction frequencies from 1.4 Hz for cells originated from the sinoatrial-node down to 0.5 Hz for cells from the His bundle or even 0.2 Hz for ventricular muscle cells are characteristic for the heart conduction system. In addition, each region of the human heart is defined by a unique action potential waveform (36). In respect of these natural variabilities, all myocytes analyzed in this study fitted well into the ranges known from whole heart analyses and confirmed the nature-like growth conditions for isolated myocytes within micropillar arrays.
Cell forces applied by myocytes grown in our micropillar system were found to be in the range of 400 nN upon contraction and 140 nN in the relaxed state. Analyses on myocytes grown on micropatterned two-dimensional substrates revealed cell forces in a very similar range upon contraction (10,19), whereas forces applied in the relaxed state had not been analyzed before, to our best knowledge. This result is surprising, since cell morphology and adhesion structures strongly differed between growth on flat surfaces and micropillar substrates. Apparently, myocyte force formation upon contraction is at least in parts independent on the presence of defined adhesion structures or the formation of additional stress fibers. If this independence is also true for static forces in the relaxed state still needs to be shown. The major benefit of cell force and cell morphological analyses with the PDMS micropillar system is mainly the close-to-nature growth morphology with high similarity to cardiac muscle cells directly analyzed in heart tissues (37). The complete absence of stress fibers and the costameric adhesion in nature, as well as in our system, indicate that using micropillars as cell substrates are indeed one step toward as physiological conditions as possible for cell culture and analysis.
Acknowledgments
We thank P. Bochem for his help with scanning electron microscopy. We additionally thank N. Hersch for myocyte primary cell isolation.
Footnotes
Editor: Cristobal G. dos Remedios.
References
- 1.Alberts B., Bray D., Lewis J. W.H. Freeman; Oxford, UK: 2006. Molecular Biology of the Cell. [Google Scholar]
- 2.Patel T.J., Lieber R.L. Force transmission in skeletal muscle: from actomyosin to external tendons. Exerc. Sport Sci. Rev. 1997;25:321–363. [PubMed] [Google Scholar]
- 3.Ervasti J.M. Costameres: the Achilles’ heel of Herculean muscle. J. Biol. Chem. 2003;278:13591–13594. doi: 10.1074/jbc.R200021200. [DOI] [PubMed] [Google Scholar]
- 4.Pardo J.V., Siliciano J.D., Craig S.W. A vinculin-containing cortical lattice in skeletal muscle: transverse lattice elements (“costameres”) mark sites of attachment between myofibrils and sarcolemma. Proc. Natl. Acad. Sci. USA. 1983;80:1008–1012. doi: 10.1073/pnas.80.4.1008. [DOI] [PMC free article] [PubMed] [Google Scholar]
- 5.Danowski B.A., Imanaka-Yoshida K., Sanger J.M., Sanger J.W. Costameres are sites of force transmission to the substratum in adult rat cardiomyocytes. J. Cell Biol. 1992;118:1411–1420. doi: 10.1083/jcb.118.6.1411. [DOI] [PMC free article] [PubMed] [Google Scholar]
- 6.Zamir E., Geiger B. Molecular complexity and dynamics of cell-matrix adhesions. J. Cell Sci. 2001;114:3583–3590. doi: 10.1242/jcs.114.20.3583. [DOI] [PubMed] [Google Scholar]
- 7.Simpson D.G., Decker M.L., Clark W.A., Decker R.S. Contractile activity and cell-cell contact regulate myofibrillar organization in cultured cardiac myocytes. J. Cell Biol. 1993;123:323–336. doi: 10.1083/jcb.123.2.323. [DOI] [PMC free article] [PubMed] [Google Scholar]
- 8.Hilenski L.L., Ma X.H., Vinson N., Terracio L., Borg T.K. The role of beta 1 integrin in spreading and myofibrillogenesis in neonatal rat cardiomyocytes in vitro. Cell Motil. Cytoskeleton. 1992;21:87–100. doi: 10.1002/cm.970210202. [DOI] [PubMed] [Google Scholar]
- 9.Decker M.L., Simpson D.G., Behnke M., Cook M.G., Decker R.S. Morphological analysis of contracting and quiescent adult rabbit cardiac myocytes in long-term culture. Anat. Rec. 1990;227:285–299. doi: 10.1002/ar.1092270303. [DOI] [PubMed] [Google Scholar]
- 10.Cesa C.M., Kirchgessner N., Mayer D., Schwarz U.S., Hoffmann B., Merkel R. Micropatterned silicone elastomer substrates for high resolution analysis of cellular force patterns. Rev. Sci. Instrum. 2007;78:034301. doi: 10.1063/1.2712870. [DOI] [PubMed] [Google Scholar]
- 11.Tarr M. Mechanical and contractile properties of isolated single intact cardiac cells. Adv. Exp. Med. Biol. 1983;161:199–216. doi: 10.1007/978-1-4684-4472-8_11. [DOI] [PubMed] [Google Scholar]
- 12.Shepherd N., Vornanen M., Isenberg G. Force measurements from voltage-clamped guinea pig ventricular myocytes. Am. J. Physiol. 1990;258:H452–H459. doi: 10.1152/ajpheart.1990.258.2.H452. [DOI] [PubMed] [Google Scholar]
- 13.Lin G., Palmer R.E., Pister K.S., Roos K.P. Miniature heart cell force transducer system implemented in MEMS technology. IEEE Trans. Biomed. Eng. 2001;48:996–1006. doi: 10.1109/10.942589. [DOI] [PubMed] [Google Scholar]
- 14.Tasche C., Meyhofer E., Brenner B. A force transducer for measuring mechanical properties of single cardiac myocytes. Am. J. Physiol. 1999;277:H2400–H2408. doi: 10.1152/ajpheart.1999.277.6.H2400. [DOI] [PubMed] [Google Scholar]
- 15.Cecchi G., Colomo F., Poggesi C., Tesi C. A force transducer and a length-ramp generator for mechanical investigations of frog-heart myocytes. Pflugers Arch. 1993;423:113–120. doi: 10.1007/BF00374968. [DOI] [PubMed] [Google Scholar]
- 16.Tarr M., Trank J.W., Leiffer P., Shepherd N. Sarcomere length-resting tension relation in single frog atrial cardiac cells. Circ. Res. 1979;45:554–559. doi: 10.1161/01.res.45.4.554. [DOI] [PubMed] [Google Scholar]
- 17.Yasuda S.I., Sugiura S., Kobayakawa N., Fujita H., Yamashita H., Katoh K., Saeki Y., Kaneko H., Suda Y., Nagai R., Sugi H. A novel method to study contraction characteristics of a single cardiac myocyte using carbon fibers. Am. J. Physiol. Heart Circ. Physiol. 2001;281:H1442–H1446. doi: 10.1152/ajpheart.2001.281.3.H1442. [DOI] [PubMed] [Google Scholar]
- 18.Yin S., Zhang X., Zhan C., Wu J., Xu J., Cheung J. Measuring single cardiac myocyte contractile force via moving a magnetic bead. Biophys. J. 2005;88:1489–1495. doi: 10.1529/biophysj.104.048157. [DOI] [PMC free article] [PubMed] [Google Scholar]
- 19.Balaban N.Q., Schwarz U.S., Riveline D., Goichberg P., Tzur G., Sabanay I., Mahalu D., Safran S., Bershadsky A., Addadi L., Geiger B. Force and focal adhesion assembly: a close relationship studied using elastic micropatterned substrates. Nat. Cell Biol. 2001;3:466–472. doi: 10.1038/35074532. [DOI] [PubMed] [Google Scholar]
- 20.Tan J.L., Tien J., Pirone D.M., Gray D.S., Bhadriraju K., Chen C.S. Cells lying on a bed of microneedles: an approach to isolate mechanical force. Proc. Natl. Acad. Sci. USA. 2003;100:1484–1489. doi: 10.1073/pnas.0235407100. [DOI] [PMC free article] [PubMed] [Google Scholar]
- 21.Elsdale T., Bard J. Collagen substrata for studies on cell behavior. J. Cell Biol. 1972;54:626–637. doi: 10.1083/jcb.54.3.626. [DOI] [PMC free article] [PubMed] [Google Scholar]
- 22.Schindler M., Nur E.K.A., Ahmed I., Kamal J., Liu H.Y., Amor N., Ponery A.S., Crockett D.P., Grafe T.H., Chung H.Y., Weik T., Jones E., Meiners S. Living in three dimensions: 3D nanostructured environments for cell culture and regenerative medicine. Cell Biochem. Biophys. 2006;45:215–227. doi: 10.1385/CBB:45:2:215. [DOI] [PubMed] [Google Scholar]
- 23.Cukierman E., Pankov R., Stevens D.R., Yamada K.M. Taking cell-matrix adhesions to the third dimension. Science. 2001;294:1708–1712. doi: 10.1126/science.1064829. [DOI] [PubMed] [Google Scholar]
- 24.Saez A., Buguin A., Silberzan P., Ladoux B. Is the mechanical activity of epithelial cells controlled by deformations or forces? Biophys. J. 2005;89:L52–L54. doi: 10.1529/biophysj.105.071217. [DOI] [PMC free article] [PubMed] [Google Scholar]
- 25.Saez A., Ghibaudo M., Buguin A., Silberzan P., Ladoux B. Rigidity-driven growth and migration of epithelial cells on microstructured anisotropic substrates. Proc. Natl. Acad. Sci. USA. 2007;104:8281–8286. doi: 10.1073/pnas.0702259104. [DOI] [PMC free article] [PubMed] [Google Scholar]
- 26.Pawley J.B. Springer Verlag; Berlin: 2006. Handbook of Biological Confocal Microscopy. [Google Scholar]
- 27.Jähne B. Springer Verlag; Berlin: 2002. Digital Image Processing: Concepts, Algorithms, and Scientific Applications. [Google Scholar]
- 28.Berger M., Gerig G. BIWI-ETH Zürich; Zürich, Switzerland: 1998. Deformable Area-Based Template Matching with Application to Low Contrast Imagery. [Google Scholar]
- 29.Zhou X., Cao X., Perlman Z., Wong S.T. A computerized cellular imaging system for high content analysis in Monastrol suppressor screens. J. Biomed. Inform. 2006;39:115–125. doi: 10.1016/j.jbi.2005.05.008. [DOI] [PubMed] [Google Scholar]
- 30.Boas M.L. John Wiley & Sons; Hoboken, NJ: 2005. Mathematical Methods in the Physical Sciences. [Google Scholar]
- 31.Popov E.P. Prentice Hall; Upper Saddle River, NJ: 1999. Engineering Mechanics of Solids. [Google Scholar]
- 32.Landau L.D., Lifshitz E.M. Butterworth Heinemann; Oxford, UK: 2004. Course of Theoretical Physics. [Google Scholar]
- 33.James T.N. Structure and function of the sinus node, AV node and His bundle of the human heart: part I-structure. Prog. Cardiovasc. Dis. 2002;45:235–267. doi: 10.1053/pcad.2002.130388. [DOI] [PubMed] [Google Scholar]
- 34.James T.N. Structure and function of the sinus node, AV node and his bundle of the human heart: part II–function. Prog. Cardiovasc. Dis. 2003;45:327–360. doi: 10.1053/pcad.2003.1. [DOI] [PubMed] [Google Scholar]
- 35.Tesi C., Piroddi N., Colomo F., Poggesi C. Relaxation kinetics following sudden Ca2+ reduction in single myofibrils from skeletal muscle. Biophys. J. 2002;83:2142–2151. doi: 10.1016/S0006-3495(02)73974-X. [DOI] [PMC free article] [PubMed] [Google Scholar]
- 36.Nerbonne J.M., Kass R.S. Molecular physiology of cardiac repolarization. Physiol. Rev. 2005;85:1205–1253. doi: 10.1152/physrev.00002.2005. [DOI] [PubMed] [Google Scholar]
- 37.Severs N.J. The cardiac muscle cell. Bioessays. 2000;22:188–199. doi: 10.1002/(SICI)1521-1878(200002)22:2<188::AID-BIES10>3.0.CO;2-T. [DOI] [PubMed] [Google Scholar]