

Abstract
The energetics of the individual reaction steps in the catalytic cycle of photosynthetic water oxidation at the Mn4Ca complex of photosystem II (PSII) are of prime interest. We studied the electron transfer reactions in oxygen-evolving PSII membrane particles from spinach by a photothermal beam deflection technique, allowing for time-resolved calorimetry in the micro- to millisecond domain. For an ideal quantum yield of 100%, the enthalpy change, ΔH, coupled to the formation of the radical pair (where YZ is Tyr-161 of the D1 subunit of PSII) is estimated as −820 ± 250 meV. For a lower quantum yield of 70%, the enthalpy change is estimated to be −400 ± 250 meV. The observed nonthermal signal possibly is due to a contraction of the PSII protein volume (apparent ΔV of about −13 Å3). For the first time, the enthalpy change of the O2-evolving transition of the S-state cycle was monitored directly. Surprisingly, the reaction is only slightly exergonic. A value of ΔH(S3 ⇒ S0) of −210 meV is estimated, but also an enthalpy change of zero is within the error range. A prominent nonthermal photothermal beam deflection signal (apparent ΔV of about +42 Å3) may reflect O2 and proton release from the manganese complex, but also reorganization of the protein matrix.
Introduction
Powered by the energy of sunlight, water molecules are oxidized at the manganese-calcium complex (Mn4Ca) of photosystem II (PSII), a protein complex located in the thylakoid membranes of plants, cyanobacteria, and algae. Thereby, atmospheric dioxygen (O2) is produced (1–5). The elucidation of the mechanism of this photosynthetic water oxidation (6–8) is of general interest and of key relevance in attempts to replace fossil fuels by renewable energy sources.
Driven by the sequential absorption of four photons as provided by, e.g., nanosecond laser flashes, the Mn complex of PSII is stepped synchronously through its catalytic cycle (Fig. 1) (also, see (9–11) and references therein). Starting from the dark-stable state, the increasingly oxidized, semistable states and are formed. O2 is released on the third flash of light, inducing the transition. The fourth flash closes the cycle by initiating the oxidizing transition (Fig. 1). The state recently has been identified as a transient intermediate involving a deprotonation event at or close to the Mn complex (9,10). Other intermediates seen in Fig. 1 are implied by the available data, but have not been kinetically resolved (11,12). Each absorption of a photon creates the radical pair within <1 ns (13,14) (P680 is the primary donor chlorophyll moiety of PSII and QA is a bound plastoquinone molecule). The re-reduction of by YZ, the redox-active tyrosine-161 of the D1 subunit of PSII, which is at a distance 5–6 Å from the closest Mn ion (15,16), is terminated within <1 μs (17). is reduced by electron transfer (ET) from the Mn complex within hundreds of microseconds on the lower S-transitions and with a halftime of ∼1.2 ms on the O2-evolving step (9,18–20). The whole reaction cycle can be rationalized in a scheme involving eight steps of alternate ET and proton abstraction events, until finally O2 is released (Fig. 1) (9–11).
Figure 1.
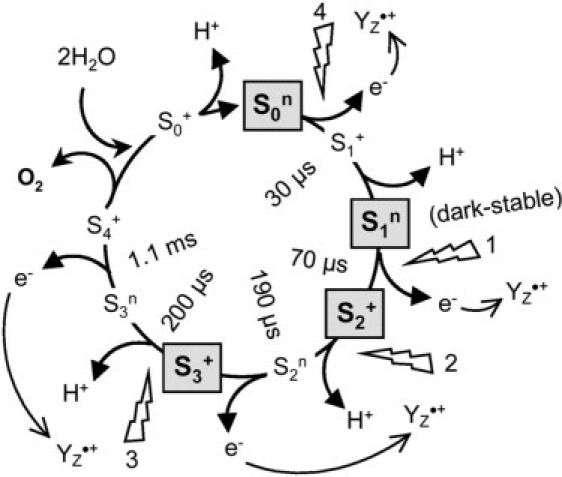
Extended reaction scheme of the S-state cycle of photosynthetic water oxidation at the Mn complex of PSII (9–12). The cycle comprises eight steps of alternate electron and proton removal from the Mn complex. The state corresponds to the S4 state described in (9); is a hypothetical intermediate where four protons and four electrons have been abstracted from the Mn complex before O2 release. Within <1 μs after each flash, is formed. The halftimes of the transitions between the semistable S states (bold characters) were taken from (9). The superscripts “n” (neutral) and “+” (one positive charge) denote the overall charge of the Mn complex resulting from the sum of electron abstraction (+1/e−) and proton release (−1/H+) up to the respective S state. For a detailed discussion of the reaction cycle, see (9–12).
Recent progress in the characterization of the Mn complex of water oxidation comes from crystallographic studies (15,16,21) and structure-functional investigations employing, e.g., x-ray absorption spectroscopy (9,22,23). Key structural features of the Mn complex, of changes in its nuclear arrangement at the atomic level, and of the Mn oxidation state in the course of the catalytic cycle have been resolved (9–11,22–24). However, unraveling the mechanism of water oxidation requires complementary information on the energetics of the individual reaction steps. In particular, the thermodynamic parameters ΔH and ΔS (enthalpy and entropy changes) of the S-transitions have not been determined so far.
The Gibbs free energy change ΔG, i.e., the overall driving force of a particular reaction step, is related to these parameters according to Eq. 1 (T is the temperature in Kelvin),
| (1) |
The ΔG value is related to the respective midpoint-potential difference (ΔEm). In PSII, ΔEm values cannot be derived from redox titrations because of the strongly positive Em (∼1 V) of the Mnox/Mn, and redox couples (see (9), and references therein). On the basis of electroluminescence measurements (25), values of ) (where Si represents the oxidation states in the S-state cycle of water oxidation) of −55 meV, −40 meV, and −105 meV for the and transitions have been reported. A value of −250 meV has been proposed for (26) (see also (27,28)). On the basis of the above values and ΔG estimates for (29) and (30), reaction coordinates of water oxidation have been calculated, which involve overall ΔG values of ∼1 eV on all four transitions in the reaction cycle (31).
On one hand, some of the above energetic attributions need to be revised. For example, the Em of the couple has been shown recently to be more positive, i.e., 1.25 V (32,33), than previously reported (30). On the other hand, the respective transitions involve not only pure Mn oxidation (Fig. 1), but also deprotonation of the Mn complex before or after the ET event (see (10–12) and references therein). In addition, further relaxation and chemical processes are expected, such as reorganization of hydrogen-bonded networks, reorientation of amino acids, and dioxygen formation and release. Accordingly, to analyze the energetic profile of the water oxidation cycle, a rough estimate of the overall free energy changes is insufficient. Rather, the true enthalpic and entropic contributions to each reaction step have to be determined.
The enthalpic changes, ΔH, relate to the fraction of the energy of a photon absorbed by PSII, which is released as heat into the medium during a particular reaction step. Determination of ΔH values allows the estimation of the energy that is stored in the reaction intermediates and, thereby, of the energetic efficiency of the individual reactions. Furthermore, experimental values of ΔH are needed as benchmarks for comparison with results from quantum-chemical calculations on the mechanism of water oxidation (see, e.g., (34–36)).
Photothermal methods allow for direct measurements of heat release into the medium, which is coupled to photochemical reactions in proteins (for review, see (37–40)). The detection of photoacoustic pressure waves and probe-beam deflection techniques have been applied successfully to determine ΔH values in photosynthetic reaction centers (41–43), phytochrome (44), photoactive yellow protein (45), (bacterio)rhodopsins (46,47), P450 (48), and other proteins (49,50). Photoacoustic methods also have been applied to intact leaves (51,52) and the quaternary oscillation of O2 evolution during single-flash excitation has been detected (53). Photoacoustic measurements using ultrasonic transducers provide nanosecond time resolution, but usually are restricted to a time range up to ∼10 μs after the photoexcitation event (54). To date, no investigations have been performed on the enthalpy changes in the S-state cycle of the Mn complex of PSII by photothermal methods.
In this investigation, we employed a photothermal beam deflection technique (PBD) (39,40,55,56) to investigate the photochemical reactions of PSII in intact, oxygen-evolving membrane particles from spinach. PBD is applicable in the micro- to millisecond time domain (39,40) and is thus well adapted to monitor the various reactions at the Mn complex. For the first time, we report values of ΔH of formation and of the O2-evolving transition for purified, highly active PSII.
Materials and methods
Sample preparation
High-activity PSII membrane particles (1200–1400 μmol O2/mg chlorophyll (Chl)/h) were prepared as described in (57,58) and stored at −80°C. Before use, ∼2 mL of the preparations were thawed for ∼1 h on ice, suspended in 200 mL of buffer A (1 M glycine betaine, 15 mM NaCl, 5 mM MgCl2, 5 mM CaCl2, and 25 mM MES, pH 6.2), and collected by centrifugation (12 min, 20,000 rpm, 4°C). The pellet was then resuspended in buffer A at ∼2 mg/mL of Chl and immediately used for the measurements. Standard PSII samples for PBD measurements under repetitive flash excitation contained 20 μg/mL of Chl and 40 μM DCBQ (2,6-dichlorobenzoquinone) as an exogenous electron acceptor. If applicable, DCMU (3-(3,4-dichlorophenyl)-1,1-dimethylurea, 40 μM) was added. The absorption of each sample at 532 nm was determined by recording an absorption spectrum of 300–1000 nm using an ultraviolet-visible spectrophotometer (Cary50, Varian, Darmstadt, Germany). The scattering background was minimized by positioning the optical cuvette directly in front of the detection diode with the measuring light passing the rough-surface sides of the cuvette. Furthermore, the remaining scattering background was removed by subtraction of a line, which had been chosen for zero absorption between 800 and 1000 nm. For measurements with dark-adapted PSII membranes, samples contained 80 μg/mL of Chl. As a calorimetric reference, the dye bromocresol purple (BCP) (Na salt, Sigma, St. Louis, MO) was used. A solution of 6.4 μg/mL of BCP at pH 6.2 showed a similar absorption at 532 nm of ∼0.14 as the (scattering-corrected) standard PSII membrane samples.
PBD measurements
The experimental setup (Fig. 2) was mounted on an optical table (Opta, Bensheim, Germany) and shielded by a special housing against sound and light. For repetitive pump-flash excitation, PSII samples (1 mL) were filled into the thermostated cuvette (optical path length 1 cm) and 200 measurements/sample were recorded at a frequency of 1 Hz, unless otherwise stated. For measurements with dark-adapted PSII, the samples (∼50 ml) were kept in a dark reservoir and transferred to the cuvette (Helma flow-through, optical path length 3.3 mm) by a peristaltic pump (Masterflex); then the complete sample volume was exposed to between zero and seven saturating preflashes using a Q-switched, frequency-doubled Nd:YAG laser (Inlite, Continuum, Darmstadt, Germany; 532 nm, full width at half-maximum (FWHM) ∼5 ns, 50 mJ/pulse, interval between flashes 0.7 s). At 0.7 s after the last flash of the preflash series, a nonsaturating pump flash (see below) was given and the PBD signal was recorded. Thereafter, the sample was exchanged for a fresh one.
Figure 2.
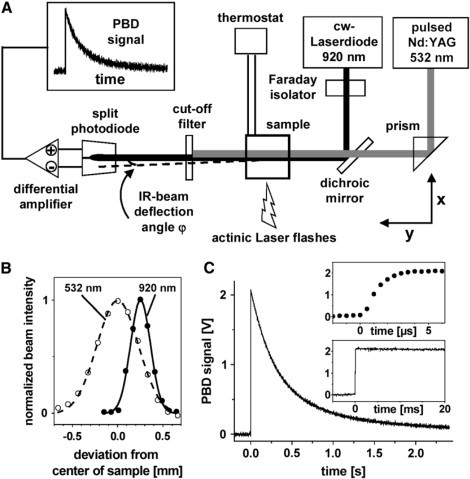
Photothermal beam deflection (PBD) experiment. (A) Schematic drawing of the experimental setup in our laboratory. Lenses for beam shaping are omitted for clarity. Excitation of the sample by a pump-laser flash (532 nm) and subsequent heat release and nonthermal changes in the sample lead to the deflection of the continuous-wave probe beam (920 nm) by an angle ϕ, resulting in the PBD signal. (B) Normalized intensity profiles and relative positioning of pump- and probe-laser beams as measured by a photodiode in the center of the sample cuvette. The FWHM values are 0.26 mm (920 nm) and 0.54 mm (532 nm). (C) PBD signal of the calorimetric standard BCP; 1000 transients have been averaged. (Upper inset) The signal rise time of ∼3 μs is limited by the differential-photodiode detector. (Lower inset) Within 20 ms after the exciting flash, the signal decays by only ∼3% of its initial amplitude.
The sample cuvette was placed in a water-jacketed holder that was thermostated by a computer-controlled water bath (DC50-K40, Haake, Karlsruhe, Germany), with a temperature sensor immersed in the sample close to the positions of the laser beams. Nonsaturating pump flashes were provided by a frequency-doubled Q-switched Nd:YAG laser (Continuum Minilite-II, λ = 532 nm, FWHM 5 ns) that was mounted on a separate table for vibrational decoupling; its beam was appropriately shaped by optics. Filters (BG39 and GG475, Schott, Mainz, Germany) in front of the pump laser removed any residual contributions of the first harmonic at 1064 nm. The energy of the pump flash (in the microjoule range) was adjusted by the built-in attenuator of the laser and determined by a calibrated meter (LEM2410, PEM11 measuring head, Sensor- und Lasertechnik, Neuenhagen, Germany) and recorded for each flash by the measuring program.
The probe beam was provided by a single-mode infrared (IR) laserdiode module (LGT-920-100-EPS, LG Laser Technologies, Kleinostheim, Germany, λ = 920 nm, 61 mW). By built-in collimator optics, the IR beam was focused in the center of the cuvette and then by a lens behind the sample, to adapt the beam cross section to the active area of the detector. A Faraday isolator (IO-5-950-VLP, Laser 2000, Munich, Germany) was placed between the laserdiode and the first mirror to suppress backreflections from the optics. Alignment of pump and probe beams was achieved by mirror optics allowing for vertical and horizontal displacement of both beams. Control of the horizontal position of the probe beam was provided by a computer-controlled motorized prism stage, making it possible to stabilize the beam position in the center of the detector. Pump and probe beams were collinear in the cuvette (Fig. 2 B). Behind the sample, the pump beam was blocked by cutoff filters (LCLL-850F, Laser Components, Olching, Germany; and RG800, Schott).
The probe beam was detected by a differential photodiode (SFH-221, Osram Semiconductors, Regensburg, Germany) in which the two 0.7 × 2.2-mm2 segments were separated by a 90 μm gap, with the joined anode connected to a bias voltage of −5 V. The photocurrents of each segment were converted by a 4.7-kΩ resistor into a voltage. These voltages were fed into a differential amplifier (amplification 100×, electrical bandwidth DC to 300 kHz, AM-502, Tektronix, Köln, Germany). The resulting difference signal at the output of the amplifier was recorded on a personal computer equipped with a 12-bit 20-MHz A/D card (ADLink, Irvine, CA) using a homemade program for averaging signals. The start of signal recording was triggered by the pump flash monitored by a photodiode. The whole measuring sequence (e.g., peristaltic pump, probe-beam position control, preflashes, pump flash, signal recording) was computer-controlled and synchronized by appropriate trigger electronics.
Results
Theory
Origin and interpretation of the PBD signals
The PBD technique (39,40,55,56) allows for time-resolved calorimetry. It relies on the superpositioning of two laser beams in the sample, a narrow pump laser beam (nanosecond-duration pulse at 532 nm) and a continuous-wave probe laser beam (in the IR, no sample absorption) that is positioned approximately at the inflection point of the near-Gaussian profile of the pump laser beam (Fig. 2 B). After excitation of the sample by the pump laser, the probe laser beam is deflected. The deflection is due to the transient formation of an optical element in the sample after the absorption of light energy as provided by a pump laser flash (Fig. 2 A). The optical element shows the same shape as the pump laser beam profile and may be regarded as a prism. It originates from 1), the release of heat (ΔQ) and 2), nonthermal changes (ΔN) of the sample in the path of the pump laser flash.
The probe-beam deflection reflects the total change of the refractive index, Δn, of the sample due to changes in its specific density, Δρ, as caused by 1), the temperature change, ΔT, resulting from ΔQ, and 2), nonthermal contributions to Δρ (ΔρN). These are denoted as ΔnQ and ΔnN, respectively. The value of ΔnN is determined by volume changes of the protein, changes of particle concentrations (e.g., due to protolytic reactions, water binding, oxygen release, etc.), and possibly contributions (ΔnA) in the infrared that are related to absorption changes upon flash excitation in other spectral regions via the Kramers-Kronig relation (59). Thus,
| (2) |
The gradient of Δn leads to an angular deflection (ϕ) of the IR probe beam (Fig. 2 B).
Since the deflection angle, ϕ, is small, it is, to a good approximation, proportional to Δn (36,37). The resulting PBD signal, X, is the voltage difference between the two elements of the differential photodiode detector, which become un-equally illuminated by the IR probe beam for ϕ ≠ 0 (Fig. 2 A). The signal X is linearly related to ϕ (for small ϕ values) and, hence, to the sum of a thermal (xQΔQ) and nonthermal (ΔN) contribution:
| (3) |
where ΔQ is the fraction of the absorbed pump-flash energy that is dissipated as heat (and given as a percentage of the energy of a pump-flash photon).
The factor of proportionality, xQ, is given in volts; its value depends on the temperature (T). For a calorimetric standard such as the dye BCP used here, the absorbed energy is thermalized completely and promptly, i.e., faster than the time resolution of the experiment. Furthermore, ΔN equals zero, i.e., nonthermal changes are absent. The temperature dependence of the magnitude of the ΔQ-related portion of the PBD signal, according to tabulated values (60) of the thermodynamic parameters of water (thermal expansion coefficient, compressibility, and specific heat capacity), can be approximated by a second-order polynomial. Hence, for BCP, the temperature dependence of X is given by
| (4) |
where T is given in °C; α (dimensionless), β (in °C−1), and γ (in °C−2) comprise the thermodynamic parameters of the sample in a phenomenological way; δ is a scaling factor (in volts) accounting for the number of absorbed excitation-flash photons, among other things; and ΔQ is unity (i.e., 100%). For BCP in pure water, X equals zero at and changes its sign below (60). For different thermodynamic properties of the sample (e.g., due to high concentrations of solutes), the values of T0, α, β, and γ usually differ from those for pure water and need to be determined experimentally.
In a PSII sample, both thermal and nonthermal effects are expected to cause PBD signals and a fraction of the excitation energy, QSt, may be stored in the photoproducts:
| (5) |
where the sum of QPSII and QSt equals unity. For equal numbers of absorbed photons (δBCP = δPSII), it follows that the heat release by PSII is related to that of BCP by
| (6) |
At T = T0, the thermal part (first term on the right side of Eq. 5) of the signal vanishes, so that ΔN can be determined directly. Assuming that the thus determined ΔN is temperature-independent, comparison of the magnitudes of PBD signals of PSII and BCP (according to Eqs. 4–6, and for equal values of T; excitation energy, Eexc; absorption at the excitation wavelength, Aexc; and α, β, γ, and δ) yields the percentage of the absorbed energy that is thermalized by PSII (ΔQPSII), and the value of QSt. QSt gives the fraction of the photon energy stored in the form of a chemical product. In the following, ESt is used to denote the stored energy/PSII in eV (or J).
Saturation behavior
In PSII, the photochemical reactions saturate at high excitation energies (Eexc), meaning that the corresponding magnitudes of ESt and ΔN become maximal (). Thus, for saturating excitation, the absorbed energy is almost completely thermalized by excited-state decay, so that the ratio X/Eexc (which is linearly related to X/ΔQ) approaches a constant value, x∞ (in V/J). At energies well below the half-saturation energy (), a significant portion of Eexc may be stored in the photoproducts and nonthermal signals may contribute significantly. For X(Eexc) holds:
| (7) |
which, after division by Eexc, can be written as
| (8) |
or, in relative units and using
| (9) |
Using Eq. 9, the value of (and that of xmax) is derived from the excitation-energy dependence of (X/Eexc)rel by curve-fitting.
Enthalpy and apparent volume changes
The heat release, ΔQ, of PSII relates to 1), the enthalpy changes, ΔH, of the primary and secondary photochemical reactions (heat release corresponds to negative ΔH values); and 2), the energy difference, EΔλ, of 507 meV between the energy of a 532-nm photon (EPh = 2330 meV) and the estimated excited-state energy of the PSII primary donor (680 nm, 1823 meV). Thus,
| (10) |
Introducing the quantum yield, φ, of the PSII photochemistry for excitation at 532 nm, which may be significantly lower than unity (Eφ = (1 − φ)EPh), Eq. 10 becomes
| (11) |
Equation 11 facilitates calculation of the enthalpy change (ΔH) associated with the respective light-driven reaction.
The flash-induced PBD signal (X) of PSII is expected to show a multiphasic time course, comprising an instantaneous kinetic phase, Xprompt, due to the formation of the charge pair within <1 μs, and (at least) one slower phase which is related to the electron transfer and further events coupled to the S transitions. As is shown later, Xprompt was readily detectable, and a slower phase was found to rise monoexponentially in the millisecond time range (denoted as Xms). Accordingly, PBD signals of PSII were analyzed using the sum of a step-shaped and a single-exponential function with a first-order rate constant, k, i.e.,
| (12) |
Nonthermal contributions to the PBD signal were analyzed in terms of apparent volume changes (ΔV) as outlined in (85) by comparison of the nonthermal signal (XN) of PSII and the signal of the reference BCP (XBCP) according to
| (13) |
where n is the refractive index and φ the quantum yield. The following values were used for the constants in Eq. 13 (at 20°C): specific heat capacity of water, cp = 2.6 × 1025 meV kg−1K−1; density of water, ρ = 103 kg m−3; dn/dT = 9.1 × 10⁻⁵ K−1 (86); ρdn/dρ = 0.326 (87); and energy of a 532-nm photon, EPh = 2330 meV.
Kinetic competence of the PBD experiment
Measurements of PBD signals of a calorimetric standard, the dye BCP, allow assessment of the characteristics of time-resolved PBD experiment (Fig. 2). Upon excitation of the dye by a pump-laser flash, the total amount of absorbed energy is released as heat into the medium within picoseconds. The resulting deflection of the IR probe beam (by an angle denoted as ϕ) yields a step-shaped signal (Fig. 2 C). The signal decay within ∼1.5 s results from the heat initially released within the narrow path of the pump-laser beam diffusing into the entire sample volume. Consequently, the probe-beam deflection and, hence, the PBD signal disappear. The rise time of the PBD signal (Fig. 2 C, upper inset) of ∼3 μs is determined for the most part by the electrical bandwidth of the photodiode-detector system. Within an ∼20-ms time interval after the pump flash, the PBD signal decays by <5% of its initial amplitude (Fig. 2 C, lower inset). Within this time interval, electron transfer in PSII is expected to be terminated so that the accessible time range of ∼5 μs to 20 ms of the PBD experiment is well adapted to monitor, in PSII, 1), the charge separation up to the state terminated in <1 μs, and 2), the reactions coupled to the O2-evolving transition occurring within micro- to milliseconds.
Absorption at Eexc = 532 nm from steady – state absorption spectra
Fig. 3 shows the wavelengths of the pump and probe laser in comparison to the absorption spectrum of the used PSII membrane particles. The probe beam at 920 nm is well separated from 1), any steady-state absorption of the pigments (chlorophylls and carotenoids) of the PSII preparation (solid line); 2), the first maximum of water absorption at ∼970 nm (dotted line); 3), the transient absorption of the cation radical extending up to ∼880 nm (61,62); and 4), the weak near-IR absorption of the Mn complex itself (up to ∼880 nm) (63,64). The PBD signal thus is not affected by contributions from absorption changes upon flash excitation of PSII. At the wavelength of the pump laser (Eexc = 532 nm), the absorption of the PSII membranes at the standard concentration of 20 μg/mL Chl used in this study is much smaller than unity, i.e., Aexc = 0.14, with an estimated imprecision of ±0.02. The respective absorptions at 532 nm of PSII and of the standard, BCP, later are employed for calibration of PBD signals from PSII in terms of absolute energy values.
Figure 3.
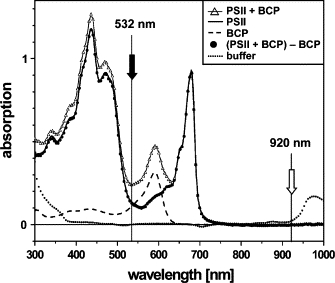
Absorption spectra of a PSII membrane sample, the dye BCP, a mixture of PSII and BCP, and the buffer. That the difference spectrum (PSII + BCP) - BCP is identical to that of PSII alone indicates that the spectrum of PSII was unchanged in the presence of BCP, and vice versa. The pump- and probe-laser wavelengths are indicated by arrows. From the spectra of BCP and PSII, the background absorption of the buffer was subtracted. Spectra of solutions containing PSII additionally were corrected for scattering contributions. From the spectra of PSII and BCP, the absorption (Aexc) at the excitation wavelength (532 nm) was determined.
The PBD signal of PSII is biphasic
-
1.
PBD signals of PSII membranes were measured using repetitive excitation (1 Hz) by the pump laser. This means that upon every flash, each of the four S transitions occurs in ∼25% of the PSII population. The resulting signal of PSII (Fig. 4, upper trace) deviates from the step-shaped signal of BCP. In PSII, not only a promptly rising component (Xprompt), but, in addition, a prominent, more slowly rising phase (Xms) is observed. The time course of the millisecond phase was well described by a single-exponential function with t1/2 = 1.15 ms. This halftime is typical for the oxygen-evolving transition, in the used PSII membrane preparation (9,65).
-
2.
DCMU blocks electron transfer from to QB at the PSII acceptor side (66). In its presence, and for repetitive excitation at a low frequency of 0.2 Hz, each flash induces the formation of the state, which subsequently largely decays by charge recombination to (33). Under these conditions, the Xprompt still was detected, but the millisecond phase (Xms) was absent (Fig. 4, middle trace), as would be expected if it is attributable to the O2-evolving transition, which cannot proceed in the presence of DCMU.
-
3.
When DCMU was present, but the flash frequency was 5 Hz and additional continuous illumination of the sample was applied, remained reduced between the flashes so that only formation and decay (within a few nanoseconds) of occurred (67). The magnitude of the resulting step-shaped PBD signal was larger (Fig. 4, lower trace) than at low flash frequencies, because now most of the absorbed energy was released promptly as heat. This experimental protocol provides an internal standard for the conversion of 100% of the absorbed energy into heat (neglecting the minor fluorescence losses (68)). The approximately two times smaller magnitude of Xprompt in the absence of rapid charge recombination suggests that the formation of is accompanied by significant storage (ESt) of excitation energy and/or by rapid nonthermal contributions (ΔN) to the PBD signal.
Figure 4.
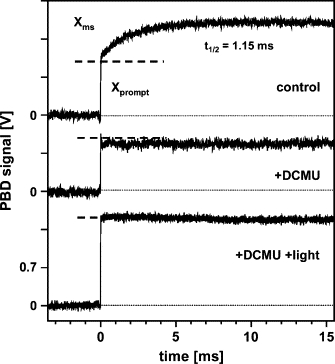
PBD signals of PSII membranes for repetitive pump-flash excitation. About 1000 signals from five samples were averaged; the time resolution was 5 μs/data point (Eexc = 6 μJ, T = 20°C). A standard PSII sample (20 μg Chl/mL, 20 μM DCBQ) was used as the control (upper trace). The slow phase (Xms) was simulated (line) using an exponential function with t1/2 = 1.15 ms. (Middle trace) Sample with 40 μM DCMU + 20 μM DCBQ. The small and rapid signal decay after the exciting flash may reflect a contribution due to the transition. (Lower trace) Sample with 40 μM DCMU and 20 μM DCBQ, with additional continuous illumination.
The millisecond phase of the PBD signal is attributable to the O2-evolving transition
PBD measurements were performed on dark-adapted PSII membranes to detect contributions related to the oxygen-evolving transition. Fig. 5 shows PBD transients as induced by the pump-laser flash after a series of zero to seven saturating preflashes used to populate the respective S state before the pump flash. Measurements were performed at an excitation energy of 8.5 μJ, close to saturation (see below), to maximize Xms. As revealed by F ig. 5 A, Xms is visible for the first time on the third flash, which induces the transition. It is well described using the same t1/2 = 1.15 ms as obtained from PBD signals of PSII excited repetitively. Plotting the magnitude of Xms against the flash number (Fig. 5 B, solid circles) reveals a pronounced quaternary oscillation with maxima on flashes 3 and 7. The oscillatory behavior was simulated qualitatively by the Kok model (66), assuming 10% of misses (centers not hit by the flashes) and 100% of centers in the state before the first flash (Fig. 5 B, solid line). Similar values have been used previously (9,70). Accordingly, Xms is attributable straightforwardly to the oxygen-evolving transition.
Figure 5.
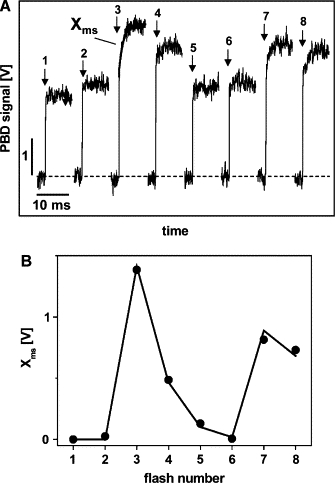
(A) PBD signals induced by the exciting pump flash (arrows) after the application, preceding the pump flash, of zero to seven saturating flashes to initially dark-adapted PSII membranes. Eexc = 8.5 μJ, ∼200 transients were averaged, the time resolution was 50 μs/data point, and T = 20°C. The rising signals in the millisecond time range (Xms) were simulated using a t1/2 of 1.15 ms, as exemplified for the transient on the third flash (line). (B) The amplitude of Xms (circles) as a function of the total flash number (saturating flashes plus pump flash). The solid line represents a simulation using the Kok model (69) and 10% of misses and 100% of centers in state before light-flash application.
Saturation of PBD signals at high laser-flash energy
To determine the fractions of the excitation energy that are stored in the photoproducts or thermalized, information on the extent of saturation of the PSII photochemistry is required. Fig. 6 shows PBD signals upon repetitive excitation of PSII membranes at three values of Eexc (at 20°C): Xms (Fig. 6, solid lines) increases in magnitude at higher values of Eexc; Xprompt (Fig. 6, dashed lines) is almost absent at 1.5 μJ, is around half of the total signal magnitude at 5 μJ, and is dominant at an excitation energy of 13 μJ.
Figure 6.
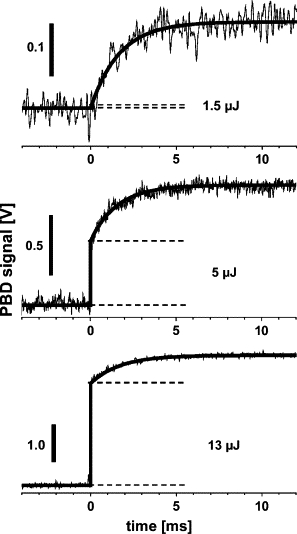
PBD signals of PSII membranes at three pump-flash energies (at 20°C). The slow phase (Xms) of the three signals was simulated using an exponential function with t1/2 = 1.15 ms. Note the increase of Xprompt (dashes) relative to Xms at increasing Eexc.
Fig. 7 A reveals that the magnitude of Xms shows single-exponential saturation behavior, being half-maximal at a value of Eexc close to 4 μJ (line). In Fig. 7 B, the relative magnitudes of Xprompt/Eexc are plotted against Eexc. In the presence of DCMU and background illumination, Xprompt is proportional to Eexc (triangles and dashed line), resulting from the conversion of 100% of the absorbed energy into heat.
Figure 7.
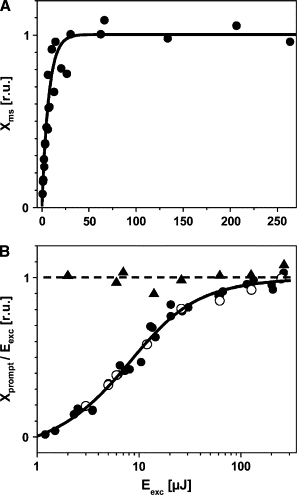
Dependence of the PBD signals of PSII on the energy (Eexc) of the pump flash. (A) Relative magnitudes of Xms (solid circles) reveal single-exponential saturation behavior (line). (B) Relative magnitudes of PBD signals (Xprompt/Eexc) due to instantaneous heat release. Xprompts are from data in Figs. 4 (+DCMU) (open circles) and 6 (solid circles). Data points were simulated (line) using Eq. 9 (). Solid triangles represent Xprompt from data in Fig. 4 (+DCMU + light). The dashed line accounts for the conversion of 100% of the absorbed excitation energy into heat.
At low Eexc, apparently the rapidly rising PBD signal vanished (Fig. 7 B, circles). The PBD signal due to heat release was compensated by a signal due to nonthermal changes, ΔN, with opposite sign (see Eq. 5). The increase in the fraction of the absorbed energy that was released as heat at increasing Eexc was simulated using Eq. 9 (Fig. 7 B, solid line). The simulation revealed a value of of 4.0 ± 0.6 μJ, in agreement with the saturation behavior of Xms. In conclusion, at excitation energies ≪4 μJ, most of the absorbed energy is used for the photochemistry and quantification of the intrinsic values of ΔQPSII, and QSt becomes feasible.
Calibration of PBD signals of PSII by comparison with the calorimetric standard BCP
Values of ΔQPSII can be determined by comparison with ΔQBCP (Eqs. 4 and 5). PBD signals of BCP were measured in the presence of PSII membranes. This procedure was chosen because of the pronounced light-scattering of the PSII membranes, which diminished the amplitude of the PBD signal compared to that of an optically clear BCP solution. For excitation at Eexc = 5 μJ, we compared signals of a PSII sample (sample 1) (Fig. 8 A, upper curve) and a sample that contained PSII with BCP added (sample 2) (Fig. 8 A, middle curve). The concentrations were adjusted such that the absorptions of PSII and BCP at 532 nm were similar (Fig. 3). The difference between PBD signals from samples 1 and 2 is attributable to the presence of BCP in sample 2 (Fig. 8 A, lower curve). Its step-shaped behavior was the same as that of the signal of a sample containing BCP alone (triangles), indicating that PSII protein had no influence on the calorimetric reference (and vice versa).
Figure 8.
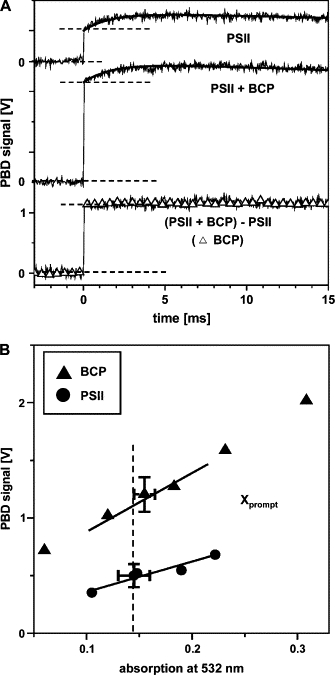
(A) PBD signals of PSII membranes for repetitive flash excitation in the absence (upper trace) and presence (middle trace) of BCP (6.8 μg/mL, similar absorption of 0.14 at 532 nm to that of PSII membranes); the lower trace represents the difference signal. About 1000 transients were averaged; the time resolution was 10 μs/data point (Eexc = 5 μJ, T = 20°C). A signal of BCP in buffer (triangles) scaled to the magnitude of that resulting from the measurement in the presence of PSII is shown for comparison (lower trace). (B) Xprompt from measurements similar to those in A of BCP and PSII membranes at increasing absorption at 532 nm determined from spectra shown in Fig. 3. The dashed line denotes the absorption (Aexc) of 0.14 of the PSII membranes at a Chl concentration of 20 μg/mL.
To derive a quantitative relation between the magnitudes of Xprompt of PSII and BCP, measurements as shown in Fig. 8A were performed for various PSII and BCP concentrations. The respective values of Aexc at 532 nm were determined from absorption spectra, as shown in Fig. 3. As anticipated, Xprompt of BCP, which corresponds to a ΔQ value of 100%, was clearly larger (by a factor of ∼2) than Xprompt of PSII (Fig. 8 B). Similar measurements as depicted in Fig. 8 were carried out at three excitation energies and at various temperatures to quantify the contributions to the PSII signal originating in ΔQ and ΔN, as discussed below.
Discrimination between thermal and nonthermal PBD signals by temperature variation
Fig. 9 shows PBD signals of PSII at selected temperatures and at two excitation energies. When lowering the temperature, the magnitude of Xprompt was diminished relative to Xms for an Eexc of 5 μJ. At −1°C and lower Eexc (1.2 μJ), even Xprompt was negative, indicating the prevalence of ΔN contributions. Contrastingly, at both excitation energies, the amplitude of Xms was almost temperature-independent. However, the halftime of Xms increased at lower temperatures. From a respective Arrhenius plot (Fig. 10), an activation energy of Xms of Ea = 230 ± 30 meV was determined. A similar Ea, and also similar halftimes, have been reported previously for the electron transfer in the O2-evolving transition (65).
Figure 9.
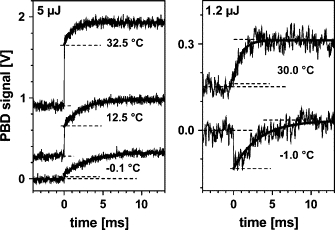
PBD signals of PSII at the indicated excitation energies and buffer temperatures. About 1000 transients at 10 μs/data point (5 μJ) and 5000 transients at 20 μs/data point (1.2 μJ) were averaged. Xms (dashed lines) was simulated (solid line) using t1/2 values of 0.77 ms (32.5°C), 1.45 ms (12.5°C), and 2.20 ms (−0.1°C) at Eexc = 5 μJ, and of 0.79 ms (30°C) and 2.27 ms (−1°C), respectively, at Eexc = 1.2 μJ. Note that the magnitude of Xms is similar in all traces, whereas Xprompt strongly decreases with decreasing temperature.
Figure 10.
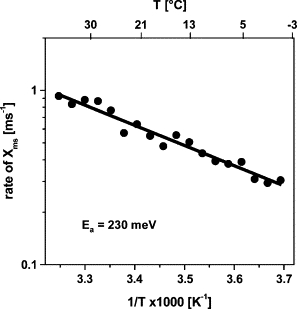
Arrhenius plot of the rate constant of the millisecond phase (Xms) of PBD signals due to the oxygen-evolving transition. Data points were derived from measurements at Eexc = 5 μJ similar to those in Fig. 9left, and slightly smoothed by adjacent averaging over two points for display. The line represents a fit using the Arrhenius equation and an activation energy (Ea) of 230 meV (k = k0(exp(−Ea/kBT)); kB is the Boltzmann constant, and the value of the preexponential factor, k0, was 5.75 × 10³ ms−1).
Fig. 11 shows the temperature dependence of Xprompt for PSII and BCP (left) and of Xms for PSII (right) at three excitation energies. In pure water, the Xprompt of BCP vanished at as expected for a perfect calorimetric reference (Fig. 11, left middle, plus symbols). When BCP was dissolved in the same buffer containing 1 M betaine, as used for the measurements with PSII membranes, the zero crossing point was shifted to a considerably lower temperature, T0 = −16 ± 1°C (Fig. 11, triangles), because the high betaine concentration altered the thermoelastic properties of the solution. At T0, ΔQ-related components of the PBD signals of PSII vanished and only ΔN-related contributions remained. Simulations of the data in Fig. 11 using Eq. 4 for BCP (dashed lines) and Eq. 5 for PSII (solid lines) yielded the values of ΔQ, QSt, and ΔN listed in Table 1.
Figure 11.
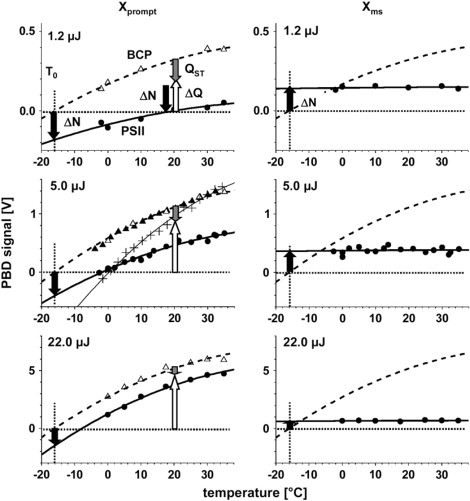
Temperature dependence of Xprompt (left) and Xms (right) of PSII (solid circles) compared to the PBD signal of the standard BCP (triangles) at three excitation energies (for equal absorption at 532 nm). Bold lines represent fit curves calculated using Eqs. 4 (BCP) and 5 (PSII) and the parameters shown in Table 1. PBD signals of BCP were measured in the presence (open triangles) or absence (solid triangles) of PSII membranes. At T0 = −16 ± 1°C (dotted lines), the thermal contributions to the PBD signal vanish and only the ΔN-related signals remain. ΔN is negative for formation (Xprompt), but positive for the O2-evolving transition (Xms). From the fit curves, the magnitudes of ΔN, QSt, and ΔQ (arrows) in Table 1 were determined. In the middle chart in the left column, the amplitudes of PBD signals of BCP measured in pure water (+) and a respective simulation yielding (thin line) are shown for comparison.
Table 1.
Parameters from simulations of the temperature dependence of PBD signals of PSII and BCP
| Eexc (μJ) | BCP | PSII Xprompt | PSII Xms | |
|---|---|---|---|---|
| 1.2 | ΔQ (%) | 100 | 57.3 ± 7 | 2.1 ± 5 |
| QSt (%) | 0 | 42.7 ± 7 | NA | |
| ΔN (V) | 0 | −0.17 ± 0.02 | 0.14 ± 0.02 | |
| 5.0 | ΔQ (%) | 100 | 76.4 ± 4 | 1.4 ± 4 |
| QSt (%) | 0 | 23.6 ± 4 | NA | |
| ΔN (V) | 0 | −0.39 ± 0.03 | 0.36 ± 0.04 | |
| 22.0 | ΔQ (%) | 100 | 95.9 ± 6 | 0.8 ± 2 |
| QSt (%) | 0 | 4.1 ± 6 | NA | |
| ΔN (V) | 0 | −1.39 ± 0.2 | 0.73 ± 0.08 |
Fig. 11 shows the fit curves corresponding to the parameters. For all simulations using Eqs. 4 and 5, α = 0.607, β = 0.0334°C−1, and γ = −0.00029°C−2, were used with respective δ-values of 0.27 V (1.2 μJ), 0.96 V (5 μJ), and 4.47 V (22 μJ). The values of α, β, and γ were determined from the BCP signals at Eexc = 5 μJ (Fig. 11, solid triangles) and kept constant in the simulations of all other data points; NA, not applicable; the likely errors in the fit results are indicated. The magnitudes of ΔQ and QSt are given as a percentage of the ΔQ = value of BCP corresponding to the 100% level of the conversion of the absorbed photon energy into heat.
The magnitude of the PBD signal of BCP (Fig. 11, dashed lines) corresponds to complete conversion of the absorbed energy into heat (100% level of ΔQ). At any temperature, ΔQPSII (open arrows) was smaller than ΔQBCP. At T0, the magnitude of ΔN of PSII (solid arrows) is determined directly. Clearly, ΔN is negative for the prompt signal corresponding to the formation, but positive for the ms component of the O2-evolving transition. In the following, the ΔN contributions are assumed to be temperature-independent. The stored-energy fraction (gray arrows) is the difference QSt = ΔQBCP - ΔQPSII. ΔQPSII comprises enthalpy changes, ΔH, coupled to the photochemical and subsequent reactions. Quantitative values of these parameters are provided in the next section.
Enthalpy changes of YZ·+QA− formation and of the O2-evolving transition
YZ·+QA− formation
The radical pair is formed clearly within <10 μs after the photon absorption event. Fig. 12 shows the fraction of the absorbed energy that is released as heat within <10 μs (ΔQprompt, solid circles). Extrapolation to zero excitation energy delivers the intrinsic value of ΔQprompt, which is ∼57% (Fig. 12). Thus, for an absorbed photon at 532 nm (2330 meV), 1330 meV is released as heat into the medium and the remainder (ESt = 1000 meV) is stored in the state. The enthalpy change for formation is estimated using Eq. 11. Assuming a quantum yield of unity, is calculated as −820 meV. Fig. 12 shows that the data collected at 1.2, 5, and 22 μJ corresponds to the same Therefore, the error in ΔH is lower by a factor of than the errors given in Table 1. Taking into account the mean error of the ΔQprompt values of 6%, an improvement by a factor of and an uncertainty in the value of the sample absorption at 532 nm of 15% (Fig. 3), the likely error in may be ±250 meV. We note that a lower quantum yield would result in a less negative ΔH value.
Figure 12.
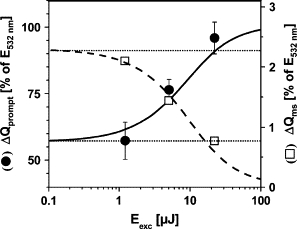
Fractions of the absorbed energy of a 532-nm photon that are released as heat (ΔQ) from PSII upon formation (solid circles, left y axis) and upon the O2-evolving transition (open squares, right y axis) plotted versus the excitation energy. Data points correspond to the values listed in Table 1. Curves represent fits to the data (solid line, ΔQprompt; dashed line, ΔQms) using a saturation behavior as described by Eq. 9 and a value of of 4 μJ (derived from Xprompt (see Fig. 7 B)). Dotted lines denote the ΔQ values from extrapolations of the simulation curves to Eexc = 0.
The oxygen-evolving transition
Visual inspection of Fig. 11 reveals that the magnitude of Xms is almost temperature-independent, suggesting a value of close to zero. Accordingly, Xms may reflect solely nonthermal changes in the sample, and the O2-evolving step may not be coupled to significant enthalpy changes. Using simulations of the data in Fig. 11 (right column, solid lines) based on Eq. 7, the values of ΔQms shown in Table 1 and Fig. 12 (open squares) were obtained. Extrapolation (to Eexc = 0) yields an intrinsic ΔQms of 2.3% of the absorbed photon energy. Because under repetitive flash excitation the transition occurs only in 25% of PSII centers on each flash, this value has to be multiplied by a factor of 4, yielding = 9.2%. Accordingly, the respective enthalpy change is calculated as = −210 meV. Using the same rationale as above, the error in this value again may be estimated as ±250 meV.
Discussion
YZ·+QA− formation
We determine an enthalpy change of −820 ± 250 meV for PSII active in dioxygen formation. Calculation of this value from the PBD data involved the assumption that the quantum yield of the PSII photochemistry for excitation at 532 nm (φ532) is 100%. At 532 nm, carotenoids in PSII may be excited which do not transfer excitation energy efficiently (71), resulting in additional heat loss. According to estimates in the literature (72,73) and in our laboratory ((74) and B. Süss, unpublished results), φ532 nm may be on the order of 60–80% of the value obtained for excitation into the Qy absorption band (at ≥630 nm) of the chlorophylls in PSII. For a reasonable φ532 value of 70%, the PBD data suggests that likely is within the range from −150 to −650 meV. Thus, the PBD results are compatible with the notion that ΔH is approximately equal to ΔG (see below).
Photoacoustic studies (for review, see (73)) suggested a more negative ΔH of formation in Mn-depleted (inactive) PSII (−1115 meV (41)) and whole cells (−1000 meV (75)) of the cyanobacterium Synechocystis. In whole cells, inactive centers are expected to be present, e.g., due to the high turnover rate of the D1 protein of PSII (76), which carries the Mn complex. The enthalpy changes of formation in PSII devoid of Mn likely are severely altered, according to the at least 100-fold reduced rate of YZ oxidation (77,78), presumably related to a less positive midpoint potential of the pair (79,80), and according to the >100 meV more positive Em of the couple (81). It is anticipated that both effects will result in a decrease in the stored energy (increased heat loss) and, thus, to a value of ΔH that is more negative than in active PSII.
Determination of the free energy change on the basis of Chl fluorescence data has yielded a of −540 ± 32 meV (32) for the same oxygen-evolving PSII membrane preparation employed in this investigation. Our estimates, within considerable uncertainty, may suggest a value of in active PSII that is close to the ΔG of the radical pair formation. Accordingly, entropic contributions to this reaction may be small. These conclusions are in accord with the observed pH-independent behavior of the rate of YZ oxidation (77,82,83) and of the driving force, (32,74). Protolytic reactions, which may result in considerable entropic contributions to ΔG, seem not to be involved in formation up to at least 10 μs after the absorption event in active PSII.
There is a prominent nonthermal PBD signal coupled to the formation. Its negative sign is compatible with a volume contraction of the PSII protein due to electrostriction (84) in response to the creation of two charges with opposite signs. Using the approach outlined in (85), i.e., Eq. 13, thermodynamic parameters for pure water at 20°C, and the data in Fig. 11 for Xprompt at a value of Eexc of 1.2 μJ, an apparent volume change of −13 Å3 may be calculated, for a quantum yield of unity. This value is in agreement with the previous notion that the apparent volume change in PSII (in the range of −11 Å3 to −16 Å3) is about half as large as the one coupled to charge separation in PSI and the bacterial reaction center (73). However, effects other than protein volume changes may contribute to the nonthermal signal. Further investigations are required to clarify this issue.
The oxygen-evolving transition
Here, we report the first direct measurement of the enthalpy change associated with the oxygen-evolving transition () of the Mn complex of PSII. A range of −460 meV < < +40 meV is compatible with the likely error in the PBD data. We conclude that the crucial dioxygen-formation step is only slightly exergonic, or may even represent an entropy-driven process (ΔH ≈ 0). Entropic contributions to the driving force may result from O2 release (88) and proton release (89).
Recently, we detected an intermediate in the transition, which is created within ∼200 μs after the third-flash excitation of PSII and before O2 formation (Fig. 1, ) (9–11). Formation of this intermediate has been attributed to proton release from the Mn complex (9). Whether this process is coupled to significant enthalpy changes cannot be concluded from the data presented here, because PBD signals with a rise time around 200 μs have not been observed. The corresponding PBD signal thus is expected to be small and may not be discernable using repetitive flash excitation of PSII.
The transition presumably comprises internal proton shifts and reorganization of hydrogen bonds at the Mn complex, proton release into the medium, Mn and reduction by electrons from bound water, O-O bond formation and O2 release, reorganization of the Mn complex and the surrounding protein matrix, and, possibly, binding of water molecules (see (12) and Fig. 1). Each of these processes may be coupled to enthalpy and entropy changes. Which of these events dominates the prominent nonthermal PBD signal on the O2-evolving step, corresponding to an apparent volume expansion, ΔV(), of about +42 Å3 (calculated for unity quantum yield), is unclear at present. One way to discriminate the protolytic reactions from other contributions to the PBD signal could be to characterize its dependence on pH and the variation of rate constants in H2O and D2O. These studies are in progress.
Acknowledgments
We thank Björn Süss for helpful discussions on the topic of this work, Andre Klauss for his contributions to the PBD measurements, and Monika Fünning for skillful preparation of the PSII membranes.
We gratefully acknowledge financial support by the Volkswagen Foundation (grant I77/575), the Deutsche Forschungsgemeinschaft (SFB498), and the Bundesministerium für Bildung und Forschung (Consortium “Grundlagen für einen biomimetischen und biotechnologischen Ansatz der Wasserstoffproduktion”, grant 035F0318C).
Footnotes
We dedicate this work to the memory of Prof. Horst-Tobias Witt, who was one of the fathers of modern photosynthesis research, and who passed away in May 2007.
Editor: Helmut Grubmuller.
References
- 1.Nugent, J. H. A., editor. 2001. Photosynthetic water oxidation. Special issue. Biochim. Biophys. Acta. 1503:1-259. [DOI] [PubMed]
- 2.Diner B.A., Rappaport F. Structure, dynamics, and energetics of the primary photochemistry of photosystem II of oxygenic photosynthesis. Annu. Rev. Plant Biol. 2002;53:551–580. doi: 10.1146/annurev.arplant.53.100301.135238. [DOI] [PubMed] [Google Scholar]
- 3.Barber J. Photosystem II: the engine of life. Q. Rev. Biophys. 2003;36:71–89. doi: 10.1017/s0033583502003839. [DOI] [PubMed] [Google Scholar]
- 4.Nelson N., Yocum C.F. Structure and function of photosystems I and II. Annu. Rev. Plant Biol. 2006;57:521–567. doi: 10.1146/annurev.arplant.57.032905.105350. [DOI] [PubMed] [Google Scholar]
- 5.McEvoy J.P., Brudvig G.W. Water-splitting chemistry of photosystem II. Chem. Rev. 2006;106:4455–4483. doi: 10.1021/cr0204294. [DOI] [PubMed] [Google Scholar]
- 6.Witt H.-T. Coupling of quanta, electrons, fields, ions and phosphorylation in the functional membrane of photosynthesis. Q. Rev. Biophys. 1971;4:365–477. doi: 10.1017/s0033583500000834. [DOI] [PubMed] [Google Scholar]
- 7.Witt H.-T. Functional mechanism of water splitting photosynthesis. Photosynth. Res. 1991;29:55–77. doi: 10.1007/BF00035377. [DOI] [PubMed] [Google Scholar]
- 8.Witt H.-T. Primary reactions of oxygenic photosynthesis. Berichte Bunsen Ges. 1996;100:1923–1942. [Google Scholar]
- 9.Haumann M., Liebisch P., Müller C., Barra M., Grabolle M., Dau H. Photosynthetic O2 formation tracked by time-resolved X-ray experiments. Science. 2005;310:1019–1021. doi: 10.1126/science.1117551. [DOI] [PubMed] [Google Scholar]
- 10.Dau H., Haumann M. Time-resolved X-ray spectroscopy leads to an extension of the classical S-state cycle of photosynthetic oxygen evolution. Photosynth. Res. 2007;92:327–343. doi: 10.1007/s11120-007-9141-9. [DOI] [PubMed] [Google Scholar]
- 11.Dau H., Haumann M. Eight steps preceding O-O bond formation in oxygenic photosynthesis: a basic reaction cycle of the photosystem II manganese complex. Biochim. Biophys. Acta. 2007;1767:472–483. doi: 10.1016/j.bbabio.2007.02.022. [DOI] [PubMed] [Google Scholar]
- 12.Dau H., Haumann M. The manganese complex of photosystem II in its reaction: basic framework and possible realization at the atomic level. Coord. Chem. Rev. 2007;252:273–295. [Google Scholar]
- 13.Holzwarth A.R., Müller M.G., Reus M., Nowaczyk M., Sander J., Rögner M. Kinetics and mechanism of electron transfer in intact photosystem II and in the isolated reaction center: pheophytin is the primary electron acceptor. Proc. Natl. Acad. Sci. USA. 2006;103:6895–6900. doi: 10.1073/pnas.0505371103. [DOI] [PMC free article] [PubMed] [Google Scholar]
- 14.Dekker J.P., van Grondelle R. Primary charge separation in photosystem II. Photosynth. Res. 2000;63:195–208. doi: 10.1023/A:1006468024245. [DOI] [PubMed] [Google Scholar]
- 15.Ferreira K.N., Iverson T.M., Maghlaoui K., Barber J., Iwata S. Architecture of the photosynthetic oxygen-evolving center. Science. 2004;303:1831–1838. doi: 10.1126/science.1093087. [DOI] [PubMed] [Google Scholar]
- 16.Loll B., Kern J., Saenger W., Zouni A., Biesiadka J. Towards complete cofactor arrangement in the 3.0 Å resolution structure of photosystem II. Nature. 2005;438:1040–1044. doi: 10.1038/nature04224. [DOI] [PubMed] [Google Scholar]
- 17.Brettel K.E.S., Witt H.-T. Nanosecond reduction kinetics of photooxidized chlorophyll-a II (P-680) in single flashes as a probe for the electron pathway, H+-release and charge accumulation in the O2-evolving complex. Biochim. Biophys. Acta. 1984;766:403–415. [Google Scholar]
- 18.Dekker J.P., Plijter J.J., Ouwehand L., van Gorkom H.J. Kinetics of manganese redox transitions in the oxygen-evolving apparatus of photosynthesis. Biochim. Biophys. Acta. 1984;767:176–179. [Google Scholar]
- 19.Renger G., Hanssum B. Studies on the reaction coordinates of the water oxidase in PS II membrane fragments from spinach. FEBS Lett. 1992;299:28–32. doi: 10.1016/0014-5793(92)80092-u. [DOI] [PubMed] [Google Scholar]
- 20.Haumann M., Bögershausen O., Cherepanov D., Ahlbrink R., Junge W. Photosynthetic oxygen evolution: H/D isotope effects and the coupling between electron and proton transfer during the redox reactions at the oxidizing side of photosystem II. Photosynth. Res. 1997;51:193–208. [Google Scholar]
- 21.Iwata S., Barber J. Structure of photosystem II and molecular architecture of the oxygen-evolving centre. Curr. Opin. Struct. Biol. 2004;14:447–453. doi: 10.1016/j.sbi.2004.07.002. [DOI] [PubMed] [Google Scholar]
- 22.Yano J., Kern J., Sauer K., Latimer M.J., Pushkar Y., Biesiadka J., Loll B., Saenger W., Messinger J., Zouni A., Yachandra V.K. Where water is oxidized to dioxygen: structure of the photosynthetic Mn4Ca cluster. Science. 2006;314:821–825. doi: 10.1126/science.1128186. [DOI] [PMC free article] [PubMed] [Google Scholar]
- 23.Haumann M., Müller C., Liebisch P., Iuzzolino L., Dittmer J., Grabolle M., Neisius T., Meyer-Klaucke W., Dau H. Structural and oxidation state changes of the photosystem II manganese complex in four transitions of the water oxidation cycle (S0 → S1, S1 → S2, S2 → S3, S3,4 ⇒ S0) characterized by X-ray absorption spectroscopy at 20 K as well as at room temperature. Biochemistry. 2005;44:1894–1908. doi: 10.1021/bi048697e. [DOI] [PubMed] [Google Scholar]
- 24.Pushkar Y., Yano J., Glatzel P., Messinger J., Lewis A., Sauer K., Bergmann U., Yachandra V.K. Structure and orientation of the Mn4Ca cluster in plant photosystem II membranes studied by polarized range-extended X-ray absorption spectroscopy. J. Biol. Chem. 2007;282:7198–7208. doi: 10.1074/jbc.M610505200. [DOI] [PMC free article] [PubMed] [Google Scholar]
- 25.Vos M.H., van Gorkom H.J., van Leeuwen P.J. An electroluminescence study of stabilization reactions in the oxygen-evolving complex of photosystem II. Biochim. Biophys. Acta. 1991;1056:27–39. [Google Scholar]
- 26.Vass I., Styring S. pH-dependent charge equilibria between tyrosine-D and the S states in photosystem II. Estimation of relative midpoint redox potentials. Biochemistry. 1991;30:830–839. doi: 10.1021/bi00217a037. [DOI] [PubMed] [Google Scholar]
- 27.Renger G., Christen G., Karge M., Eckert H.-J., Irrgang K.-D. Application of the Marcus theory for analysis of the temperature dependence of the reactions leading to photosynthetic water oxidation: results and implications. J. Biol. Inorg. Chem. 1998;3:360–366. [Google Scholar]
- 28.Renger G. Photosynthetic water oxidation to molecular oxygen: apparatus and mechanism. Biochim. Biophys. Acta. 2001;1503:210–228. doi: 10.1016/s0005-2728(00)00227-9. [DOI] [PubMed] [Google Scholar]
- 29.Witt H.-T., Brettel K., Schlodder E., Saygin Ö. Reaction sequences from light absorption to the cleavage of water in photosynthesis: rates, routes, and intermediates. Photosynth. Res. 1986;10:453–471. doi: 10.1007/BF00118312. [DOI] [PubMed] [Google Scholar]
- 30.Klimov V.V., Allakhverdiev S.I., Demeter S., Krasnovsky A.A. Photoreduction of pheophytin in photosystem II as a function of redox potential of the medium. Dokl. Akad. Nauk SSSR. 1979;249:227–230. [Google Scholar]
- 31.Karge M., Irrgang K.-D., Renger G. Analysis of the reaction coordinate of photosynthetic water oxidation by kinetic measurements of 355 nm absorption changes at different temperatures in photosystem II preparations suspended either in H2O or D2O. Biochemistry. 1997;36:8904–8913. doi: 10.1021/bi962342g. [DOI] [PubMed] [Google Scholar]
- 32.Grabolle M., Dau H. Energetics of primary and secondary electron transfer in photosystem II membrane particles of spinach revisited on basis of recombination-fluorescence measurements. Biochim. Biophys. Acta. 2005;1708:209–218. doi: 10.1016/j.bbabio.2005.03.007. [DOI] [PubMed] [Google Scholar]
- 33.Rappaport F., Guergova-Kuras M., Nixon P.J., Diner B.A., Lavergne J. Kinetics and pathways of charge recombination in photosystem. Biochemistry. 2002;41:8518–8527. doi: 10.1021/bi025725p. [DOI] [PubMed] [Google Scholar]
- 34.Sproviero E.M., Gascon J.A., McEvoy J.P., Brudvig G.W., Batista V.S. Characterization of synthetic oxomanganese complexes and the inorganic core of the O2-evolving complex in photosystem II: evaluation of the DFT/B3LYP level of theory. J. Inorg. Biochem. 2006;100:786–800. doi: 10.1016/j.jinorgbio.2006.01.017. [DOI] [PubMed] [Google Scholar]
- 35.Sproviero E.M., Gascon J.A., McEvoy J.P., Brudvig G.W., Batista V.S. Quantum mechanics/molecular mechanics structural models of the oxygen-evolving complex of photosystem II. Curr. Opin. Struct. Biol. 2007;17:173–180. doi: 10.1016/j.sbi.2007.03.015. [DOI] [PubMed] [Google Scholar]
- 36.Siegbahn P.E., Lundberg M. The mechanism for dioxygen formation in PSII studied by quantum chemical methods. Photochem. Photobiol. Sci. 2005;4:1035–1043. doi: 10.1039/b506746b. [DOI] [PubMed] [Google Scholar]
- 37.Braslavsky S.E. Photoacoustic and photothermal methods applied to the study of radiationless deactivation processes in biological systems and in substances of biological interest. Photochem. Photobiol. 1986;43:667–675. doi: 10.1111/j.1751-1097.1986.tb05645.x. [DOI] [PubMed] [Google Scholar]
- 38.Peters K.S., Snyder G.J. Time-resolved photoacoustic calorimetry: probing the energetics and dynamics of fast chemical and biochemical reactions. Science. 1988;241:1053–1057. doi: 10.1126/science.3045967. [DOI] [PubMed] [Google Scholar]
- 39.Braslavsky S.E., Heibel G.E. Time-resolved photothermal and photoacoustic methods applied to photoinduced processes in solution. Chem. Rev. 1992;92:1381–1410. [Google Scholar]
- 40.Gensch T., Viappiani C. Time-resolved photothermal methods: accessing time-resolved thermodynamics of photoinduced processes in chemistry and biology. Photochem. Photobiol. Sci. 2003;2:699–721. doi: 10.1039/b303177b. [DOI] [PubMed] [Google Scholar]
- 41.Hou J.M., Boichenko V.A., Wang Y.C., Chitnis P.R., Mauzerall D. Thermodynamics of electron transfer in oxygenic photosynthetic reaction centers: a pulsed photoacoustic study of electron transfer in photosystem I reveals a similarity to bacterial reaction centers in both volume change and entropy. Biochemistry. 2001;40:7109–7116. doi: 10.1021/bi0103720. [DOI] [PubMed] [Google Scholar]
- 42.Hou J.M., Boichenko V.A., Diner B.A., Mauzerall D. Thermodynamics of electron transfer in oxygenic photosynthetic reaction centers: volume change, enthalpy, and entropy of electron-transfer reactions in manganese-depleted photosystem II core complexes. Biochemistry. 2001;40:7117–7125. doi: 10.1021/bi010373s. [DOI] [PubMed] [Google Scholar]
- 43.Edens G.J., Gunner M.R., Xu Q., Mauzerall D. The entropy and enthalpy of reaction for formation of from excited reaction centers of Rhodobacter spaeroides. J. Am. Chem. Soc. 2000;122:1479–1485. [Google Scholar]
- 44.Michler I., Braslavsky S.E. Time-resolved thermodynamic analysis of the oat phytochrome A phototransformation. A photothermal beam deflection study. Photochem. Photobiol. 2001;74:624–635. doi: 10.1562/0031-8655(2001)074<0624:trtaot>2.0.co;2. [DOI] [PubMed] [Google Scholar]
- 45.Losi A., Gensch T., van der Horst M.A., Helligwerf K.J., Braslavsky S.E. Hydrogen-bond network probed by time-resolved optoacoustic spectroscopy: The case of photoactive yellow protein and the effect of E46Q and E46A mutations. Phys. Chem. Chem. Phys. 2005;7:2229–2236. doi: 10.1039/b419079c. [DOI] [PubMed] [Google Scholar]
- 46.Zhang D., Mauzerall D. Volume and enthalpy changes in the early steps of bacteriorhodopsin photocycle studied by time-resolved photoacoustics. Biophys. J. 1996;71:381–388. doi: 10.1016/S0006-3495(96)79235-4. [DOI] [PMC free article] [PubMed] [Google Scholar]
- 47.Nishioku Y., Nakagawa M., Tsuda M., Terazima M. Energetics and volume changes of the intermediates in the photolysis of octopus rhodopsin at a physiological temperature. Biophys. J. 2002;83:1136–1146. doi: 10.1016/S0006-3495(02)75237-5. [DOI] [PMC free article] [PubMed] [Google Scholar]
- 48.Di Primo C., Hui Bon Hoa G., Deprez E., Douzou P., Sligar S.G. Conformational dynamics of cytochrome P-450cam as monitored by photoacoustic calorimetry. Biochemistry. 1993;32:3671–3676. doi: 10.1021/bi00065a021. [DOI] [PubMed] [Google Scholar]
- 49.Chen H., Sun L., Li G., Zhang S.Y., Chen H.L. Laser-induced time-resolved photoacoustic calorimetry study on photo-dissociation of human and bovine oxyhemoglobin. Biochem. Biophys. Res. Commun. 2004;319:157–162. doi: 10.1016/j.bbrc.2004.04.166. [DOI] [PubMed] [Google Scholar]
- 50.Miksovska J., Gennis R.B., Larsen R.W. Photothermal studies of CO photodissociation from mixed valence Escherichia coli cytochrome bo3. FEBS Lett. 2005;579:3014–3018. doi: 10.1016/j.febslet.2005.04.055. [DOI] [PubMed] [Google Scholar]
- 51.Dau H., Hansen U.-P. A study on the energy-dependent quenching of chlorophyll fluorescence by means of photoacoustic measurements. Photosynth. Res. 1990;25:269–278. doi: 10.1007/BF00033168. [DOI] [PubMed] [Google Scholar]
- 52.Dau H., Hansen U.-P. Studies on the adaptation of intact leaves to changing light intensities by a kinetic analysis of chlorophyll fluorescence and of oxygen evolution as measured by the photoacoustic signal. Photosynth. Res. 1989;20:59–83. doi: 10.1007/BF00028622. [DOI] [PubMed] [Google Scholar]
- 53.Canaani O., Malkin S., Mauzerall D. Pulsed photoacoustic detection of flash-induced oxygen evolution from intact leaves and its oscillations. Proc. Natl. Acad. Sci. USA. 1988;85:4725–4729. doi: 10.1073/pnas.85.13.4725. [DOI] [PMC free article] [PubMed] [Google Scholar]
- 54.Malkin S., Canaani O. The use and characteristics of the photoacoustic method in the study of photosynthesis. Annu. Rev. Plant Physiol. Plant Mol. Biol. 1994;45:493–526. [Google Scholar]
- 55.Almond D.P., Patel P.M. Chapman and Hall; London: 1996. Photothermal Sciences and Techniques. [Google Scholar]
- 56.Falvey D.E. Photothermal beam deflection calorimetry in solution photochemistry: recent progress and future prospects. Photochem. Photobiol. 1997;65:4–9. doi: 10.1111/j.1751-1097.1997.tb01870.x. [DOI] [PubMed] [Google Scholar]
- 57.Schiller H., Dau H. Preparation protocols for high-activity photosystem II membrane particles of green algae and higher plants, pH dependence of oxygen evolution and comparison of the S2-state multiline signal by X-band EPR spectroscopy. J. Photochem. Photobiol. B. 2000;55:138–144. doi: 10.1016/s1011-1344(00)00036-1. [DOI] [PubMed] [Google Scholar]
- 58.Iuzzolino L., Dittmer J., Dörner W., Meyer-Klaucke W., Dau H. X-ray absorption spectroscopy on layered photosystem II membrane particles suggests manganese-centered oxidation of the oxygen-evolving complex for the S0–S1, S1–S2, and S2–S3 transitions of the water oxidation cycle. Biochemistry. 1998;37:17112–17119. doi: 10.1021/bi9817360. [DOI] [PubMed] [Google Scholar]
- 59.Sheik-Bahae M. Nonlinear optics basics. Kramers-Kronig relations in nonlinear optics. In: Optics R.D., Guenther, editors. Encyclopedia of Modern. Academic Press; Amsterdam: 2005. [Google Scholar]
- 60.Vargaftik N.B., Vinogradov Y.K., Yargin V.S. Begell House; Redding, CT: 1996. Handbook of Physical Properties of Liquids and Gases: Pure Substances and Mixtures. [Google Scholar]
- 61.Döring G., Renger G., Vater J., Witt H.-T. Properties of the photoactive chlorophyll a II in photosynthesis. Z. Naturforsch. (B) 1969;24:1139–1143. doi: 10.1515/znb-1969-0911. [DOI] [PubMed] [Google Scholar]
- 62.Hillmann B., Schlodder E. Electron transfer in photosystem II core complexes from Synechococcus at low temperatures: difference spectrum of at 77 K. Biochim. Biophys. Acta. 1995;1231:76–88. [Google Scholar]
- 63.Boussac A., Girerd J.J., Rutherford A.W. Conversion of the spin state of the manganese complex in photosystem II induced by near-infrared light. Biochemistry. 1996;35:6984–6989. doi: 10.1021/bi960636w. [DOI] [PubMed] [Google Scholar]
- 64.Boussac A., Sugiura M., Kirilovsky D., Rutherford A.W. Near-infrared-induced transitions in the manganese cluster of photosystem II: action spectra for the S2 and S3 redox states. Plant Cell Physiol. 2005;46:837–842. doi: 10.1093/pcp/pci088. [DOI] [PubMed] [Google Scholar]
- 65.Buchta J., Grabolle M., Dau H. Photosynthetic dioxygen formation studied by time-resolved delayed fluorescence measurements.: method, rationale, and results on the activation energy of dioxygen formation. Biochim. Biophys. Acta. 2007;1767:565–574. doi: 10.1016/j.bbabio.2007.04.003. [DOI] [PubMed] [Google Scholar]
- 66.Bishop N.I. The influence of the herbicide, DCMU, on the oxygen-evolving system of photosynthesis. Biochim. Biophys. Acta. 1959;27:205–206. doi: 10.1016/0006-3002(58)90313-5. [DOI] [PubMed] [Google Scholar]
- 67.Giorgi L.B., Nixon P.J., Merry S.A., Joseph D.M., Durrant J.R., De Las Rivas J., Barber J., Porter G., Klug D.R. Comparison of primary charge separation in the photosystem II reaction center complex isolated from wild-type and D1–130 mutants of the cyanobacterium Synechocystis PCC 6803. J. Biol. Chem. 1996;271:2093–2101. doi: 10.1074/jbc.271.4.2093. [DOI] [PubMed] [Google Scholar]
- 68.Dau H. Molecular mechanisms and quantitative models of variable photosystem II fluorescence. Photochem. Photobiol. 1994;60:1–23. [Google Scholar]
- 69.Kok B., Forbush B., McGloin M. Cooperation of. charges in photosynthetic O2 evolution-I. A linear four step mechanism. Photochem. Photobiol. 1970;11:457–475. doi: 10.1111/j.1751-1097.1970.tb06017.x. [DOI] [PubMed] [Google Scholar]
- 70.Clausen J., Junge W., Dau H., Haumann M. Intermediates in photosynthetic water oxidation at high O2-backpressure detected by chlorophyll delayed fluorescence. Biochemistry. 2005;44:12775–12779. doi: 10.1021/bi051183a. [DOI] [PubMed] [Google Scholar]
- 71.Connelly J.P., Müller M.G, Bassi R., Croce R., Holzwarth A.R. Femtosecond transient absorption study of carotenoid to chlorophyll energy transfer in the light-harvesting complex II of photosystem II. Biochemistry. 1997;36:281–287. doi: 10.1021/bi962467l. [DOI] [PubMed] [Google Scholar]
- 72.Delosme R., Beal D., Joliot P. Photoacoustic detection of flash-induced charge separation in photosynthetic systems. Spectral dependence of the quantum yield. Biochim. Biophys. Acta. 1994;1185:56–64. [Google Scholar]
- 73.Delosme R. On some aspects of photosynthesis revealed by photoacoustic studies: a critical evaluation. Photosynth. Res. 2003;76:289–301. doi: 10.1023/A:1024977623828. [DOI] [PubMed] [Google Scholar]
- 74.Grabolle, M. 2005. Die Donorseite des Photosystems II der Pflanzen: Rekombinationsfluoreszenz- und Röntgenabsorptions-Studien. PhD thesis. Freie Universität Berlin, Berlin. Available at http://www.diss.fuberlin. de/2005/174/.
- 75.Boichenko V.A., Hou J.M., Mauzerall D. Thermodynamics of electron transfer in oxygenic photosynthetic reaction centers: volume change, enthalpy, and entropy of electron-transfer reactions in the intact cells of the cyanobacterium Synechocystis PCC 6803. Biochemistry. 2001;40:7126–7132. doi: 10.1021/bi010374k. [DOI] [PubMed] [Google Scholar]
- 76.Aro E.M., Suorsa M., Rokka A., Allahverdiyeva Y., Paakkarinen V., Saleem A., Battchikova N., Rintamäki E. Dynamics of photosystem II: a proteomic approach to thylakoid protein complexes. J. Exp. Bot. 2005;411:347–356. doi: 10.1093/jxb/eri041. [DOI] [PubMed] [Google Scholar]
- 77.Ahlbrink R., Haumann M., Cherepanov D., Bögershausen O., Mulkidjanian A., Junge W. Function of tyrosine-Z in water oxidation by photosystem II: electrostatical promotor instead of hydrogen abstractor. Biochemistry. 1998;37:1131–1142. doi: 10.1021/bi9719152. [DOI] [PubMed] [Google Scholar]
- 78.Renger G. Coupling of electron and proton transfer in oxidative water cleavage in photosynthesis. Biochim. Biophys. Acta. 2004;1655:195–204. doi: 10.1016/j.bbabio.2003.07.007. [DOI] [PubMed] [Google Scholar]
- 79.Haumann M., Junge W. Evidence for impaired hydrogen-bonding of tyrosine YZ in Ca2+-depleted photosystem II. Biochim. Biophys. Acta. 1999;1411:121–133. doi: 10.1016/s0005-2728(99)00045-6. [DOI] [PubMed] [Google Scholar]
- 80.Ishikita H., Knapp E.W. Function of redox-active tyrosine in photosystem II. Biophys. J. 2006;90:3886–3896. doi: 10.1529/biophysj.105.076984. [DOI] [PMC free article] [PubMed] [Google Scholar]
- 81.Krieger A., Rutherford A.W., Johnson G.N. On the determination of redox midpoint potential of the primary quinone electron acceptor, QA, in photosystem II. Biochim. Biophys. Acta. 1995;1229:193–201. [Google Scholar]
- 82.Christen G., Renger G. The role of hydrogen bonds for the multiphasic P680+* reduction by YZ in photosystem II with intact oxygen evolution capacity. Analysis of kinetic H/D isotope exchange effects. Biochemistry. 1999;38:2068–2077. doi: 10.1021/bi982188t. [DOI] [PubMed] [Google Scholar]
- 83.Faller P., Goussias C., Rutherford A.W., Un S. Resolving intermediates in biological proton-coupled electron transfer: a tyrosyl radical prior to proton movement. Proc. Natl. Acad. Sci. USA. 2003;100:8732–8735. doi: 10.1073/pnas.1530926100. [DOI] [PMC free article] [PubMed] [Google Scholar]
- 84.Arata H., Parson W.W. Enthalpy and volume changes accompanying electron transfer from P-870 to quinones in Rhodopseudomonas spaeroides reaction centers. Biochim. Biophys. Acta. 1981;636:70–81. doi: 10.1016/0005-2728(81)90077-3. [DOI] [PubMed] [Google Scholar]
- 85.Schulenberg P.J., Gärtner W., Braslavsky S.E. Time-resolved volume changes during the bacteriorhodopsin photocycle: a photothermal beam deflection study. J. Phys. Chem. 1995;99:9617–9624. [Google Scholar]
- 86.Bialkovski S.E. Photothermal spectroscopy methods for chemical analysis. Chemical Analysis. Vol. 134. Wiley; New York: 1996. [Google Scholar]
- 87.Eisenberg H.J. Equation for the refractive index of water. J. Chem. Phys. 1965;43:3887–3892. [Google Scholar]
- 88.Clausen J., Junge W. Detection of an intermediate of photosynthetic water oxidation. Nature. 2004;430:480–483. doi: 10.1038/nature02676. [DOI] [PubMed] [Google Scholar]
- 89.Haumann M., Junge W. Protons and charge indicators in oxygen evolution. In: Reactions D., Ort C.F., Yocum, editors. Oxygenic Photosynthesis: The Light. Kluwer Academic, Dordrecht; The Netherlands: 1996. pp. 165–192. [Google Scholar]