Crystals of Stx2 were grown in the presence of adenosine and adenine. In both cases, the resulting electron density showed only adenine bound at the active site of the A subunit, proving that the holotoxin is an active N-glycosidase.
Keywords: protein toxins, N-glycosidases, adenine, adenosine, holotoxins
Abstract
Stx2 is a protein toxin whose catalytic subunit acts as an N-glycosidase to depurinate a specific adenine base from 28S rRNA. In the holotoxin, the catalytic portion, A1, is linked to the rest of the A subunit, A2, and A2 interacts with the pentameric ring formed by the five B subunits. In order to test whether the holotoxin is active as an N-glycosidase, Stx2 was crystallized in the presence of adenosine and adenine. The crystals diffracted to ∼1.8 Å and showed clear electron density for adenine in the active site. Adenosine had been cleaved, proving that Stx2 is an active N-glycosidase. While the holotoxin is active against small substrates, it would be expected that the B subunits would interfere with the binding of the 28S rRNA.
1. Introduction
Stx2 is a member of a family of protein toxins produced by Escherichia coli O157:H7 and other enterohaemorrhagic E. coli (Konowalchuk et al., 1977 ▶). All members of the family are AB 5 toxins in which the A subunit contains the catalytic activity and the B subunits are responsible for the binding of the toxin to targeted cells. The B subunits form a pentameric ring (Stein et al., 1992 ▶) through which the carboxy-terminal portion of the A subunit, A2, extends (Fraser et al., 1994 ▶). A2 is linked to the catalytic portion, A1, by the polypeptide chain and by a disulfide bond (Olsnes et al., 1981 ▶). Once the B subunits bind to the receptor globotriaosylceramide (Galα1–4Galβ1–4-glucosyl ceramide; Gb3; Jacewicz et al., 1986 ▶), the holotoxin can be taken up into targeted cells through clathrin-coated pits and travels by retrograde transport to the endoplasmic reticulum (Sandvig & van Deurs, 2002 ▶). After the polypeptide chain has been nicked and the disulfide bond has been reduced, A1 is released into the cytoplasm where it is active as an N-glycosidase. It cleaves a specific adenine base from 28S rRNA in eukaryotic cells, shutting down protein synthesis and leading to cell death (Endo et al., 1988 ▶).
Stx2 is the second member of this family to have its structure determined (Fraser et al., 2004 ▶). The first was the Shiga toxin (Stx), the protein toxin from Shigella dysenteriae (Fraser et al., 1994 ▶). The A subunits of Stx and Stx2 are 56% identical and their B subunits are 64% identical, but Stx is virtually identical to Stx1, another member of the family of protein toxins produced by enterohaemorrhagic E. coli. Although Stx2 and Stx1 show a high degree of sequence similarity, the outcome of infection with E. coli O157:H7 depends on which toxin is being produced: the likelihood of the patient developing the serious outcome of haemolytic uraemic syndrome is greater if the E. coli produce Stx2 than if they only produce Stx1 (summarized by Siegler et al., 2003 ▶). Thus, the differences between the structures of the two holotoxins are of interest to gain an understanding of the different impacts of these toxins on humans.
One of the notable structural differences between Stx2 and Stx is in the accessibility of the active site. The disulfide bond linking A1 and A2 lies near the active site and in Stx residues of A2 occlude the binding site (Fraser et al., 1994 ▶). The active site in Stx2 is accessible and the crystal structure showed electron density for a molecule of formic acid from the crystallization solution bound in two orientations to residues of the active site (Fraser et al., 2004 ▶). We decided to test whether Stx2 was active as an N-glycosidase by growing the crystals in the presence of adenosine. Similar experiments have been performed with other members of the family of ribosome-inhibiting toxins, e.g. the A chain of ricin (Weston et al., 1994 ▶), pokeweed antiviral protein (Kurinov et al., 1999 ▶), tricosanthin (Gu & Xia, 2000 ▶) and mistletoe lectin I (Krauspenhaar et al., 2002 ▶). These enzymes cleaved adenosine between the ribose and the base, leaving adenine bound in the active site. This experiment would demonstrate whether the Stx2 holotoxin was enzymatically active against small substrates.
2. Materials and methods
2.1. Protein purification, crystallization and data collection
Stx2 was purified from E. coli C600 933W (Newland et al., 1985 ▶) by affinity chromatography using Synsorb-Pk (Mulvey et al., 1998 ▶) and the crystals were grown using the vapour-diffusion technique. Hanging drops were set up with 1 µl of a solution of Stx2 and the substrate, either adenosine or adenine, and 1 µl reservoir solution. The solution of Stx2 and substrate was buffered with 10 mM 2-morpholinoethanesulfonic acid (MES) pH 6.0 and had a protein concentration of 8.8 mg ml−1 (0.12 mM) and a substrate concentration of 5 mM. The reservoir solution consisted of 1 ml 4 M sodium formate, 0.1 M MES titrated with sodium hydroxide to pH 6.0, 50 mM 3-(1-pyridino)-1-propanesulfonate (PPS) and 3% ethylene glycol. The reservoir solution also served as the cryoprotectant with which the crystals were washed prior to vitrification in liquid nitrogen. The crystals were shipped to the Advanced Light Source, Berkeley, CA, USA for data collection on beamline 8.3.1.
2.2. Structure determination, refinement and analysis
The statistics for the two data sets and for the refined model are presented in Table 1 ▶. The data were indexed and processed using the programs DENZO and SCALEPACK (Otwinowski & Minor, 1997 ▶). The crystals were isomorphous to crystals of Stx2 grown in the absence of adenosine or adenine (Fraser et al., 2004 ▶). After one cycle of refinement of the model of Stx2 using the program CNS (Brünger et al., 1998 ▶), the electron-density maps showed clear density for adenine whether the crystals were grown in the presence of adenosine or adenine. Adenine was fitted into the density using the program Xfit (McRee, 1999 ▶) and the refinement continued. The quality of each model was judged between cycles of refinement and fitting using the programs PROCHECK (Laskowski et al., 1993 ▶) and WHATCHECK (Hooft et al., 1996 ▶). Programs from the CCP4 package (Collaborative Computational Project, Number 4, 1994 ▶) were used to manipulate the data and to analyse the models. The better model, as well as the structure-factor amplitudes, have been deposited in the PDB (Berman et al., 2000 ▶), where they have been assigned the identifier 2ga4. This model includes residues 1–242 and 257–297 of the A subunit and residues 1–70 of each of the five B subunits.
Table 1. Statistics for the data sets and structure solutions.
Values in parentheses are for the highest resolution shell.
| Stx2 crystallized with adenosine | Stx2 crystallized with adenine | |
|---|---|---|
| Resolution limit (Å) | 1.8 | 1.85 |
| Highest resolution shell (Å) | 1.83–1.80 | 1.88–1.85 |
| Unit-cell parameters (Å, °) | a = b = 144.55, c = 59.42, α = β = 90, γ = 120 | a = b = 144.59, c = 58.93, α = β = 90, γ = 120 |
| No. of measurements | 390485 | 338148 |
| No. of unique reflections | 68743 | 63014 |
| 〈I〉/〈σ(I)〉† | 20.8 (2.7) | 20.9 (2.4) |
| Rmerge‡ (%) | 7.7 (33.0) | 6.9 (29.1) |
| No. of data for refinement | 65741 | 60158 |
| Completeness (%) | 99.9 | 99.9 |
| R factor§ (%) | 15.6 | 15.9 |
| No. of data | 62466 | 57188 |
| Rfree¶ (%) | 18.3 | 18.8 |
| No. of data | 3275 | 2970 |
| No. of protein atoms†† | 4977 | 4977 |
| No. of atoms in adenine ligand | 10 | 10 |
| No. of atoms in PPS ligands | 52 | 52 |
| No. of atoms in ethylene glycol molecule | 4 | 4 |
| No. of atoms in formate molecules | 15 | 15 |
| No. of water molecules | 542 | 514 |
| No. of sodium ions | 5 | 5 |
| R.m.s. deviations from ideal geometry | ||
| Bond lengths (Å) | 0.016 | 0.016 |
| Bond angles (°) | 1.9 | 1.9 |
| Ramachandran plot statistics | ||
| Residues in most favoured regions | 526 [93.1%] | 524 [92.7%] |
| Residues in additional allowed regions | 39 [6.9%] | 40 [7.1%] |
| Residues in generously allowed regions | 0 [0%] | 1 [0.2%] |
| Residues in disallowed regions | 0 [0%] | 0 [0%] |
| R.m.s. deviations in B values (Å2) | ||
| Main-chain atoms | 1.3 | 1.4 |
| Side-chain atoms | 2.1 | 2.1 |
| Average B values for water molecules (Å2) | 29 | 31 |
| Range of B values for water molecules (Å2) | 11–52 | 11–56 |
〈I〉 is the mean intensity for all reflections; 〈σ(I)〉 is the mean sigma for these reflections.
R
merge = 
 , where Ii is the intensity of an individual measurement of a reflection and 〈I〉 is the mean value for all equivalent measurements of this reflection.
R factor = 
 .
.
R factor based on data excluded from the refinement (∼5%).
The residues modelled are 1–242 and 257–297 of chain A and 1–70 of chains B–F.
The search tools from the PDB were used to obtain structures of other ribosome-inactivating proteins for comparison. The other structures complexed with adenine are the A chain of ricin (PDB code 1ifs; Weston et al., 1994 ▶), α-momorcharin (PDB code 1aha; Ren et al., 1994 ▶), α-momorcharin (PDB code 1mrg; Huang et al., 1995 ▶), α-tricosanthin (PDB code 1mrj; Huang et al., 1995 ▶), pokeweed antiviral protein (PDB code 1qci; Kurinov et al., 1999 ▶), tricosanthin (PDB code 1qd2; Gu & Xia, 2000 ▶), mistletoe lectin I (PDB code 1m2t; Krauspenhaar et al., 2002 ▶) and dianthin antiviral protein (PDB code 1lpd; Kurinov et al., 2004 ▶).
3. Results and discussion
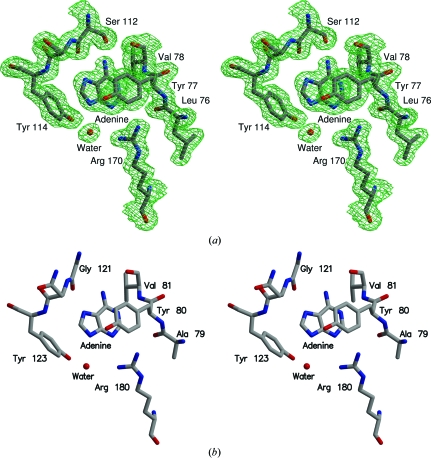
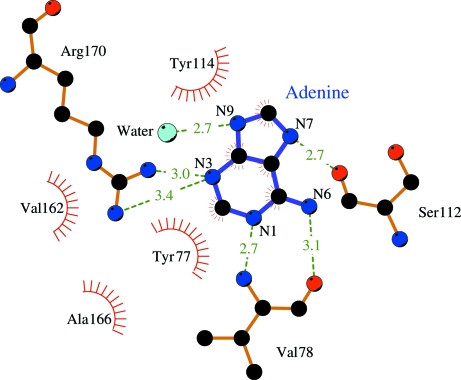
The electron density showed adenine bound in the active site of Stx2 whether the crystals were grown in the presence of adenosine or adenine. Since the data were better for the crystal grown with adenosine, this model will be used for reference. The final electron density for adenine and its environment in the holotoxin active site is shown in Fig. 1 ▶(a). Apparently the holotoxin does act as an N-glycosidase since it cleaves the ribose group from adenosine. The product adenine remains bound in the active site. The binding of adenine to Stx2 is very similar to its binding to the other ribosome-inactivating proteins. Fig. 1 ▶(b) shows the A chain of ricin complexed with adenine (Weston et al., 1994 ▶) in a similar orientation. Fig. 2 ▶ is a scheme showing the hydrogen-bonding interactions between the adenine ligand and the residues of the active site of the A subunit.
Figure 1.
(a) Stereoview of the electron density for adenine bound at the active site of Stx2. The 2|F o| − |F c|, αc map was calculated using the data from Stx2 crystallized with adenosine and is contoured at 1σ. The model is shaded according to atom type: grey for carbon, blue for nitrogen and red for oxygen. This figure was drawn using Xfit (McRee, 1999 ▶) and RASTER3D (Merritt & Bacon, 1997 ▶). (b) Stereoview of adenine bound at the active site of the A chain of ricin. For ease of comparison, the orientation is similar to that used in (a).
Figure 2.
Scheme showing the interactions between adenine and active-site residues of the A subunit of Stx2. This figure was drawn using LIGPLOT (Wallace et al., 1995 ▶).
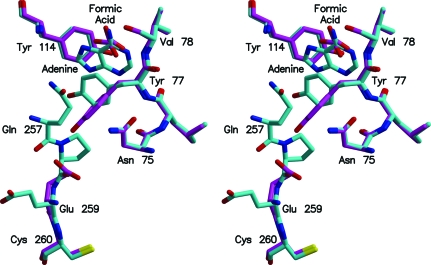
There are local changes at the active site of Stx2 on binding adenine. Adenine displaces the molecule of formic acid and two water molecules seen in the native structure. Hydrogen-bonding interactions with N1, N6 and N7 of adenine replace the interactions with formic acid, whereas interactions with N3 and N9 of adenine replace those with the water molecules. Relative to the structure of Stx2 with formic acid, the side chain of Tyr77 has rotated so that the ring stacks against adenine (Fig. 3 ▶). The change moves Tyr77 away from Glu259, the first residue of A2 seen in the structure of Stx2. In the complex of Stx2 with adenine, there is sufficient, albeit weak, electron density to fit two further residues of A2: Gln257 and Pro258. The movement of the tyrosine side chain into a position to stack with adenine is a common feature of several of the ribosome-inhibiting toxins. The most similar example is α-momorcharin, where the differences are primarily in the torsion angles of the tyrosine side chain (Ren et al., 1994 ▶). However, α-momorcharin does not have any residues similar to A2 of Stx2.
Figure 3.
Active-site residues of Stx2 with and without adenine bound. The superposition was based on the coordinates of the Cα atoms of residues A1–A242. The models are shaded according to atom type, as in Fig. 1 ▶, except that the C atoms of the structure with formate bound are magenta and the C atoms of the structure with adenine bound are cyan. This figure and Fig. 4 ▶ were drawn using MOLSCRIPT (Kraulis, 1991 ▶) and RASTER3D (Merritt & Bacon, 1997 ▶).
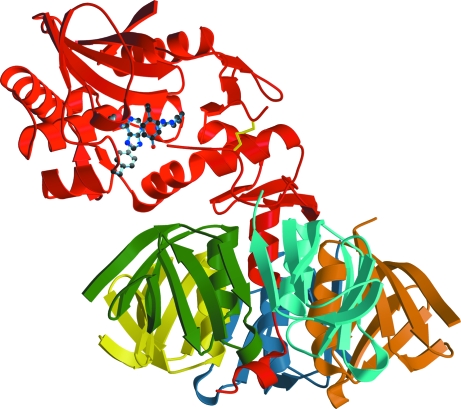
Although Stx2 is able to cleave adenine from a small substrate, the holotoxin is unlikely to bind to the stem-loop structure of 28S rRNA. Fig. 4 ▶ shows a ribbon diagram of the holotoxin. Adenine and the side chains of the residues with which it interacts are also displayed to show the location of the active site in the holotoxin, especially in relation to the B pentamer. Although the active site is accessible to small substrates such as adenosine, the stem-loop structure from which A1 cleaves the adenine could not approach the active site without unfolding of the rRNA. Thus, we would expect Stx2 to be inactive against rRNA until A1 is released.
Figure 4.
Stx2 with adenine in the active site. The holotoxin is shown as a ribbon diagram. Adenine and the side chains of residues of the A subunit with which it interacts are represented by ball-and-stick models coloured according to atom type as in Fig. 1 ▶. The A ubunit is in red and the five B subunits are orange, cyan, green, yellow and blue (chains B–E). The two cysteine residues forming the disulfide bond between A1 and A2 are shown by yellow bonds.
Supplementary Material
PDB reference: Stx2, 2ga4, r2ga4sf
Acknowledgments
X-ray diffraction data were collected at beamline 8.3.1 of the Advanced Light Source (ALS) at Lawrence Berkeley Laboratory under an agreement with the Alberta Synchrotron Institute (ASI). The ALS is operated by the Department of Energy and supported by the National Institutes of Health. Beamline 8.3.1 was funded by the National Science Foundation, the University of California and Henry Wheeler. The ASI synchrotron-access program is supported by grants from the Alberta Science and Research Authority (ASRA), the Alberta Heritage Foundation for Medical Research (AHFMR) and Western Economic Diversification (WED). MNGJ is grateful for the award of a Canada Research Chair (Tier 1). This research was supported by the Natural Sciences and Engineering Research Council of Canada (MEF), the Canadian Institutes of Health Research (MNGJ, GDA) and AHFMR (MEF and MNGJ). PM was supported by doctoral scholarships from the Canadian Institutes of Health Research and AHFMR.
References
- Berman, H. M., Westbrook, J., Feng, Z., Gilliland, G., Bhat, T. N., Weissig, H., Shindyalov, I. N. & Bourne, P. E. (2000). Nucleic Acids Res.28, 235–242. [DOI] [PMC free article] [PubMed] [Google Scholar]
- Brünger, A. T., Adams, P. D., Clore, G. M., DeLano, W. L., Gros, P., Grosse-Kunstleve, R. W., Jiang, J.-S., Kuszewski, J., Jilges, N., Pannu, N. S., Read, R. J., Rice, L. M., Simonson, T. & Warren, G. L. (1998). Acta Cryst. D54, 905–921. [DOI] [PubMed] [Google Scholar]
- Collaborative Computational Project, Number 4 (1994). Acta Cryst. D50, 760–763. [Google Scholar]
- Endo, Y., Tsurugi, K., Yutsudo, T., Takeda, Y., Ogasawara, T. & Igarashi, K. (1988). Eur. J. Biochem.171, 45–50. [DOI] [PubMed] [Google Scholar]
- Fraser, M. E., Chernaia, M. M., Kozlov, Y. V. & James, M. N. (1994). Nature Struct. Biol.1, 59–64. [DOI] [PubMed] [Google Scholar]
- Fraser, M. E., Fujinaga, M., Cherney, M. M., Melton-Celsa, A. R., Twiddy, E. M., O’Brien, A. D. & James, M. N. G. (2004). J. Biol. Chem.279, 27511–27517. [DOI] [PubMed] [Google Scholar]
- Gu, Y.-J. & Xia, Z.-X. (2000). Proteins, 39, 37–46. [PubMed] [Google Scholar]
- Hooft, R. W. W., Vriend, G., Sander, C. & Abola, E. E. (1996). Nature (London), 381, 272. [DOI] [PubMed] [Google Scholar]
- Huang, Q., Liu, S., Tang, Y., Jin, S. & Wang, Y. (1995). Biochem. J.309, 285–298. [PMC free article] [PubMed] [Google Scholar]
- Jacewicz, M., Clausen, H., Nudelman, E., Donohue-Rolfe, A. & Keusch, G. T. (1986). J. Exp. Med.163, 1391–1404. [DOI] [PMC free article] [PubMed] [Google Scholar]
- Konowalchuk, J., Speirs, J. I. & Stavric, S. (1977). Infect. Immun.18, 775–779. [DOI] [PMC free article] [PubMed] [Google Scholar]
- Kraulis, P. J. (1991). J. Appl. Cryst.24, 946–950. [Google Scholar]
- Krauspenhaar, R., Rypniewski, W., Kalkura, N., Moore, K., DeLucas, L., Stoeva, S., Mikhailov, A., Voelter, W. & Betzel, C. (2002). Acta Cryst. D58, 1704–1707. [DOI] [PubMed] [Google Scholar]
- Kurinov, I. V., Myers, D. E., Irvin, J. D. & Uckun, F. M. (1999). Protein Sci.8, 1765–1772. [DOI] [PMC free article] [PubMed] [Google Scholar]
- Kurinov, I. V., Rajamohan, F. & Uckun, F. M. (2004). Arzneimittelforschung, 54, 692–702. [DOI] [PubMed] [Google Scholar]
- Laskowski, R. A., MacArthur, M. W., Moss, D. S. & Thornton, J. M. (1993). J. Appl. Cryst.26, 283–291. [Google Scholar]
- McRee, D. E. (1999). J. Struct. Biol.125, 156–165. [DOI] [PubMed] [Google Scholar]
- Merritt, E. A. & Bacon, D. J. (1997). Methods Enzymol.277, 505–524. [DOI] [PubMed]
- Mulvey, G., Vanmaele, R., Mrazek, M., Cahill, M. & Armstrong, G. D. (1998). J. Microbiol. Methods, 32, 247–252.
- Newland, J. W., Strockbine, N. A., Miller, S. F., O’Brien, A. D. & Holmes, R. K. (1985). Science, 230, 179–181. [DOI] [PubMed] [Google Scholar]
- Olsnes, S., Reisbig, R. & Eiklid, K. (1981). J. Biol. Chem.256, 8732–8738. [PubMed] [Google Scholar]
- Otwinowski, Z. & Minor, W. (1997). Methods Enzymol.276, 307–326. [DOI] [PubMed]
- Ren, J., Wang, Y., Dong, Y. & Stuart, D. I. (1994). Structure, 2, 7–16. [DOI] [PubMed] [Google Scholar]
- Sandvig, K. & van Deurs, B. (2002). FEBS Lett.529, 49–53. [DOI] [PubMed] [Google Scholar]
- Siegler, R. L., Obrig, T. G., Pysher, T. J., Tesh, V. L., Denkers, N. D. & Taylor, F. B. (2003). Pediatr. Nephrol.18, 92–96. [DOI] [PubMed] [Google Scholar]
- Stein, P. E., Boodhoo, A., Tyrrell, G. J., Brunton, J. L. & Read, R. J. (1992). Nature (London), 355, 748–750. [DOI] [PubMed] [Google Scholar]
- Wallace, A. C., Laskowski, R. A. & Thornton, J. M. (1995). Protein Eng.8, 127–134. [DOI] [PubMed] [Google Scholar]
- Weston, S. A., Tucker, A. D., Thatcher, D. R., Derbyshire, D. J. & Pauptit, R. A. (1994). J. Mol. Biol.244, 410–422. [DOI] [PubMed] [Google Scholar]
Associated Data
This section collects any data citations, data availability statements, or supplementary materials included in this article.
Supplementary Materials
PDB reference: Stx2, 2ga4, r2ga4sf


