Abstract
Context: The pulsatility of GH secretion in acromegaly poses difficulty in ascertaining true daily GH milieu in patients with this disease. Intensive GH sampling [every 10–20 (Q10–20) min for 24 h] is not practical in clinical practice.
Objective: Our objective was to ascertain reliability of abbreviated sampling protocols to reflect true 24-h mean GH concentrations in patients with acromegaly.
Design: An analysis of previously obtained plasma GH profiles was performed.
Setting: The analysis was performed at the General Clinical Research Center at the University of Michigan.
Patients: A total of 115 GH profiles obtained in 94 patients with active acromegaly were examined.
Intervention: Frequent blood sampling, i.e. Q10–20 min for 24 h, was performed.
Main Outcome Measures: Concordance of 24-h mean GH concentrations derived from Q10- to 20-min samplings with abbreviated GH sampling schedules was performed. The study was planned after data collection.
Results: All abbreviated schedules of GH sampling correlated well with the true 24-h plasma GH means (i.e. Q10- to 20-min sampling) (R = 0.93–0.98; P < 0.0001 for all). In the GH range more than 20 μg/liter, only 5 and 9-h means had R values more than 0.9. Single GH concentrations less than 1 μg/liter had a positive predictive value of only 0.29, and those with less than 2.5 μg/liter had a positive predictive value of 0.67 vs. their corresponding 24-h mean GH values of the same magnitude.
Conclusions: The intensity of GH sampling in patients with acromegaly may vary depending on the nature of the required information. Investigators and clinicians should be aware of the limitations of the abbreviated GH sampling protocols in acromegaly.
Methods to measure the degree of GH hypersecretion in acromegaly patients are controversial. This study discusses the limitations of abbreviated GH sampling for these patients.
Acromegaly is a disease of GH hypersecretion, although most of its clinical manifestations are mediated by elevated IGF-I concentrations (1). Currently, the measurement of plasma IGF-I constitutes the gold standard in the diagnosis and surveillance of acromegaly (2), despite known technical problems with IGF-I measurement, marked dependence of the “normal range” on age and sex of the subject, and interfering effects of estrogens, nutrition, and liver diseases (3). Nevertheless, it is the best indicator of disease activity when the GH levels are relatively low (4). However, when plasma concentrations of GH exceed 20 μg/liter, plasma IGF-I concentrations reach a plateau and do not change appreciably in parallel with further GH increases (5). As a consequence, even major declines in GH output by the tumor (due to medications, surgery, or radiation) may not be reflected in plasma IGF-I concentrations. Thus, it would be highly desirable to be able to assess accurately the prevailing high GH milieu in patients with active acromegaly.
However, the highly pulsatile nature of GH secretion in this disease appears to require multiple hormone measurements throughout the day because it is believed that a single random GH sample does not reflect the prevailing daily hormonal output (6). On the other hand, epidemiological studies that used a single GH measurement advanced the idea of a “safe GH level,” i.e. plasma GH level below which the mortality rate approaches that of a normal population and which, therefore, justifies cessation of further therapies (7,8). This level was estimated as being less than 2.5 μg/liter. Thus, there is an inherent contradiction in our approach. On the one hand, we believe that a single GH measurement has no diagnostic value, but on the other hand, we base major therapeutic decisions on the same single GH measurement. Some centers developed protocols of calculating prevailing GH milieu from several samples, i.e. taken every 30 min for 2 h (9), every hour for 3 or 8 h (10,11), five samples taken 1 or 2 h apart etc. (12), but their relative reliabilities were never formally tested. The purpose of the present study was to examine how reliably such protocols reflect 24-h GH output in acromegaly.
Subjects and Methods
We analyzed 115 24-h GH profiles of 94 patients with active acromegaly, who were studied at the University of Michigan Medical Center over the years and participated in multiple research protocols, the results of which were reported previously. Among those were 16 acromegalic patients with elevated IGF-I, but 24-h mean GH less than 2.5 μg/liter (4). All patients had active disease as witnessed by clinical symptomatology, the presence of pituitary tumor on computed tomography or magnetic resonance imaging studies, and elevated plasma IGF-I concentrations. Seven patients had previous noncurative surgery, and two of them also had a history of pituitary irradiation. The remaining 87 patients were newly diagnosed and untreated. Of the entire group, two patients refused surgery, and one was deemed unsuitable for general anesthesia; all three had macroadenomas (>1 cm) on pituitary magnetic resonance imaging. In the remaining 91 patients, histological and immunochemical confirmation of a GH-producing pituitary adenoma was obtained. No patients were treated with dopamine agonists or somatostatin analogs when the GH sampling was performed.
Blood samples for plasma GH measurement were drawn for 24 h every 10 (Q10) min in 103 profiles or every 20 (Q20) min in 12 profiles. The 24-h mean plasma GH concentrations were calculated from all samples taken during the 24-h period.
Plasma GH was measured by a chemiluminescent assay (Nichols, San Juan Capistrano, CA) with assay sensitivity of 0.01 μg/liter in 72 profiles and by RIA (13) with the calculated assay sensitivity of 0.4 μg/liter in 43 profiles. We have previously reported that there were no significant differences between the RIA vs. chemiluminescent method in estimating mean 24-h GH concentration (14). All of the individual and the 24-h GH means in the RIA series were above 2.5 μg/liter.
Analyses were performed by Microsoft Excel 2003 and Statistica version 7.1 (StatSoft Inc., Tulsa, OK). Mean GH in the 2-, 5-, and 9-h series was calculated as the average value of 3, 6, or 10 samples collected at 1-h intervals starting at 0800 h, respectively. Pearson’s correlation test was used to compare 24-h mean GH to 0800-h single value, and 2-, 5-, and 9-h mean of GH plasma concentration. When calculating concordance between the data from other models with 24-h GH mean, 95% confidence intervals of proportion were estimated, as described by Newcombe (15). We also performed an Altman-Bland analysis (16) to quantify agreements between the standard (S) 24-h mean derived from Q20 or Q10-min samples and tested (T) sampling paradigm. This involves plotting a difference of measured values vs. an average of the same values [0.5 (T + S) vs. (T − S)]. These calculations were performed on log-transformed data as recommended (16). Rather than assigning statistical measure of significance, 95% confidence intervals are presented. They should be understood as follows: within a sample where the “tested” method gave a certain value, 95% would have a value according to the “standard” test within the specified interval. Data are shown as mean ± se, where relevant. P value less than 0.05 was considered statistically significant.
Results
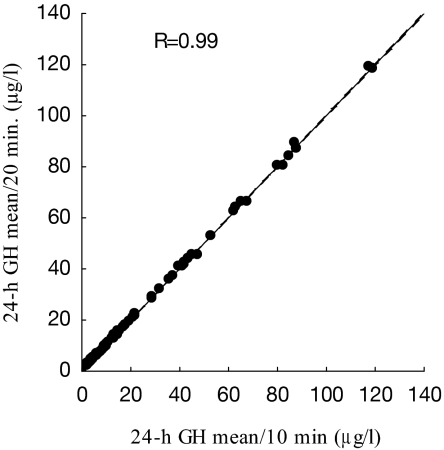
To examine the equivalency of estimating mean 24-h GH concentrations using Q10- or Q20-min series, a regression analysis, including only Q10-min profiles (n = 103), was performed. For each profile, a Q10- and Q20-min (every other sample) 24-h mean was calculated (Fig. 1). There was an excellent correlation (R = 0.99; P < 0.0001) between the two values, and this justified the inclusion of the 12 Q20-min profiles into the overall analysis.
Figure 1.
Correlation between 24-h GH means using Q10 and Q20-min protocols. A total of 103 Q10-min GH series was analyzed using every or every other GH sample.
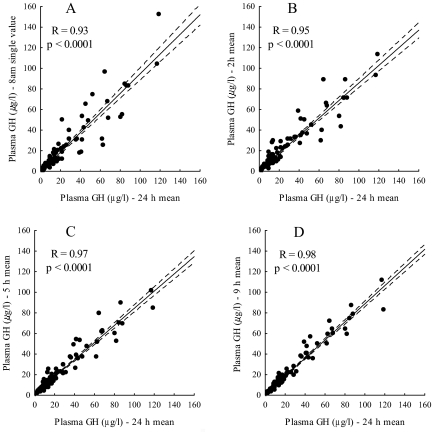
Subsequently, we performed correlation analyses comparing mean 24-h GH with a single 0800-h GH value or the means of 2-, 5-, and 9-h hourly GH samplings (Fig. 2). In all series, excellent correlations were found (R = 0.93–0.98; P < 0.0001 for all). The analyses for all abbreviated sampling schedules were repeated using only GH values above 20 μg/liter (data not shown). The 0800-h GH values in this range correlated well with the corresponding 24-h mean GH concentrations (R = 0.84; P < 0.001), and the correlations improved further with more intensive sampling schedules: R = 0.85 for the 2-h mean; 0.91 for the 5-h mean; and 0.94 for the 9-h mean (P < 0.001 for all).
Figure 2.
Correlations between 24-h GH mean and single 0800-h GH value (A), 2-h GH mean from three samples (B), 5-h GH mean from six samples (C), and 9-h GH mean from 10 samples (D).
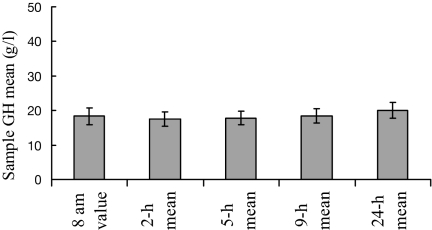
For all listed paradigms, the mean GH concentration calculated for the entire group of 115 series was between 17.5 ± 2.1 μg/liter and 19.9 ± 2.3 μg/liter (P > 0.5) (Fig. 3).
Figure 3.
Sample GH mean using a single 0800-h value or 2-, 5-, 9-, and 24-h means. Whiskers denote se.
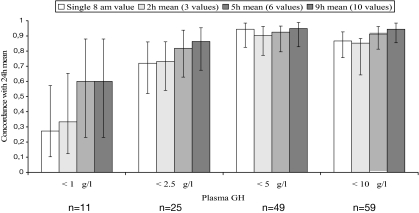
To assess how faithfully the abbreviated GH sampling models reflect the “safe GH concentration,” we examined Q10/Q20 GH profiles within the 0800- to 1700-h interval. This interval was chosen as being the customary time span when the patients attend their physicians’ offices and when the blood samples are likely to be drawn. All profiles were inspected for the presence of even a single GH sample with concentrations less than 1, less than 2.5, less than 5, and less than 10 μg/liter, and concordance with their 24-h GH means of the same magnitudes was calculated. Of the 11 profiles with a single GH value less than 1 μg/liter, only three (27%) had a 24-h mean less than 1 μg/liter, and only three of nine (33%) mean 2-h GH concentrations corresponded to a similar 24-h mean GH. Even 5- or 9-h sampling models were no more than 60% concordant with the true 24-h mean GH concentration. Of 25 profiles with at least a single GH value less than 2.5 μg/liter, 18 (72%) had a 24-h mean less than 2.5 μg/liter, and the estimate was accurate in 81% using a 5-h mean, and in 86% using a 9-h mean. In the 5 and 10 μg/liter series, the concordance in all GH sampling models was in excess of 80% (Fig. 4).
Figure 4.
Concordance between a single 0800-h GH value, and 2-, 5-, and 9-h GH means, and their appropriate 24-h GH means. Whiskers denote 95% confidence intervals in the intervals of proportions.
Altman-Bland analysis
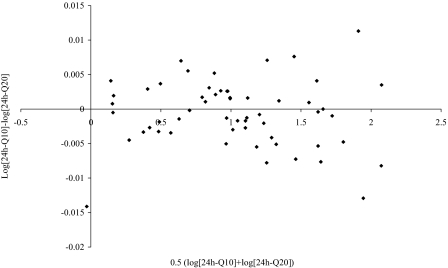
As a control, we compared the performance of Q20 vs. Q10-min 24-h mean GH values (Fig. 5). The mean ratio was 1.0, and the 95% confidence interval was very narrow (0.97–1.02 in ratio). This indicates that both methods give virtually identical results.
Figure 5.
Altman-Bland analysis of comparison between the Q20- and Q10-min 24-h mean GH concentrations.
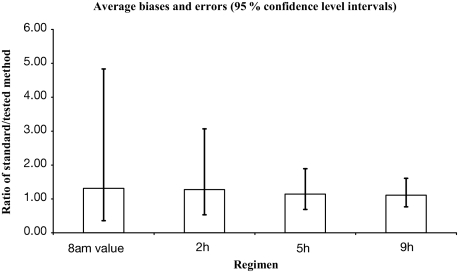
The same analysis was performed on other sampling paradigms (0800-h single value, and 2-, 5-, and 9-h mean), and these were compared with the “standard” 24-h GH mean obtained by Q20 or Q10-min sampling, respectively (Fig. 6). Numerical values of these comparisons are shown in Table 1.
Figure 6.
Summary of the Altman-Bland analysis of comparison between different sampling paradigms and “true” 24-h mean GH derived from Q20 or Q10-min samplings. Whiskers denote 95% confidence intervals.
Table 1.
Average biases and errors [95% confidence intervals (CIs)] for different sampling paradigms based on Altman-Bland analysis
| Mean ratio | Low (95% CI) | High (95% CI) | |
|---|---|---|---|
| 0800-h single | 1.31 | 0.36 | 4.84 |
| 2-h mean | 1.27 | 0.53 | 3.07 |
| 5-h mean | 1.14 | 0.69 | 1.89 |
| 9-h mean | 1.11 | 0.77 | 1.69 |
Average biases and errors (95% confidence intervals) for different sampling paradigms (Fig. 6).
Thus, for example, if in a given patient, the 0800-h GH concentration is 2 μg/liter, the mean 24-h GH concentration in this patient would be somewhere between 0.36 and 4.84 times it, i.e. between 0.72 and 9.5 μg/liter.
Because only low GH values (<1 and < 2.5 μg/liter) are used for therapeutic decisions to proclaim the so-called “safe GH level,” we calculated positive and negative predictive values (NPVs) for the samples with these concentrations (Table 2).
Table 2.
Predictive values of low GH concentrations obtained with different sampling paradigms
| PPV | NPV | |
|---|---|---|
| <1 μg/liter | ||
| 0800-h single value | 0.29 | 1 |
| 2-h mean | 0.33 | 1 |
| 5-h mean | 0.6 | 1 |
| 9-h mean | 0.6 | 1 |
| <2.5 μg/liter | ||
| 0800-h single value | 0.67 | 0.97 |
| 2-h mean | 0.73 | 0.98 |
| 5-h mean | 0.83 | 0.98 |
| 9-h mean | 0.87 | 0.99 |
Discussion
The best practical method to assess GH hypersecretion in acromegaly is still a controversial issue. Due to the highly pulsatile nature of GH secretion in this disease, a single, random GH value is believed not to be reflective of the prevailing daily GH milieu (6). Research studies have used 24-h long frequent (Q5–20 min) blood sampling paradigms in patients with acromegaly (17,18), and this approach is likely to be the best one to estimate total daily GH output. However, it is expensive and labor intensive; thus, it is not suitable for routine clinical studies. Therefore, many groups use abbreviated sampling schedules to construct a “daily GH curve” in an attempt to obtain a more precise estimate of prevailing GH levels (9,10,11,12). The relative performance of such sampling schedules was not rigorously ascertained. This issue acquired a particular importance after the demonstration of the dependence of mortality rates in patients with acromegaly on their prevailing GH levels (19). It has been shown that a single plasma GH less than 2.5 μg/liter and, certainly, less than1 μg/liter reduced the mortality rates to those observed in a normal population (19,20). Thus, achievement of the posttreament plasma GH less than 2.5 μg/liter was proposed to be the evidence of a “functional control,” i.e. a state that no longer threatens patient’s survival and, therefore, does not require additional efforts to reduce plasma GH further (7).
Several problems exist with these epidemiological studies. First, they are all based on a single random GH measurement that is, paradoxically, viewed as unreliable for the establishment or exclusion of the diagnosis of active disease (1). Second, due to the necessity of a long-term follow-up to assess mortality rates, data obtained with the use of old RIAs were used in the analysis. However, even in the most rigorously controlled RIAs, with stated assay sensitivity less than 1 μg/liter, the intraassay and interassay variability rates are high, usually in the 20–30% range, when the hormone concentrations are low (21). Thus, for all practical purposes, RIAs do not allow to differentiate reliably between GH concentrations in the range below approximately 2 μg/liter. There are no epidemiological studies of mortality in acromegaly using modern, sensitive immunoradiometric assays or immunochemiluminometric assay (ICMAs). Third, active acromegaly may occur in patients whose GH concentrations (measured Q10 min for 24 h and using sensitive ICMA) are well less than 2.5 μg/liter, and who, nevertheless, have high IGF-I concentrations and exhibit a full spectrum of disease symptoms (4). The mortality defining role of elevated IGF-I was contradictory in several studies, perhaps due to the insufficiently long follow-up and limited study populations (22,23,24,25,26). Fourth, even though the average mortality ratios in patients with plasma GH less than 1 or less than 2 μg/liter were not statistically different from the normal population, the confidence limits were wide. In the less than 2 μg/liter group, they were 0.9–3.0, and the average mortality ratio was approximately 1.7 (20). Likely, only the relatively small number of patients in this group prevented the demonstration of a significant increase in the mortality rate.
In this study we report the results of a rigorous analysis of a large group of patients with active acromegaly whose GH was sampled frequently and over a day-long interval. This permitted us to assess reliably the performance of several abbreviated sampling paradigms vs. that of a mean daily GH concentration derived from frequent (Q10–20 min) sampling. Importantly, all series with individual and mean GH concentrations below 2.5 μg/liter were analyzed by a modern, sensitive ICMA. Thus, even the values well below 1 μg/liter are fully reliable.
Our analysis provided a set of rather unexpected results. First, although there were discrepancies in individual patients, the correlations between the true (Q10/Q20 min) mean daily GH concentrations and those obtained with the use of less intensive sampling models were all excellent, with the R values in excess of 0.9. Even single random GH values were well correlated with the true 24-h GH milieu. This confirms the finding of good correlations found between a single GH measurement and a mean GH calculated from five samples at predetermined times, as described by Taboada et al. (27) and Kaltsas et al. (28). Thus, in a large group analysis, when only an overall GH concentration is of interest, there is no real need to construct a “daily GH curve” using 5- or 9-h sampling. A single GH value or, certainly, a mean of three samples taken at hourly intervals in each study participant would be sufficient to represent the prevailing GH daily concentration in the entire group. Indeed, the mean GH concentration of the entire group of patients in this study was equally well described, even when a single GH sample per patient was taken. Therefore, the “one-sample” strategy may be applicable to large-scale treatment trials assessing overall efficacy of GH-lowering therapies, such as surgery, radiation, or somatostatin analogs. This may significantly decrease the patient’s discomfort, time commitment, involvement of ancillary medical personnel, and the expense of multiple hormone measurements.
Another implication of our data relates to the monitoring of therapy in individual patients. As was stated earlier, plasma IGF-I may poorly reflect a partial success of therapeutic interventions because it reaches a plateau at GH concentrations above approximately 20 μg/liter (5). To this end, we analyzed performances of abbreviated GH sampling schedules in the range more than 20 μg/liter. Although a single 0800-h or a mean 2-h GH concentration correlated well with their respective 24-h means, it is obvious from Fig. 2 that there still were major deviations from the regression line, with 2- to 3-fold differences in many patients. Thus, for example, to assert a decline of GH from, say, 60 to 30 μg/liter in an individual patient with a higher degree of confidence, one would be advised to use more intensive GH sampling schedules i.e. 5-h or, preferably, 9-h models. Using this approach, one would be able to document partial efficacy of therapeutic interventions that would not be apparent from IGF-I measurements.
On the other hand, our results cast doubt on the validity of the current recommendation to regard a single, random GH value less than 2.5 μg/liter as being “safe” (7) and on the utility of abbreviated GH sampling paradigms to ascertain true prevailing GH milieu in individual patients.
The Altman-Bland analysis is a statistical method to assess agreements of different methods of clinical measurements (16). Based on this method, a 95% confidence interval for a given single 0800-h GH concentration is between 0.36 and 4.84 times that value, and even the 9-h mean GH has a 95% confidence interval between 0.77 and 1.60 times the measured GH concentration. Thus, one should be very cautious of accepting abbreviated GH sampling paradigms as faithful reflections of the true mean 24-h GH concentrations in individual patients. Because only “low” GH concentrations (< 1 or 2.5 μg/liter) are used in making therapeutic decisions of proclaiming “safety” of the prevailing GH milieu and stopping any further GH-lowering therapy (7), we calculated predictive values for these GH concentrations obtained with the use of abbreviated sampling paradigms. The NPVs for both concentrations and for all sampling methods were excellent, close to or equal to one. Thus, even a single GH value above 2.5 μg/liter strongly indicates that the corresponding 24-h mean GH is also above 2.5 μg/liter, and that additional therapeutic interventions are in order. However, the decision not to treat the patient would depend on the positive predictive values (PPVs), i.e. that a single or several GH measurements less than 2.5 μg/liter truly mean that the 24-h mean GH is, indeed, less than 2.5 μg/liter. Unfortunately, the PPVs for all methods are rather low at low GH concentrations. A single 0800-h GH less than 2.5 μg/liter has a PPV of only 0.67, meaning that there is a 33% chance that the true 24-h GH concentration is above that value. The PPV for a single GH less than 1 μg/liter is only 0.29, with a 71% chance that the true 24-h GH is above 1 μg/liter. This explains the higher than normal average mortality rates in patients whose prevailing GH milieu was assessed with the use of a single GH measurement (25). Whether to use 5- or 9-h mean GH concentrations is a decision that every physician would have to reach individually, by examining the patient’s symptomatology and assessing comorbidities. However, it is important to realize that the mean GH less than 1 μg/liter obtained with these methods had only 60% PPV, and that the mean GH less than 2.5 μg/liter has only 83–87% PPV. Because a full spectrum of acromegalic morbidities (somatic growth, arthropathy, sweating, sleep apnea, etc.) may be present in patients with plasma GH less than 2.5 μg/liter in the presence of elevated plasma IGF-I concentrations (4), we doubt that a simple decrease in GH below that level, especially if based on a single sample, may constitute a valid reason to pronounce the patient “functionally controlled” and stop further therapies.
In summary, our results provide objective estimates of the performance of abbreviated GH sampling protocols to assess GH overall milieu in patients with acromegaly in clinical setting, in research protocols, and in epidemiological studies. They can assist physicians to select economical, yet reliable, sampling schedules to answer specific questions of interest.
Footnotes
This work was supported by the National Institutes of Health Grant RO-1 DK071955 and by the Department of Veterans’ Affairs Medical Research Service. K.B.-S. was on leave from the Department of Endocrinology, University of Ljubljana, Slovenia.
Disclosure Statement: The authors have nothing to disclose.
First Published Online November 20, 2007
Abbreviations: ICMA, Immunochemiluminometric assay; NPV, negative predictive value; PPV, positive predictive value; Q10, every 10; Q20, every 20.
References
- Melmed S 2006 Medical progress: acromegaly. N Engl J Med 355:2558–2573 [DOI] [PubMed] [Google Scholar]
- Melmed S, Casanueva FF, Cavagnini F, Chanson P, Frohman L, Grossman A, Ho K, Kleinberg D, Lamberts S, Laws E, Lombardi G, Vance ML, Werder KV, Wass J, Giustina A, Acromegaly Treatment Consensus Workshop Participants 2002 Guidelines for acromegaly management. J Clin Endocrinol Metab 87:4054–4058 [DOI] [PubMed] [Google Scholar]
- Clemmons DR 2006 Clinical utility of measurements of insulin-like growth factor 1. Nat Clin Pract Endocrinol Metab 2:436–446 [DOI] [PubMed] [Google Scholar]
- Dimaraki EV, Jaffe CA, DeMott-Friberg R, Chandler WF, Barkan AL 2002 Acromegaly with apparently normal GH secretion: implications for diagnosis and follow-up. J Clin Endocrinol Metab 87:3537–3542 [DOI] [PubMed] [Google Scholar]
- Barkan AL, Beitins IZ, Kelch RP 1988 Plasma insulin-like growth factor-I/somatomedin-C in acromegaly: correlation with the degree of growth hormone hypersecretion. J Clin Endocrinol Metab 67:69–73 [DOI] [PubMed] [Google Scholar]
- Hartman ML, Veldhuis JD, Vance ML, Faria AC, Furlanetto RW, Thorner MO 1990 Somatotropin pulse frequency and basal concentrations are increased in acromegaly and are reduced by successful therapy. J Clin Endocrinol Metab 70:1375–1384 [DOI] [PubMed] [Google Scholar]
- Stewart PM 2000 Current therapy for acromegaly. Trends Endocrinol Metab 11:128–132 [DOI] [PubMed] [Google Scholar]
- Sheppard MC 2005 GH and mortality in acromegaly. J Endocrinol Invest 28(Suppl 11):75–77 [PubMed] [Google Scholar]
- Grottoli S, Celleno R, Gasco V, Pivonello R, Caramella D, Barreca A, Ragazzoni F, Pigliaru F, Alberti D, Ferrara R, Angeletti G 2005 Efficacy and safety of 48 weeks of treatment with octreotide LAR in newly diagnosed acromegalic patients with macroadenomas: an open-label, multicenter, non-comparative study. J Endocrinol Invest 28:978–983 [DOI] [PubMed] [Google Scholar]
- Cozzi R, Montini M, Attanasio R, Albizzi M, Lasio G, Lodrini S, Doneda P, Cortesi L, Pagani G 2006 Primary treatment of acromegaly with octreotide LAR: a long term (up to nine years) prospective study of its efficacy in the control of disease activity and tumor shrinkage. J Clin Endocrinol Metab 91:1397–1403 [DOI] [PubMed] [Google Scholar]
- Conceicao FL, Fisker S, Christiansen JS, Astrup J, Weeke J, Jorgensen JO 2003 Biochemical definitions of disease activity in acromegaly. Growth Horm IGF Res 13:98–103 [DOI] [PubMed] [Google Scholar]
- De P, Rees DA, Davies N, John R, Neal J, Mills RG, Vafidis J, Davies JS, Scanlon MF 2003 Transsphenoidal surgery for acromegaly in Wales: results based on stringent criteria of remission. J Clin Endocrinol Metab 88:3567–3572 [DOI] [PubMed] [Google Scholar]
- Barkan AL, Kelch RP, Hopwood NJ, Beitins IZ 1988 Treatment of acromegaly with the long-acting somatostatin analog SMS 201–995. J Clin Endocrinol Metab 66:16–23 [DOI] [PubMed] [Google Scholar]
- Ho PJ, Jaffe CA, Friberg RD, Chandler WF, Barkan AL 1994 Persistence of rapid growth hormone (GH) pulsatility after successful removal of GH-producing pituitary tumors. J Clin Endocrinol Metab 78:1403–1409 [DOI] [PubMed] [Google Scholar]
- Newcombe RG 1998 Two-sided confidence intervals for the single proportion: comparison of seven methods. Stat Med 17:857–872 [DOI] [PubMed] [Google Scholar]
- Altman DG, Bland JM 1983 Measurement in medicine: the analysis of method comparison studies. Statistician 32:307–317 [Google Scholar]
- Bercu BB, Shulman D, Root AW, Spiliotis BE 1986 Growth hormone (GH) provocative testing frequently does not reflect endogenous GH secretion. J Clin Endocrinol Metab 63:709–716 [DOI] [PubMed] [Google Scholar]
- Ho KY, Evans WS, Blizzard RM, Veldhuis JD, Merriam GR, Samojlik E, Furlanetto R, Rogol AD, Kaiser DL, Thorner MO 1987 Effects of sex and age on the 24-k profile of growth hormone secretion in man: importance of endogenous estradiol concentrations. J Clin Endocrinol Metab 64:51–58 [DOI] [PubMed] [Google Scholar]
- Holdaway IM, Rajasoorya C 1999 Epidemiology of acromegaly. Pituitary 2:29–41 [DOI] [PubMed] [Google Scholar]
- Holdaway IM, Rajasoorya CR, Gamble GD, AW Stewart 2003 Long term treatment outcome in acromegaly. Growth Horm IGF Res 13:185–192 [DOI] [PubMed] [Google Scholar]
- Ho PJ, Friberg RD, Barkan AL 1992 Regulation of pulsatile growth hormone secretion by fasting in normal subjects and patients with acromegaly. J Clin Endocrinol Metab 75:812–819 [DOI] [PubMed] [Google Scholar]
- Swearingen B, Barker 2nd FG, Katznelson L, Biller BMK, Grinspoon S, Klibanski A, Moayeri N, Black P, Zervas NT 1998 Long-term mortality after transsphenoidal surgery and adjunctive therapy for acromegaly. J Clin Endocrinol Metab 83:3419–3426 [DOI] [PubMed] [Google Scholar]
- Beauregard C, Truong U, Hardy J, Serri O 2003 Long term outcome and mortality after transsphenoidal adenomectomy for acromegaly. Clin Endocrinol (Oxf) 58:86–91 [DOI] [PubMed] [Google Scholar]
- Biermasz NR, Dekker FW, Pereira AM, van Thiel SW, Schutte PJ, van Dulken H, Romijn JA, Roelfsema F 2004 Determinants of survival in treated acromegaly in a single center: predictive value of serial insulin-like growth factor 1 measurements. J Clin Endocrinol Metab 89:2789–2796 [DOI] [PubMed] [Google Scholar]
- Holdaway IM, Rajasoorya RC, Gamble GD 2004 Factors influencing mortality in acromegaly. J Clin Endocrinol Metab 89:667–674 [DOI] [PubMed] [Google Scholar]
- Kauppinen-Makelin R, Sane T, Reunanen A, Valimaki MJ, Niskanen L, Markkanen H, Loyttyniemi E, Ebeling T, Jaatinen P, Laine H, Nuutila P, Salmela P, Salmi J, Stenman UH, Viikari J, Voutilainen E 2005 A nationwide survey of mortality in acromegaly. J Clin Endocrinol Metab 90:4081–4086 [DOI] [PubMed] [Google Scholar]
- Taboada GF, Correa LL, de Oliveira Machado E, van Haute FR, Casini AF, Balarini GA, Neto LV, Calixto L, Calixto C, Gadelha MR 2007 Two hour mean GH is not superior to basal GH for the follow-up of acromegalic patients treated with Octreotide LAR. Growth Horm IGF Res 17:77–81 [DOI] [PubMed] [Google Scholar]
- Kaltsas GA, Isidori AM, Florakis D, Trainer PJ, Camacho-Hubner C, Afshar F, Sabin I, Jenkins JP, Chew SL, Monson JP, Besser GM, Grossman AB 2001 Predictors of the outcome of surgical treatment in acromegaly and the value of the mean growth hormone day curve in assessing postoperative disease activity. J Clin Endocrinol Metab 86:1645–1652 [DOI] [PubMed] [Google Scholar]


