

Summary
The Rb/E2F pathway regulates the expression of genes essential for cell proliferation but that also trigger apoptosis. During normal proliferation, PI3K/Akt signaling blocks E2F1 induced apoptosis, thus serving to balance proliferation and death. We now identify a subset of E2F1 target genes that are specifically repressed by PI3K/Akt signaling, thus distinguishing the E2F1 proliferative or apoptotic function. RNAi-mediated inhibition of several of these PI3K-repressed E2F1 target genes, including AMPKα2, impairs apoptotic induction by E2F1. Activation of AMPKα2 with an AMP analog further stimulates E2F1 induced apoptosis. We also show that the presence of the E2F1 apoptotic expression program in breast and ovarian tumors coincides with good prognosis, emphasizing the importance of the balance in the E2F1 proliferation/apoptotic program.
Significance
E2F1 has been shown to induce both proliferation and apoptosis. We now show that PI3K/Akt signaling regulates the balance of these events by specifically blocking expression of genes in the E2F1 apoptotic program but not the proliferative program. We further show that an alteration in the balance of the E2F1 program coincides with poor prognosis in both breast and ovarian cancer emphasizing the importance of these events for a clinical cancer phenotype.
Introduction
The control of cellular proliferation, including the entry from quiescence (G0) into the cell cycle (G1) and passage into the DNA replication (S) phase is tightly regulated by cell size, mitogenic stimulation and absence of signals that block proliferation. The retinoblastoma (Rb) protein is now recognized as a pivotal regulator of entry into the cell cycle and is controlled by the activity of upstream cyclin-dependent kinases (CDKs) that are activated during the transition from G0 to G1. Importantly, disruption of various components of this control pathway leads to deregulated proliferation that underlies the development of many forms of human cancer (Bosco and Knudsen, 2007; Johnson and DeGregori, 2006).
Numerous studies have established that Rb control of E2F transcription factor function is crucial for its control of cell cycle progression and tumorigenesis. E2Fs comprise a family of eight transcription factors that can be classified into different groups based on domain conservation and transcriptional activity (Attwooll et al., 2004; DeGregori and Johnson, 2006). For example, E2F1, E2F2 and E2F3 are generally transcriptional activators of genes important for cell cycle progression and nucleotide synthesis like Cdc6, Cyclin E and dihydrofolate reductase. Other E2Fs, like E2F4, E2F5 and E2F6, generally function as repressors of E2F gene expression. The recently discovered E2F7 and E2F8 genes form a separate group with anti-proliferative function (Christensen et al., 2005; Logan et al., 2005; Maiti et al., 2005). The interaction of Rb inhibits E2F transcriptional activity, and hyper-phosphorylation of Rb by Cdks during cell cycle progression causes Rb to be released from E2F inhibition allowing transcriptional activation of cell cycle genes. Given the pervasive role of Rb pathway mutations and thus E2F1 deregulation in human cancer, understanding the mechanisms underlying distinct cellular outcomes by E2Fs is critical to developing increasingly focused anti-cancer therapeutics.
Additional work has pointed to a central role of the Rb/E2F pathway in balancing the cellular decision of proliferation and apoptosis, first highlighted through the analysis of DNA tumor virus oncoproteins (Ahuja et al., 2005; Berk, 2005; O’Shea, 2005). The inactivation of Rb function by viral proteins such as E1A, T antigen, and E7, that induces cells to enter S phase, also triggers p53-dependent apoptosis (de Stanchina et al., 1998). This apoptotic process is then blocked through the action of an additional set of viral proteins that inhibit p53 activity. Further work has highlighted the role of E2F proteins, particularly E2F1, in forming the link between the deregulation of Rb pathway activity and induction of p53-dependent apoptosis (DeGregori et al., 1997; Hallstrom and Nevins, 2005; Kowalik et al., 1998; Kowalik et al., 1995; Qin et al., 1994; Shan and Lee, 1994; Wu and Levine, 1994).
Given the fact that E2F1 does accumulate when cells are stimulated to grow and is required for the initial entry into the cell cycle, the capacity of E2F1 to induce apoptosis must be blocked in order for cells to complete a normal proliferative cycle. We have previously demonstrated that E2F1 induced apoptosis can be blocked by survival pathways induced following normal cell growth. Additional analysis delineated a role for PI3K and Akt signaling in the abrogation of E2F1 apoptosis induction (Hallstrom and Nevins, 2003). PI3K and Akt are widely involved in cellular apoptosis inhibition by phosphorylating and regulating the activity of apoptotic gene products such as BAD, Caspase-9, and Mdm2 (Cardone et al., 1998; Datta et al., 1997; del Peso et al., 1997). We have now further analyzed the ability of growth factor activated PI3K signaling to directly regulate E2F1 transcriptional output and apoptosis induction. We show here that a subset of previously unidentified E2F1 target genes is repressed by a serum-activated PI3K signaling pathway. This differs from the expression profile of classical cell-cycle E2F target genes, which are typically activated, not repressed, by mitogenic stimulation. Through shRNA-targeted degradation, we have identified a role for several of these PI3K-repressed E2F1 targets in apoptosis induction. One of these pro-apoptotic targets, AMPKα2, a sensor of cellular energy levels and a component of the PI3K signaling pathway, is induced by E2F1 under growth factor starvation but repressed during normal proliferation. Activation of AMPKα2 with AICAR, an AMP analog, further stimulates E2F1 induced apoptosis. Examination of E2F1 target gene levels in breast and ovarian tumors indicate that reduced expression of these targets is observed in patients that display significantly poorer survival outcomes.
Results
Identification of E2F1 target genes repressed by serum-activated PI3K signaling
Our previous work has demonstrated a role for serum activated PI3K and Akt signaling in abrogating the E2F1 triggered p53 induction and apoptotic response that normally occurs in cells deprived of growth factors (Figure 1A) (Hallstrom and Nevins, 2003). This is not simply an effect on E2F1 activity since there is no variation in the level of E2F1 protein as a function of serum or PI3K inhibition (Figure 1B). The anti-apoptotic effect of PI3K could at least partially be explained by post-translational modification of key apoptotic proteins mediated by Akt. Alternatively, growth factor activated PI3K signaling may also repress activation of E2F1 apoptotic target genes. We explored this possibility using DNA microarray analysis of quiescent REF52 rat fibroblasts that had been infected with control or E2F1 adenovirus in the presence or absence or 10% serum or LY294002, a PI3K inhibitor. Analysis was done in duplicate to reduce the background that would arise from using a single data point.
Figure 1. Identification of E2F1 target genes repressed by serum activated PI3K signaling.

A. Our previous studies have identified a role for PI3K signaling in blocking E2F1-induced apoptosis, although the mechanisms underlying this inhibition are unclear. Ref52 cells were infected with with equal multiplicities of infection (25 moi) of control or E2F1-expressing adenovirus. Cells were treated with low-serum (0.25%) designated with “−“, high-serum (10%) indicated by “+”, or high-serum media containing the PI3K inhibitor LY294002 following infection. E2F1 induces apoptosis in quiescent cells, and this apoptosis is blocked by a serum activated PI3K signaling pathway.
B. Ref52 cells treated by serum deprivation, serum stimulation, or serum stimulation with LY294002 were infected with equal multiplicities of infection (moi) and harvested for immunoblot analysis 24 hours post-infection. Expression levels of E2F1 protein are unaffected by PI3K expression, treatment with serum or by the PI3K inhibitor LY294002.
C. We tested whether PI3K blocks expression of potentially apoptotic E2F1 target genes using Affymetrix analysis. Cells were treated as outlined in 1A and harvested 40 hours post-infection for RNA extraction. Equal amounts or RNA were analyzed using Affymetrix RAE230A arrays. Affymetrix gene expression data were normalized across chips using the robust-multiarray average (RMA) algorithm and analyzed using unsupervised hierarchical clustering. Green shading represents low gene expression whereas red shading indicates higher expression. Only the E2F targets displaying a minimum 2-fold induction by E2F1 in quiescence (based on Mas5 data) were included for clustering. Each gene is induced by E2F1 in low serum media (lanes 1 and 4). Most E2F1 targets remain similarly expressed in high serum media (lane 5), however a subset is no longer induced by E2F1 in high serum (indicated by the green bar). This repression by serum is largely dependent on PI3K activity because expression of most of these genes is restored when PI3K function is disabled with LY294002 (lane 6). Both classes of E2F1 targets are displayed enlarged at the right.
We normalized the gene expression data using the robust-multiarray average (RMA) algorithm and used Gene Cluster 3.0 to organize the results based on unsupervised hierarchical clustering. Results were visualized using Java TreeView and are displayed based on the normalized intensity with green representing lower relative gene expression while red indicates higher expression (Figure 1C). A total of 772 E2F1 targets that displayed at least a 2-fold increase in expression based on MAS5 data were clustered. Comparison of lane 1 (control) with lane 4 (E2F1) indicates that each of these are E2F1 induced target genes. Addition of serum has no major effect on many of these targets in control cells although some of these genes display a modest serum induction (lane 1 vs. lanes 2). The expression of the majority of E2F1 target genes remains high when cells are stimulated with serum (Lane 5, red sidebar). The red bar indicates some of the E2F targets whose expression is not repressed by serum activated pathways. These genes are shown in the enlarged heatmap to the right. The E2F genes in this cluster are representative of the most well known proliferative targets involved in G1/S and G2/M cell cycle progression. These genes are also displayed in Table 2 based on their level of maintained or heightened expression in the presence of serum. Classification of these genes using GO annotations indicates that these genes are overwhelmingly associated with cell cycle and mitosis, and the majority of the genes contain predicted E2F binding sites in their promoters (Supplementary Table 1A).
Table 2. List of E2F1 target genes not repressed by serum.
E2F1 induction refers to fold induction by E2F1 compared with control in serum-deprived REF52 cells. These genes are all induced at least 4.5-fold, rather than 3.5-fold induction as in Table 1, since many more genes were induced than were repressed by serum. The column ‘E2F Exp w/Serum’ compares E2F1 dependent expression in serum containing media with expression levels in serum deprived media.
| Gene Symbol | Gene Title | E2F1 Induction | E2F Exp w/Serum |
|---|---|---|---|
| Lmnb1 | lamin B1 | 5.64 | 686.6% |
| Bard1 | BRCA1 associated RING domain 1 | 12.62 | 441.1% |
| Kif2c | kinesin family member 2C | 8.11 | 285.4% |
| LOC690771 | Hypothetical protein LOC690771 | 4.6 | 229.8% |
| Nefh | neurofilament, heavy polypeptide | 6.15 | 221.2% |
| Mcam | melanoma cell adhesion molecule | 5.08 | 220.7% |
| Ribc1 | RIB43A domain with coiled-coils 1 | 5.37 | 219.7% |
| Hrmt1l3 | heterogeneous nuclear ribonucleoprotein methyltransferase-like 3 | 5.97 | 218.9% |
| Pttg1 | pituitary tumor-transforming 1 | 6.13 | 218.2% |
| Rrbp1 | ribosome binding protein 1 homolog 180kDa (dog) | 10.34 | 218.0% |
| Slc35e1 | Solute carrier family 35, member E1 | 5.11 | 214.9% |
| Ccnb1 | cyclin B1 | 6.2 | 205.6% |
| Top2a | topoisomerase (DNA) 2 alpha | 11.57 | 194.9% |
| Bub1b | budding uninhibited by benzimidazoles 1 homolog, beta | 32.15 | 193.2% |
| Cdc20 | cell division cycle 20 homolog (S. cerevisiae) | 4.51 | 192.1% |
| Dhrs9 | dehydrogenase/reductase (SDR family) member 9 | 7.61 | 189.3% |
| Cask | calcium/calmodulin-dependent serine protein kinase | 4.55 | 188.8% |
| RGD1308747 | hypothetical protein FLJ10156 | 5 | 185.5% |
| Kif20a | kinesin family member 20A | 11.55 | 172.9% |
| Top2a | topoisomerase (DNA) 2 alpha | 13.02 | 171.9% |
| Ccnb1 | cyclin B1 | 5.5 | 170.6% |
| Nef3 | neurofilament 3, medium | 8.15 | 170.3% |
| RGD1563319 | RIKEN cDNA 6330512M04 gene | 6.35 | 166.1% |
| Brca2 | breast cancer 2 | 14.17 | 160.0% |
| Fshprh1 | FSH primary response 1 | 9.51 | 158.6% |
| Ptp4a3 | protein tyrosine phosphatase 4a3 | 6.77 | 158.2% |
| Obp3 | Alpha-2u globulin PGCL1 | 13.83 | 157.4% |
| RGD1566097 | Anillin | 5.54 | 155.7% |
| Ccnb2 | cyclin B2 | 9.58 | 155.2% |
| Spag5 | sperm associated antigen 5 | 5.75 | 154.5% |
| Homer1 | homer homolog 1 (Drosophila) | 7.61 | 152.8% |
| Spbc24 | spindle pole body component 24 homolog | 35.48 | 150.7% |
| Traf4af1 | TRAF4 associated factor 1 | 31.54 | 150.0% |
| LOC685433 | ecotropic viral integration site 2A | 6.02 | 148.1% |
| Iqgap3 | IQ motif containing GTPase activating protein 3 | 10.08 | 147.3% |
| LOC497083 | XK-related protein 5 | 11.44 | 145.6% |
| Nfyb | nuclear transcription factor-Y beta | 10.48 | 143.8% |
| Cdc25b | cell division cycle 25 homolog B | 5.6 | 143.2% |
| Lmnb1 | lamin B1 | 6.28 | 141.8% |
| Hipk3 | homeodomain interacting protein kinase 3 | 18.8 | 138.1% |
| Tacc3 | transforming, acidic coiled-coil containing protein 3 | 6.55 | 136.6% |
| Cldn2 | Claudin 2 | 6.33 | 135.7% |
| Melk | maternal embryonic leucine zipper kinase | 8.46 | 135.3% |
| Cdca8 | cell division cycle associated 8 | 14.52 | 135.2% |
| Racgap1 | Rac GTPase-activating protein 1 | 9.53 | 135.1% |
| Foxm1 | forkhead box M1 | 30.45 | 134.4% |
| Rims2 | regulating synaptic membrane exocytosis 2 | 4.86 | 131.7% |
| Cdkn3 | cyclin-dependent kinase inhibitor 3 | 14.54 | 131.5% |
| Gbp2 | guanylate nucleotide binding protein 2 | 13.63 | 130.9% |
| RGD1562596 | mKIAA0159 protein | 12.25 | 130.7% |
| LOC684513 | SWI/SNF-related matrix-associated actin-dependent regulator of chromatin c2 isoform b | 7.09 | 130.5% |
| Slc38a1 | solute carrier family 38, member 1 | 5.52 | 130.4% |
| Cdc2a | cell division cycle 2 homolog A (S. pombe) | 8.35 | 128.6% |
| RGD1565889 | citrin | 4.73 | 127.0% |
| Fabp5 | fatty acid binding protein 5, epidermal | 10.2 | 126.5% |
| Adk | adenosine kinase | 5.14 | 126.3% |
| Espl1 | extra spindle poles like 1 (S. cerevisiae) | 15.79 | 125.3% |
The results also indicate that serum inhibits the expression of a significant number of the E2F1 target genes (Figure 1C, lane 5, green sidebar). Many of these have not previously been described as E2F targets. These genes comprise transcription factors, signaling pathway G-proteins/kinases, biosynthetic enzymes and transporters. GO annotation analysis indicates that these genes serve pleiotropic functions but also suggests that E2F binding sites are highly represented in the promoters of these genes (Supplementary Table 1B). Further analysis revealed that the serum mediated repression of the E2F1 targets required PI3K as indicated by the fact that inhibition of PI3K activity with LY294002 restored expression (Figure 1C, lane 6). These results suggest that a category of E2F1 target genes are only induced in conditions lacking PI3K activity.
We verified the expression pattern of several of the PI3K-repressed E2F target genes, including PRKAA2/AMPKα2, Nr4a3, Cyp26b1, and p27KIP1, using quantitative real-time PCR normalizing to internal GAPDH levels. Ref52 cells were treated as indicated in Figure 2A and mRNA was isolated for qRT-PCR analysis at 40 hours post-infection, the same point RNA was isolated for apoptosis and affymetrix analysis. The expression level of each gene in quiescent, CMV infected cells was set to 1 and all other results are compared with this value and reported as fold-inductions. As shown in Figure 2A, each of these four genes is induced by E2F1 in quiescent Ref52 cells ranging in fold-inductions from 2.5 for p27KIP1 to 65-fold induction for Cyp26b1. Addition of serum significantly inhibits induction of these E2F targets, with reductions by serum ranging from a 57% to 75%. This repression is dependent on PI3K activity, because addition of LY294002, a PI3K inhibitor, restores E2F1 dependent expression of each of these genes.
Figure 2. Expression of selected PI3K-repressed E2F1 targets using quantitative real-time PCR.

A. mRNA expression levels of AMPKα2 (Prkaa2), Nr4a3, Cyp26b1 and p27KIP1 were measured using quantitative real-time PCR in cells treated with or without E2F1 infection, high-serum or the PI3K inhibitor LY294002. RNA was isolated 40 hours post-infection, the same timepoint used to isolate RNA for array experiments. Results were normalized to GAPDH levels and are displayed relative to the expression of the gene in serum-deprived cells infected with control adenovirus and represent three independent experiments. Error bars here and in 2B represent mean +/− standard deviation (SD).
B. RT-PCR measurements of AMPKα2, Nr4a3 and p27KIP1 mRNA levels were taken in E2F1 infected cells either with or without PI3K co-infection 24 hours post-infection and normalized to GAPDH levels. Expression levels of each gene in PI3K non-infected cells was set to 100% and used to compare the effects of PI3K repression of gene expression thus emphasizing PI3K repression rather than relative induction by E2F1. These experiments were done using low (0.25%) serum media and are representative of three independent experiments.
The chemical inhibitor LY294002 can affect additional targets besides PI3K, so we determined whether PI3K directly inhibits E2F1 dependent activation of AMPKα2, Nr4a3 and p27KIP1. To answer this question, we infected quiescent Ref52 cells with E2F1 alone or E2F1 co-infected with PI3K, isolated mRNA 24 hours post-infection, and measured target gene expression using real-time PCR. Co-infection of PI3K reduced E2F1 dependent expression of AMPKα2 by 52%, Nr4a3 by 58% and p27KIP1 by 41% indicating that PI3K can directly influence repression of these E2F target genes. We also tested PI3K effect on Cyp26b1 but did not observe reduction of its E2F1 dependent expression by PI3K.
PI3K repressed targets mediate E2F1-induced apoptosis
Previous work has established a clear role for the E2F transcription factors in the regulated expression of genes required for proliferation. The majority of these genes are positively regulated in response to serum-stimulated growth. This includes a subset of the genes induced by E2F1 whose expression is independent of PI3K activity. In contrast, our results now also identify a subset of E2F1 target genes that are repressed, not activated, in response to serum-stimulated growth. Because of this unique expression pattern, we tested whether these growth-repressed E2F targets facilitate apoptosis induction by targeting eleven of these genes for shRNA-mediated knockdown in U2OS (human osteosarcoma derived) cells. Genes were selected for targeted knockdown based on level of induction by E2F1 in serum deprived Ref52 cells and, the extent of repression of these genes by serum. As controls, we also generated three independent U2OS cell lines infected with control vector retrovirus. After puromycin selection of retrovirus transduced cells, gene knockdown efficiency was measured using real-time PCR (Supplementary Fig 1A). We tested the effects of target gene knockdown on E2F1 apoptosis induction by depriving cells of serum for 48 hours, infecting with E2F1 expressing adenovirus and harvesting cells 40 hours post-infection for caspase-3 flow cytometry assays. Results are displayed as the per cent apoptosis induction relative to the average combined active caspase-3 measurements of the three vector control cell lines.
We found that knockdown of two of these E2F targets, CXCR4 and MAP4K2 had no effect on E2F1 apoptosis induction (Figure 3A) although these genes were degraded by shRNA (Supplementary Figure 1A). In contrast, targeted degradation of other E2F targets impaired apoptosis induction to varying degrees. For example, two different shRNAs targeting PRKAA2/AMPKα2, a key regulator of metabolic pathways in response to reduced cellular energy levels, inhibited E2F apoptotic activity by 70% and 50%. Reduction of Cyp26b1, an enzymatic regulator of all-trans retinoic acid metabolism, inhibited E2F1 apoptosis induction by 50%. We find that two different shRNA constructs that target Nr4a3 (Nuclear receptor subfamily 4, group A, Member 3), a transcription factor that can promote apoptosis in various contexts, leads to a reduction in E2F1 induction of apoptosis by 40% or 48%. The gene MLLT3 (Myeloid/Lymphoid or Mixed Lineage Leukemia, Translocated to 3) inhibits E2F1 apoptosis by 50% when degraded by shRNA. Finally, shRNA targeting of the uncharacterized gene RBPMS (RNA binding protein with multiple splicing sites) inhibited E2F1 apoptosis by 50%.
Figure 3. Select PI3K repressed targets mediate E2F1-induced apoptosis.

A. Selected PI3K repressed E2F1 genes were targeted for shRNA mediated degradation in U2OS cells to assess their role in E2F1 apoptosis induction. Control and knockdown cell lines were deprived of serum, infected with E2F1 and apoptosis measurements were compared between knockdown and control lines. Results are presented as the percent apoptosis observed in knockdown lines relative to control cells and are indicative of a minimum of three independent experiments. Genes displaying more than one colored bar were degraded with independent shRNA constructs that target the mRNA in distinct locations. Error bars represent mean +/− standard deviation (SD).
B. The same U2OS cell lines were deprived of serum for 48 hours, infected with E2F1 and photographed 72 hours post-infection. Whereas vector control cell lines were almost completely killed by apoptosis after E2F1 infection, knockdown of select PI3K repressed targets impaired E2F1 apoptotic killing allowing survival and cell accumulation on plates. Scale bar, 10 μm.
C. IMR90 cells, a wild-type human fibroblast line, were infected with retrovirus expressing three distinct AMPKα2 targeting shRNA constructs. These lines were tested for AMPKα2 knockdown, deprived of serum, infected with E2F1 and photographed 72 hours post-infection. Knockdown of AMPKα2 in IMR90 cells, like in U2OS cells, also impaired E2F1 apoptosis induction. Scale bar, 10 μm.
Vector control cells were susceptible to E2F1 induced apoptosis and consequently were almost completely killed and cleared from the plate (Fig. 3B). shRNA gene knockdowns that impaired caspase-3 cleavage also permitted cells to resist apoptosis and survive in these plate assays (AMPKα2, Cyp26b1, Nr4a3, Mllt3 and RBPMS). The apoptosis sensitive shRNA knockdown cell lines (Cxcr4 and MAP4K2) were also susceptible to E2F1 killing on plate assays and were significantly cleared off the plate. To further analyze the role of AMPKα2 in mediating E2F1 induced apoptosis, we targeted AMPKα2 for shRNA degradation in 3 pools of human diploid fibroblast cells (IMR90). After selecting for stable retroviral integration, we serum-deprived control and knockdown cells, infected with E2F1 and observed effects on cell killing. E2F1 was expressed equivalently across the experimental cell lines. As shown in Figure 3C, depletion of AMPKα2 renders human fibroblasts resistant to E2F1 induced cell killing. These results confirmed that the genetic connection between E2F1 and AMPKα2 was conserved in tumor (U2OS) and non-tumor (IMR90) cell lines. We also observe induction of AMPKα2, Cyp26b1 and Nr4a3 by E2F1 in U2OS and IMR90 cells, further strengthening the genetic connection of these genes with E2F1 (Supplementary Figure 1B).
Synergistic activation of E2F1-apoptosis by AMPKα2 co-expression or AMPK activation with AICAR
AMPKα2 is an evolutionarily conserved regulator of cellular energy metabolic pathways in response to ATP and nutrient deprivation (Shaw, 2006; Tower and Hardie, 2007). Ectopic AMPKα2 expression does not induce apoptosis in IMR90 cells on its own, but when co-infected with levels of E2F1 sub-threshold for apoptosis induction, we observe a synergistic activation of apoptosis by this combinatorial treatment (Figure 4A).
Figure 4. Synergistic activation of E2F1-apoptosis by AMPKα2 co-expression or AMPK activation with AICAR.

A. IMR90 cells were infected with adenovirus expressing AMPKα2, E2F1 at levels below the threshold to induce apoptosis, or a combination of AMPKα2 and E2F1. Neither AMPKα2 nor E2F1 individually induced apoptosis in IMR90, but the combination of E2F1 and AMPKα2 significantly enhanced cellular apoptosis. Error bars here and in 4B represent mean +/− standard deviation (SD).
B. U2OS cells were deprived of serum and infected with control or sub-apoptotic threshold levels of E2F1 (0.5 MOI) and treated with vehicle or AICAR, an AMP-analog activator of AMPKα2. AICAR does not promote apoptosis in control cells but strongly enhances apoptosis in cells infected with E2F1. shRNA knockdown of AMPKα2 significantly impairs this enhancement of E2F1 induced apoptosis by AICAR.
Because E2F1 induction of AMPKα2 during nutrient-poor conditions promotes apoptosis, we predicted that a pharmacologic activator of AMPKα2 should further enhance E2F1 apoptosis induction. We tested this hypothesis using AICAR, an AMP analog that activates AMPK complexes (Sullivan et al., 1994). Treatment of control infected U2OS cells with AICAR does not induce apoptosis (Figure 4B). Infecting U2OS cells with low levels of E2F1 caused only a modest increase in caspase-3 cleavage. Further stimulation of E2F1 infected U2OS cells with the drug AICAR, however, led to a 2.5-fold increase in apoptosis compared with E2F1 infection alone. To determine the extent to which this enhanced apoptosis is dependent on the presence of AMPKα2, we repeated these experiments in cells depleted for AMPKα2 levels by shRNA. In this cellular context we find that co-treatment with E2F1 and AICAR no longer enhances apoptosis, indicating heavy dependence on AMPKα2 for this outcome. We also observed that AICAR does not enhance E2F1 apoptosis induction in cellular contexts where Cyp26b1 or Nr4a3 have been degraded by shRNA. This may indicate that expression of these additional E2F1 apoptotic targets is required in conjunction with AICAR activation of AMPKα2 to bring cells over the threshold required to commit to the apoptotic program.
Impact of the E2F1 apoptotic program on human cancer phenotypes
The results we present here point to a role for PI3K activity in defining the balance of E2F1-mediated proliferation or apoptotic function. Given the predominant role of Rb/E2F and PI3K pathway activities in human cancer, and in light of the widely held view that disabling oncogene-induced apoptosis is a common aspect of many cancers, we asked whether the PI3K repressed E2F1 target gene signature displays a pattern of expression in human cancers in relation to clinical outcomes. We used the list of E2F1 target genes derived from clustering analysis in Figure 1C whose expression is not reduced by PI3K (cluster marked by red bar) and the genes whose expression is repressed by serum activated PI3K signaling (cluster indicated by the green bar). We next identified the human U133A Affymetrix probes correlating with the RAE230A genes (PI3K repressed and non-repressed) and U133A probe set information from Affymetrix. The expression values of these E2F genes were then extracted from four different human cancer microarray experiments – three breast cancer tissue datasets (GSE1456, GSE4922, and GSE2034) and an ovarian cancer dataset (GSE3149) (Bild et al., 2006; Ivshina et al., 2006; Pawitan et al., 2005; Wang et al., 2005). Each of these experiments used U133A Affymetrix platform and we normalized expression data across all chips using the robust multi-array average (RMA) algorithm. RMA data was gene and array centered using Gene Cluster 3.0 and clustered hierarchically by average linkage. Clustered results were visualized using Java TreeView.
Unsupervised hierarchical clustering of both the breast and ovarian cancer datasets revealed a similar pattern of E2F1 proliferative and apoptotic gene expression. The red and green color bar located to the right of the cluster displays the location of clustered PI3K repressed (red) and PI3K non-repressed (green) E2F1 target genes. In general, the PI3K non-repressed targets and the PI3K repressed genes were mutually exclusive in their expression levels (Figure 5A, 5B, 5C and Supplemental Figure 2). Furthermore, both breast and ovarian tumors are separated into two distinct subgroups based on the expression of these E2F1 target genes. The first group of tumors, designated above by red shaded clustering, in general display reduced levels of the PI3K non-repressed E2F1 targets and higher relative levels of the PI3K repressed (apoptotic) E2F1 target genes. The second group of tumors, marked above with green shaded clustering, display an inverse expression phenotype, expressing high levels of E2F proliferative targets and reduced levels of PI3K-repressed E2F1 target genes.
Figure 5. Analysis of E2F1 target gene expression in human cancers.

A. The expression values of PI3K repressed and non-repressed E2F1 target genes were extracted from a breast cancer expression study (GSE1456). These genes and tumor samples were organized using unsupervised hierarchical clustering. The class identity of clustered genes is displayed in the Red/Green bar to the right; PI3K non-repressed E2F1 targets are green while the PI3K repressed E2F1 targets are indicated with red (see 5D). Breast tumors are segregated into two major groups defined by expression levels of the PI3K repressed and non-repressed E2F1 targets. The first class, marked above with the red shaded clustering expresses high levels of the PI3K-repressed genes and low levels of the PI3K non-repressed genes. The second class, labeled with a green shaded clustering, display an inverse relationship with the other clustered set of breast tumors. These tumors express low levels of PI3K repressed E2F1 targets and generally express high levels of non-repressed targets. PI3K gene expression signatures were used to predict the activation state of the PI3K pathway (blue representing low activity and red, high activity) and are displayed below the clustered genes as a colorbar. Breast cancer tumor stages are displayed below the PI3K prediction colorbar. The two groups of breast cancer patients were designated either ‘Low Apoptotic’ and ‘High Apoptotic’ based on relative expression levels of the PI3K-repressed E2F1 target genes and were plotted according to patient survival in the Kaplan-Meier survival curve to the right. The data indicates that patients expressing lower relative levels of the PI3K repressed (apoptotic) target genes display a significantly poorer prognosis.
B. Similar analysis as described in section 5A was performed on a different breast cancer dataset (GSE4922).
C. Ovarian tumors (GSE3149), as was seen in the breast cancer tumors, are also segregated into two major groups defined by high or low expression levels of the PI3K repressed and non-repressed E2F1 targets. PI3K gene expression signatures were used to predict the activation state of the PI3K pathway (blue representing low activity and red, high activity) and are displayed below the clustered genes. Ovarian tumor stages are displayed below the PI3K prediction. The tumors are separated into two groups based on their expression of PI3K repressed E2F1 targets, again designated either ‘high apoptotic’ or ‘low apoptotic’ and patients were separated using Kaplan-Meier curves for the survival outcomes.
D. Gene classes refer to whether the E2F1 target gene is repressed, or not repressed, by PI3K signaling. The PI3K score refers to the probabilities of relative PI3K pathway status based on the binary regression weights mapping metagenes. Tumor stage refers to the stage of the tumor at diagnosis.
Similar to previous studies that have used expression signatures of oncogenic pathway activation to predict the state of the pathway in tumors, we have applied the PI3K gene expression signature to the breast and ovarian cancer datasets to predict PI3K pathway activity in these tumors (Bild et al., 2006). This analysis is displayed as a color bar below the gene clustering where cool colors (blue) represent low predicted activation and warm colors (red) refer to high predicted activation of PI3K. This analysis separates both breast and ovarian tumors into two clusters with either quite low or high predicted PI3K activation. Interestingly, the tumors with high predicted PI3K activity generally display the lowest expression of the PI3K repressed E2F1 target genes. Conversely, breast and ovarian tumors with low predicted PI3K activity in general express higher levels of the PI3K repressed target genes. Advanced stage 3 tumors cluster predominantly with tumors that poorly express PI3K repressed E2F1 target genes whereas stage 1 and stage 2 tend to cluster with tumors that highly express these genes. Furthermore, patients with either breast or ovarian tumors that display reduced levels of these PI3K-repressed E2F1 genes show significantly worse prognosis of patient survival (Figure 5A, 5B and 5C) or higher recurrence rates (Supplementary figure 2) than patient expressing high levels of these genes.
Discussion
The Rb/E2F pathway regulates the expression of gene products that facilitate transition through various stages of the cell cycle. These include both DNA replication genes that function during the G1/S transition and genes controlling chromosome maintenance required for transition through the G2/M stage of the cell cycle. Various studies have suggested a complex role for E2F1, contributing to the control of both cellular proliferation and cell fate. For instance, both E2F1 and E2F3 are required for cell cycle entry but only E2F3 is required for continued cell proliferation (Kong et al., 2007). Unlike the other activator E2Fs, E2F1 also responds to various cellular stresses. For example, DNA damage-induced activation of ATM, ATR and Chk2 leads to specific phosphorylation and accumulation of E2F1, but not E2F2 or E2F3 (Lin et al., 2001; Stevens et al., 2003). It is also clear that Rb/E2F controls transcription of genes like p14ARF, p73, Apaf1, Caspases, Chk2 and BH3-only proteins that contribute to the induction of cellular apoptosis (Bates et al., 1998; Croxton et al., 2002; Hershko and Ginsberg, 2004; Irwin et al., 2000; Lissy et al., 2000; Moroni et al., 2001; Nahle et al., 2002; Rogoff et al., 2002; Rogoff et al., 2004; Stiewe and Putzer, 2000). It is widely believed that induction of apoptosis by E2Fs eliminates cells that have acquired a sporadic, oncogenic mutation in Rb or a regulator of Rb function. The work we present here now demonstrates both a specificity of E2F1 transcription control reflecting this bipartite function as well as a role for the PI3K/Akt survival pathway to regulate the E2F1 apoptotic program.
We have demonstrated that growth factor stimulated activation of PI3K and Akt, but not Mek, blocks E2F1 induced apoptosis (Hallstrom and Nevins, 2003). Akt is a serine/threonine kinase that phosphorylates several cellular proteins either inhibiting their pro-apoptotic or enhancing an anti-apoptotic activity. Some of these cell cycle or apoptotic regulatory Akt targets like p27KIP1, BAD and Caspase-9 are inactivated by Akt phosphorylation (Cardone et al., 1998; Datta et al., 1997; del Peso et al., 1997). Akt phosphorylation also degrades p53 by activating its inhibitor Mdm2, it inhibits Forkhead transcription of proapoptotic targets, and promotes activation of NFκB transcription of pro-survival targets by inducing degradation of IκB, an inhibitor of NFκB function (Ashcroft et al., 2002; Ogawara et al., 2002). Interestingly, Akt can indirectly inhibit E2F1 transcriptional activity by phosphorylating TopBP1 promoting its binding to and repression of E2F1 (Liu et al., 2006).
While the E2F1 targets that are not affected by PI3K include genes that function in cell proliferation, the PI3K regulated E2F1 target genes are clearly distinct. Importantly, we show that several of these are required for the ability of E2F1 to induce apoptosis. One of these genes, AMPKα2, has been shown previously to function in sensing and responding to conditions of cellular energy deprivation and other work has shown that AMPKα2, but not AMPKα1, is induced by hypoxia and glucose deprivation (Laderoute et al., 2006). Moreover, AMPKα2, the catalytic kinase subunit of the AMPK trimer, can induce growth arrest by promoting p53 phosphorylation (Jones et al., 2005). Furthermore, AMPKα2 is a phosphorylation target of the tumor suppressor gene LKB1, indicating a potential interplay between the Rb/E2F, PI3K and LKB1/AMPK tumor suppressor pathways.
The balance between cell death with proliferation is often disrupted in the oncogenic process leading to tumor expansion because of failure of the normal cell death process. Indeed, we find that the two categories of E2F1 target genes, proliferation and apoptosis, are expressed in a mutually exclusive fashion in breast and ovarian cancers in a manner that correlates with predicted PI3K activity and patient clinical outcome. Based on the predicted activation state, PI3K may be pivotal in regulating this different transcriptional output by E2F1 in tumors. Our analysis demonstrate that patients with tumors that poorly express the PI3K-repressed E2F1 target genes generally show a significantly poorer prognosis than patients expressing higher levels of these genes. Whether this distinction arises from differences in apoptosis induction by E2F1, and if so, whether apoptosis can be restored by chemically inhibiting PI3K signaling remains to be determined. We do find that activation of the AMPKα2 gene by AICAR, an AMP analog, accentuates apoptosis in connection with deregulated E2F1 activity, suggesting a potential strategy for therapeutic intervention. Biguanide AMPK activators like metformin, currently used to treat diabetes, may potentially be interesting candidates for cancer treatment (Hardie, 2007; Motoshima et al., 2006). Additionally, one might anticipate that in those tumors exhibiting decreased expression of AMPKα2 as well as the other E2F1 apoptotic target genes, inhibition of the PI3K signaling pathway might also have therapeutic benefit by restoring expression of these genes.
Experimental Procedures
Cell culture and apoptosis assays
U2OS and IMR90 cells were passaged in DMEM media containing 10% fetal calf serum. REF52 (rat embryo fibroblast) cells were passaged in DMEM media containing 5% fetal calf and 5% bovine calf serum. Cells to be infected were brought to quiescence by plating (3×10⁵ cells/60 mm plate) in serum containing media for 24 hours and then washing and replacing with 0.25% serum containing media. Cells were deprived of serum for 48 hours before infecting with adenovirus. Cells to be infected in serum containing media were plated 24 hours prior to virus infection. Cell numbers were determined prior to infection to infect with equal adenoviral multiplicities. Floating and adherent cells were harvested at 40 hours post-infection, fixed with formaldehyde, stained with a PE-conjugated antibody that binds to active, cleaved caspase-3 and analyzed by FACS following the manufacturers protocol (BD PharMingen). LY294002 and AICAR were purchased from Sigma and final concentrations used were 50 uM (LY294002) and 125 uM (AICAR).
Adenovirus and retrovirus infection
Adenovirus expressing hemagglutin (HA)-tagged E2F1, and control adenovirus not expressing any gene have been described previously (Hallstrom and Nevins, 2003). Morris Birnbaum kindly provided adenovirus expressing rat Myc-tagged AMPKα2. Retrovirus were packaged using Plat-A cells for infection in human derived cells (Morita et al., 2000). Plasmid DNA (4 μg) was transfected into the packaging line (in 1200 μl DMEM) using Fugene 6 transfection reagent (Roche). After 24 hours another 1000 μl media was added to the cells and incubated another 20 hours. Supernatant was filtered through 0.45 μm HT Tuffryn membrane low protein binding filter syringes (44 hours post-transfection) and used to infect target cells. Polybrene (8 μg/ml) was included to assist infection efficiency. Drug selection was started 24 hours post-infection. Drug selection concentrations for U2OS cells were 1.25 μg/ml puromycin; and 1.0 μg/ml for IMR90 cells. shRNA targeting vectors were purchased from OpenBiosystems. The specific constructs and sequences used in this study can be found in supplemental data.
RNA isolation and gene expression analysis
RNA was isolated from adenovirus infected cells 40 hours post-infection using an RNeasy Midi Kit from QIAGEN. 10 μg mRNA was submitted to the Duke Microarray core for analysis with the RAE230a Affymetrix rat chip. We extracted MAS5 and RMA (robust multi-array average) data from the .CEL files using the “R” programming set (http://www.r-project.org). Rat (RAE230A) probe IDs of interest were converted to correlating Human U133A IDs (the platform of the cancer datasets) using Resourcerer at compbio.dfci.harvard.edu. Next, the human probe IDs corresponding to the E2F1 apoptotic and proliferative genes were extracted out of the breast and ovarian cancer datasets using an internal bioinformatics merging tool. We used the GeneCluster program (http://rana.lbl.gov/EisenSoftware.htm) to cluster our RMA data in an unsupervised, hierarchical fashion and visualized the heatmap using Java Treeview (available from the same location). Genes and tumours were clustered using average linkage with the uncentered correlation similarity metric. A signature representative of PI3-kinase activation was developed as previously described (Bild et al., 2006). Standard Kaplan–Meier mortality curves and their significance levels were generated for clusters of patients with similar patterns of oncogenic pathway deregulation using GraphPad Prism software. The GATHER bioinformatics tool has been described and can be found online at http://gather.genome.duke.edu/ (Chang et al., 2007).
Real-time PCR
We used the QuantiTect SYBR Green RT-PCR kit from QIAGEN according to manufacturer’s specifications for our quantitative real-time PCR. Each experimental condition used 100 ng of RNA for reverse transcription and RT-PCR and was performed in triplicate and normalized against expression of Rat or Human GAPDH expression levels. Analysis was done with an ABI Prism 7900HT detection system (Applied Biosystem) according to the manufacturer’s protocol.
Protein immunoblotting analysis
REF52 cells were harvested 40 hours post-infection into microfuge tubes and re-suspended in boiling sample buffer. Equivalent amounts of protein were separated by SDS-PAGE, transferred to an Immobilon-P (Millipore) membrane and blocked in T-TBS containing 5% nonfat dry milk. Blots were then incubated with primary antiserum (1:1000) at room temperature for four hours, washed three times with T-TBS buffer and then incubated with the appropriate secondary antiserum (1:2000) for one hour at room temperature. Blots were processed using the ECL system (Amersham). Antiserum against E2F1 (c-20) was purchased from Santa-Cruz Biotechnology for immunoblot analysis.
Supplementary Material
Figure 6. Control of E2F1 proliferation and apoptotic gene regulation by the PI3K/Akt pathway.
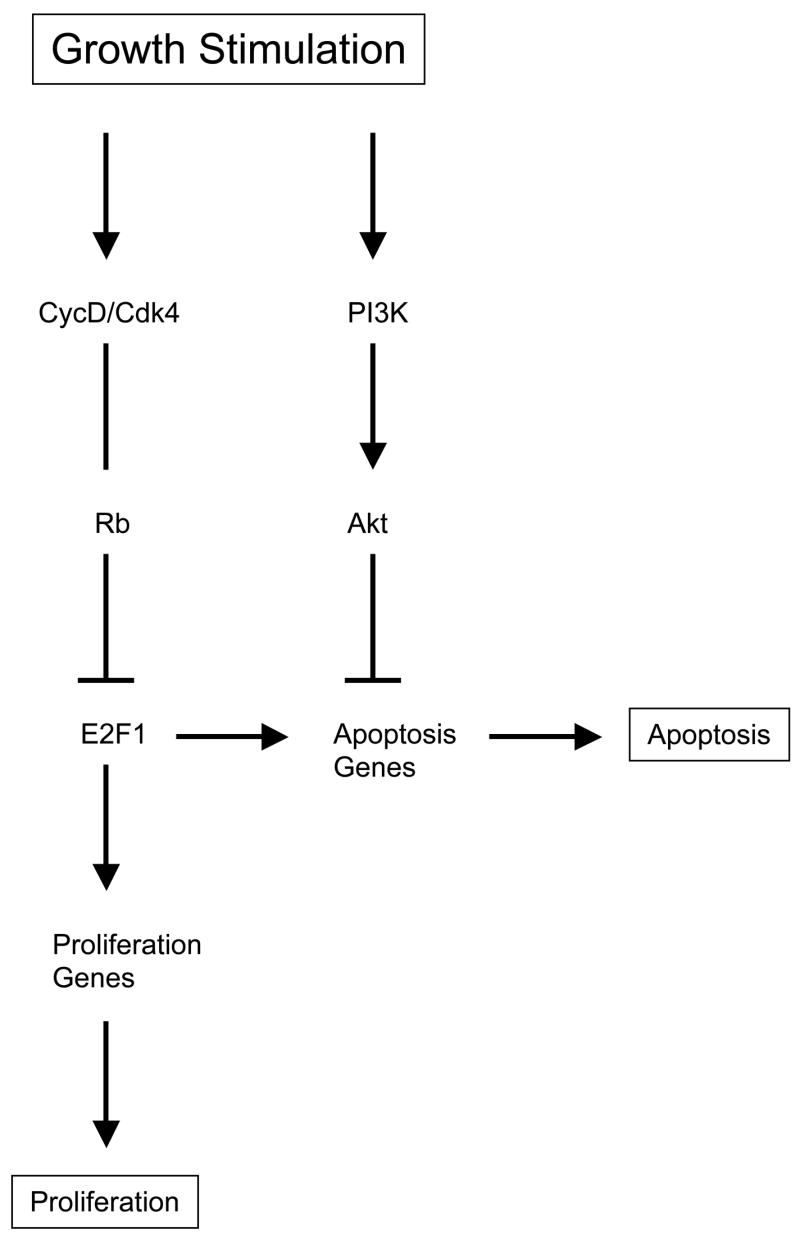
Growth factor stimulation activates a number of different intercellular signaling pathways that intersect to control cell fate outcomes like proliferation and apoptosis. For example, activation of Cyclin D/Cdk4 kinase complexes result in phosphorylation of Retinoblastoma (Rb) releasing it from E2F1 transcription factor repression. E2F1 is then free to transcriptionally activate genes that promote proliferation and apoptosis. Cells are at least partially able to distinguish ‘normal’ from oncogenic stimulated growth through the activation of the PI3K/Akt signaling pathway which can inhibit the activation of pro-apoptotic target genes and apoptosis by E2F1. Cells with PI3K blocked apoptosis are then capable of completing normal proliferation without apoptotic interference.
Table 1. List of E2F1 target genes repressed by serum.
E2F1 induction refers to the fold induction of the gene in REF52 cells infected with E2F1, compared with expression in control infected cells deprived of serum. Only the genes induced at least 3.5-fold are displayed here. The second column, labeled ‘E2F Exp w/Serum’, compares the % expression by E2F1 in serum containing media compared with E2F1 dependent expression in serum-deprived media. These genes were identified in Microsoft Excel based solely on fold induction and repression and is not the full list identified by GeneCluster analysis.
| Gene Symbol | Gene Title | E2F1 Induction | E2F Exp w/Serum |
|---|---|---|---|
| RBPMS | RNA binding protein gene with multiple splicing | 11.62 | 5.0% |
| Prkaa2 | protein kinase, AMP-activated, alpha 2 catalytic subunit | 10.03 | 6.5% |
| LOC682245 | Acylphosphate phosphohydrolase | 39.5 | 8.9% |
| Hist1h2bp | histone 1, H2bp | 5.14 | 9.7% |
| LOC493574 | notch1-induced protein | 5.42 | 10.0% |
| Pdzd4 | PDZ domain containing 4 | 3.72 | 11.0% |
| P22k15 | cystatin related protein 2 | 5.25 | 11.9% |
| Cyp26b1 | cytochrome P450, family 26, subfamily b, polypeptide 1 | 61.86 | 12.1% |
| Gnao | Guanine nucleotide binding protein, alpha o | 12.18 | 12.4% |
| Prlph | prolactin-like protein H | 7.38 | 15.3% |
| Sfn | stratifin | 4.66 | 15.8% |
| Limk1 | LIM motif-containing protein kinase 1 | 6.88 | 17.2% |
| Ugt2b3 | UDP glycosyltransferase 2 family, member 3 | 6.5 | 18.5% |
| RGD1559826 | nectin 4 | 6.96 | 20.0% |
| Septin 4 | septin 4 | 5.88 | 21.3% |
| RGD1311456 | RIKEN cDNA B230380D07 | 12.75 | 21.3% |
| Plxdc2 | plexin domain containing 2 | 3.5 | 21.7% |
| RGD1307569 | Protein C21orf63 homolog precursor | 7.77 | 22.4% |
| Mllt3 | myeloid/lymphoid or mixed-lineage leukemia, translocated to, 3 | 8.45 | 24.2% |
| LOC683830 | Calreticulin precursor (CRP55) (Calregulin) (HACBP) (ERp60) | 3.97 | 24.2% |
| Nr2f1 | nuclear receptor subfamily 2, group F, member 1 | 5.67 | 24.7% |
| Ptpn7 | protein tyrosine phosphatase, non-receptor type 7 | 6.52 | 25.5% |
| RGD1311132 | RIKEN cDNA E430013E20 gene | 6.49 | 25.7% |
| Map4k2 | mitogen activated protein kinase kinase kinase kinase 2 | 22.39 | 26.6% |
| Ces2 | carboxylesterase 2 (intestine, liver) | 4.56 | 27.3% |
| RGD1310271 | hypothetical protein MGC45873 | 11.86 | 27.7% |
| Tnc | Tenascin C /// Tenascin C | 6.09 | 27.8% |
| Cbx7 | chromobox homolog 7 | 6.08 | 28.0% |
| Dlgap2 | Discs, large (Drosophila) homolog-associated protein 2 | 9.47 | 28.6% |
| Fxyd4 | FXYD domain-containing ion transport regulator 4 | 5.17 | 29.3% |
| Slc21a13 | solute carrier family 21, member 13 | 10.17 | 29.5% |
| RGD1562284 | Glutaminyl-peptide cyclotransferase precursor (QC) | 10.91 | 30.2% |
| Cml5 | camello-like 5 | 7.59 | 32.9% |
| Nos3 | nitric oxide synthase 3, endothelial cell | 4.18 | 34.4% |
| Gprc5b | G protein-coupled receptor, family C, group 5, member B | 3.66 | 34.9% |
| RGD1562847 | paired immunoglobin-like type 2 receptor alpha | 3.81 | 35.3% |
| Ybx2 | Y box protein 2 | 8.86 | 35.9% |
| Mal2 | mal, T-cell differentiation protein 2 | 3.77 | 37.6% |
| Kng1 | kininogen 1 | 4.12 | 38.8% |
| Magi3 | membrane associated guanylate kinase, WW & PDZ domain 3 | 6.01 | 39.3% |
| RGD1563612 | testhymin | 3.81 | 40.3% |
| Hspbap1 | Hspb associated protein 1 | 4.12 | 40.7% |
| Nubpl | nucleotide binding protein-like | 11.26 | 40.7% |
| Prg-2 | plasticity-related protein PRG-2 | 23.65 | 41.4% |
| Mylk2 | myosin light chain kinase 2, skeletal muscle | 3.94 | 41.6% |
| Elavl4 | ELAV (embryonic lethal, abnormal vision, Drosophila)-like 4 | 3.67 | 41.9% |
| Arhgef11 | Rho guanine nucleotide exchange factor (GEF) 11 | 4.88 | 42.1% |
| LOC680097 | germinal histone H4 gene | 7.49 | 42.2% |
| Rtn1 | reticulon 1 | 6.06 | 42.6% |
| LOC303730 | chromobox homolog 2 | 41.38 | 43.5% |
| Bst1 | bone marrow stromal cell antigen 1 | 5.46 | 43.6% |
| Nr4a3 | nuclear receptor subfamily 4, group A, member 3 | 6.24 | 43.8% |
| Fmr1 | fragile X mental retardation syndrome 1 homolog | 3.62 | 44.5% |
| Tada1l | transcriptional adaptor 1 (HFI1 homolog, yeast) like | 4.13 | 44.5% |
| Rbp2 | retinol binding protein 2, cellular | 45.1 | 45.0% |
Acknowledgments
We thank Kaye Culler for assistance in the preparation of the manuscript. We thank Morris Birnbaum for providing adenovirus expressing AMPK and T. Kitamura for providing Plat-A cells.
Footnotes
Accession Number Microarray data, including .CEL files, MAS5 and RMA information used in this study is accessible as the GSE9496 data series at the NCBI website (www.ncbi.nlm.nih.gov).
Publisher's Disclaimer: This is a PDF file of an unedited manuscript that has been accepted for publication. As a service to our customers we are providing this early version of the manuscript. The manuscript will undergo copyediting, typesetting, and review of the resulting proof before it is published in its final citable form. Please note that during the production process errors may be discovered which could affect the content, and all legal disclaimers that apply to the journal pertain.
References
- Ahuja D, Saenz-Robles MT, Pipas JM. SV40 large T antigen targets multiple cellular pathways to elicit cellular transformation. Oncogene. 2005;24:7729–7745. doi: 10.1038/sj.onc.1209046. [DOI] [PubMed] [Google Scholar]
- Ashcroft M, Ludwig RL, Woods DB, Copeland TD, Weber HO, MacRae EJ, Vousden KH. Phosphorylation of HDM2 by Akt. Oncogene. 2002;21:1955–1962. doi: 10.1038/sj.onc.1205276. [DOI] [PubMed] [Google Scholar]
- Attwooll C, Denchi EL, Helin K. The E2F family: specific functions and overlapping interests. The EMBO J. 2004;23:4709–4716. doi: 10.1038/sj.emboj.7600481. [DOI] [PMC free article] [PubMed] [Google Scholar]
- Bates S, Phillips AC, Clark PA, Stott F, Peters G, Ludwig RL, Vousden KH. p14ARF links the tumour suppressors RB and p53. Nature. 1998;395:124–125. doi: 10.1038/25867. [DOI] [PubMed] [Google Scholar]
- Berk AJ. Recent lessons in gene expression, cell cycle control, and cell biology from adenovirus. Oncogene. 2005;24:7673–7685. doi: 10.1038/sj.onc.1209040. [DOI] [PubMed] [Google Scholar]
- Bild A, Yao G, Chang JT, Wang Q, Potti A, Chasse D, Joshi MB, Harpole D, Lancaster JM, Berchuck A, et al. Oncogenic pathway signatures in human cancers as a guide to targeted therapies. Nature. 2006;439:353–357. doi: 10.1038/nature04296. [DOI] [PubMed] [Google Scholar]
- Bosco EE, Knudsen ES. Rb in breast cancer: at the crossroads of tumorigenesis and treatment. Cell Cycle. 2007;6:667–671. doi: 10.4161/cc.6.6.3988. [DOI] [PubMed] [Google Scholar]
- Cardone MH, Roy N, Stennicke HR, Salvesen GS, Franke TF, Stanbridge E, Frisch S, Reed JC. Regulation of cell death protease caspase 9 by phosphorylation. Science. 1998;282:1318–1321. doi: 10.1126/science.282.5392.1318. [DOI] [PubMed] [Google Scholar]
- Chang JC, Carvalho C, Mori S, Bild A, Wang Q, West M, Nevins JR. Decomposing cellular signaling pathways into functional units: a genomic strategy. 2007 Manuscript submitted. [Google Scholar]
- Christensen J, Cloos P, Toftegaard U, Klinkenberg D, Bracken AP, Trinh E, Heeran M, Di Stefano L, Helin K. Characterization of E2F8, a novel E2F-like cell cycle regulated repressor of E2F activated transcription. Nucl Acids Res. 2005;33:5458–5470. doi: 10.1093/nar/gki855. [DOI] [PMC free article] [PubMed] [Google Scholar]
- Croxton R, Ma Y, Song L, Haura EB, Cress WD. Direct repression of the Mcl-1 promoter by E2F1. Oncogene. 2002;21:1359–1369. doi: 10.1038/sj.onc.1205157. [DOI] [PubMed] [Google Scholar]
- Datta SR, Dudek H, Tao X, Masters S, Fu H, Gotoh Y, Greenberg ME. Akt phosphorylation of BAD couples survival signals to the cell-intrinsic death machinery. Cell. 1997;91:231–241. doi: 10.1016/s0092-8674(00)80405-5. [DOI] [PubMed] [Google Scholar]
- de Stanchina E, McCurrach ME, Zindy F, Shieh SY, Ferbeyre G, Samuelson AV, Prives C, Roussel MF, Sherr CJ, Lowe SW. E1A signaling to p53 involves the p19ARF tumor suppressor. 1998;12:2434–2442. doi: 10.1101/gad.12.15.2434. [DOI] [PMC free article] [PubMed] [Google Scholar]
- DeGregori J, Johnson DG. Distinct and overlapping roles for E2F family members in transcription, proliferation and apoptosis. Curr Mol Med. 2006;6:739–748. doi: 10.2174/1566524010606070739. [DOI] [PubMed] [Google Scholar]
- DeGregori J, Leone G, Miron A, Jakoi L, Nevins JR. Distinct roles for E2F proteins in cell growth control and apoptosis. Proc Natl Acad Sci USA. 1997;94:7245–7250. doi: 10.1073/pnas.94.14.7245. [DOI] [PMC free article] [PubMed] [Google Scholar]
- del Peso L, Gonzalez-Garcia M, Page C, Herrera R, Nunez G. Interleukin 3 induced phosphorylation of BAD through the protein kinase Akt. Science. 1997;278:687–689. doi: 10.1126/science.278.5338.687. [DOI] [PubMed] [Google Scholar]
- Hallstrom TC, Nevins JR. Specificity in the activation and control of transcription factor E2F-dependent apoptosis. Proc Natl Acad Sci USA. 2003;100:10848–10853. doi: 10.1073/pnas.1831408100. [DOI] [PMC free article] [PubMed] [Google Scholar]
- Hallstrom TC, Nevins JR. Jab1 is a specificity factor for E2F1-induced apoptosis. Genes & Dev. 2005;20:613–623. doi: 10.1101/gad.1345006. [DOI] [PMC free article] [PubMed] [Google Scholar]
- Hardie DG. AMP activated protein kinase as a drug target. Ann Rev Pharmacol Toxicol. 2007;27:185–210. doi: 10.1146/annurev.pharmtox.47.120505.105304. [DOI] [PubMed] [Google Scholar]
- Hershko T, Ginsberg D. Up-regulation of Bcl-2 homology 3 (BH3)-only proteins by E2F1 mediates apoptosis. J Biol Chem. 2004;279:8627–8634. doi: 10.1074/jbc.M312866200. [DOI] [PubMed] [Google Scholar]
- Irwin M, Martin MC, Phillips AC, Seelan RS, Smith DI, Liu W, Flores ER, Tsai KY, Jacks T, Vousden KH, Kaelin WG., Jr Role for the p53 homologue p73 in E2F-1-induced apoptosis. Nature. 2000;407:645–648. doi: 10.1038/35036614. [DOI] [PubMed] [Google Scholar]
- Ivshina AV, George J, Senko O, Mow B. Genetic reclassification of histologic grade delineates new clinical subtypes of breast cancer. Cancer Res. 2006;66:10292–10301. doi: 10.1158/0008-5472.CAN-05-4414. [DOI] [PubMed] [Google Scholar]
- Johnson DG, DeGregori J. Putting the oncogenic and tumor suppressive activities of E2F into context. Curr Mol Med. 2006;6:731–738. doi: 10.2174/1566524010606070731. [DOI] [PubMed] [Google Scholar]
- Jones RG, Plas DR, Kubek S, Buzzai M, Mu J, Xu Y, Birnbaum MJ, Thompson CB. AMP activated protein kinase induces a p53-dependent metabolic checkpoint. Mol Cell. 2005;18:283–292. doi: 10.1016/j.molcel.2005.03.027. [DOI] [PubMed] [Google Scholar]
- Kong LJ, Chang JT, Bild AH, Nevins JR. Compensation and specificity of function within the E2F family. Oncogene. 2007;26:321–327. doi: 10.1038/sj.onc.1209817. [DOI] [PubMed] [Google Scholar]
- Kowalik TF, DeGregori J, Leone G, Nevins JR. E2F1-specific induction of apoptosis and p53 accumulation is modulated by mdm2. Cell Growth & Diff. 1998;9:113–118. [PubMed] [Google Scholar]
- Kowalik TF, DeGregori J, Schwarz JK, Nevins JR. E2F1 overexpression in quiescent fibroblasts leads to induction of cellular DNA synthesis and apoptosis. J Virol. 1995;69:2491–2500. doi: 10.1128/jvi.69.4.2491-2500.1995. [DOI] [PMC free article] [PubMed] [Google Scholar]
- Laderoute KR, Amin K, Calaoagan JM, Knapp M, Le T, Orduna J, Foretz M, Violett B. 5′-AMP activated protein kinase (AMPK) is induced by low oxygen and glucose deprivation conditions found in solid tumor microenvironments. Mol Biol Cell. 2006;26:5336–5347. doi: 10.1128/MCB.00166-06. [DOI] [PMC free article] [PubMed] [Google Scholar]
- Lin WC, Lin FT, Nevins JR. Selective induction of E2F1 in response to DNA damage, mediated by ATM-dependent phosphorylation. Genes & Dev. 2001;15:1833–1845. [PMC free article] [PubMed] [Google Scholar]
- Lissy NA, Davis PK, Irwin M, Kaelin WG, Dowdy SF. A common E2F-1 and p73 pathway mediates cell death induced by TCR activation. Nature. 2000;407:642–644. doi: 10.1038/35036608. [DOI] [PubMed] [Google Scholar]
- Liu K, Paik JC, Wang B, Lin FT, Lin WC. Regulation of TopBP1 oligomerization by Akt/PKB for cell survival. EMBO J. 2006;25:4795–4807. doi: 10.1038/sj.emboj.7601355. [DOI] [PMC free article] [PubMed] [Google Scholar]
- Logan N, Graham A, Zhao XD, Fisher RI, Maiti B, Leone G, La Thangue NB. E2F-8: an E2F family member with a similar organization of DNA binding domains to E2F-7. Oncogene. 2005;24:5000–5004. doi: 10.1038/sj.onc.1208703. [DOI] [PubMed] [Google Scholar]
- Maiti B, Li J, de Bruin A, Gordon F, Timmers C, Opavsky R, Patil K, Tuttle J, Cleghorn W, Leone G. Cloning and characterization of mouse E2F8, a novel mammalian E2F family member capable of blocking cellular proliferation. J Biol Chem. 2005;280:18211–18220. doi: 10.1074/jbc.M501410200. [DOI] [PubMed] [Google Scholar]
- Morita S, Kojima T, Kitamura T. Plat-E: an efficient and stable system for transient packaging of retroviruses. Gene Ther. 2000;7:1063–1066. doi: 10.1038/sj.gt.3301206. [DOI] [PubMed] [Google Scholar]
- Moroni MC, Hickman ES, Denchi EL, Caprara G, Colli E, Cecconi F, Muller H, Helin K. Apaf-1 is a transcriptional target for E2F and p53. Nat Cell Biol. 2001;3:552–558. doi: 10.1038/35078527. [DOI] [PubMed] [Google Scholar]
- Motoshima H, Goldstein BJ, Igata M, Araki E. AMPK and cell proliferation - AMPK as a therapeutic targeet for atherosclerosis and cancer. J Physiol. 2006;574:63–71. doi: 10.1113/jphysiol.2006.108324. [DOI] [PMC free article] [PubMed] [Google Scholar]
- Nahle Z, Polakoff J, Davuluri RV, McCurrach ME, Jacobson MD, Narita M, Zhang MQ, Lazebnik Y, Bar-Sagi D, Lowe SW. Direct coupling of the cell cycle and cell death machinery by E2F. Nature Cell Biology. 2002;4:859–864. doi: 10.1038/ncb868. [DOI] [PubMed] [Google Scholar]
- O’Shea CC. DNA tumor viruses - the spies who lyse us. Curr Opin Genet Dev. 2005;15:18–26. doi: 10.1016/j.gde.2004.12.010. [DOI] [PubMed] [Google Scholar]
- Ogawara Y, Kishishita S, Obata T, Isazawa Y, Suzuki T, Tanaka K, Masuyama N, Gotoh Y. Akt enhances Mdm2-mediated ubiquitination and degradation of p53. J Biol Chem. 2002;277:21843–21850. doi: 10.1074/jbc.M109745200. [DOI] [PubMed] [Google Scholar]
- Pawitan Y, Bjohle J, Amler L, Borg AL, Egyhazi S, Hall P, Han X, Holmberg L, Huang F, Klaar S, et al. Gene expression profiling spares early breast cancer patients from adjuvant therapy: derived and validated in two population based cohorts. Breast Cancer Res. 2005;7:R953–964. doi: 10.1186/bcr1325. [DOI] [PMC free article] [PubMed] [Google Scholar]
- Qin XQ, Livingston DM, Kaelin WG, Adams PD. Deregulated transcription factor E2F-1 expression leads to S-phase entry and p53-mediated apoptosis. Proc Natl Acad Sci USA. 1994;91:10918–10922. doi: 10.1073/pnas.91.23.10918. [DOI] [PMC free article] [PubMed] [Google Scholar]
- Rogoff HA, Pickering MT, Debatis ME, Jones S, Kowalik TF. E2F1 induces phosphorylation of p53 that is coincident with p53 accumulation and apoptosis. Mol Cell Biol. 2002;22:5308–5318. doi: 10.1128/MCB.22.15.5308-5318.2002. [DOI] [PMC free article] [PubMed] [Google Scholar]
- Rogoff HA, Pickering MT, Frame FM, Debatis ME, Sanchez Y, Jones S, Kowalik TF. Apoptosis associated with deregulated E2F activity is dependent on E2F1 and Atm/Nbs1/Chk2. Mol Cell Biol. 2004;24:2968–2977. doi: 10.1128/MCB.24.7.2968-2977.2004. [DOI] [PMC free article] [PubMed] [Google Scholar]
- Shan B, Lee WH. Deregulated expression of E2F-1 induces S-phase entry and leads to apoptosis. Mol Cell Biol. 1994;14:8166–8173. doi: 10.1128/mcb.14.12.8166. [DOI] [PMC free article] [PubMed] [Google Scholar]
- Shaw RJ. Glucose metabolism and cancer. Curr Opin Cell Biol. 2006;18:598–608. doi: 10.1016/j.ceb.2006.10.005. [DOI] [PubMed] [Google Scholar]
- Stevens C, Smith LG, La Thangue NB. Chk2 activates E2F-1 in response to DNA damage. Nature Cell Biology. 2003;5:401–409. doi: 10.1038/ncb974. [DOI] [PubMed] [Google Scholar]
- Stiewe T, Putzer BM. Role of the p53 homologue p73 in E2F1-induced apoptosis. Nature Genetics. 2000;26:464–469. doi: 10.1038/82617. [DOI] [PubMed] [Google Scholar]
- Sullivan JE, Brocklehurst KJ, Marley AE, Carey F, Carling D, Beri RK. Inhibition of lipolysis and lipogenesis in isolated rat adipocytes with AICAR, a cell-permeable activator of AMP-activated protein kinase. FEBS Lett. 1994;353:33–36. doi: 10.1016/0014-5793(94)01006-4. [DOI] [PubMed] [Google Scholar]
- Tower MC, Hardie DG. AMP-activated protein kinase in metabolic control and insulin signaling. Circ Res. 2007;100:328–341. doi: 10.1161/01.RES.0000256090.42690.05. [DOI] [PubMed] [Google Scholar]
- Wang J, Klijn JG, Zhang Y, Sieuwerts AM. Gene expression profiles to predict distant metastasis of lymph node negative primary breast cancer. Lancet. 2005;365:671–679. doi: 10.1016/S0140-6736(05)17947-1. [DOI] [PubMed] [Google Scholar]
- Wu X, Levine AJ. p53 and E2F-1 cooperate to mediate apoptosis. Proc Nat’l Acad Sci. 1994;91:3602–3606. doi: 10.1073/pnas.91.9.3602. [DOI] [PMC free article] [PubMed] [Google Scholar]
Associated Data
This section collects any data citations, data availability statements, or supplementary materials included in this article.