Abstract
Insulin stimulates glucose uptake in fat and muscle by redistributing GLUT4 glucose transporters from intracellular membranes to the cell surface. We previously proposed that in 3T3-L1 adipocytes, TUG retains GLUT4 within unstimulated cells, and insulin mobilizes this retained GLUT4 by stimulating its dissociation from TUG. Yet the relative importance of this action in the overall control of glucose uptake remains uncertain. Here we report that transient, siRNA-mediated TUG depletion causes GLUT4 translocation and enhances glucose uptake in unstimulated 3T3-L1 adipocytes, similar to insulin. Stable TUG depletion or expression of a dominant negative fragment likewise stimulate GLUT4 redistribution and glucose uptake, and insulin causes a twofold further increase. Microscopy shows that TUG governs the accumulation of GLUT4 in perinuclear membranes distinct from endosomes, and indicates that it is this pool of GLUT4 that is mobilized by TUG disruption. Interestingly, in addition to translocating GLUT4 and enhancing glucose uptake, TUG disruption appears to accelerate the degradation of GLUT4 in lysosomes. Finally, we find that TUG binds directly and specifically to a large intracellular loop in GLUT4. Together, these findings demonstrate that TUG is required to retain GLUT4 intracellularly in 3T3-L1 adipocytes in the absence of insulin, and further implicate the insulin-stimulated dissociation of TUG and GLUT4 as an important action by which insulin stimulates glucose uptake.
Insulin controls glucose utilization by adipose and muscle tissues by modulating the subcellular distribution of GLUT4 glucose transporters (1,2). In unstimulated cells, GLUT4 is retained in intracellular membranes, and its predominant exclusion from the plasma membrane minimizes glucose uptake from the extracellular space. Within minutes of insulin stimulation, GLUT4 is translocated so that the number of transporters in the plasma membrane is increased and glucose uptake is accelerated. This insulin action is defective in muscle and adipose from individuals with type 2 diabetes and other insulin-resistant states (3–5). The molecular mechanisms governing GLUT4 distribution and its regulation by insulin remain poorly characterized.
To redistribute GLUT4, insulin acts primarily on the exocytic arm of the GLUT4 recycling pathway. The signaling proteins involved include Akt/PKB and its substrate AS160; the latter protein was recently shown also to contribute to intracellular retention of GLUT4 in unstimulated cells (6,7). Studies of GLUT4 vesicle traffic have been complicated by the fact that unstimulated cells, particularly the widely used 3T3-L1 adipocyte cell line, contain multiple pools of intracellular GLUT4. These include GLUT4 in endosomes, the trans-Golgi network (TGN), and poorly characterized membranes sometimes termed an “insulin-responsive compartment” or “GLUT4 storage vesicles” (GSVs). Insulin stimulates endosome recycling, which may contribute a twofold increase in cell surface GLUT4 and other proteins such as the transferrin receptor (TfnR). The more dramatic, insulin-stimulated increase in cell surface GLUT4, and not in other recycling proteins, is due to mobilization of GSVs. These membranes comprise small, preformed vesicles that are depleted of TfnR and other endosomal markers (8,9). Data indicate that GSVs are derived by budding from the TGN, yet they may also exchange with endosomes (10–12). In adipocytes, GSVs are distinct from secretory vesicles containing adiponectin (13). The biogenesis of these vesicles is both cell type specific and developmentally regulated (14).
How GSVs are retained intracellularly in the absence of insulin, and how these GLUT4-containing membranes are mobilized by insulin stimulation, remains uncertain. We recently proposed that in unstimulated cells, GLUT4 that is present in GSVs may be tethered to intracellular structures to restrict its movement to the plasma membrane (15). According to this model, insulin “untethers” this GLUT4 to accelerate its movement to the cell surface and subsequent fusion at the plasma membrane. We identified TUG as a putative tethering protein, which acts in concert with other proteins to retain GLUT4 within cells in the absence of insulin. Supporting this model, TUG and GLUT4 form a complex in unstimulated 3T3-L1 adipocytes, and colocalize on TfnR-negative intracellular membranes which sediment as light microsomes (15). These are properties shared by GSVs. The TUG•GLUT4 complex is insulin-responsive, because insulin acts rapidly to stimulate the dissociation of TUG and GLUT4 (15). Overexpression of TUG both increases the size of the insulin responsive GLUT4 pool, assessed using kinetics, and increases the number of insulin-responsive TUG•GLUT4 protein complexes (15). Conversely, expression of a dominant negative TUG UBX-Cter fragment decreases the size of the insulin responsive pool, and also decreases the number of TUG•GLUT4 complexes. Together, these data suggested that TUG is part of an insulin-responsive mechanism governing the sequestration of GLUT4 in GSVs within unstimulated 3T3-L1 cells.
Here we use RNAi-mediated depletion of TUG to further characterize its role in GLUT4 trafficking and glucose uptake, using 3T3-L1 adipocytes. The data show that TUG is required for intracellular retention of GLUT4 in nonendosomal, perinuclear membranes within unstimulated cells, consistent with the model described above. The magnitude of the effects we observe suggests that the TUG•GLUT4 complex may be an important site of insulin action to regulate glucose uptake in 3T3-L1 adipocytes.
EXPERIMENTAL PROCEDURES
Cell lines and reagents
3T3-L1 adipocytes were cultured as described previously, except that the fully supplemented, initial differentiation media was used for 72 h, and differentiation media containing insulin alone was omitted (13). siRNAs were electroporated into mature 3T3-L1 adipocytes as described (16). In some experiments siPORT electroporation buffer (Ambion Inc., Austin, TX) was used. 3T3-L1 cells stably expressing a GLUT4-7myc-GFP reporter protein, with or without the TUG UBX-Cter fragment or overexpressed TUG protein, have been described previously (13,15). For infection of 3T3-L1 cells with a retrovirus containing a TUG shRNA, the pMSCV-U3-H1 vector was used (a kind gift from Dr. Biao Luo, Broad Institute, Cambridge MA) (17). Replication defective, murine ecotropic retrovirus was produced as described previously, and infected preadipocytes were purified using flow cytometry of a GFP marker (13,15,18). To reintroduce TUG into the shRNA cells, a TUG cDNA containing silent mutations in the shRNA target site was expressed using the pBICD2 retrovirus vector, and infected cells were isolated by FACS of a CD2 marker (15,19).
Synthetic siRNA duplexes were purchased from Dharmacon, Inc. (Lafayette, CO) and targeted the following sequences: TUG siRNA A: 5′-GGTGGCTCTGCGGGTCCTA-3′, TUG siRNA B: 5′-AGCACCAGTGAGCCTGCAT-3′, Luciferase: 5′-CGTACGCGGAATACTTCGA-3′, Scramble II: 5′-GCGCGCTTTGTAGGATTCG-3′. All siRNA duplexes were 21mer sense and antisense pairs, and each strand contained the target sequence (or its reverse-complement) with a 3′ terminal dTdT overhang. For retroviral shRNA expression, the target sequence noted for TUG siRNA B was placed in the pMSCV-U3-H1 vector.
Polyclonal antisera directed to TUG were described previously (15). Antisera to the insulin receptor β-chain were purchased from Upstate Biotechnology (Charlottesville, VA), antisera to GLUT4 were a kind gift from Dr. Maureen Charron and were also raised to a C terminal peptide as described (20) or purchased from Chemicon Inc. (Temecula, CA). Antisera to GLUT1 were from Chemicon Inc. (Temecula, CA). An anti-myc (9E10) monoclonal antibody was purchased from Covance Inc. (Berkeley, CA), anti-β-actin antibody was from Abcam (Cambridge, MA), anti-transferrin receptor antibody was from BD Pharmingen (San Diego, CA), and anti-Hsc70 antibody was from Stressgen Bioreagents (Victoria, BC, Canada).
Subcellular fractionation and immunoblotting
Subcellular fractionation was performed as described (13). Pellets previously termed “LDM” and “HDM” are here more accurately called light microsomes (LM) and heavy microsomes (HM). Pellets were resuspended in RIPA buffer containing Complete protease inhibitors (Roche, Indianapolis, IN), as described (13). Total protein concentrations were measured in triplicate using micro-BCA (Pierce Biotechnology, Rockford, IL) or EZQ protein quantitation kits (Molecular Probes, Eugene, OR) and a PerkinElmer Victor3 plate reader. For SDS-PAGE, equal protein amounts were loaded in each well and Invitrogen Novex NuPAGE gels and buffers were used. Proteins were transferred to nitrocellulose membranes using a semi-dry apparatus, and immunoblotting was performed using enhanced chemiluminescent detection on film as described previously (13). For densitometry, film exposures in the linear range were scanned using transillumination at 16-bit pixel depth, and quantification was done using ImageJ. Statistical significance was assessed using a paired, 2-tailed Student’s t test.
2-deoxyglucose uptake
Assays were done as described, except that 12- or 6-well plates were used and mannitol was omitted (15). Briefly, 3T3-L1 adipocytes were differentiated (for stable cell lines) or reseeded (for cells electroporated with siRNA duplexes) in multiwell plates. Electroporated cells were assayed two days after siRNA transfection. Cells were starved, washed, then stimulated using 80 or 160 nM insulin for 20 min. at 37°C. 1 μCi/ml 2-deoxy-D-[2,6-3H]glucose was added so that the final concentration of 2-deoxyglucose was 50 mM, and uptake was allowed to proceed at 37°C for 6 min. or at 25°C for 8 min. Cells were washed using cold PBS and lysed in RIPA buffer. A portion of each lysate was used for a BCA protein assay (Pierce, Rockford IL), so that total protein could be used to correct for variation in the number of cells in each well. Nonspecific uptake was measured in the presence of 20 μM cytochalasin B, and was subtracted from 3H counts obtained from other wells. Data points were obtained in triplicate or quadruplicate, and statistical significance was assessed using a paired, 2-tailed Student’s t test.
Recombinant proteins and binding experiments
Plasmids containing the large intracellular loop of rat GLUT4 (residues 223–288) or GLUT1 (residues 207–271) in a modified pGEX-2T vector were a kind gift of Drs. Amira Klip and Philip Bilan. These proteins and control GST protein were expressed in the BL21(DE3) E. coli strain or its derivative, Rosetta(DE3) (Novagen, Madison WI). Expression was induced using isopropyl-β-D-thiogalactopyranoside, then cells were pelleted and lysed in ice cold NETN buffer (20mM Tris-HCl pH 8.0, 100 mM NaCl, 1 mM EDTA, 0.5% NP-40). Proteins were purified from the soluble phase using glutathione sepharose beads (Amersham Biosciences, Pittsburgh PA). To use equal amounts of GST or GST fusion proteins in binding experiments, aliquots of the beads were removed and the amount of protein bound was assessed by elution in sample buffer, SDS-PAGE, and Gelcode coomassie staining (Pierce, Rockford IL). Recombinant, full length TUG protein was subcloned in the pTYB3 vector (New England Biolabs, Ipswich, MA) and produced using the Roche RTS system according to the manufacturer’s instructions. TUG fragments containing residues 1–164 or 165–550 were produced and labeled with [35S]-methionine using a TNT coupled reticulocyte lysate (Promega Corp., Madison WI). Intact or truncated TUG proteins were incubated overnight at 4°C with bound GST, GST-GLUT4loop, or GST-GLUT1loop in NETN buffer. The following day, the beads were washed four times with NETN buffer, and proteins were eluted in SDS-PAGE sample buffer. Bound proteins were analyzed by SDS-PAGE and immunoblotting (for intact TUG) or autoradiography (for the 35S-labeled fragments). Duplicate gels were stained with Gelcode coomassie to demonstrate equivalent loading of GST or GST-loop proteins.
Confocal microscopy
3T3-L1 adipocytes expressing a GLUT4 reporter were reseeded on coverslips, starved, stimulated, and prepared for imaging as previously described (13,15,21). To detect externalized myc epitope tag, staining with 9E10 monoclonal antibody was done on live cells at 4°C prior to fixation. For intracellular antigens (e.g. TfnR), cells were fixed and permeablized before staining for indirect immunofluorescence. Alexa Fluor 594-conjugated secondary antibodies (Molecular Probes, Invitrogen, Carlsbad, CA) were used for simultaneous detection with GFP. Images were acquired on a Zeiss LSM 510 microscope using a 63x/1.20 water immersion objective and pinhole settings for an Airy unit of 1.0. Images were acquired at 12-bit pixel depth with a scan head speed of 6, and signal averaging of 8 or 16 total acquisitions. Postprocessing was done at 12-bit pixel depth and linear gamma using ImageJ and Adobe Photoshop.
Quantitative Real-time PCR
Cells were disrupted in TRIzol reagent (Invitrogen, Carlsbad, CA), followed by RNA isolation according to the manufacturer’s instructions. Two micrograms of total RNA from each sample was treated with DNase I and reverse transcribed into cDNA using Superscript II with random hexamer priming (Invitrogen, Carlsbad, CA). Quantitative real-time polymerase chain reaction (QPCR) was performed for all samples using self-designed primer combinations (Primer Express Software 2.0; Applied Biosystems, Foster City, CA). The primer pairs used included those to detect murine TUG (5′-CCTGACCCTGTATCCCTGGA-3′ and 5′-TCAGCCACTTGGGTACTTTGC-3′), murine GLUT4 (5′-CCAACAGCTCTCAGGCATCA-3′ and 5′-TGACCACACCAGCTCCTATGG-3′), GLUT4 reporter (5′-TGCTTGGCTCCCTTCAGTTT-3′ and 5′-CCTGCCTACCCAGCCAAGT-3′), GFP (5′-CAGGAGCGCACCATCTTCTT-3′ and 5′-CGATGCCCTTCAGCTCGAT-3′), and both native GLUT4 and exogenous GLUT4 reporter (5′-GAGGCCGGACGTTTGAC-3′ and 5′-CTGGGTTTCACCTCCTGCTCTA-3′). Detection was with iQ SYBR Green Supermix (Bio-Rad, Hercules, CA), and all samples were normalized to 18S FAM labeled endogenous control (Applied Biosystems, Foster City, CA). For each individual sample, expression of specific mRNAs was quantified in duplicate with a tolerated variance of ~10% in an iQ5 Cycler (Bio-Rad, Hercules, CA). Samples were analyzed in triplicate.
Other methods
To assess the effect of lysosomal inhibition on GLUT4 protein amounts, 3T3-L1 adipocytes were placed in Dulbecco’s modified Eagle media containing 0.5% fetal bovine serum with or without 0.4 mM chloroquine (Sigma, St. Louis, MO), essentially as described (14). Cells were incubated for various amounts of time, then lysed in RIPA buffer. The protein concentration of each sample was measured as described above, and equal amounts of protein were analyzed by SDS-PAGE and immunoblotting.
RESULTS
To evaluate the role of TUG in the control of glucose uptake, we transfected 3T3-L1 adipocytes with synthetic siRNA duplexes. Fig. 1a demonstrates that two different siRNA duplexes effectively deplete TUG protein. In control, mock transfected cells, and in those transfected with irrelevant siRNA duplexes, there is no effect on TUG protein amount. In contrast, the two siRNAs that target TUG each deplete the protein by ~85%, assessed 48 h after transfection. Amounts of insulin receptor β chain are unaffected. Thus, the two different siRNAs effectively and specifically deplete TUG protein in 3T3-L1 adipocytes.
Figure 1.
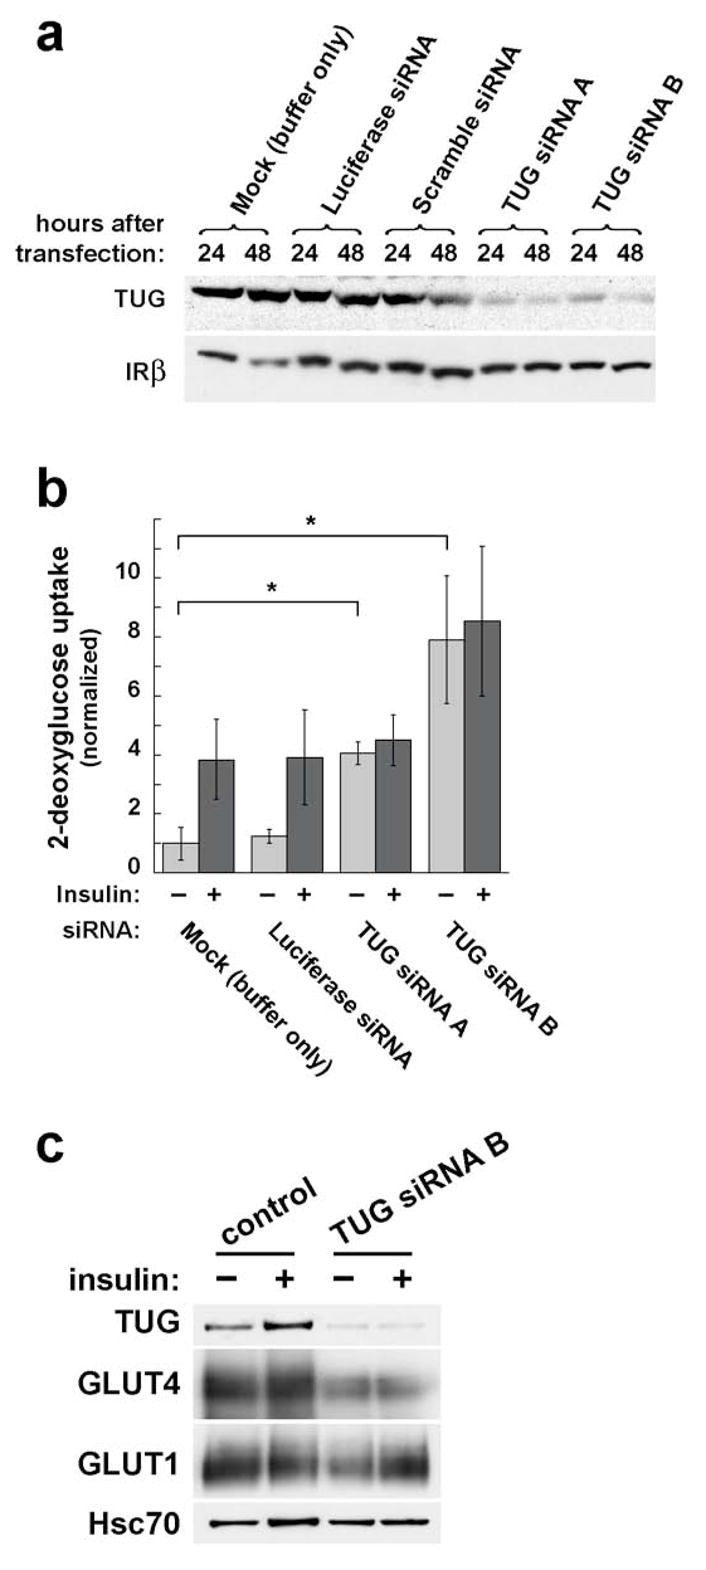
Effect of transient, siRNA-mediated TUG depletion on glucose uptake. a. 3T3-L1 adipocytes were electroporated with synthetic siRNA duplexes as indicated. 24 or 48 h after transfection, cells were lysed and analyzed by SDS-PAGE and immunoblotting. Control transfections include a mock electroporation with buffer only, an siRNA duplex targeting luciferase (which is not present in the cells), and a scrambled siRNA duplex targeting no known gene. Immunoblots were done to detect TUG and, as a control, insulin receptor β chain. The experiment was performed twice with similar results. b. 3T3-L1 adipocytes were transfected with the indicated siRNA duplexes, then seeded to multiwell plates. 48 h after transfection, glucose uptake assays were performed. Counts of [3H]-2-deoxyglucose were normalized to the amounts of protein present in the wells, and are plotted relative to uptake in unstimulated control cells. Error bars show standard deviation (* indicates p=0.02). The experiment was performed four times with similar results. c. 3T3-L1 adipocytes were transfected with or without TUG siRNA duplex B, then immunoblots were performed to assess the amounts of GLUT4 or GLUT1 present. Lysates were made 48 h after transfection of the siRNA, and basal and insulin stimulated cells (similar to those used in glucose uptake experiments) were assayed. Lysates were immunoblotted to detect Hsc70, a heat shock protein, as a loading control. The experiment was repeated twice using cells with (as here) or without a tagged GLUT4 reporter, with no effect on the result.
The effect of siRNA-mediated TUG depletion on glucose uptake in 3T3-L1 adipocytes is shown in Fig. 1b. In control mock- or luciferase siRNA- transfected cells, insulin stimulates an approximately fourfold increase in glucose uptake. In cells transfected with either of the two TUG siRNAs, basal glucose uptake is markedly increased, and no further increase is observed after insulin stimulation. In several experiments, siRNA duplex B was the slightly more effective of the two duplexes, and it may enhance glucose uptake more than siRNA duplex A, though this did not reach statistical significance. We conclude that transient depletion of TUG markedly augments glucose uptake, similar to insulin, in unstimulated 3T3-L1 adipocytes.
To determine if the enhanced glucose uptake we observed after TUG siRNA transfection is attributable to increased GLUT4 or GLUT1 protein amounts, these proteins were assayed on immunoblots of total cell lysates. As shown in Fig. 1c, neither GLUT4 nor GLUT1 is increased in 3T3-L1 adipocytes transfected with TUG siRNA B, compared to mock transfected control cells. Indeed, GLUT4 is actually decreased, raising the possibility that TUG may coordinately regulate GLUT4 targeting and protein levels, as discussed further below. No consistent effects on GLUT1 protein amount were noted. Thus, the enhanced glucose uptake we observe cannot be attributed to increased GLUT4 or GLUT1 protein amounts. These data are consistent with the possibility that TUG depletion causes GLUT4 targeting to the plasma membrane to enhance glucose uptake in cells not treated with insulin.
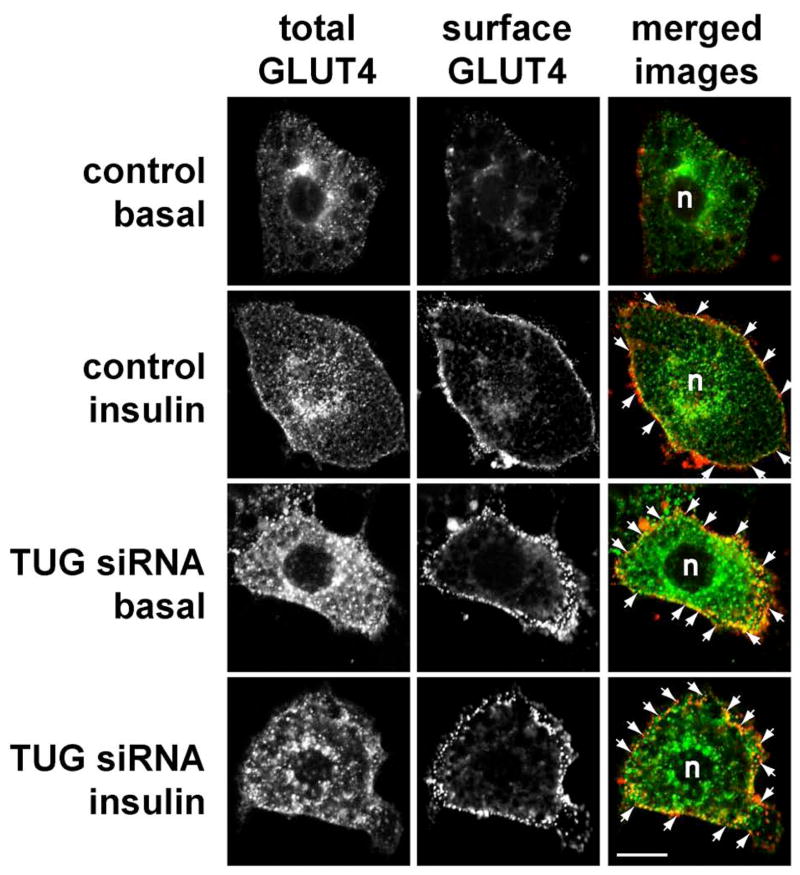
To further study the effect of siRNA-mediated TUG depletion on GLUT4 subcellular localization, we performed confocal microscopy of 3T3-L1 adipocytes stably expressing a GFP-tagged GLUT4 reporter (13). As shown in Fig. 2, cells transfected using a control siRNA and not treated with insulin target GLUT4 to intracellular membranes, and the typical perinuclear distribution is observed (top row). Minimal surface-exposed myc epitope tag is detected in these unstimulated cells. After insulin exposure, GLUT4 is seen in both perinuclear and plasma membrane distributions, and detection of externalized myc epitope tag demonstrates that GLUT4 has been incorporated into the plasma membrane (second row). In cells in which TUG is depleted by transfection of siRNA B, GLUT4 is observed at the cell surface even in the absence of insulin (third row). Externalized myc epitope is abundant, showing that this GLUT4 has been incorporated into the plasma membrane. The surface GLUT4 may be more punctate than in the insulin treated control cells, which have a more homogeneous pattern, yet the overall pattern is clearly distinct from that in unstimulated control cells. After insulin stimulation of the TUG siRNA-treated cells, GLUT4 is again observed at the cell surface (bottom row). Externalized myc tag is readily detected, and again demonstrates a punctate distribution. Thus, the main result is that transient, siRNA-mediated TUG depletion causes marked incorporation of GLUT4 into the plasma membrane in unstimulated 3T3-L1 adipocytes.
Figure 2.
Effect of siRNA-mediated TUG depletion on GLUT4 distribution. a. 3T3-L1 adipocytes stably expressing a myc- and GFP-tagged GLUT4 protein (ref. 13) were electroporated with luciferase siRNA (control) or with siRNA duplex B (TUG siRNA), then seeded to coverslips. 48 h after transfection, cells were starved, treated with or without 160 nM insulin for 15 min., then chilled to 4°C and stained to detect externalized myc epitope. Images were acquired by confocal microscopy of GFP (total GLUT4) and myc epitope (surface GLUT4). GLUT4 present at the plasma membrane is highlighted by arrows; n indicates the position of the nuclei. Scale bar, 10 μm. Similar results were obtained in two independent experiments.
To perform more detailed analyses, we constructed 3T3-L1 cells in which TUG is stably depleted by retroviral expression of a short hairpin RNA (shRNA). This shRNA targets the same sequence as TUG siRNA duplex B, described above. We isolated a homogeneous population of infected 3T3-L1 preadipocytes by flow cytometry. These “shRNA” cells undergo normal adipose differentiation, as judged by lipid accumulation and expression of GLUT4, compared to control, uninfected 3T3-L1 cells. Fig. 3a demonstrates that TUG is depleted by >95% in adipocytes containing the shRNA. To further control for the specificity of TUG depletion, the shRNA cells were superinfected with a retrovirus containing a shRNA-resistant form of TUG, to make “shRNA+TUG” cells. These cells were also isolated by flow sorting and undergo normal adipose conversion. Fig. 2a shows that the reintroduced TUG protein is present in amounts that are approximately fivefold higher than that of endogenous TUG in control, uninfected 3T3-L1 adipocytes. As well, amounts of GLUT4 are similar or slightly decreased in shRNA cells, and markedly increased in shRNA+TUG cells, suggesting that GLUT4 abundance may be regulated by TUG protein levels. No large effect on GLUT1 protein amounts is observed. Thus, data from both stable and transiently transfected 3T3-L1 adipocytes suggest that TUG abundance may positively regulate GLUT4 protein amount, as examined further below.
Figure 3.
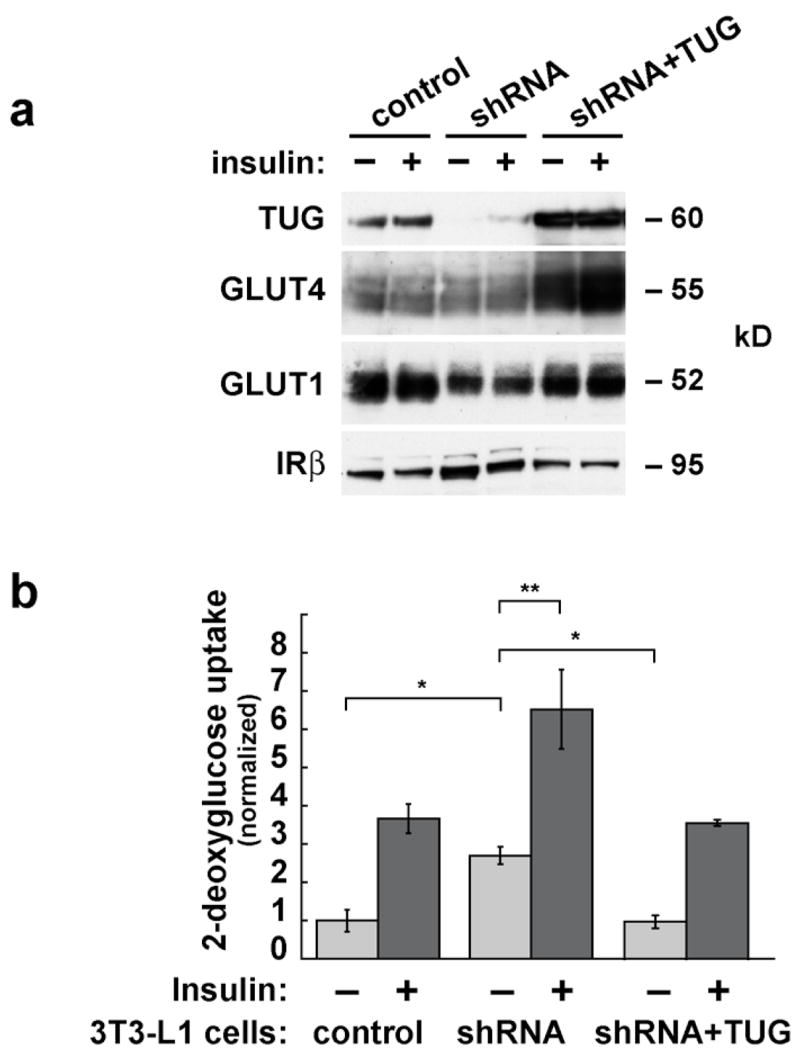
Effects of stable shRNA-mediated TUG depletion on glucose uptake. a. TUG was depleted stably in 3T3-L1 cells using a shRNA-producing retrovirus to make “shRNA cells”. Wildtype, shRNA-resistant TUG was expressed stably in the shRNA cells using a second retrovirus to make “shRNA+TUG cells”. Homogeneous populations of cells were isolated by flow sorting, and adipose differentiation was induced. Control, shRNA, and shRNA+TUG 3T3-L1 adipocytes were analyzed by immunoblotting to demonstrate depletion and reintroduction of TUG, and to assess relative amounts of GLUT4 and GLUT1. Insulin receptor β chain is immunoblotted as a loading control. b. Control, shRNA, and shRNA+TUG 3T3-L1 adipocytes were differentiated on multiwell plates, and glucose uptake assays were performed. Counts of [3H]-2-deoxyglucose were normalized to the amounts of protein present in the wells, and are plotted relative to the uptake in unstimulated control cells. Error bars show standard deviation (* indicates p<0.002; ** indicates p<0.01). For each part of the figure, consistent results were obtained in three independent experiments.
We first tested the effect of stable TUG depletion on glucose uptake. Fig. 3b shows that unstimulated 3T3-L1 adipocytes containing the shRNA have increased glucose uptake compared to control cells. This increased basal glucose uptake is nearly equal to that caused by insulin treatment of the control cells. Insulin further enhances glucose uptake in cells depleted of TUG, but only by about twofold because of the increased basal uptake. The enhanced glucose uptake in the shRNA cells is not attributable to increased GLUT1 or GLUT4 protein amounts, which are similar or slightly decreased in shRNA cells compared to control cells, as noted above (Fig. 3a). Reintroduction of shRNA-resistant TUG rescues the effect on glucose uptake, indicating that it results from TUG depletion and is not a nonspecific effect of the shRNA. Remarkably, glucose uptake in shRNA+TUG cells is similar to that in control cells even despite the markedly increased GLUT4 abundance in shRNA+TUG cells (Fig. 3a). This may reflect the ability of overexpressed TUG to retain GLUT4 within cells, sequestering it away from the plasma membrane (ref. 15, Fig. 4a). Finally, it is notable that the variability in glucose uptake measurements is much smaller in stable cells (Fig. 3b) than in electroporated cells (Fig. 1b), permitting the observation of a significant effect of insulin to enhance glucose uptake in the shRNA cells. Thus, both stable and transient depletion of TUG result in increased glucose uptake in unstimulated 3T3-L1 adipocytes, and in neither case is this attributable to increased amounts of GLUT4 or GLUT1 proteins.
Figure 4.
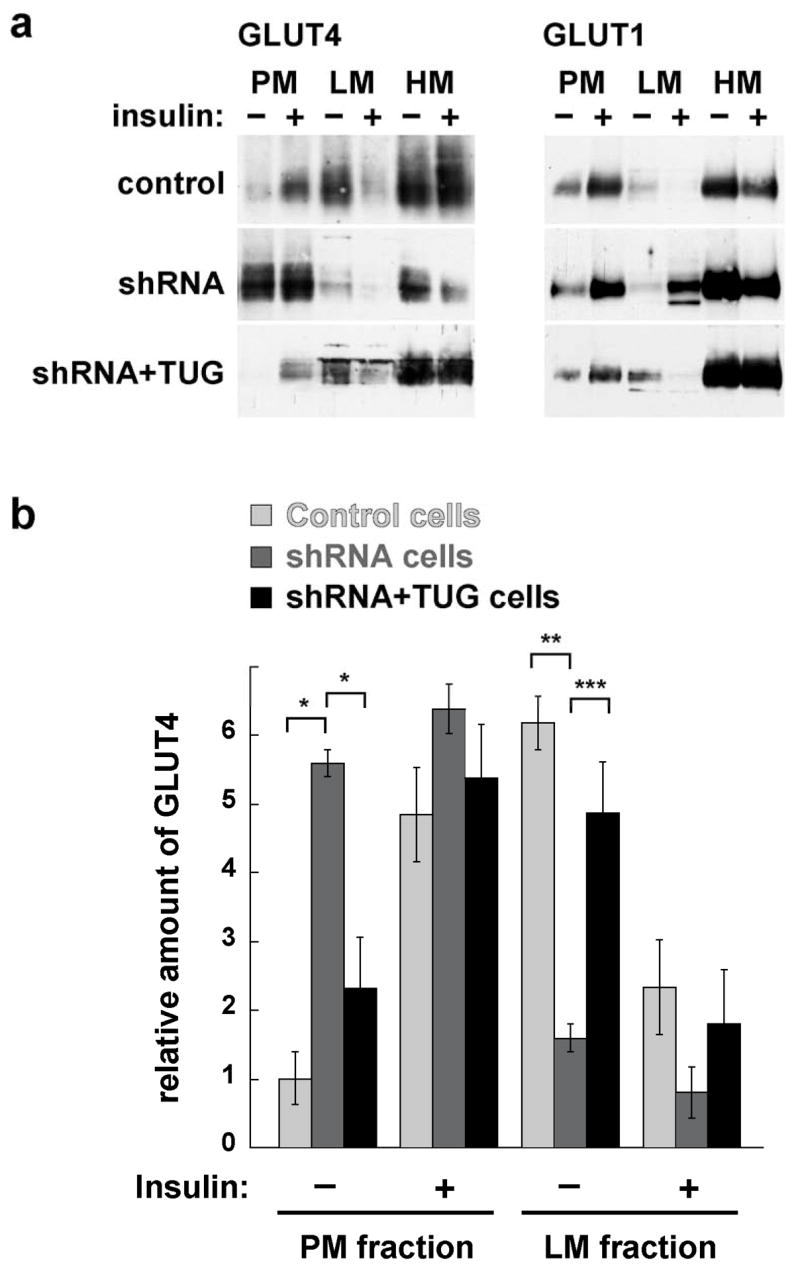
Effects of shRNA-mediated TUG depletion on GLUT4 and GLUT1 distribution. a. Control, shRNA, and shRNA+TUG 3T3-L1 adipocytes were treated with insulin as indicated. Cells were homogenized and plasma membrane (PM), light microsome (LM), and heavy microsome (HM) fractions were isolated. Equal amounts of protein from each fraction were analyzed by immunoblotting to detect GLUT4 and GLUT1, as indicated. b. PM and LM GLUT4 from four independent fractionation experiments, each similar to that shown in part (a), were quantified by densitometry. Error bars show standard error. * indicates p<0.0006, ** indicates p<0.006, and *** indicates p<0.04.
To study the effect of the TUG shRNA on glucose transporter distribution, we performed subcellular fractionation of basal and insulin stimulated control, shRNA, and shRNA+TUG 3T3-L1 adipocytes. As shown in Fig. 4a, insulin increases GLUT4 in plasma membranes of control cells, and there is a corresponding decrease of GLUT4 in light microsomes (top left panel). In shRNA cells, GLUT4 is abundant in plasma membranes, and is relatively decreased in light microsomes, both in basal and insulin treated cells (middle left panel). Some GLUT4 remains in basal light microsomes and is decreased by insulin, but this effect is less marked than in control cells and may be due to endosome recycling. In the shRNA+TUG cells, reintroduction of TUG rescues both basal GLUT4 retention in light microsomes, and insulin stimulated GLUT4 movement to the plasma membrane (bottom left panel). Therefore these effects are due to TUG depletion and not nonspecific effects of the shRNA. As predicted by data in Fig. 3, GLUT4 is very well excluded from plasma membranes of basal shRNA+TUG cells. Immunoblotting of the fractions to detect GLUT1 demonstrates that in control cells, insulin causes some movement of GLUT1 out of light microsomes and to the plasma membrane (top right panel), consistent with previous data (22). TUG depletion slightly enhances GLUT1 targeting to plasma membranes in basal 3T3-L1 adipocytes. This effect is rescued by reintroduction of TUG, and is thus due to TUG depletion, yet it is much less marked than the effect on GLUT4 targeting (middle and bottom right panels). Insulin stimulates an approximately twofold further increase in plasma membrane GLUT1 in shRNA cells, and also appears to increase GLUT1 in light microsomes. Overall, depletion of TUG by a stably expressed shRNA has a large effect on GLUT4 targeting, and much smaller effect on GLUT1 targeting, in 3T3-L1 adipocytes. The main effect is marked redistribution of GLUT4 out of light microsomes and to the plasma membrane in the absence of insulin.
To quantify the effect of the TUG shRNA on GLUT4 distribution, immunoblots from several experiments were analyzed by densitometry. No large effects of TUG depletion on heavy microsomal GLUT4 were observed, thus only plasma membrane and light microsome fractions from basal and insulin stimulated cells were included in this analysis. Fig. 4b shows that TUG depletion significantly increases GLUT4 in plasma membranes, and decreases GLUT4 in light microsomes, in unstimulated 3T3-L1 adipocytes. No significant effects were observed in insulin stimulated cells. Together with the results above, the data are consistent with the notion that TUG depletion redistributes GLUT4 from light microsomes to the plasma membrane, and that this is sufficient to increase glucose uptake in unstimulated 3T3-L1 adipocytes.
We studied the effect of a dominant inhibitory fragment of TUG, UBX-Cter, using 3T3-L1 adipocytes stably expressing this protein. Previous data suggest that this fragment prevents GLUT4 retention in an intracellular, insulin-responsive pool of GSVs within unstimulated 3T3-L1 adipocytes (15). Thus it was anticipated that expression of UBX-Cter and RNAi-mediated TUG depletion may have similar effects. Results from glucose uptake experiments, shown in Fig. 5a, support this prediction. The data show that UBX-Cter expression substantially increases glucose uptake in unstimulated 3T3-L1 adipocytes, such that it is indistinguishable from that of insulin treated control cells. Insulin further increases glucose uptake in cells containing UBX-Cter, but only by about twofold because of the enhanced basal uptake. As shown in Fig. 5b, there is at most a minor increase in GLUT1 amount, and no change in GLUT4 amount, in UBX-Cter cells compared to control cells. Thus, altered glucose transporter abundance cannot account for the markedly enhanced glucose uptake observed in UBX-Cter cells, consistent with the notion that UBX-Cter may enhance glucose uptake by targeting GLUT4 to the plasma membrane.
Figure 5.
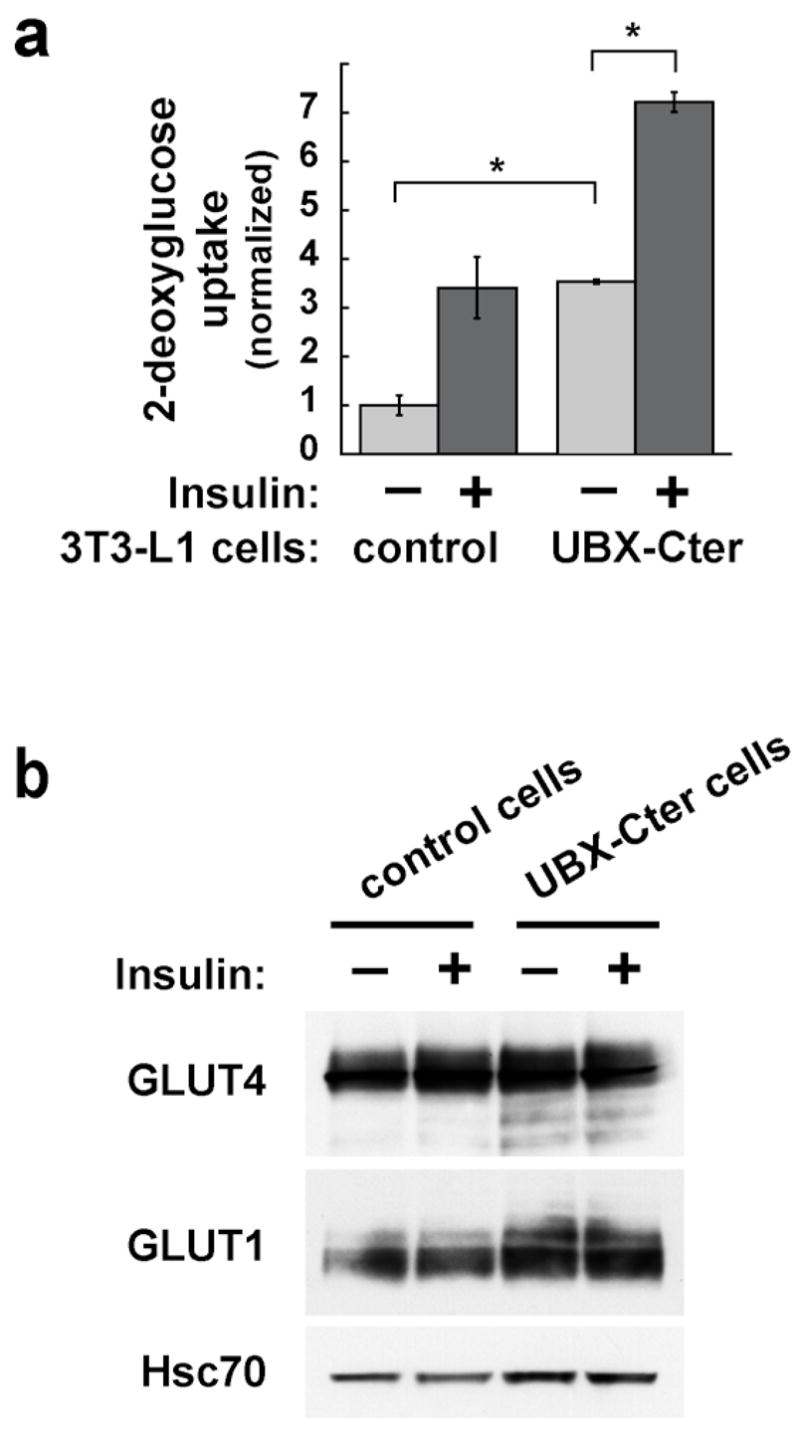
Effects of UBX-Cter, a dominant negative TUG protein fragment, on glucose uptake. a. 3T3-L1 adipocytes stably expressing UBX-Cter and control cells were differentiated in multiwell plates and used for glucose uptake experiments. Counts of [3H]-2-deoxyglucose were normalized to the amounts of protein present in the wells, and are plotted relative to the uptake in unstimulated control cells. Error bars show standard deviation (* indicates p<0.0001). Similar results were obtained in four independent experiments. b. Immunoblots of cell lysates from the glucose uptake assay were done to assess the relative amounts of GLUT4 and GLUT1. Hsc70 is immunoblotted as a loading control. The experiment was repeated twice with consistent results.
We further characterized the effect of the UBX-Cter fragment on GLUT4 and GLUT1 distribution by performing subcellular fractionation of 3T3-L1 adipocytes. Fig. 6a shows that GLUT4 is markedly increased in plasma membranes prepared from unstimulated cells containing UBX-Cter (top panel). There is some further increase after insulin treatment, however this is minimal because of the abundant basal amount. In unstimulated cells, UBX-Cter decreases the amount of GLUT4 in light microsomes, suggesting that some of the increased plasma membrane GLUT4 originates from these membranes. Insulin further reduces GLUT4 in light microsomes of UBX-Cter expressing cells, yet this is a small effect that may be due to endosome recycling. Similar findings are noted for GLUT1, although the effect on plasma membrane GLUT1 is much less marked because of the abundance of GLUT1 in plasma membranes from unstimulated cells (middle panel). Expression of the UBX-Cter fragment had no large effect on heavy microsome GLUT4 or GLUT1. In Fig. 6b, the effects on GLUT4 are quantified, based on densitometry of several experiments. These data show that UBX-Cter significantly increases GLUT4 in plasma membranes, and decreases GLUT4 in light microsomes, from unstimulated 3T3-L1 adipocytes. These results are consistent with previous microscopy data suggesting that GLUT4 and TUG colocalize in GSVs, as well as with previous kinetic data suggesting that the TUG UBX-Cter fragment prevents the basal accumulation of GLUT4 in GSVs (15). Indeed, data presented here demonstrate a more marked effect on basal GLUT4 distribution to the plasma membrane. The flow cytometric assay used previously is better suited to kinetic measurements, and the increase in cell surface GLUT4 that was observed was likely underestimated because of the significant background fluorescences inherent in the assay. Data shown here suggest that the fragment not only blocks the retention of GSVs, but also further indicate that this is sufficient to target GLUT4 to the plasma membrane and to enhance glucose uptake in unstimulated 3T3-L1 adipocytes.
Figure 6.
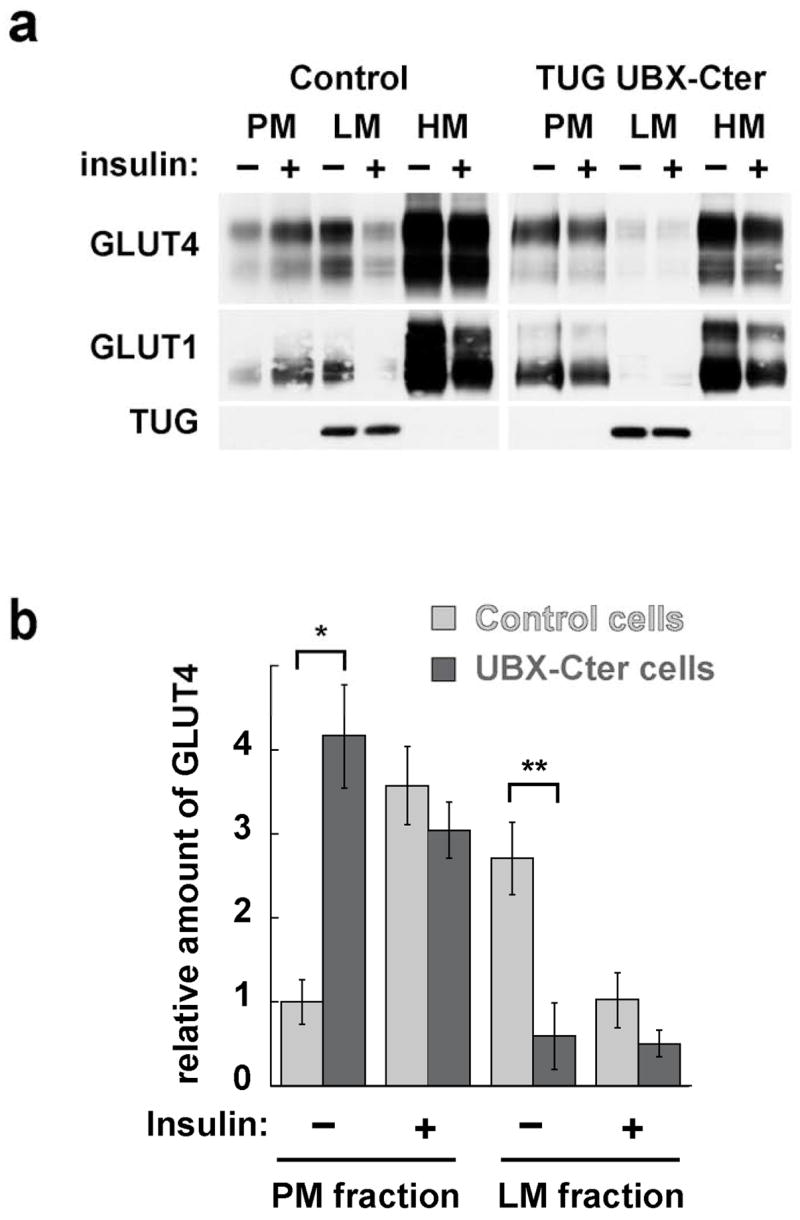
Effects of UBX-Cter on GLUT4 and GLUT1 distribution in 3T3-L1 adipocytes. a. Plasma membrane (PM), light microsome (LM), and heavy microsome (HM) fractions were purified from basal and insulin stimulated cells containing UBX-Cter, and from control cells. All cells contained the GLUT4-7myc-GFP reporter protein. Immunoblots were performed on equal amounts of each fraction to detect the GLUT4 reporter and endogenous TUG (top panels), GLUT1 (middle panels), and TUG (bottom panels). b. PM and LM GLUT4 from four independent fractionation experiments, each similar to that shown in part (a), were quantified by densitometry. Error bars show standard error. * indicates p<0.007, ** indicates p<0.001.
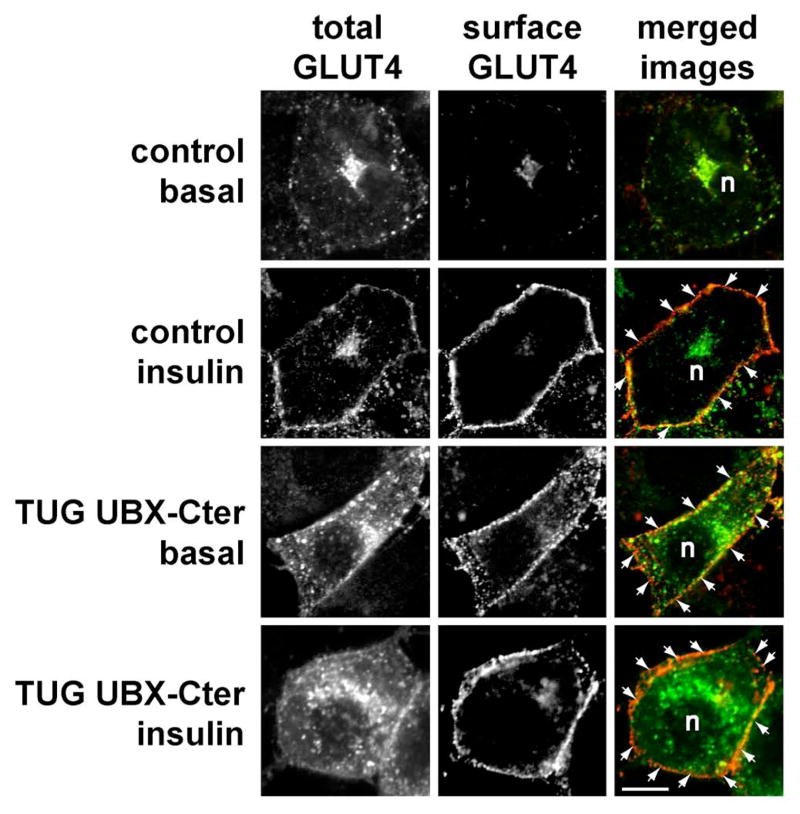
Confocal microscopy results are consistent with this interpretation. Fig. 7 shows the distribution of stably expressed myc- and GFP-tagged GLUT4 in control 3T3-L1 adipocytes and in cells expressing the dominant negative UBX-Cter fragment. In control cells, insulin causes the appearance of a homogeneous rim of GLUT4 at the plasma membrane. The incorporation of GLUT4 into the plasma membrane is demonstrated by staining of externalized myc epitope tag in the intact cells (second row). In cells containing UBX-Cter, there is clear targeting of GLUT4 to the plasma membrane of unstimulated cells (third row). In these cells, the GLUT4 is incorporated into the plasma membrane, since extracellular myc tag can be detected. The plasma membrane GLUT4 is more punctate in appearance than in insulin stimulated control cells, particularly as assessed by GFP, similar to findings with TUG siRNA (Fig. 2). After insulin stimulation, the UBX-Cter cells have a slightly more homogeneous rim of GLUT4 at the cell surface (bottom row). As discussed below, this finding is consistent with the notion that insulin stimulates fusion of vesicles containing GLUT4 with the plasma membrane, which may also account for the twofold further increase in glucose uptake upon insulin stimulation of cells containing UBX-Cter. Overall, the data show that UBX-Cter causes targeting and incorporation of substantial GLUT4 into the plasma membrane. Together with results above, we conclude that the effect of the dominant negative TUG UBX-Cter fragment on GLUT4 is equivalent to that of RNAi-induced TUG depletion. Both cause GLUT4 targeting to the plasma membrane, and this is sufficient to augment glucose uptake in 3T3-L1 adipocytes.
Figure 7.
Effect of UBX-Cter on GLUT4 distribution. Control and UBX-Cter expressing 3T3-L1 adipocytes containing a myc- and GFP-tagged GLUT4 reporter were starved, treated with or without 160 nM insulin for 15 min., then chilled to 4°C and stained to detect externalized myc epitope. Images were acquired by confocal microscopy of GFP (total GLUT4) and myc epitope (surface GLUT4). GLUT4 present at the plasma membrane is highlighted by arrows; n indicates the position of the nuclei. Scale bar, 10μm. Similar results were obtained in two independent experiments.
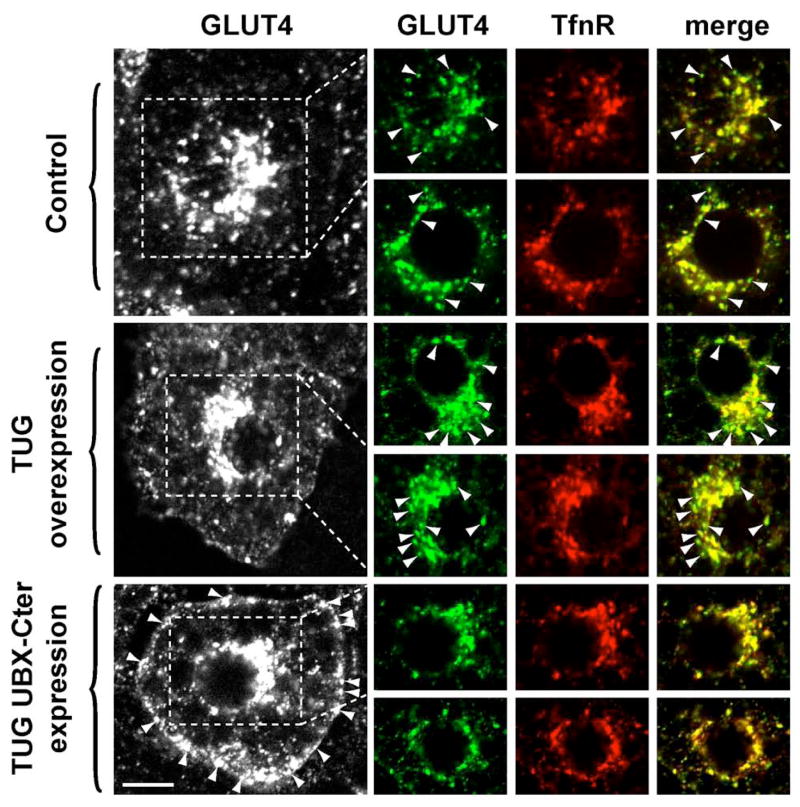
To further test if TUG controls the basal accumulation of GLUT4 in a nonendosomal, perinuclear compartment, we performed confocal microscopy of unstimulated 3T3-L1 adipocytes. Our previous data show that TUG colocalizes with GLUT4, and not with the endosomal marker TfnR, on intracellular membranes of unstimulated 3T3-L1 cells (15). Here, we examined the distributions of GLUT4 and TfnR in the perinuclear region of cells overexpressing TUG, or expressing UBX-Cter fragment. Fig. 8 shows that in control cells, despite the substantial overlap of GLUT4 and TfnR, membranes that contain GLUT4 and lack appreciable TfnR are readily visualized (arrowheads, first and second rows). These membranes correspond to nonendosomal vesicles containing GLUT4. When TUG is overexpressed, these GLUT4-positive, TfnR-negative membranes are much more prominent (arrowheads, third and fourth rows). This suggests expansion of a nonendosomal pool of GLUT4 in cells overexpressing TUG. By contrast, when UBX-Cter is expressed, the GLUT4-positive, TfnR-negative vesicles are essentially undetectable (fifth and sixth rows). In these cells, GLUT4 is targeted to the plasma membrane, as noted above (Fig. 7 and bottom left panel of Fig. 8). Strikingly, the remaining intracellular GLUT4 overlaps completely with TfnR. These findings suggest that UBX-Cter mediated disruption of TUG function results in targeting of GLUT4 to endosomes. Together with data shown above, we conclude that TUG overexpression and TUG UBX-Cter expression have opposite effects. TUG overexpression enhances the normal accumulation of GLUT4 in intracellular, nonendosomal membranes, concurrent with its sequestration away from the plasma membrane. UBX-Cter expression disrupts this action, so that GLUT4 distribution is similar to that of TfnR-containing endosomes and GLUT4 is targeted to the plasma membrane.
Figure 8.
Effects of TUG overexpression or UBX-Cter expression on distribution of perinuclear GLUT4. Unstimulated 3T3-L1 adipocytes containing GFP-tagged GLUT4 were starved, fixed and permeablized, and stained by indirect immunofluorescence to detect transferrin receptor (TfnR), an endosomal marker. Control cells, cells overexpressing intact TUG, and cells expressing TUG UBX-Cter were used as indicated. At left, the distribution of GLUT4-GFP in representative cells is shown, and arrowheads indicate GLUT4 at the plasma membrane. The indicated perinuclear regions, as well as similar regions from an additional example from each group of cells, are shown at right. Images of GLUT4 (green), TfnR (red), and merged images are presented. The overlap of GLUT4 and TfnR appears as yellow in the merged images. Arrowheads indicate perinuclear GLUT4 that does not colocalize with TfnR.
We hypothesized that the effects on GLUT4 targeting we observed may have secondary consequences for GLUT4 protein stability. Previous work indicates that GLUT4 is degraded mainly by lysosomes (14). Therefore we considered that TUG-mediated retention of GLUT4 in nonendosomal, intracellular membranes may sequester GLUT4 away from lysosomes, as well as from the plasma membrane, thus prolonging GLUT4 half-life. This possibility was suggested by the decreased GLUT4 we observed after siRNA-mediated TUG depletion in 3T3-L1 adipocytes (Fig. 1c). In this transient experiment, done using fully mature 3T3-L1 adipocytes, potential effects of TUG disruption on 3T3-L1 differentiation would not be expected to play a role. The proposed mechanism may also contribute to the increased GLUT4 observed in stable 3T3-L1 cells overexpressing TUG, as in shRNA+TUG cells (Fig. 3a).
To test this hypothesis, we first sought to determine more definitively if siRNA-mediated TUG depletion affects GLUT4 protein abundance, independently of GLUT4 mRNA abundance. We reasoned that an effect on GLUT4 protein stability might be most dramatic in cells not exposed to insulin, because GLUT4 targeting is most affected by TUG disruption in unstimulated cells. Accordingly, cells were transfected with TUG siRNA B or with a control siRNA, then cultured in the absence of insulin or serum for 24 h before analysis of GLUT4 protein (by immunoblotting) and mRNA (by quantitative, real-time PCR). As shown in Fig. 9a, TUG knockdown causes a dramatic decrease in GLUT4 protein abundance. This is not accompanied by a decreased GLUT4 mRNA amount, which is unchanged as shown in Fig. 9b. The overall decrease in GLUT4 protein amount is about 60%, as assessed by densitometry of immunoblots (Fig. 9c). Finally, control experiments show that the TUG siRNA depleted TUG mRNA and protein similarly, by about 80% (Figs. 9d and 9e). To facilitate measurement of GLUT4, the experiment shown was done using cells that stably express the GLUT4 reporter, which is about fivefold more abundant than native GLUT4 and contains a myc epitope tag. Similar results were obtained for endogenous GLUT4 mRNA and protein in 3T3-L1 adipocytes not expressing the reporter. Finally, the decrease in GLUT4 protein is slightly more marked in Fig. 9 than in Fig. 1c, possibly because cells in Fig. 9 were starved for a longer period of time. In conclusion, TUG depletion can cause decreased GLUT4 protein abundance, independent of any change in GLUT4 mRNA amount.
Figure 9.
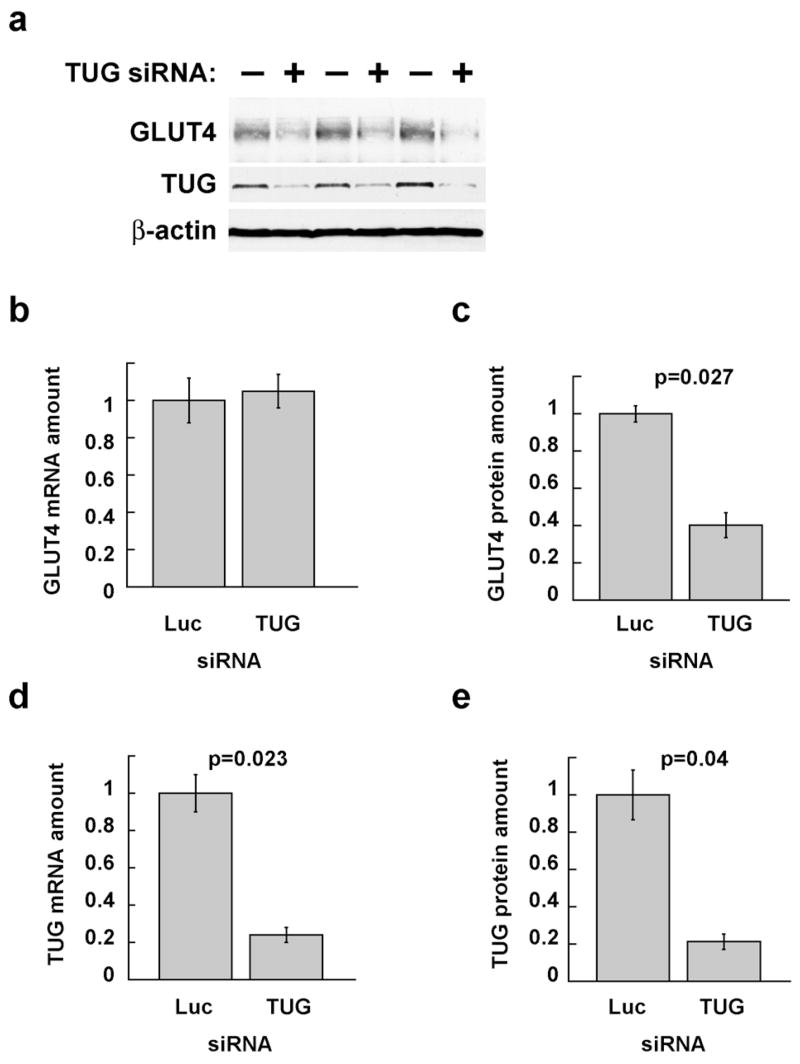
Effects of siRNA-mediated TUG depletion on GLUT4 mRNA and protein abundance. 3T3-L1 adipocytes stably expressing the GLUT4 reporter were electroporated with siRNA duplexes targeting TUG (duplex B) or, as a control, luciferase (which is not present in the cells). Cells were serum starved beginning 24 h after transfection, then duplicate plates were lysed in sample buffer (for protein analysis by SDS-PAGE and immunoblotting) or TRIzol reagent (for mRNA analysis by quantitative, real-time PCR (QPCR)). a. Triplicate samples were immunoblotted to detect GLUT4 reporter (using anti-myc antibody), endogenous TUG, and, as a control, β-actin, as indicated. Similar results were obtained for endogenous GLUT4 in cells not expressing the reporter. b. Samples treated in parallel to those shown in part a were subjected to QPCR to measure the abundance of GLUT4 reporter mRNA, plotted relative to that in control cells. Similar results were obtained for endogenous GLUT4. c. Immunoblots of GLUT4 in part a were subjected to densitometry, and band intensity is plotted relative to control cells. d. QPCR was done to measure the abundance of TUG mRNA, and is plotted relative to control cells. e. Immunoblots of TUG in part a were analyzed by densitometry, and band intensity is plotted relative to that in control cells. Error bars show standard error, and p values were calculated using a paired, two-tailed t test. The experiment shown was repeated three times with similar results.
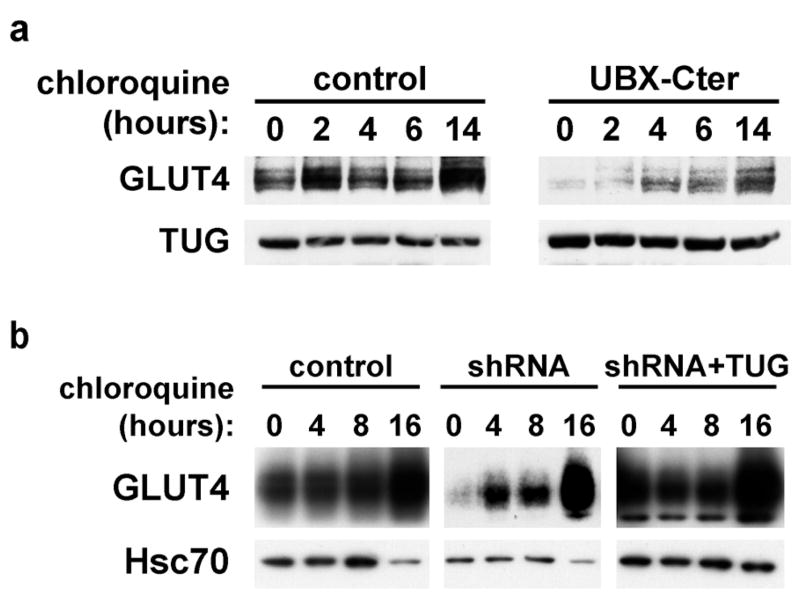
The decreased abundance of GLUT4 protein after TUG depletion could result from decreased GLUT4 translation, increased GLUT4 degradation, or both. As described above, we hypothesized that loss of TUG-mediated retention may enhance GLUT4 trafficking to lysosomes, and consequently increase the rate of GLUT4 degradation. The rate of GLUT4 degradation in lysosomes can be revealed by the increase in GLUT4 abundance after chloroquine addition, since this drug inhibits GLUT4 lysosomal degradation (14). Therefore, to test if dominant negative UBX-Cter fragment accelerates GLUT4 lysosomal degradation, 3T3-L1 adipocytes containing this fragment were treated with chloroquine for various amounts of time. As in Fig. 9, we reasoned that effects might be most dramatic in unstimulated cells. Therefore, to minimize insulin stimulation, cells were cultured in 0.5% fetal bovine serum before and during chloroquine addition. As shown in Fig. 10a, chloroquine treatment modestly increases GLUT4 in control cells, and this is detected after long (14 h) incubation with this drug (top left panel). This finding is consistent with the relatively slow rate of GLUT4 turnover in unstimulated 3T3-L1 adipocytes, as described previously (23). In cells containing UBX-Cter, chloroquine treatment much more markedly increases GLUT4 protein, and this effect is observed as soon as 4 h after its addition (top right panel). Control immunoblots demonstrate that chloroquine has no large effect on TUG itself (bottom panels). Of note, TUG is likely degraded primarily by the proteasome, since it is mostly cytosolic and contains ubiquitin-like domains. Thus, the data support the hypothesis that UBX-Cter expression accelerates GLUT4 degradation in lysosomes.
Figure 10.
Effect of chloroquine on GLUT4 accumulation in 3T3-L1 cells. a. Control cells and cells containing TUG UBX-Cter were treated with chloroquine for the indicated amounts of time. Cells were lysed and equal amounts of total protein were analyzed by immunoblotting to detect GLUT4 and TUG, as indicated. The experiment was repeated twice, with consistent results. b. Control, shRNA, and shRNA+TUG 3T3-L1 adipocytes were treated with chloroquine as indicated. Cells were lysed and equal amounts of total protein were analyzed by immunoblotting to detect GLUT4 and Hsc70, as indicated. Similar results were obtained in two independent experiments.
To further test if lysosomal GLUT4 degradation is accelerated by shRNA-mediated TUG depletion, and decelerated by TUG overexpression, similar experiments were done with chloroquine treatment of control cells, shRNA cells, and shRNA+TUG cells. Fig 10b shows that in control cells, chloroquine addition causes a gradual increase in GLUT4 abundance, most marked at 16 h, consistent with previously described rates of GLUT4 turnover (top left panel) (14,23). In shRNA cells, chloroquine induces a larger and more rapid increase in GLUT4, suggesting that lysosomal GLUT4 degradation is more rapid in these cells (top center panel). Conversely, when TUG is overexpressed, in shRNA+TUG cells, the change in GLUT4 abundance is minimal, indicating a reduced rate of GLUT4 lysosomal degradation (top right panel). Control immunoblots show no effect of TUG depletion or overexpression on Hsc70 abundance, which is slightly decreased at the 16 h timepoint in all cases (bottom panels). Together, the data are consistent with a model in which TUG normally acts to sequester GLUT4 away from the plasma membrane in the absence of insulin, and that, in doing so, it also prevents GLUT4 trafficking to lysosomes and consequent degradation. TUG depletion or dominant negative fragment disrupt these actions to cause both enhanced glucose uptake and accelerated lysosomal GLUT4 degradation. Reintroduction of TUG in the shRNA cells not only restores highly insulin-responsive glucose uptake, but also (since the reintroduced protein is overexpressed) prolongs the half-life of GLUT4 proteins.
To study the interaction of TUG and GLUT4, we produced recombinant TUG and GLUT4 proteins. For GLUT4, the large intracellular loop between transmembrane segments 6 and 7 (TM6-7) was produced as a GST fusion, and GST alone and fused to the TM6-7 loop of GLUT1 were used as controls. Proteins were incubated together, then bound TUG was assayed by immunoblotting. As shown in Fig. 11a, intact TUG binds specifically to the loop of GLUT4, and interacts minimally or not at all with that of GLUT1 or with GST alone. On darker exposures of the film, some interaction with the GLUT1 loop is detectable over the GST alone control, yet this is clearly lower affinity than the interaction with the GLUT4 loop. These data are consistent with previous results showing that TUG binds GLUT4, and not GLUT1, in coimmunoprecipitations using transfected cells (15). Similar results using recombinant proteins were also obtained by X. Huang and coworkers (X. Huang, A. Rudich, N. Wijesekara, P. Bilan, J. Bogan, and A. Klip. Abstract 226, Keystone Symposium on Diabetes Mellitus, Banff, Canada, 2004).
Figure 11.
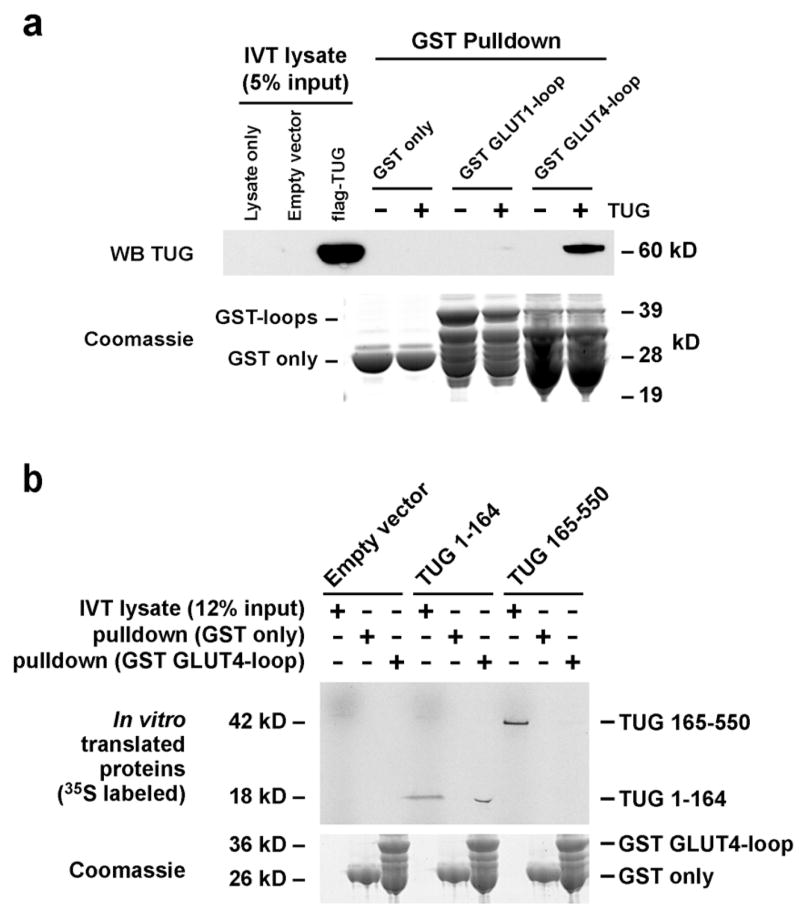
Binding of recombinant TUG and GLUT4 proteins. a. GST alone, or fused to the large intracellular loop of GLUT1 or GLUT4 was produced in bacteria and immobilized on a glutathione support. Recombinant flag-tagged TUG was produced using the Roche RTS system, and incubated with the immobilized GST proteins. Bound proteins were eluted and analyzed by SDS-PAGE and western blotting. IVT, in vitro translation. b. GST alone or GST-GLUT4loop was incubated with 35S-labeled, untagged TUG fragments (residues 1–164 or 165–550) produced by in vitro translation. Bound proteins were eluted and analyzed by SDS-PAGE and autoradiography. The experiments shown were repeated twice, with consistent results.
To identify an interacting region on TUG, residues 1–164 or 165–550 were produced in vitro, and incubated with GST alone or fused to the TM6-7 loop of GLUT4. Fig. 11b demonstrates that a TUG fragment containing residues 1–164, but not 165–550, binds directly and specifically to the GLUT4 loop. These data are consistent with previous findings that deletion of residues 1–164 inhibit the ability of TUG to efficiently retain GLUT4 within cotransfected 293 cells (Fig. 4b of ref. 15). Previous data also show that deletion of residues 1–77 has no effect on the ability of TUG to retain GLUT4 intracellularly or to coimmunoprecipitate GLUT4 in transfected 293 cells (Figs. 2a and 4b of ref. 15). Thus, the GLUT4 loop likely interacts directly with TUG residues 78–164.
These data strengthen and expand upon previous results, which suggested that two independent interactions may be required to mediate high affinity binding of TUG and GLUT4. Data show that forms of TUG containing truncations of the amino terminus to residue 270 are still able to partially retain GLUT4 within 293 cells, and are also able to coimmunoprecipitate GLUT4 when both proteins are overexpressed (Figs. 4b and 4c of ref. 15). Therefore one interaction between TUG and GLUT4 is predicted to involve TUG residues 270–376. This interaction may be direct or indirect, and the required residues in GLUT4 are not known. The second interaction, characterized here, is direct and involves TUG residues 1–164 (and probably 78–164, as noted above) together with the large intracellular loop of GLUT4. Together, the data are consistent with a model in which both interactions are required for high affinity binding and efficient intracellular retention of GLUT4 by TUG.
DISCUSSION
The data presented here show that TUG is an essential regulator of GLUT4 targeting and of glucose uptake in 3T3-L1 adipocytes. In unstimulated cells, TUG is required to sequester GLUT4 glucose transporters in intracellular membranes. Disruption of TUG function, by RNAi or by a dominant negative fragment, leads to marked GLUT4 redistribution out of light microsomes, where both TUG and insulin responsive GLUT4 reside in unstimulated control cells. The GLUT4 is distributed to the cell surface, and enhances glucose uptake. Insulin has some additional effect to increase glucose uptake in cells with stable disruption of TUG, but this is only about twofold because of the large effect on basal glucose uptake. Previous data show that insulin stimulates the rapid dissociation of TUG and GLUT4, and that this precedes marked GLUT4 movement out of light microsomes (13,15). Thus, it may be that the insulin stimulated dissociation of TUG and GLUT4 accounts for a large proportion of the overall action of insulin to enhance glucose uptake.
The precise point at which TUG acts to control GLUT4 distribution remains poorly defined. Previous data are consistent with a role in targeting GLUT4 to GSVs, or in retaining GSVs intracellularly in the absence of insulin, or in both of these processes (15). The data do not exclude the possibility that TUG functions in GLUT4 endocytosis or at some other step in the recycling pathway. Yet, based on previous data, these possibilities seem less likely because: 1) the amount of GLUT4 that is rapidly translocated by insulin correlates with the amount of GLUT4 that dissociates from TUG. Both amounts are increased by TUG overexpression and decreased by TUG UBX-Cter expression. 2) TUG colocalizes with GLUT4 in intracellular, light microsomal membranes that are distinct from endosomes. These properties are shared by GSVs. 3) TUG binds with higher affinity to GLUT4 than to GLUT1. This specificity is similar to that described for insulin-responsive translocation (22). Thus, the simplest model to account for previous data is that TUG participates in trafficking of GLUT4 through GSVs and controls the accumulation of a pool of GSVs in unstimulated cells. The new data presented here fully support this model. Other, more complicated models for TUG action are not excluded, but are much less likely. Therefore, the present data are discussed in the context of a model in which TUG regulates an insulin-responsive, intracellular GLUT4 pool.
GLUT4 translocation to the cell surface comprises several steps, and insulin may act at one or more points to govern GSV production and disposition. Insulin enhances the production of GSVs from donor membranes by about 50%, and this effect may be particularly important for sustained insulin action (9). In unstimulated cells, GLUT4 in these GSVs is retained intracellularly, and resides in a perinuclear location in 3T3-L1 adipocytes. A major action of insulin is to mobilize this pool of GLUT4. The mechanism by which GLUT4 is retained within unstimulated cells is not understood. One possibility is that TUG and other proteins tether GLUT4 in GSVs to some intracellular structure (15). Candidate anchoring proteins to which TUG may link GLUT4 include p115 and Golgin-160 (24,25). Such anchoring proteins are predicted to bind the TUG C terminus, a region distinct from that which binds GLUT4 (15). A second possibility is that in unstimulated cells, TUG may constrain an intracellular cycle in which GSVs fuse with, and rebud from, endosome or TGN membranes (1,11,12,26). Insulin may redirect these vesicles into a plasma membrane recycling pathway by disrupting the TUG•GLUT4 interaction (15,27). A third possibility is that in the absence of insulin, TUG restricts the association of GLUT4 with kinesin motors, which upon insulin addition carry the transporters toward the plasma membrane (28,29). These possibilities are not mutually exclusive, and present data do not distinguish among them. Present data do show that TUG disruption and insulin stimulation have effects that are similar in magnitude. Thus if TUG mediates the intracellular retention of GSVs, by any of the above mechanisms, then dissociation of TUG and GLUT4 may be an important action by which insulin releases these vesicles to the plasma membrane.
We do not know if the vesicles mobilized to the cell surface by TUG disruption are identical to those mobilized by insulin stimulation. It could be that TUG functions primarily as a sorting adaptor to target GLUT4 to GSVs. Then, in unstimulated cells in which TUG is disrupted, GLUT4 may move to the cell surface in the membranes from which GSVs are normally derived. These could be endosomes or TGN membranes. The possibility that TUG is a sorting adaptor is fully compatible with the possibility that TUG more directly mediates basal intracellular retention of GLUT4, perhaps by one of the mechanisms described above. The selective incorporation of GLUT4 into GSVs and the basal, intracellular retention of these vesicles may be processes that are mechanistically coupled.
In addition to acting at an intracellular site to mobilize GSVs, insulin acts at the plasma membrane to accelerate the fusion of vesicles containing GLUT4 (30). Indeed, insulin signals to regulators of SNARE complex formation that are present at the cell surface (31–33). Disruption of TUG likely does not impact directly on mechanisms controlling vesicle fusion at the plasma membrane, because TUG is not abundant in this location (15). Yet, by preventing the intracellular retention of GLUT4, TUG disruption is expected to increase the flux of GLUT4-containing vesicles arriving at the plasma membrane of unstimulated cells. The data show that this is largely sufficient to place GLUT4 in the plasma membrane and to enhance glucose uptake. Therefore the regulated fusion of GLUT4-containing vesicles at the plasma membrane is one point of control, which may be overcome to a large degree by mobilization of intracellular GLUT4 stores.
The ability of insulin to accelerate the fusion of GLUT4-containing vesicles at the plasma membrane may account for two other observations made here. First, in 3T3-L1 adipocytes in which TUG is stably disrupted by shRNA or UBX-Cter, insulin has a twofold further effect to enhance glucose uptake. This effect was not observed after transient, siRNA-mediated depletion of TUG, possibly because there is more variability in this measurement. The residual effect of insulin in stable shRNA or UBX-Cter cells may result from insulin-regulated fusion of vesicles containing GLUT4 (or GLUT1) at the plasma membrane. Effects of insulin on GLUT4 endocytosis may also contribute to this twofold effect. Second, a subtle, but reproducible, finding is that TUG disruption results in a more punctate, less homogeneous appearance of plasma membrane GLUT4-GFP compared to that observed in insulin stimulated control cells. Though several explanations for this effect are possible, it seems most likely that this pattern results from an accumulation of GLUT4-containing vesicles that are docked, but not fused, at the plasma membrane. The docked vesicles would mark sites of exocytosis, creating a more punctate appearance along the plasma membrane. In contrast, fusion of the vesicles after insulin stimulation of control cells permits lateral diffusion of GLUT4-GFP in the plasma membrane, so that a more homogeneous rim is observed by confocal microscopy.
The data support that UBX-Cter expression and TUG depletion are functionally equivalent, with respect to both GLUT4 trafficking and glucose uptake, in 3T3-L1 adipocytes. The UBX-Cter fragment is hypothesized to bind an (as yet unidentified) intracellular anchoring site to which intact TUG normally links GLUT4 in unstimulated cells, and to exclude intact TUG from this site. It may also interfere with the selective sorting of GLUT4 to GSVs, as described above. Previous data show that UBX-Cter expression blocks the formation of a protein complex containing endogenous TUG and GLUT4 (15). RNAi-mediated depletion of TUG would also prevent the formation of this complex. Data here show that TUG depletion increases GLUT4 at the plasma membrane, similar to UBX-Cter. Both siRNA transfection and UBX-Cter expression cause incorporation of GLUT4 into the plasma membrane, since the myc epitope tag is externalized in both cases. Light microsomal GLUT4 is similarly decreased in unstimulated shRNA cells and cells containing UBX-Cter. Finally, both TUG depletion and UBX-Cter expression markedly enhance basal glucose uptake. Thus, UBX-Cter expression and TUG depletion have indistinguishable effects on GLUT4 distribution and glucose uptake, implying that the dominant negative effect of UBX-Cter is equivalent to a null phenotype.
In the presence of insulin, glucose uptake is greater in 3T3-L1 adipocytes in which TUG is disrupted than in control cells in which TUG function is intact. In addition, GLUT4 is more dramatically redistributed by the combined effects of insulin and TUG shRNA or UBX-Cter, as compared to the effect of insulin alone. These findings are consistent with the proposal that insulin acts both to mobilize GSVs and to stimulate fusion of GLUT4 at the plasma membrane, and that TUG is required only at the former step. It has previously been shown that maximal insulin stimulation fails to mobilize the entire pool of sequestered GLUT4 in 3T3-L1 adipocytes (27,34). There remains a subset of the GSV pool, corresponding to about a third of the entire population of vesicles, that is not discharged to the plasma membrane. These GSVs continue to be retained intracellularly, possibly by the action of TUG and other proteins. Intriguingly, insulin stimulates the dissociation of two-thirds of the TUG•GLUT4 protein complexes present in basal 3T3-L1 adipocytes, and leave the remaining third of these complexes intact (15). The remaining complexes may retain the GSVs that are not mobilized by insulin. If so, then TUG disruption may have an effect greater than that of insulin, because it may liberate nearly the entire pool of GSVs, and not just two-thirds of this pool. The present data show that RNAi-mediated TUG depletion reduces TUG protein by ≥85%, and previous work indicates nearly complete (≥90%) disruption of TUG•GLUT4 complexes by UBX-Cter expression (15). Consistent with the suggestion UBX-Cter blocks the sequestration of GLUT4 in GSVs of unstimulated cells, confocal microscopy shows that GLUT4-positive, TfnR-negative membranes are depleted compared to control cells or cells overexpressing TUG (Fig. 8). Thus, it may be that retained GSVs are more quantitatively released by TUG disruption than by insulin, and that a larger fraction of total cellular GLUT4 is then available for insertion into the plasma membrane.
The data show that TUG regulates GLUT4 abundance as well as its distribution. Indeed, particularly after transient, siRNA-mediated TUG depletion, the increased glucose uptake is more striking because total GLUT4 is actually decreased. Quantification of GLUT4 mRNA and protein amounts is consistent with the hypothesis that decreased GLUT4 abundance may result from decreased translation or increased degradation, and experiments using chloroquine suggest the latter effect. Overall, the data suggest that by retarding the movement of GLUT4 to the plasma membrane, TUG may also limit the flux of GLUT4 to lysosomes and consequently inhibit its degradation. Other proteins have been suggested to coordinately regulate GLUT4 trafficking and degradation, including sortilin and Ubc9 (14,35). Of note, GLUT4 protein amounts are substantially decreased in IRAP −/− mice, though it is not clear if this results from decreased GLUT4 production or enhanced degradation (36). The GLUT4 that remains is distributed normally. It may be that GLUT4 that escapes a sequestration mechanism is rapidly degraded by lysosomes, and not detected in other locations. Such an effect on GSV retention would likely be more prominent in primary cells than in 3T3-L1 adipocytes, because a much smaller proportion of total cellular GLUT4 resides in GSVs in 3T3-L1 cells. Finally, it has been known for many years that GLUT4 degradation is accelerated by insulin stimulation (23,37). Thus, the data shown here suggest that TUG disruption not only mimics much of the effect of insulin on GLUT4 trafficking and glucose uptake, but may also mimic the effect of insulin to accelerate GLUT4 degradation.
The results demonstrate that TUG binds directly and specifically to the large intracellular TM6-7 loop of GLUT4. This region has been implicated in controlling isoform-specific, insulin-responsive GLUT4 trafficking (38). The N-terminal region of TUG that binds this loop in vitro was shown to be important for the ability of TUG to retain GLUT4 intracellularly in transfected cells (15). In addition, the data suggest that TUG and GLUT4 participate in a second interaction, as described above. This involves a more central region of TUG and may be direct or indirect. Both regions of TUG are required for efficient intracellular retention of GLUT4 in transfected cells, and for high affinity binding of TUG and GLUT4 in coimmunoprecipitation experiments. It will be interesting to see if this second interaction involves the GLUT4 N terminus, which is also implicated in insulin responsive trafficking.
The data find that TUG disruption has a small effect to redistribute GLUT1 to the plasma membrane. This effect is much less dramatic compared to GLUT4 redistribution. Yet, because GLUT1 is so abundant in cultured 3T3-L1 adipocytes, the effect on GLUT1 distribution likely contributes to the increased basal glucose uptake we observe. Recent data find that insulin does cause GLUT1 translocation to the plasma membrane of 3T3-L1 adipocytes, though this effect is less dramatic than that of GLUT4 (22). It is notable that the in vitro binding data we present suggests some interaction of TUG and the GLUT1 TM6-7 loop, however this is clearly much lower affinity than the interaction of TUG and the GLUT4 TM6-7 loop. Thus, the data are consistent and show a large role of TUG in controlling GLUT4 distribution, and potentially a much smaller role in controlling GLUT1 distribution, in 3T3-L1 adipocytes.
It is not known what other proteins may be present in a TUG•GLUT4 complex, or how this complex functions to retain GLUT4 within unstimulated cells. As well, it is not known how insulin acts on the TUG•GLUT4 complex to cause dissociation of TUG and GLUT4 and to mobilize GLUT4. Finally, it is not known if TUG function is altered in insulin resistant states such as type 2 diabetes. Nonetheless, the data here demonstrate that TUG is an important determinant of GLUT4 trafficking and glucose uptake, and suggest that this protein may play a prominent role in insulin action.
Footnotes
We thank Drs. Xudong Huang and Amira Klip (University of Toronto) for providing GST expression plasmids, Dr. Biao Luo (Broad Institute) for the pMSCV-U3-H1 vector, Dr. Maureen Charron for antisera, and Drs. Lawrence Young, Hongjie Li, Stefan Mansourian and Bradley Rubin for helpful discussions and comments on the manuscript. This work used the Center for Cell Imaging and the Diabetes Endocrinology Research Center (DERC) Cell Biology Core at Yale University School of Medicine. This work was supported by grants to J.S.B. from the American Diabetes Association, the NIH (R21 DK070812), the Yale DERC Pilot and Feasibility program, the HHMI–Yale Center for Human Genetics and Genomics, and the W. M. Keck Foundation.
The abbreviations used are: GLUT4, Glucose transporter 4; TUG, Tether, containing a UBX domain, for GLUT4; TGN, trans-Golgi network; TfnR, transferrin receptor; GSV, GLUT4 storage vesicle; siRNA, small interfering RNA; shRNA, short hairpin RNA; GFP, green fluorescent protein; LM, light microsome; HM, heavy microsome; PM, plasma membrane; GST, glutathione S-transferase; GLUT1, Glucose transporter 1; SNARE, soluble NSF attachment receptor.
References
- 1.Bryant NJ, Govers R, James DE. Nat Rev Mol Cell Biol. 2002;3(4):267–277. doi: 10.1038/nrm782. [DOI] [PubMed] [Google Scholar]
- 2.Watson RT, Kanzaki M, Pessin JE. Endocr Rev. 2004;25(2):177–204. doi: 10.1210/er.2003-0011. [DOI] [PubMed] [Google Scholar]
- 3.Shulman GI. J Clin Invest. 2000;106(2):171–176. doi: 10.1172/JCI10583. [DOI] [PMC free article] [PubMed] [Google Scholar]
- 4.Abel ED, Shepherd PR, Kahn BB. Glucose transporters and pathophysiologic states. In: Le Roith D, Taylor SI, Olefsky JM, editors. Diabetes mellitus: a fundamental and clinical text. 3. Lippincott-Raven; Philadelphia: 2003. [Google Scholar]
- 5.Maianu L, Keller SR, Garvey WT. J Clin Endocrinol Metab. 2001;86(11):5450–5456. doi: 10.1210/jcem.86.11.8053. [DOI] [PubMed] [Google Scholar]
- 6.Larance M, Ramm G, Stockli J, van Dam EM, Winata S, Wasinger V, Simpson F, Graham M, Junutula JR, Guilhaus M, James DE. J Biol Chem. 2005;280(45):37803–37813. doi: 10.1074/jbc.M503897200. [DOI] [PubMed] [Google Scholar]
- 7.Eguez L, Lee A, Chavez JA, Miinea CP, Kane S, Lienhard GE, McGraw TE. Cell Metab. 2005;2(4):263–272. doi: 10.1016/j.cmet.2005.09.005. [DOI] [PubMed] [Google Scholar]
- 8.Kupriyanova TA, Kandror V, Kandror KV. J Biol Chem. 2002;277(11):9133–9138. doi: 10.1074/jbc.M106999200. [DOI] [PubMed] [Google Scholar]
- 9.Xu Z, Kandror KV. J Biol Chem. 2002;277(50):47972–47975. doi: 10.1074/jbc.C200486200. [DOI] [PubMed] [Google Scholar]
- 10.Watson RT, Khan AH, Furukawa M, Hou JC, Li L, Kanzaki M, Okada S, Kandror KV, Pessin JE. EMBO J. 2004;23(10):2059–2070. doi: 10.1038/sj.emboj.7600159. [DOI] [PMC free article] [PubMed] [Google Scholar]
- 11.Li LV, Kandror KV. Mol Endocrinol. 2005;19(8):2145–2153. doi: 10.1210/me.2005-0032. [DOI] [PubMed] [Google Scholar]
- 12.Karylowski O, Zeigerer A, Cohen A, McGraw TE. Mol Biol Cell. 2004;15(2):870–882. doi: 10.1091/mbc.E03-07-0517. [DOI] [PMC free article] [PubMed] [Google Scholar]
- 13.Bogan JS, McKee AE, Lodish HF. Mol Cell Biol. 2001;21(14):4785–4806. doi: 10.1128/MCB.21.14.4785-4806.2001. [DOI] [PMC free article] [PubMed] [Google Scholar]
- 14.Shi J, Kandror KV. Dev Cell. 2005;9(1):99–108. doi: 10.1016/j.devcel.2005.04.004. [DOI] [PubMed] [Google Scholar]
- 15.Bogan JS, Hendon N, McKee AE, Tsao TS, Lodish HF. Nature. 2003;425(6959):727–733. doi: 10.1038/nature01989. [DOI] [PubMed] [Google Scholar]
- 16.Jiang ZY, Zhou QL, Coleman KA, Chouinard M, Boese Q, Czech MP. Proc Natl Acad Sci U S A. 2003;100(13):7569–7574. doi: 10.1073/pnas.1332633100. [DOI] [PMC free article] [PubMed] [Google Scholar]
- 17.Luo B, Heard AD, Lodish HF. Proc Natl Acad Sci U S A. 2004;101(15):5494–5499. doi: 10.1073/pnas.0400551101. [DOI] [PMC free article] [PubMed] [Google Scholar]
- 18.Naviaux RK, Costanzi E, Haas M, Verma IM. J Virol. 1996;70(8):5701–5705. doi: 10.1128/jvi.70.8.5701-5705.1996. [DOI] [PMC free article] [PubMed] [Google Scholar]
- 19.Liu X, Constantinescu SN, Sun Y, Bogan JS, Hirsch D, Weinberg RA, Lodish HF. Anal Biochem. 2000;280(1):20–28. doi: 10.1006/abio.2000.4478. [DOI] [PubMed] [Google Scholar]
- 20.Charron MJ, Brosius FC, 3rd, Alper SL, Lodish HF. Proc Natl Acad Sci U S A. 1989;86(8):2535–2539. doi: 10.1073/pnas.86.8.2535. [DOI] [PMC free article] [PubMed] [Google Scholar]
- 21.Bogan JS, Lodish HF. J Cell Biol. 1999;146(3):609–620. doi: 10.1083/jcb.146.3.609. [DOI] [PMC free article] [PubMed] [Google Scholar]
- 22.Liao W, Nguyen MT, Imamura T, Singer O, Verma IM, Olefsky JM. Endocrinology. 2006;147(5):2245–2252. doi: 10.1210/en.2005-1638. [DOI] [PubMed] [Google Scholar]
- 23.Sargeant RJ, Paquet MR. Biochem J. 1993;290(Pt 3):913–919. doi: 10.1042/bj2900913. [DOI] [PMC free article] [PubMed] [Google Scholar]
- 24.Hosaka T, Brooks CC, Presman E, Kim SK, Zhang Z, Breen M, Gross DN, Sztul E, Pilch PF. Mol Biol Cell. 2005;16(6):2882–2890. doi: 10.1091/mbc.E05-01-0072. [DOI] [PMC free article] [PubMed] [Google Scholar]
- 25.Williams D, Hicks SW, Machamer CE, Pessin JE. Mol Biol Cell. 2006;17(12):5346–5355. doi: 10.1091/mbc.E06-05-0386. [DOI] [PMC free article] [PubMed] [Google Scholar]
- 26.Pererahich HK, Clarke M, Morris NJ, Hong W, Chamberlain LH, Gould GW. Mol Biol Cell. 2003;14(7):2946–2958. doi: 10.1091/mbc.E02-11-0722. [DOI] [PMC free article] [PubMed] [Google Scholar]
- 27.Govers R, Coster AC, James DE. Mol Cell Biol. 2004;24(14):6456–6466. doi: 10.1128/MCB.24.14.6456-6466.2004. [DOI] [PMC free article] [PubMed] [Google Scholar]
- 28.Semiz S, Park JG, Nicoloro SM, Furcinitti P, Zhang C, Chawla A, Leszyk J, Czech MP. EMBO J. 2003;22(10):2387–2399. doi: 10.1093/emboj/cdg237. [DOI] [PMC free article] [PubMed] [Google Scholar]
- 29.Imamura T, Huang J, Usui I, Satoh H, Bever J, Olefsky JM. Mol Cell Biol. 2003;23(14):4892–4900. doi: 10.1128/MCB.23.14.4892-4900.2003. [DOI] [PMC free article] [PubMed] [Google Scholar]
- 30.Koumanov F, Jin B, Yang J, Holman GD. Cell Metab. 2005;2(3):179–189. doi: 10.1016/j.cmet.2005.08.007. [DOI] [PubMed] [Google Scholar]
- 31.Yamada E, Okada S, Saito T, Ohshima K, Sato M, Tsuchiya T, Uehara Y, Shimizu H, Mori M. J Cell Biol. 2005;168(6):921–928. doi: 10.1083/jcb.200408182. [DOI] [PMC free article] [PubMed] [Google Scholar]
- 32.Sano H, Kane S, Sano E, Lienhard GE. Biochem Biophys Res Commun. 2005;332(3):880–884. doi: 10.1016/j.bbrc.2005.05.027. [DOI] [PubMed] [Google Scholar]
- 33.van Dam EM, Govers R, James DE. Mol Endocrinol. 2005 doi: 10.1210/me.2004-0413. [DOI] [PubMed] [Google Scholar]
- 34.Coster AC, Govers R, James DE. Traffic. 2004;5(10):763–771. doi: 10.1111/j.1600-0854.2004.00218.x. [DOI] [PubMed] [Google Scholar]
- 35.Giorgino F, de Robertis O, Laviola L, Montrone C, Perrini S, McCowen KC, Smith RJ. Proc Natl Acad Sci U S A. 2000;97(3):1125–1130. doi: 10.1073/pnas.97.3.1125. [DOI] [PMC free article] [PubMed] [Google Scholar]
- 36.Keller SR, Davis AC, Clairmont KB. J Biol Chem. 2002;277(20):17677–17686. doi: 10.1074/jbc.M202037200. [DOI] [PubMed] [Google Scholar]
- 37.Kim SS, Bae JW, Jung CY. Am J Physiol. 1994;267(1 Pt 1):E132–139. doi: 10.1152/ajpendo.1994.267.1.E132. [DOI] [PubMed] [Google Scholar]
- 38.Khan AH, Capilla E, Hou JC, Watson RT, Smith JR, Pessin JE. J Biol Chem. 2004;279(36):37505–37511. doi: 10.1074/jbc.M405694200. [DOI] [PubMed] [Google Scholar]


