

Abstract
Background
although the concept of healthy ageing has stimulated considerable interest, no generally accepted definition has been developed nor has its biological basis been determined.
Objective
to develop a definition of healthy ageing and investigate its association with longevity and neuropathology.
Methods
analyses were based on cognitive, physical, and post-mortem assessments from 1991 to 1998 in the Nun Study, a longitudinal study of ageing in participants 75+ years at baseline. We defined three mutually exclusive levels of healthy ageing (excellent, very good, and good) based on measures of global cognitive function, short-term memory, basic and instrumental activities of daily living, and self-rated function. Mortality analyses were based on 636 participants; neuropathologic analyses were restricted to 221 who had died and were autopsied.
Results
only 11% of those meeting criteria for the excellent level of healthy ageing at baseline subsequently died, compared with 24% for the very good, 39% for the good, and 60% for the remaining participants. Survival curves showed significantly greater longevity with higher levels of healthy ageing. The risk of not attaining healthy ageing, adjusted for age, increased two-fold in participants with brain infarcts alone, six-fold in those with Alzheimer neuropathology alone, and more than thirteen-fold in those with both brain infarcts and Alzheimer neuropathology.
Conclusions
the biological validity of our definition of healthy ageing is supported by its strong association with mortality and longevity. Avoiding Alzheimer and stroke neuropathology is critical to the maintenance of healthy ageing, and the presence of both pathologies dramatically decreases the likelihood of healthy ageing.
Keywords: successful ageing, longitudinal studies, Alzheimer disease, cerebral infarction, aged
Introduction
The concept of successful or healthy ageing has stimulated considerable interest [1–5] and has helped challenge views of ageing as an inevitable process of disease and decline. Although no generally accepted definition of healthy ageing has been developed, a variety of objective and subjective measures of cognitive, physical, and psychological health have been identified as important components [6]. In contrast to this extensive literature, little research has been conducted on the neuropathologic substrate of healthy ageing.
Prior findings from the Nun Study, a longitudinal study of ageing and Alzheimer’s disease, indicate that the combination of brain infarcts (a pathologic outcome of strokes) and Alzheimer pathology is strongly associated with dementia [7]. Alzheimer’s disease and strokes are common causes of impairment in both physical and cognitive performance, abilities central to healthy ageing. We thus developed a definition of healthy ageing and investigated its association with Alzheimer pathology and brain infarcts in the Nun Study. Because any valid definition of healthy ageing should reflect overall health status, we also studied the association of healthy ageing with longevity and all-cause mortality.
Participants in the Nun Study are Catholic sisters of the School Sisters of Notre Dame religious congregation and have had relatively comparable lifestyles and environments throughout their adult lives [8]. Although their unique characteristics may limit generalisability of findings, these same factors also increase the comparability of participants and minimise confounding. All participants have agreed to brain donation after death and the Nun Study thus presents a unique opportunity to explore neuropathologic correlates of healthy ageing.
Methods
Study population
The design of this longitudinal study has been described in detail [7–9]. From 1991 to 1993, all members of the School Sisters of Notre Dame in the United States who were 75 years or older were invited to join the Nun Study. From 1,031 eligible sisters, 678 (66%) agreed to participate in all aspects of the study, including review of archival and medical records, annual cognitive and physical assessments, and brain donation after death. Participants did not differ significantly from non-participants in mean age, mortality rate, race, or country of birth. At the first annual exam, the 678 participants were 75–102 years old (mean = 83). Their educational level ranged from grade school to doctoral degree; 85% had attained at least a bachelor’s degree and 89% were teachers. Data from the first four annual exams were analysed in this paper.
Sample selection
Of the 678 participants, 636 (94%) had never withdrawn from the study or missed an exam during the first four annual exams. They ranged in age from 76 to 103 years of age (mean = 87) at the latest exam used in these analyses—the fourth exam for surviving participants or the last exam at which the participant was alive.
There were 274 deaths among these 636 participants between the date the first participant was assessed (31 October 1991) and the date the last participant completed the fourth exam (15 May 1998). Neuropathologic evaluations were conducted on 253 (92%) of the 274 deceased participants. Because the study focused on the neuropathology of Alzheimer’s disease and stroke, 32 participants with other pathologic conditions that could potentially impair cognition were excluded, producing a final autopsy sample of 221.
Measures
Performance-based measures of cognitive and physical function and participants’ self-rated function were used to define mutually exclusive levels of healthy ageing: excellent, very good, and good versus other (not healthy ageing). As all of these measures are critical to our concept of healthy ageing, minimum levels of performance were required in each of the domains. The excellent level of healthy ageing was the most stringently defined. Criteria were relaxed incrementally for very good and good levels (see Table 1).
Table 1.
Criteria for level of healthy ageing
| Level of healthy ageing | Mini-Mental State Exama | Delayed Word Recalla | Basic activities of daily livinga | Instrumental activities of daily livinga | Self-rated functiona |
|---|---|---|---|---|---|
| Excellent | ≥28 | ≥7 | 5 | 5 | Excellent |
| Very good | ≥26 | ≥6 | 5 | ≥4 | Excellent/very good |
| Good | ≥24 | ≥5 | ≥4 | ≥3 | Excellent/very good/good |
Mini-Mental State Exam (range 0–30), Delayed Word Recall (range 0–10), basic activities of daily living (range 0–5, items are feeding, dressing, standing, walking, toileting), instrumental activities of daily living (range 0–5, items are reading, using the telephone, telling time, taking medication, and handling money), self-rated function (response categories are poor/fair/good/very good/excellent).
Cognitive function
Cognitive function was assessed by a standard battery [10]. Two tests were selected because they target global cognition (Mini-Mental State Exam [11]) and short-term memory (Delayed Word Recall [12]), two aspects of cognition important to healthy ageing.
The Mini-Mental State Exam standard cut-point of 24 was the minimum score for intact global cognition and the criterion for the good level of healthy ageing. Minimum scores were increased to 26 and 28 for the very good and excellent levels of healthy ageing respectively, based on research suggesting that scores greater than 24 may be expected in healthy older adults, particularly when their education is above the high school level [13–16].
The Delayed Word Recall test requires the recall of ten words. The recall of less than four met our criteria for dementia [8]. A score below five (1.5 standard deviations below the age-appropriate mean [17]) was consistent with mild cognitive impairment. To ensure that all participants classified as healthy ageing were cognitively intact according to this test, we used a minimum score of five for the good level. Minimum scores for very good and excellent levels were increased in one-point increments to reflect the more stringent criteria for these levels of healthy ageing while setting an achievable standard of performance.
Activities of daily living
Some standard activities of daily living (e.g. meal preparation, housework) were not applicable because of the communal lifestyle of participants. We assessed five basic (feeding, dressing, standing, walking, and toileting) and five instrumental activities of daily living (reading, using the telephone, telling time, taking medication, and handling money). Performance-based measures [18, 19] were used for all activities except toileting, where independence was determined from the nursing reports for participants receiving nursing care and self-reports for the remaining participants.
Self-rated function
Based on standard wording [20, 21], participants were asked, ‘Compared to sisters your age, would you say your ability to take care of yourself is excellent, very good, good, fair, or poor?’ Among the 636 participants, 79 were unable to report their level of function at their last exam and were coded as having ‘poor’ function. Consistent with our belief that severe disability was responsible for their lack of response, 84% had a score of 0 on the Mini-Mental State Exam and 96% had no intact basic activities of daily living. In the Nun Study, self-rated function is more strongly related to basic activities of daily living, functional decline, and mortality than is self-rated health [22].
Neuropathology
A single blinded neuropathologist (WRM) performed all gross and microscopic examinations [9]. Brain infarcts visible to the naked eye were identified by the examination of the intact brain and the coronal sections (1.5 cm thick) of the cerebral hemispheres, the brain stem, and the cerebellum. The brain infarcts included both lacunar (<1.5 cm) and larger infarcts. The neuropathologic evaluation included quantification of the major Alzheimer’s disease lesions—neurofibrillary tangles, neuritic plaques, diffuse plaques, and total senile plaques (the combination of neuritic and diffuse plaques). Lesions were counted from the five most involved areas of each slide in the middle frontal gyrus (Brodmann area 9), the inferior parietal lobule (areas 39/40), the middle temporal gyrus (area 21), and the CA1 and the subiculum of the hippocampus using the modified Bielschowsky stain. Neuropathologic criteria for Alzheimer’s disease were abundant senile plaques in the frontal, temporal, or parietal lobe, neuritic plaques in at least one lobe, and neurofibrillary tangles in at least one lobe [9].
Statistical methods
The means and the standard deviations were calculated by standard methods and exact confidence intervals determined for proportions. Cross-tabulations were used to assess mortality or neuropathology within levels of healthy ageing. Exact tests for trend were calculated using the Cochran-Armitage test. The association between healthy ageing and mortality was assessed with Cox regression models, adjusting for time-dependent variables [23]. This technique allows consideration of changes in age, cognitive function, physical function and self-reported function measures over time by using discrete time-dependent values for the covariates at the beginning of each risk (assessment) interval. Relative risks were derived from these analyses based on the ratio of the hazard functions. Cox regression models were also used to estimate the survival distribution function by age and level of healthy ageing. Values were truncated at 100 because of sparse data at ages beyond 100 years. Differences in survival curves by healthy ageing level were tested using the Kaplan–Meier method and log-rank tests [23]. Logistic regression models were used to determine the relationship of neuropathology to the likelihood of healthy ageing after adjustment for age at the last exam. Analyses were conducted with SAS software, version 8.01 (SAS Institute Inc., Cary, North Carolina).
Results
The mean age in each category of healthy ageing decreased as the criteria became more stringent (see Appendix 1 in the supplementary data on the journal website http://www.ageing.oxfordjournals.org/). Very old individuals (90+ years), however, were found at every level of healthy ageing; the oldest participant who met criteria for the excellent category of healthy ageing was 100 years of age.
The proportion of participants who had died by the end of the fourth exam was strongly related to their healthy ageing status. Of those who met criteria for the excellent category of healthy ageing at their last exam, only 16% subsequently died compared with 23% for the very good category, 27% for the good category, and 56% for the remaining participants. The trend of increasing mortality in those with lower levels of healthy ageing was even more evident for healthy ageing at the first exam and was significant for healthy ageing at both the first and last exams (P<0.0001). The risk of all-cause mortality, adjusted by age, increased slightly from excellent to very good to good categories of healthy ageing but the risk at the latter two categories did not differ significantly from that at the excellent level. For participants who did not meet our criteria for healthy ageing, however, the risk of mortality was significantly increased to four times the risk of those at the excellent level of healthy ageing (relative risk = 4.01; 95% confidence interval [CI] = 1.95–8.24) (see Appendix 2 in the supplementary data on the journal website http://www.ageing.oxfordjournals.org/). Survival curves demonstrate the parallel increase in longevity with higher levels of healthy ageing (Figure 1). Overall, survival curves were significantly associated with healthy ageing level; individual comparisons showed significant differences for all comparisons with the exception of excellent versus very good, which was marginally significant (0.05< = P<0.10). Predicted median survival was 84.8 years for those who did not meet criteria for any level of healthy ageing, and rose to 88.0, 90.9, and 94.2 years for good, very good, and excellent levels of healthy ageing, respectively.
Figure 1.
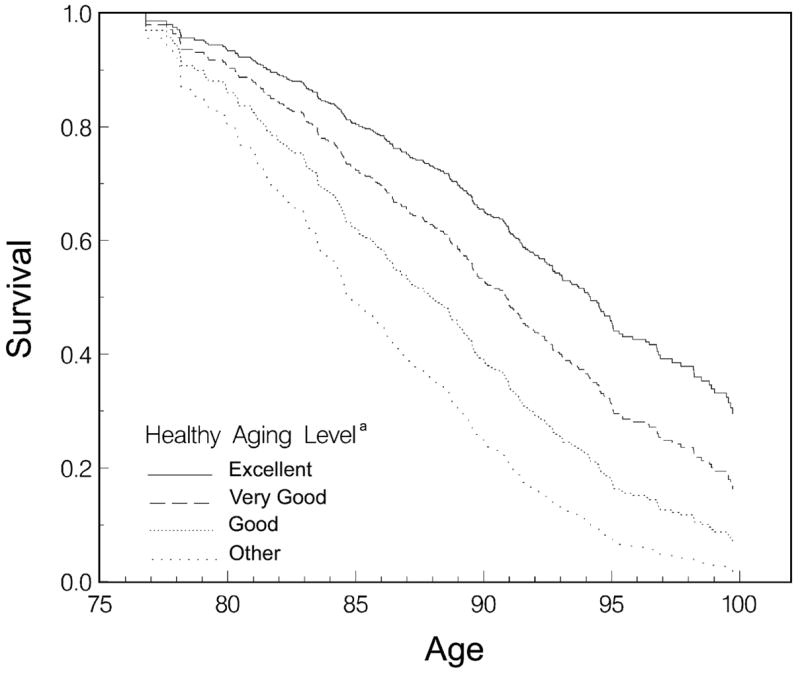
Survival distribution function by age and level of healthy ageing at exam 1. aBased on measures at exam 1 of global cognitive function (Mini-Mental State Exam), short-term memory (Delayed Word Recall), basic and instrumental activities of daily living, and self-rated function (ability to take care of oneself).
Among the deceased participants, the level of healthy ageing was related to the prevalence of brain infarcts and significant Alzheimer pathology (Table 2). Most participants (86%) who met criteria for the excellent category of healthy ageing at the last exam before death had neither brain infarcts nor met neuropathologic criteria for Alzheimer’s disease (see Appendix 3 in the supplementary data on the journal website http://www.ageing.oxfordjournals.org).
Table 2.
Prevalence of brain infarcts and Alzheimer pathology by level of healthy ageing
| Prevalence of neuropathologic conditions
|
|||||||||
|---|---|---|---|---|---|---|---|---|---|
| Level of healthy ageinga |
Noneb |
Brain infarctsc only
|
Alzheimer pathologyd only
|
Brain infarcts + Alzheimer pathology
|
|||||
| n | % | 95% CIe | % | 95% CI | % | 95% CI | % | 95% CI | |
| Excellent | 7 | 85.7 | 42.13–99.64 | 14.3 | 0.36–57.87 | 0 | — | 0 | — |
| Very good | 15 | 60.0 | 32.29–83.66 | 6.7 | 0.17–31.95 | 20.0 | 4.33–48.09 | 13.3 | 1.66–40.46 |
| Good | 28 | 42.9 | 24.46–62.82 | 28.6 | 13.22–48.67 | 25.0 | 10.69–44.87 | 3.6 | 0.09–18.35 |
| Other | 171 | 17.5 | 12.16–24.09 | 13.5 | 8.72–19.50 | 39.8 | 32.37–47.52 | 29.2 | 22.55–36.67 |
Based on measures at the last exam before death of global cognitive function (Mini-Mental State Exam), short-term memory (Delayed Word Recall), basic and instrumental activities of daily living, and self-rated function (ability to take care of oneself).
No brain infarcts visible to the naked eye, did not meet neuropathologic criteria for Alzheimer’s disease, and had no other conditions that could impair cognition, based on brain autopsy.
One or more brain infarcts visible to the naked eye.
Met neuropathologic criteria for Alzheimer’s disease.
Confidence interval.
The risk of not meeting criteria for any level of healthy ageing, adjusted for age, increased two-fold in participants with brain infarcts alone (odds ratio [OR] = 2.04; 95% CI = 0.77–5.64), six-fold in those with Alzheimer pathology alone (OR = 6.01; 95% CI = 2.51–15.38), and more than thirteen-fold in those with both brain infarcts and Alzheimer pathology (OR = 13.43; 95% CI = 4.07–61.61).
To address the possibility of confounding of cognitive test scores and hence healthy ageing level by education and occupation, all analyses were repeated, with similar results, in a sub-sample who had earned at least a bachelor’s degree and whose occupation was teaching.
Discussion
Healthy ageing encompasses health in its broadest sense, with the quality of life maintained or enhanced into older age. Within this larger context of healthy ageing, this study focuses on two major types of neuropathology—Alzheimer’s disease and brain infarcts—and their effect on healthy ageing. These pathologies became increasingly common with decreasing levels of healthy ageing (from excellent to very good to good categories) and were substantially more frequent in participants who did not meet criteria for healthy ageing. Brain infarcts significantly reduced the likelihood of healthy ageing; Alzheimer pathology had an even greater impact, while the largest effect was found in those with both types of pathology. The very low prevalence of healthy ageing among those who met neuropathologic criteria for Alzheimer’s disease or who had one or more brain infarcts shows that, for most people, attaining healthy ageing requires avoiding the two most common neuropathologic conditions of old age.
Although we have developed new criteria for healthy ageing, the domains included in our definition are consistent with other studies [6]. The biological validity of this definition is supported by its strong association with longevity and all-cause mortality. Rather than simply a dichotomous variable (healthy versus not healthy ageing), we conceptualised those meeting criteria for healthy ageing as encompassing a range of levels. Individuals meeting criteria for any of the levels of healthy ageing had a significantly lower risk of mortality than those who did not. In addition, a trend of increasing mortality across all the four categories was evident as the level of healthy ageing decreased from healthy (excellent to very good to good) to not healthy ageing. Survival curves also differed by level of healthy ageing.
Age affects both cognitive and physical performance, presumably largely through its relationship with neuropathology, and thus older participants were less likely to be classified as attaining healthy ageing. Healthy ageing, however, was not entirely driven by age. Figure 1 shows that healthy ageing affects survival apart from the impact of age. In addition, very old individuals were found at all levels of healthy ageing. We think that this is an important consideration when developing any definition of healthy ageing—that healthy ageing be attainable by even very old individuals while still representing a high standard of function. The oldest participant meeting criteria for the excellent category of healthy ageing at the last exam was 100 years of age. Although not typical, she demonstrates what is possible. As would be expected from our results, at autopsy her brain was found to have neither significant Alzheimer pathology nor brain infarcts.
Further investigation of the neuropathologic basis of healthy ageing may help to develop the concept of healthy ageing because a valid definition of healthy ageing should be associated with pathophysiologic manifestations. An overwhelming impact of Alzheimer pathology may be expected for individual cognitive dimensions such as short-term memory. However, other aspects of cognitive function (e.g. constructional praxis) or specific dimensions of healthy ageing (e.g. self-rated function) may be driven more strongly by vascular than Alzheimer pathology. In addition, further studies may determine if the inverse association between healthy ageing and neuropathology reflects a particular subtype of Alzheimer or vascular pathology.
Given that healthy ageing is defined at the high end of the cognitive and physical function continuum, it is biologically plausible that the presence of only one type of brain pathology may be sufficient to reduce dramatically the likelihood of healthy ageing. In addition, as shown in this study, the interaction of pathologies may be important. Research on other types of neuropathology and how they interact to influence healthy ageing is needed. Investigating the neuropathologic substrates of healthy ageing will provide clues to understanding the determinants of healthy ageing and maximising the likelihood of healthy ageing for all.
Key points
Despite increasing interest in the concept of healthy ageing, no generally accepted definition for healthy ageing has been developed nor has its biological basis been determined.
Three mutually exclusive levels of healthy ageing (excellent, very good, and good) were defined based on measures of global cognitive function, short-term memory, basic and instrumental activities of daily living, and self-rated function.
The biological validity of our definition of healthy ageing is supported by its strong association with mortality and longevity.
Avoiding Alzheimer and stroke neuropathology is critical to the maintenance of healthy ageing, and the presence of both pathologies dramatically decreases the likelihood of healthy ageing.
Attaining healthy ageing requires avoiding the two most common neuropathologic conditions of old age: Alzheimer pathology and brain infarcts.
Supplementary Material
Supplementary data for this article is available online at http://ageing.oxfordjournals.org.
Acknowledgments
This study would not have been possible without the support of the members, leaders, and health care providers of the School Sisters of Notre Dame religious congregation. We would also like to thank Gari-Anne Patzwald, Mary Roycraft, Jeanne Sturgill, and Dr. Huaichen Liu, members of the Nun Study team who provided invaluable assistance on this project. This study was funded by National Institute of Aging grants 5R01AG09862, K04AG00553, and P50AG05144, and by a grant from the Kleberg Foundation. These financial sponsors played no role in the design, execution, analysis, interpretation or writing of this study.
Footnotes
Conflicts of Interest
None.
References
- 1.Baltes PB. The aging mind: Potential and limits. Gerontologist. 1993;33:580–94. doi: 10.1093/geront/33.5.580. [DOI] [PubMed] [Google Scholar]
- 2.Rowe JW, Kahn RL. Human aging: Usual and successful. Science. 1987;237:143–9. doi: 10.1126/science.3299702. [DOI] [PubMed] [Google Scholar]
- 3.Rowe JW, Kahn RL. Successful aging. Gerontologist. 1997;37:433–40. doi: 10.1093/geront/37.4.433. [DOI] [PubMed] [Google Scholar]
- 4.Schulz R, Heckhausen J. A life span model of successful aging. Am Psychol. 1996;51:702–14. doi: 10.1037//0003-066x.51.7.702. [DOI] [PubMed] [Google Scholar]
- 5.Seeman TE, Rodin J, Albert M. Self-efficacy and cognitive performance in high-functioning older individuals: MacArthur Studies of Successful Aging. J Aging Health. 1993;5:455–74. [Google Scholar]
- 6.Depp C, Jeste D. Definitions and predictors of successful aging: A comprehensive review of larger quantitative studies. Am J Geriatr Psychiatry. 2006;14:6–20. doi: 10.1097/01.JGP.0000192501.03069.bc. [DOI] [PubMed] [Google Scholar]
- 7.Snowdon DA, Greiner LH, Mortimer JA, et al. Brain infarction and the clinical expression of Alzheimer disease: The Nun Study. JAMA. 1997;277:813–7. [PubMed] [Google Scholar]
- 8.Snowdon DA, Kemper SJ, Mortimer JA, et al. Linguistic ability in early life and cognitive function and Alzheimer’s disease in late life. JAMA. 1996;275:528–32. [PubMed] [Google Scholar]
- 9.Snowdon DA. Aging and Alzheimer’s disease: Lessons from the Nun Study. Gerontologist. 1997;37:150–6. doi: 10.1093/geront/37.2.150. [DOI] [PubMed] [Google Scholar]
- 10.Morris JC, Heyman A, Mohs RC, et al. The Consortium to Establish a Registry for Alzheimer’s Disease (CERAD). Part I. Clinical and neuropsychological assessment of Alzheimer’s disease. Neurology. 1989;39:1159–65. doi: 10.1212/wnl.39.9.1159. [DOI] [PubMed] [Google Scholar]
- 11.Folstein MF, Folstein SE, McHugh PR. “Mini-mental state”. A practical method for grading the cognitive state of patients for the clinician. J Psychiatr Res. 1975;12:189–98. doi: 10.1016/0022-3956(75)90026-6. [DOI] [PubMed] [Google Scholar]
- 12.Rosen WG, Mohs RC, Davis KL. A new rating scale for Alzheimer’s disease. Am J Psychiatry. 1984;141:1356–64. doi: 10.1176/ajp.141.11.1356. [DOI] [PubMed] [Google Scholar]
- 13.Butler SM, Ashford JW, Snowdon DA. Age, education and changes in the Mini-Mental State Exam scores of older women: Findings from the Nun Study. J Am Geriatr Soc. 1996;44:675–81. doi: 10.1111/j.1532-5415.1996.tb01831.x. [DOI] [PubMed] [Google Scholar]
- 14.Crum RM, Anthony JC, Bassett SS, et al. Population-based norms for the Mini-Mental State Examination by age and educational level. JAMA. 1993;269:2386–91. [PubMed] [Google Scholar]
- 15.Dufouil C, Clayton D, Brayne C, et al. Population norms for the MMSE in the very old: Estimates based on longitudinal data. Neurology. 2000;55:1609–13. doi: 10.1212/wnl.55.11.1609. [DOI] [PubMed] [Google Scholar]
- 16.Heeren TJ, Lagaay AM, von Beek WCA, et al. Reference values for the Mini-Mental State Examination (MMSE) in octo- and nonagenarians. J Am Geriatr Soc. 1990;38:1093–6. doi: 10.1111/j.1532-5415.1990.tb01371.x. [DOI] [PubMed] [Google Scholar]
- 17.Welsh KA, Butters N, Mohs RC, et al. The Consortium to Establish a Registry for Alzheimer’s Disease (CERAD). Part V. A normative study of the neuropsychological battery. Neurology. 1994;44:609–14. doi: 10.1212/wnl.44.4.609. [DOI] [PubMed] [Google Scholar]
- 18.Kuriansky J, Gurland B. The performance test of activities of daily living. Int J Aging Hum Dev. 1976;7:343–52. doi: 10.2190/x45l-tww7-wxxy-ka6k. [DOI] [PubMed] [Google Scholar]
- 19.Potvin AR, Tourtellotte WW, Dailey JS, et al. Simulated activities of daily living examination. Arch Phys Med Rehabil. 1972;53:476–86. [PubMed] [Google Scholar]
- 20.Centers for Disease Control and Prevention. Quality of life as a new public health measure–behavioral risk factor surveillance system, 1993. MMWR. 1994;43:375–80. [PubMed] [Google Scholar]
- 21.Siegel PZ, Frazier EL, Mariolis P, et al. Behavioral Risk Factor Surveillance, 1991: Monitoring progress toward the nation’s year 2000 health objectives. MMWR CDC Surveill Summ. 1993;42:1–21. [PubMed] [Google Scholar]
- 22.Greiner PA, Snowdon DA, Greiner LH. The relationship of self-rated function and self-rated health to concurrent functional ability, functional decline and mortality: Findings from the Nun Study. J Gerontol: Soc Sci. 1996;51B:S234–S41. doi: 10.1093/geronb/51b.5.s234. [DOI] [PubMed] [Google Scholar]
- 23.Allison PD. Survival Analysis using the SAS System: A Practical Guide. Cary, NC: SAS Institute Inc; 1995. [Google Scholar]
Associated Data
This section collects any data citations, data availability statements, or supplementary materials included in this article.
Supplementary Materials
Supplementary data for this article is available online at http://ageing.oxfordjournals.org.