

Abstract
Before in vivo micro-CT scanning can be used to investigate femoral trabecular microarchitecture over time in rabbits, its repeatability and reproducibility must be demonstrated. To accomplish this, both distal femurs of two six-month-old New Zealand white rabbits were scanned five times each in one day under different conditions (repeatability). Scanning was done at 28 μm isotropic voxel size to produce five image stacks of each femur. Three operators then followed a standard image processing protocol (reproducibility) to isolate two separate cubes from each anterior femoral condyle [total n = (8 cube sites)(5 scans)(3 operators) = 120]. Bone volume fraction (BV/TV) of the eight different cube sites (sample) ranged from 0.408 to 0.501 (mean: 0.453); trabecular thickness (Tb.Th) ranged from 158.1 μm to 185.5 μm (mean: 168.6 μm); and trabecular separation (Tb.Sp) ranged from 179.4 μm to 233.1 μm (mean: 204.7 μm). Using ANOVA and the variance component method, the total process variation was ± 14.1% of the mean BV/TV of 0.453. The sample variation was ± 13.9% (p<0.001), the repeatability was ± 2.1% (p<0.001), and the reproducibility was ± 0.1% (p>0.05). Results were similar for Tb.Th and Tb.Sp. Though the contribution due to repeatability was statistically significant for each of the three indices, the natural sample differences were far greater than differences caused by repeated scanning under different conditions or by different operators processing the images. These findings suggest that in vivo micro-CT scanning of rabbit distal femurs was repeatable and reproducible and can be used with confidence to measure differences in trabecular bone microarchitecture at a single location in a longitudinal study design.
Keywords: In vivo, micro-CT, repeatability, bone volume fraction, trabecular bone
INTRODUCTION
Trabecular bone architecture is an important component of the quality of cancellous (trabecular) bone that must be considered along with bone mass to fully assess fracture risk. Traditional clinical methods of bone imaging, though not ideal because their resolutions are on the order of the trabecular thickness, have been advanced through sophisticated image processing methods to yield accurate measures of trabecular structural indices (Laib et al., 1998; Saha and Wehrli, 2004) and to allow simulation of bone loading using finite element methods (Ulrich et al., 1999; Homminga et al., 2001; Pistoia et al., 2004). However, high resolution computed tomography (micro-CT), which provides high spatial resolution with voxel sizes less than 50 μm, is a more powerful research tool for quantifying the detailed architecture of trabecular bone along with trabecular tissue density information and has become highly refined and widely accepted for its use in vitro and ex vivo (Feldkamp et al., 1989; Kuhn et al., 1990; Hildebrand and Ruegsegger, 1997; Müller et al., 1998).
Micro-CT promises to be even more useful as an in vivo tool so that small changes can be measured through time in a single animal, and eventually as imaging modalities improve, in patients. Thus far, successful in vivo scanning of small animals such as rats has been described and the benefits of longitudinal studies are being demonstrated (Kinney et al., 1995; Laib et al., 2001; Waarsing et al., 2004a; Waarsing et al., 2004b; Gasser et al., 2005; Waarsing et al., 2006; Boyd et al., 2006a; Boyd et al., 2006b). As the field moves forward, clinical application of in vivo micro-CT scanning for detection of fracture risk may become a reality. In the mean time, scanning of larger bone volumes from larger animals such as rabbits would be helpful to take full advantage of the ability of micro-CT to analyze trabecular bone as a continuous three-dimensional structural material and through direct conversion to finite element models (van Rietbergen et al., 1995) for mechanical property assessment. Rabbits are also advantageous compared to rats because they exhibit a predictable cessation of longitudinal bone growth after five to six months (Kaweblum et al., 1994) and should not require special processing of images to account for growth as seen with rats (Waarsing et al., 2004a). In vivo micro-CT scanning of rabbits will also complement studies involving bone graft incorporation, implant bone interfaces, and skeletal assessment which commonly use the rabbit femur model (Laffargue et al., 1999; Orr et al., 2001; Ohsawa et al., 2004; Voor et al., 2004; Bourne and van der Meulen, 2004; Saha and Wehrli, 2004; Pihlajamaki et al., 2006a; Pihlajamaki et al., 2006b; Dallari et al., 2006; Fellah et al., 2006; Takahashi et al., 2006; Wang et al., 2006; van der Meulen et al., 2006).
The objective of this investigation was to demonstrate the successful scanning of live rabbits and to validate the repeatability and reproducibility of high-resolution micro-CT measures of the distal femoral trabecular microstructure. The procedure was done over a very short period of time so it would be known a priori that there would be no differences in microarchitecture between scans. The scanner setup and the soft tissue condition were intentionally varied to simulate variations in conditions during longitudinal studies due to hardware setting drift or weight gain. Three separate operators were also used to assess the integrity of the interactive component of the image processing and analysis protocol. Together, these conditions provide data with which to determine the repeatability and reproducibility. For purposes of this investigation, repeatability was defined by Analysis of Variance (ANOVA) as the contribution to the total variance from the residual (or error) variance due to differences in measurements of the same sample at different times by the same operator. Similarly, reproducibility was defined as the contribution to the total variance from the operator variance due to differences in measurements of the same sample at the same time by different operators. Other sources of variance were the sample variance and the sample-operator interaction variance.
MATERIALS AND METHODS
In vivo scanning procedure
Two six-month-old female New Zealand white rabbits weighing approximately 4 kg were used according to a protocol approved by the institutional animal care and use committee. Six-month-old rabbits were used because it is known that they achieve skeletal maturity and have distinct closure of the epiphyses at nineteen to twenty-four weeks (Kaweblum et al., 1994). Because future studies related to osteoporosis will have a starting point of no younger than six months of age, animals of similar age were used in this study.
The custom-made micro-CT scanner (150/225-Ffi-HR-CT, BIR, Lincolnshire, IL) includes a specimen/small animal manipulator, a 225 kV X-ray source with a focal spot size of 5 μm and an image intensifier with a 1024×1024 pixel digital camera (Figure 1). A small animal anesthesia machine (VSA-2100, VetLand, Louisville, KY) with a small animal anesthesia ventilator (Model 2000, Hallowell, Pittsfield, MA) was added to the scanner cabinet.
Figure 1.
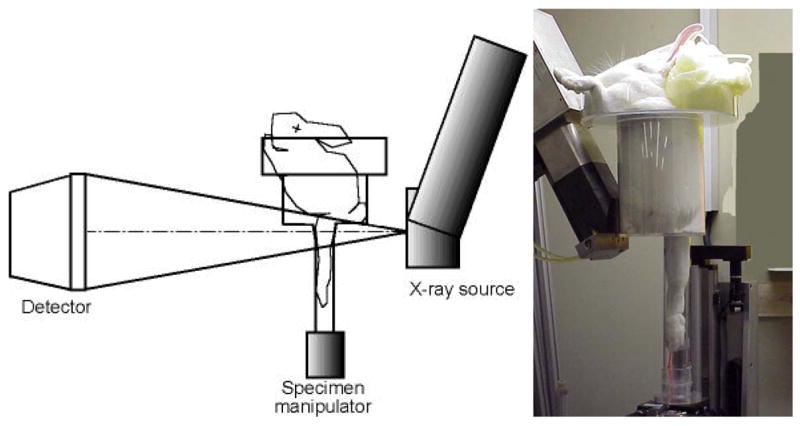
The custom designed open micro-CT system (ACTIS 150/225 Ffi-HR CT, BIR Inc., Lincolnshire, IL) was fitted with a specimen/small animal manipulator and a custom made rabbit holder. The rabbit holder allowed a single hind-limb to be extended into a 51 mm diameter tube for isolation and scanning of the distal femur. In an offset scanning mode, the three-dimensional isotropic voxel image size was 28 μm.
Each rabbit was sedated under isoflurane anesthesia (1L/min O2 with 3% isoflurane by volume) using a mask with two-way tubing initially held over the rabbit’s snout and then secured with a strap. The rabbit was placed in a custom made rabbit holder resting its front legs against the top column of the fixture (Figure 1). One hind-leg was flexed and the other hind-leg was extended into the lower column and held in place with a strap. The rabbit holder was then placed on the specimen manipulator which could be rotated about the z-axis and raised or lowered along the z-axis. Manual adjustment via a software interface (ACTIS, BIR, Lincolnshire, IL) was carried out until the region of interest was located for optimal scanning. The distal femoral condyle region was chosen as the region of interest because it has a sufficient continuous cancellous structure (van der Meulen et al., 2006). The metaphyseal regions of the hind-limbs, which are more commonly studied in rats and mice (Waarsing et al., 2004a; Waarsing et al., 2006; Fritton et al., 2005), are very sparse in the rabbit and thus do not allow the calculation of trabecular indices required for this investigation.
Five in vivo scans of both the right and left hind-legs of each rabbit were performed within approximately five hours. The basic x-ray power settings were 86kV and 110μA, the distance from the x-ray source to the image detector (SID) was 703 mm, and the source-to-object distance (SOD) was 143.3 mm. The rabbit holder allowed a single hind-limb to be extended into a 51 mm diameter tube for isolation and scanning of the distal femur (Figure 1). The radiolucent acrylic material used in making the rabbit holder was inexpensive, lightweight and relatively rigid as well as optically transparent for monitoring the rabbits during scanning. Scanning was performed in the offset mode by placing the center of the tube 12.3 mm lateral to the centerline of the x-ray cone beam. A full 360 degree-plus-fan-angle rotation was used for the scan with 1000 projections per revolution (2× averaging per projection was used to reduce noise). In this cone beam reconstruction mode, a single rotation of the object captured 107 slices, each representing a single row of pixels at a nominal size of 28 μm slice thickness. Because the offset mode effectively doubles the scan width, the reconstructed slice images were 2048×2048 pixels, at a nominal size of 28 μm × 28 μm (Figure 2). Two complete rotations covering 214 slices (approximately 6 mm from the distal femoral growth plate to the joint line) were performed for each scan. The total time in the micro-CT scanner was about 30 minutes for each leg scanned and the x-ray exposure time for each scan was approximately 12 minutes. The total tissue dose equivalent for each scan was approximately 0.24 Gy at the scanned femur and 0.00016 Gy at the chest.
Figure 2.

Representative slices from each of the five scanning conditions show that the rabbit was repositioned for each scan. The 86kVPlastic and 86kVTissue conditions contained extra material within the scan region to simulate soft tissue changes between scans. Image slices were 2048 × 2048 pixels with 28 μm size.
The five different scanning conditions (Figure 2) were:
basic settings (86 kV, 110 μA);
3% reduced power (83.4 kV, 110 μA);
3% increased power (88.6 kV, 110 μA);
simulated soft tissue variation: 3.175 mm thick by 45 degree section of acrylic tube beside the leg, basic settings (86 kV, 110 μA);
simulated soft tissue variation: 3 mm thick by 20 mm wide strip of dried beef (Oberto Co., Chicago, IL) placed beside the leg, basic settings (86 kV, 110 μA).
The amperage was not varied because it was known from previous work that there would be a greater effect from varying the voltage rather than varying the amperage (Yang, 2006). Scanning was carried out sequentially under each condition for the right and left legs and the rabbits were euthanized the following day by overdose of pentobarbital.
Image processing
For each scan, the image stacks contained 28 μm voxels with 16 bit grayscale (gray levels: 0-65535) in a 214×2048×2048 array. Each operator then rotated and cropped the images to isolate the femoral cross sections using ImageJ (v1.29x, Wayne Rasband, NIH) (Figure 3). The four image stacks from the non-standard imaging conditions were spatially reoriented, or registered, to the reference scans using a custom registration algorithm written in MATLAB (v6.5, The Mathworks, Natick, MA) that uses maximization of mutual grayscale information (Yang et al., 2005; Maes et al., 1997). The registration process requires a reference or ‘fixed’ image stack to which other ‘floating’ image stacks are reoriented in space to create the best spatial match.
Figure 3.

After image registration, the femoral cross sections were isolated and cropped to produce cubes from the anterior parts of the medial and lateral condyles. The “cubes” measured 125 × 125 × 125 or 125 × 125 × 100 voxels in size with 3.5 mm width, 3.5 mm length and either 3.5 or 2.8 mm height. Individual isotropic voxels were 28 μm. Cube from lateral side is shown.
From the registered data sets, two cubes (cubic or near-cubic volumes of interest either 125×125×125 or 125×125×100 voxels in size) were isolated from each femur (Figure 3). Cubes were always taken from the anterior halves of the lateral and medial condyle regions. The size and location of the cubes was standardized by cropping a square from the same position in each of the registered image stacks. Each of the resulting cubes was then segmented using MATLAB (v6.5, The Mathworks, Natick, MA) based on a histogram driven method of global thresholding (to find a single unique gray level for each cube) to isolate the bone tissue from the less dense tissue material in the images (Otsu, 1979). Bone volume fraction (BV/TV), trabecular thickness (Tb.Th) and trabecular separation (Tb.Sp) were calculated using a plate-model assumption (Parfitt et al., 1983; Kuhn et al., 1990) in the three-dimensional analysis software VGStudio Max (v1.2.1, Volume Graphics, Heidelberg, Germany)(see Appendix on Journal website for details). Because there were four hind-legs and two locations in each leg for a total of eight different sites studied, and each site was scanned five times, each operator was responsible for processing a total of forty cubes.
Statistical Analysis
Statistical analysis was performed using SPSS (v 15.0, SPSS, Chicago, IL) as an Analysis of Variance (ANOVA) using a variance components method similar to that described by Duncan (1986) to determine gage repeatability and reproducibility. This method calculates the variance components for the sample, operator, sample-operator interaction, and residual/error. It is the residual/error component that defines the repeatability and the operator component that defines the reproducibility. By multiplying the resulting standard deviations by 2, the 95% confidence interval contributions (in measurement units) of each variance component to the total process variation were determined. The statistical significance of the contribution to variance from each source was determined by three-way ANOVA (significance level p=0.05).
It should be noted that this approach to measuring repeatability is somewhat unusual compared to traditional gage repeatability and reproducibility studies. Traditionally, the conditions are kept identical between measurements. In this study, the conditions were intentionally varied to simulate possible scanner setting drift or soft tissue growth over time. Thus, as a “worst-case” approach, this was considered a more rigorous method of testing repeatability.
RESULTS
The two rabbits were scanned on successive days and the resulting sets of images were reconstructed over the next two days. Each operator then required approximately ten hours of interactive processing to complete the cropping, registration, and analysis procedures.
The BV/TV measurements for the eight cubes ranged from 0.408 to 0.501 with a mean value of 0.453 (Figure 4). The individual cube values were normally distributed and represented values expected from multiple samples taken from the anterior condyle region of six-month-old rabbits (Bourne et al., 2002; Bourne and van der Meulen, 2004; Yang, 2006). The variance components analysis results for BV/TV are shown in Table 1. The variation due to the sample was 13.9% of the overall mean and contributed significantly to the total variance (p<0.001). The variation due to repeated scanning under different conditions (repeatability) was 2.1% of the overall mean and also contributed significantly to the total variance (p<0.001). The variation due to multiple operators (reproducibility) was 0.1% of the overall mean, which was not statistically significant (p=0.06).
Figure 4.

The volume fractions (BV/TV) for each cube sample and for each scan condition are plotted. The error bars indicate the standard deviation for the three measurements by the different operators. The repeatability, or twice the standard deviation between different scan conditions, was 2.1% of the mean BV/TV, and contributed significantly to the total variance (p<0.001). The operator reproducibility, or twice the standard deviation between operators, was 0.1% of the overall mean, and did not contribute significantly to the total variance (p=0.06). For comparison, the sample variance component was 13.9% (p<0.001).
Table 1.
Trabecular Bone Volume Fraction (BV/TV) Variance Components Analysis by ANOVA
| Variance Components
|
|||||
|---|---|---|---|---|---|
| Total | Cube Sample | Multi-Scan Repeatability | Operator Reproducibility | ||
| variance [σ2] | 1.02 × 10⁻³ | 9.92 × 10⁻⁴ | 2.17 × 10⁻⁵ | 5.13 × 10⁻⁸ | Overall Mean |
| 95% confidence variation [± 2σ] | ± 0.064 | ± 0.063 | ± 9.32 × 10⁻³ | ± 4.52 × 10⁻⁴ | 0.453 |
| % total variation | 100 % | 98.9 % | 14.6 % | 0.7 % | |
| % overall mean [±(2σ/mean)*100] | ± 14.1 % | ± 13.9 % | ± 2.1 % | ± 0.1 % | |
| statistical significance [p] | -- | p<0.001 | p<0.001 | p=0.06 | |
Tb.Th values ranged from 158.1 μm to 185.5 μm with a mean value of 168.7 μm (Figure 5) and were normally distributed. The variance components analysis results for Tb.Th are shown in Table 2. The variation due to the sample was 19.6 μm or 11.6% of the overall mean and contributed significantly to the total variance (p<0.001). The repeatability was 6.6 μm or 3.9% of the overall mean and also contributed significantly to the total variance (p<0.001). The reproducibility was 0.0% of the overall mean and did not contribute significantly to the total variance (p=0.65).
Figure 5.

The mean trabecular thicknesses (Tb.Th) for each cube sample and for each scan condition are plotted. The error bars indicate the standard deviation for the three measurements by the different operators. The repeatability, or twice the standard deviation between different scan conditions, was 3.9% of the mean Tb.Th, and contributed significantly to the total variance (p<0.001). The operator reproducibility, or twice the standard deviation between operators, was 0.0% of the overall mean, and did not contribute significantly to the total variance (p=0.65). For comparison, the sample variance component was 11.6% (p<0.001).
Table 2.
Trabecular Thickness (Tb.Th) Variance Components Analysis by ANOVA
| Variance Components
|
|||||
|---|---|---|---|---|---|
| Total | Cube Sample | Multi-Scan Repeatability | Operator Reproducibility | ||
| variance [σ2] | 107.1 | 96.0 | 10.9 | 0.0 | Overall Mean |
| 95% confidence variation [±2σ] | ± 20.7 μm | ± 19.6 μm | ± 6.6 μm | 0.0 | 168.7 μm |
| % total variation | 100% | 94.8% | 31.9% | 0.0% | |
| % overall mean [±(2σ/mean)*100] | ± 12.3% | ± 11.6% | ± 3.9% | ± 0.0% | |
| statistical significance [p] | -- | p<0.001 | p<0.001 | p=0.65 | |
Tb.Sp values ranged from 179.4 μm to 233.1 μm with a mean value of 204.2 μm (Figure 6) and were normally distributed. The variance components analysis results for Tb.Sp are shown in Table 3. The variation due to the sample was 39.4 μm or 19.3% of the overall mean and contributed significantly to the total variance (p<0.001). The repeatability was 6.5 μm or 3.2% of the overall mean and contributed significantly to the total variance (p<0.01). The reproducibility was 1.1 μm or only 0.5% of the overall mean but contributed significantly to the total variance (p<0.01).
Figure 6.

The mean trabecular separations (Tb.Sp) for each cube sample and for each scan condition are plotted. The error bars indicate the standard deviation for the three measurements by the different operators. The repeatability, or twice the standard deviation between different scan conditions, was 3.2% of the mean Tb.Sp, and contributed significantly to the total variance (p<0.01). The operator reproducibility, or twice the standard deviation between operators, was 0.5% of the overall mean, and contributed significantly to the total variance (p<0.01). For comparison, the sample variance component was 19.3% (p<0.001).
Table 3.
Trabecular Separation (Tb.Sp) Variance Components Analysis by ANOVA
| Variance Components
|
|||||
|---|---|---|---|---|---|
| Total | Cube Sample | Multi-Scan Repeatability | Operator Reproducibility | ||
| variance [σ2] | 398.0 | 387.7 | 10.6 | 0.3 | Overall Mean |
| 95% confidence variation [± 2σ] | ± 39.9 μm | ± 39.4 μm | ± 6.5 μm | ± 1.1 μm | 204.2 μm |
| % total variation | 100% | 98.6% | 16.3% | 2.7% | |
| % overall mean [±(2σ/mean)*100] | ± 19.5% | ± 19.3% | ± 3.2% | ± 0.5% | |
| statistical significance [p] | -- | p<0.001 | p<0.01 | p<0.01 | |
There was no effect for any of the measures from the sample-operator interaction, so those results were not included in the tables. One of the cubes produced by one operator was corrupted and was excluded from the analysis after being shown to be a statistical outlier. Post-hoc power analysis of the ANOVA showed an overall experimental power of >0.8. (The raw data can be seen in Tables A1-A3 of the Appendix located on the Journal website.)
DISCUSSION
The utility of in vivo micro-CT scanning of live animals is dependent on the ability of the method to distinguish small differences in trabecular architectural indices over time. To accomplish this, there must be confidence that the differences observed are not due to variations in the scans between different times, conditions, or operators. The technique described herein has been shown to be both repeatable and reproducible for evaluating the trabecular indices of BV/TV, Tb.Th, and Tb.Sp in rabbit distal femurs.
There were significant contributions to the total variance due to repeatability over the five scanning conditions for BV/TV, Tb.Th, and Tb.Sp. However, the repeatability variance components were small, compared to the variance components associated with the eight different cube samples themselves. The BV/TV sample variance component was 13.9% of the overall measurement mean, while the BV/TV repeatability variance component was 2.1% of the mean. Any future studies involving longitudinal measures of bone will be designed with the expectation that the losses or gains in trabecular indices will be on the order of the differences seen in the present study between different rabbits and different locations, which are well beyond the 2.1%, 3.9%, and 3.2% repeatabilities found for BV/TV, Tb.Th, and Tb.Sp, respectively. For example, a recent pilot study on the effects of low calcium diet and ovariectomy in this rabbit model showed a 17% reduction in BV/TV over eight weeks (Voor et al., 2005).
The contribution to the total variance due to reproducibility (i.e., multiple operators), was not significant for BV/TV (0.1% of the overall mean, p=0.06), nor for Tb.Th (0.0% of the overall mean, p=0.65). The contribution due to reproducibility was, however, significant for the measure of Tb.Sp (p<0.01), but this value only amounted to 0.5% of the overall mean for Tb.Sp. These findings indicate an excellent reproducibility of the presented method. Thus, the highly automated procedure for image processing and analysis removed most of the subjectivity during data handling. This also indicates that the registration algorithm used was robust and reliable.
The importance of an accurate and efficient registration method for longitudinal in vivo imaging studies is well known (Boyd et al., 2006b). It is also vital that a registration method does not require reference landmarks or repeated calibrations if it is to be used conveniently in vivo. The mutual information based registration method evaluated in the present study meets these requirements. Because the maximization of mutual information registration technique is a spatial “best-fit” method, it is also reliable when there are slight changes in the trabecular architecture over time (Waarsing et al., 2004a; Yang, 2006).
The Volume Graphics voxel-based analysis software directly measures the bone volume (BV) from the three-dimensional image stacks. The other indices such as the bone surface to volume ratio (BS/BV), Tb.Th and Tb.Sp are derived values dependent on the use of a plate model assumption for their calculation (Parfitt et al., 1983; Kuhn et al., 1990). Because the rabbit bones used for this single time point study are highly plate-like in structure (Figure 3), it is believed that this model is valid. Of course, a direct three-dimensional method (Hildebrand et al., 1999) could be used if more accurate measures are needed when significant bone loss is expected. Also, a more sophisticated local threshold method (Waarsing et al., 2004b) could be used to further improve the repeatability over that shown here with a relatively simple global threshold technique.
The advantages of studying the same animals over time include reduced animal numbers, higher statistical power, and the ability to identify localized regions of microarchitectural change. These characteristics are ideally suited to the study of drug effects, disease processes, and therapeutic regimes on the trabecular microarchitecture that is so influential for bone quality and fracture risk. Some of the advantages of specifically studying rabbits are the larger volumes of bone to be analyzed and the ability to study implantable devices or grafts that may not be feasible in smaller animals. The values for repeatability and reproducibility (lower than 4% and about 0.5% of the overall mean, respectively) in the examined parameters, BV/TV, Tb.Th, and Tb.Sp, indicate that the method can be reliably employed to detect changes in the trabecular microarchitecture by repeated in vivo micro-CT scanning of a given animal. Ongoing work includes isolating regions of specific trabecular architectural changes as well as conversion of cubes into finite element models for “virtual” strength testing of the bone of the same animal at different times.
Supplementary Material
Acknowledgments
This project was supported by a grant from the NIH National Institute on Aging (1 R03 AG022299-01).
Footnotes
Publisher's Disclaimer: This is a PDF file of an unedited manuscript that has been accepted for publication. As a service to our customers we are providing this early version of the manuscript. The manuscript will undergo copyediting, typesetting, and review of the resulting proof before it is published in its final citable form. Please note that during the production process errors may be discovered which could affect the content, and all legal disclaimers that apply to the journal pertain.
References
- Bourne BC, Morgan TG, Paschalis EP, Van Der Meullen MC. Cancellous bone anisotropy arises from both architecture and material properties. Proceedings of the 48th Annual Meeting of the Orthopaedic Research Society; Dallas TX. 2002. p. #558. [Google Scholar]
- Bourne BC, van der Meulen MC. Finite element models predict cancellous apparent modulus when tissue modulus is scaled from specimen CT-attenuation. J Biomech. 2004;37(5):613–21. doi: 10.1016/j.jbiomech.2003.10.002. [DOI] [PubMed] [Google Scholar]
- Boyd SK, Davison P, Muller R, Gasser JA. Monitoring individual morphological changes over time in ovariectomized rats by in vivo micro-computed tomography. Bone. 2006a;39(4):854–62. doi: 10.1016/j.bone.2006.04.017. [DOI] [PubMed] [Google Scholar]
- Boyd SK, Moser S, Kuhn M, Klinck RJ, Krauze PL, Muller R, Gasser JA. Evaluation of three-dimensional image registration methodologies for in vivo micro-computed tomography. Ann Biomed Eng. 2006b;34(10):1587–99. doi: 10.1007/s10439-006-9168-7. [DOI] [PubMed] [Google Scholar]
- Dallari D, Fini M, Stagni C, Torricelli P, Nicoli Aldini N, Giavaresi G, Cenni E, Baldini N, Cenacchi A, Bassi A, Giardino R, Fornasari PM, Giunti A. In vivo study on the healing of bone defects treated with bone marrow stromal cells, platelet-rich plasma, and freeze-dried bone allografts, alone and in combination. J Orthop Res. 2006;24(5):877–88. doi: 10.1002/jor.20112. [DOI] [PubMed] [Google Scholar]
- Day JS, Ding M, Odgaard A, Sumner DR, Hvid I, Weinans H. Parallel plate model for trabecular bone exhibits volume fraction-dependent bias. Bone. 2000;27(5):715–20. doi: 10.1016/s8756-3282(00)00371-9. [DOI] [PubMed] [Google Scholar]
- Ding M, Odgaard A, Hvid I. Accuracy of cancellous bone volume fraction measured by micro-CT scanning. J Biomech. 1999;32:323–326. doi: 10.1016/s0021-9290(98)00176-6. [DOI] [PubMed] [Google Scholar]
- Duncan AJ. Quality Control and Industrial Statistics. 5. Richard D. Irwin, Inc.; Homewood IL: 1986. pp. 702–747. [Google Scholar]
- Feldkamp LA, Goldstein SA, Parfitt AM, Jesion G, Kleerekoper M. The direct examination of three-dimensional bone architecture in vitro by computed tomography. J Bone Min Res. 1989;4:3–11. doi: 10.1002/jbmr.5650040103. [DOI] [PubMed] [Google Scholar]
- Fellah BH, Weiss P, Gauthier O, Rouillon T, Pilet P, Daculsi G, Layrolle P. Bone repair using a new injectable self-crosslinkable bone substitute. J Orthop Res. 2006;24(4):628–35. doi: 10.1002/jor.20125. [DOI] [PubMed] [Google Scholar]
- Fritton JC, Myers ER, Wright TM, van der Meulen MC. Loading induces site-specific increases in mineral content assessed by microcomputed tomography of the mouse tibia. Bone. 2005;36(6):1030–8. doi: 10.1016/j.bone.2005.02.013. [DOI] [PubMed] [Google Scholar]
- Gasser JA, Ingold P, Grosios K, Laib A, Hammerle S, Koller B. Noninvasive monitoring of changes in structural cancellous bone parameters with a novel prototype micro-CT. J Bone Miner Metab. 2005;23(Suppl):90–6. doi: 10.1007/BF03026331. [DOI] [PubMed] [Google Scholar]
- Hildebrand T, Ruegsegger P. Quantification of Bone Microarchitecture with the Structure Model Index. Computational Methods Biomechanics Biomedical Engineering. 1997;1:15–23. doi: 10.1080/01495739708936692. [DOI] [PubMed] [Google Scholar]
- Hildebrand T, Laib A, Muller R, Dequeker J, Ruegsegger P. Direct three-dimensional morphometric analysis of human cancellous bone: microstructural data from spine, femur, iliac crest, and calcaneus. J Bone Miner Res. 1999;14(7):1167–74. doi: 10.1359/jbmr.1999.14.7.1167. [DOI] [PubMed] [Google Scholar]
- Homminga J, Huiskes R, van Rietbergen B, Ruegsegger P, Weinans H. Introduction and evaluation of a gray-value voxel conversion technique. J Biomech. 2001;34:513–517. doi: 10.1016/s0021-9290(00)00227-x. [DOI] [PubMed] [Google Scholar]
- Kaweblum M, Aguilar MC, Blancas E, Kaweblum J, Lehman WB, Grant AD, Strongwater AM. Histological and radiographic determination of the age of physeal closure of the distal femur, proximal tibia, and proximal fibula of the New Zealand white rabbit. J Orthop Res. 1994;12(5):747–9. doi: 10.1002/jor.1100120519. [DOI] [PubMed] [Google Scholar]
- Kinney JH, Lane NE, Haupt DL. In vivo, 3D-microscopy of trabecular bone. Journal of Bone Mineral Research. 1995;10:264–269. doi: 10.1002/jbmr.5650100213. [DOI] [PubMed] [Google Scholar]
- Kuhn JL, Goldstein SA, Feldkamp LA, Goulet RW, Jesion G. Evaluation of a microcomputed tomography system to study trabecular bone structure. Journal of Orthopaedic Research. 1990;8:833–842. doi: 10.1002/jor.1100080608. [DOI] [PubMed] [Google Scholar]
- Laffargue P, Hildebrand HF, Rtaimate M, Frayssinet P, Amoureux JP, Marchandise X. Evaluation of human recombinant bone morphogenetic protein-2-loaded tricalcium phosphate implants in rabbits’ bone defects. Bone. 1999;25(2 Suppl):55S–58S. doi: 10.1016/s8756-3282(99)00134-9. [DOI] [PubMed] [Google Scholar]
- Laib A, Haeuselmann HJ, Ruegsegger P. In vivo high resolution 3D-QCT of the human forearm. Tech Health Care. 1998;6:329–337. [PubMed] [Google Scholar]
- Laib A, Kumer JL, Majumdar S, Lane NE. The temporal changes of trabecular architecture in ovariectomized rats assessed by MicroCT. Osteoporosis International. 2001;12:936–941. doi: 10.1007/s001980170022. [DOI] [PubMed] [Google Scholar]
- Maes F, Collignon A, Vandermeulen D, Marchal G, Suetens P. Multimodality image registration by maximization of mutual information. IEEE Transactions on Medical Imaging. 1997;16:187–198. doi: 10.1109/42.563664. [DOI] [PubMed] [Google Scholar]
- Müller R, Van Campenhout H, Van Damme B, Van Der Perre G, Dequeker J, Hildebrand T, Rüegsegger P. Morphometric analysis of human bone biopsies: a quantitative structural comparison of histological sections and micro-computed tomography. Bone. 1998;23:59–66. doi: 10.1016/s8756-3282(98)00068-4. [DOI] [PubMed] [Google Scholar]
- Ohsawa K, Neo M, Okamoto T, Tamura J, Nakamura T. In vivo absorption of porous apatite- and wollastonite-containing glass-ceramic. J Mater Sci Mater Med. 2004;15(8):859–64. doi: 10.1023/B:JMSM.0000036273.37843.0c. [DOI] [PubMed] [Google Scholar]
- Orr TE, Villars PA, Mitchell SL, Hsu HP, Spector M. Compressive properties of cancellous bone defects in a rabbit model treated with particles of natural bone mineral and synthetic hydroxyapatite. Biomaterials. 2001;14:1953–9. doi: 10.1016/s0142-9612(00)00370-7. [DOI] [PubMed] [Google Scholar]
- Otsu N. A threshold selection method from gray-level histograms. IEEE Transactions on Systems, Man, and Cybernetics. 1979;9:62–66. [Google Scholar]
- Parfitt AM, Mathews CHE, Villanueva AR, Kleerekoper M, Frame B, Rao DS. Relationships between surface, volume, and thickness of iliac trabecular bone in aging and in osteoporosis. Implications for the microanatomic and cellular mechanisms of bone loss. J Clin Invest. 1983;72:1396–1409. doi: 10.1172/JCI111096. [DOI] [PMC free article] [PubMed] [Google Scholar]
- Pihlajamaki H, Salminen S, Laitinen O, Tynninen O, Bostman O. Tissue response to polyglycolide, polydioxanone, polylevolactide, and metallic pins in cancellous bone: An experimental study on rabbits. J Orthop Res. 2006a;24(8):1597–606. doi: 10.1002/jor.20191. [DOI] [PubMed] [Google Scholar]
- Pihlajamaki H, Bostman O, Tynninen O, Laitinen O. Long-term tissue response to bioabsorbable poly-L-lactide and metallic screws: an experimental study. Bone. 2006b;39(4):932–7. doi: 10.1016/j.bone.2006.04.009. [DOI] [PubMed] [Google Scholar]
- Pistoia W, van Rietbergen B, Lochmueller EM, Lill CA, Eckstein F, Ruegsegger P. Image-based micro-finite-element modeling for improved distal radius strength diagnosis. J Clin Densitometry. 2004;7(2):153–160. doi: 10.1385/jcd:7:2:153. [DOI] [PubMed] [Google Scholar]
- Saha PK, Wehrli FW. Measurement of trabecular bone thickness in the limited resolution regime of in vivo MRI by fuzzy distance transform. IEEE Trans Med Imaging. 2004;23(1):53–62. doi: 10.1109/TMI.2003.819925. [DOI] [PubMed] [Google Scholar]
- Takahashi M, Saha PK, Wehrli FW. Skeletal effects of short-term exposure to dexamethasone and response to risedronate treatment studied in vivo in rabbits by magnetic resonance micro-imaging and spectroscopy. J Bone Miner Metab. 2006;24(6):467–75. doi: 10.1007/s00774-006-0712-1. [DOI] [PubMed] [Google Scholar]
- Ulrich D, van Rietbergen B, Laib A, Ruegsegger P. Load transfer analysis of the distal radius from in-vivo high-resolution CT-imaging. J Biomech. 1999;32:821–828. doi: 10.1016/s0021-9290(99)00062-7. [DOI] [PubMed] [Google Scholar]
- Van der Meulen MCH, Morgan TG, Yang X, Baldini TH, Myers ER, Wright TM, Bostrom MPG. Cancellous bone adaptation to in vivo loading in a rabbit model. Bone. 2006;38(6):871–7. doi: 10.1016/j.bone.2005.11.026. [DOI] [PMC free article] [PubMed] [Google Scholar]
- van Rietbergen B, Weinans H, Huiskes R, Odgaard A. A new method to determine trabecular bone elastic properties and loading using micromechanical finite-element models. J Biomech. 1995;28:69–81. doi: 10.1016/0021-9290(95)80008-5. [DOI] [PubMed] [Google Scholar]
- Voor MJ, Arts JJ, Klein SA, Walschot LH, Verdonschot N, Buma P. Is hydroxyapatite cement an alternative for allograft bone chips in bone grafting procedures? A mechanical and histological study in a rabbit cancellous bone defect model. J Biomed Mater Res B Appl Biomater. 2004;71(2):398–407. doi: 10.1002/jbm.b.30109. [DOI] [PubMed] [Google Scholar]
- Voor MJ, Greene JW, Antekeier SB, Yang S, Kam BH, Waddell SW, Burden RL., Jr Ovariectomy with low calcium diet is comparable to ovariectomy with hiogh dose steroids as a rabbit model of osteoporosis. Proceedings of the 51st Annual Meeting of the Orthopaedic Research Society; Washington DC. 2005. p. #1120. [Google Scholar]
- Waarsing JH, Day JS, van der Linden JC, Ederveen AG, Spanjers C, De Clerck N, Sasov A, Verhaar JA, Weinans H. Detecting and tracking local changes in the tibiae of individual rats: a novel method to analyse longitudinal in vivo micro-CT data. Bone. 2004a;34(1):163–9. doi: 10.1016/j.bone.2003.08.012. [DOI] [PubMed] [Google Scholar]
- Waarsing JH, Day JS, Weinans H. An improved segmentation method for in vivo μCT Imaging. Journal of Bone and Mineral Research. 2004b;19:1640–1650. doi: 10.1359/JBMR.040705. [DOI] [PubMed] [Google Scholar]
- Waarsing JH, Day JS, Verhaar JA, Ederveen AG, Weinans H. Bone loss dynamics result in trabecular alignment in aging and ovariectomized rats. J Orthop Res. 2006;24(5):926–35. doi: 10.1002/jor.20063. [DOI] [PubMed] [Google Scholar]
- Wang Z, Goh J, Das De S, Ge Z, Ouyang H, Chong JS, Low SL, Lee EH. Efficacy of bone marrow-derived stem cells in strengthening osteoporotic bone in a rabbit model. Tissue Eng. 2006;12(7):1753–61. doi: 10.1089/ten.2006.12.1753. [DOI] [PubMed] [Google Scholar]
- Yang S, Hnat WP, Voor MJ. A new voxel grayscale based 3D Image Registration Validation Method. Proceedings of the XXth Congress of the International Society of Biomechanics and 29th Annual Meeting of the American Society of Biomechanics; Cleveland, Ohio. 2005. [Google Scholar]
- Yang S. PhD Dissertation. Orthopaedic Bioengineering Laboratory, University of Louisville Press; Louisville, KY: 2006. Animal Experiment (Rabbit) to Demonstrate Changes in Trabecular Bone Mechanical Properties over Time Using Finite Element Analysis. [Google Scholar]
Associated Data
This section collects any data citations, data availability statements, or supplementary materials included in this article.