Abstract
The plant SABATH protein family encompasses a group of related small-molecule methyltransferases (MTs) that catalyze the S-adenosyl-l-methionine-dependent methylation of natural chemicals encompassing widely divergent structures. Indole-3-acetic acid (IAA) methyltransferase (IAMT) is a member of the SABATH family that modulates IAA homeostasis in plant tissues through methylation of IAA's free carboxyl group. The crystal structure of Arabidopsis (Arabidopsis thaliana) IAMT (AtIAMT1) was determined and refined to 2.75 Å resolution. The overall tertiary and quaternary structures closely resemble the two-domain bilobed monomer and the dimeric arrangement, respectively, previously observed for the related salicylic acid carboxyl methyltransferase from Clarkia breweri (CbSAMT). To further our understanding of the biological function and evolution of SABATHs, especially of IAMT, we analyzed the SABATH gene family in the rice (Oryza sativa) genome. Forty-one OsSABATH genes were identified. Expression analysis showed that more than one-half of the OsSABATH genes were transcribed in one or multiple organs. The OsSABATH gene most similar to AtIAMT1 is OsSABATH4. Escherichia coli-expressed OsSABATH4 protein displayed the highest level of catalytic activity toward IAA and was therefore named OsIAMT1. OsIAMT1 exhibited kinetic properties similar to AtIAMT1 and poplar IAMT (PtIAMT1). Structural modeling of OsIAMT1 and PtIAMT1 using the experimentally determined structure of AtIAMT1 reported here as a template revealed conserved structural features of IAMTs within the active-site cavity that are divergent from functionally distinct members of the SABATH family, such as CbSAMT. Phylogenetic analysis revealed that IAMTs from Arabidopsis, rice, and poplar (Populus spp.) form a monophyletic group. Thus, structural, biochemical, and phylogenetic evidence supports the hypothesis that IAMT is an evolutionarily ancient member of the SABATH family likely to play a critical role in IAA homeostasis across a wide range of plants.
A group of structurally and phylogenetically related methyltransferases (MTs), called the SABATH family, was recently identified in plants (D'Auria et al., 2003). Biochemically characterized members of the SABATH family methylate the nitrogen atom or carboxyl groups found in a variety of plant small molecules. Salicylic acid (SA) MT (SAMT), the first characterized member of the family, catalyzes the formation of methyl salicylate (MeSA) from salicylic acid (SA) and S-adenosyl-l-Met (SAM; Ross et al., 1999; Negre et al., 2002). Benzoic acid (BA) MT (BAMT) uses BA to produce methyl benzoate (MeBA; Murfitt et al., 2000). Some SABATH proteins possess dual functionality exhibiting both SAMT and BAMT activity and are therefore called BSMTs (Chen et al., 2003; Pott et al., 2004). Both MeSA and MeBA are components of the floral scents of some plants and are also produced by vegetative parts of plants in response to environmental challenge (Chen et al., 2003).
Jasmonic acid (JA) MT (JMT) accepts jasmonate as a substrate to produce methyl jasmonate. In Arabidopsis (Arabidopsis thaliana), the JMT gene is involved in plant defense (Seo et al., 2001). Farnesoic acid (FA) MT (FAMT) converts FA to methyl farnesoate. Arabidopsis FAMT (AtFAMT) was identified using high-throughput biochemical assays (Yang et al., 2006). Gene expression analysis suggests that the AtFAMT gene, like other members of the SABATH gene family, has an as-yet unidentified role in plant defense (Yang et al., 2006). Indole-3-acetic acid (IAA) MT (IAMT) catalyzes the methylation of the free carboxyl end of the plant hormone IAA. IAMT has been characterized in Arabidopsis (Zubieta et al., 2003) and poplar (Populus spp.; Zhao et al., 2007). Genetic analysis suggests the Arabidopsis IAMT (AtIAMT1) gene plays a role in leaf development (Qin et al., 2005). More recently, gibberellic acid (GA) methyltransferases (GAMTs) were shown to specifically methylate several types of GAs (Varbanova et al., 2007).
In addition to carboxyl MTs, the SABATH family includes a number of nitrogen-directed MTs involved in caffeine biosynthesis (Ogawa et al., 2001). Caffeine (1,3,7-trimethylxanthine) is an alkaloid secondary metabolite produced by certain plant species, with coffee (Coffea arabica) and tea (Camellia sinica) being the best known. Caffeine is synthesized from xanthosine after three nitrogen-directed methylation steps, catalyzed by xanthosine MT (XMT), 7-methylxanthine MT (theobromine synthase), and 3,7-methylxanthine MT (caffeine synthase), respectively (Ashihara et al., 1996). A number of genes encoding these enzymes have been isolated from coffee (Ogawa et al., 2001; Mizuno et al., 2003) and tea plants (Kato et al., 2000; Yoneyama et al., 2006). Sequence analysis showed that all of these genes belong to the SABATH family (Yoneyama et al., 2006).
The continued identification and biochemical characterization of SABATH proteins will greatly benefit from the identification of the structural features responsible for substrate recognition that must have undergone evolutionary variation to refine their selectivity toward specific small molecules critical to plant development and survival in a variety of ecological niches. To date, the three-dimensional crystal structure of three SABATH proteins has been determined, including Clarkia breweri SAMT (Zubieta et al., 2003), coffee XMT, and 3,7-methylxanthine MT (McCarthy and McCarthy, 2007). In addition, the three-dimensional structure of the active site of CbSAMT served as a useful template for constructing homology models of the active sites of other SAMTs (Pott et al., 2004) as well as the active sites of functionally distinct members of the SABATH family, including IAMT (Zubieta et al., 2003; Qin et al., 2005) and FAMT (Yang et al., 2006). These analyses provided useful insights into the structural basis for natural variations of substrate specificity among SABATH proteins. Nonetheless, to more accurately identify the structural determinants responsible for substrate specificity among SABATH proteins, an experimentally determined three-dimensional structure for each member of the SABATH family is necessary, particularly when subtle structural rearrangements or insertions and deletions occur within the core primary sequence of the growing family of SABATH enzymes. This task is particularly daunting because a large number of SABATH sequences have been found in many plant genomes through genomic and EST sequencing projects (D'Auria et al. 2003; F. Chen, unpublished data). Comparative genomic analysis of SABATH genes in these plant species, in particular, identification of orthologous genes and determination of the substrate specificity of the enzymes they encode, will also aid in providing useful insight into the evolution of SABATH proteins within and among plant species and the physiological relevance of small-molecule methylation reactions in plant growth and development.
Here, we report the determination of the three-dimensional structure of Arabidopsis IAMT, the biochemical analysis of IAMT from rice (Oryza sativa), as well as the phylogenetic analysis of the entire SABATH family from rice and Arabidopsis. The three-dimensional structure of Arabidopsis IAMT was further used to model the active site of rice IAMT, as well as of poplar IAMT, whose biochemical activity has recently been demonstrated (Zhao et al., 2007).
RESULTS
Three-Dimensional Architecture of AtIAMT1
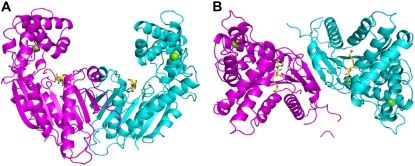
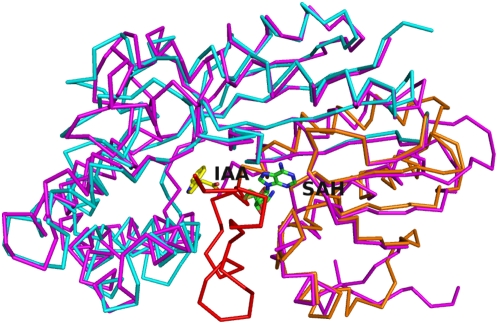
The overall structure of AtIAMT1 (Fig. 1) is similar to CbSAMT (Zubieta et al., 2003; Fig. 2), with a root-mean-square distance (rmsd) for aligned α-carbons of 2.0 Å (rmsd calculated after structural alignment using the DALI server; www.ebi.ac.uk/dali). The monomer fold comprises two clearly delineated domains, a C-terminal catalytic domain involved in SAM/S-adenosyl-l-homo-Cys (SAH) and substrate binding, comprising residues 149 to 374 (α-helices α4–α11; 310 helix η1; β-strands β4–β7; Fig. 3), and an N-terminal capping domain spanning residues 1 to 148 (α-helices α1–α3; β-strands β1–β3; Figs. 3 and 4) involved in dimer formation, a portion of which extends over the carboxyl-bearing substrate (Zubieta et al., 2003) to orient the methyl acceptor near SAM. The SAM-binding C-terminal domain possesses the commonly observed α/β-fold of a large superfamily of SAM-dependent MTs that diverge in the number and size of accessory domains (Fig. 1).
Figure 1.
Ribbon diagram of the AtIAMT1 dimer. A, Front view. B, Top view. The two monomers are represented in magenta and cyan, respectively. SAH is represented as yellow sticks. This figure was produced with PyMOL (www.pymol.org).
Figure 2.
Superposition of CbSAMT and AtIAMT1 (magenta). SAH and IAA (from docking calculations) are represented as green and yellow sticks, respectively. The mobile N-terminal active-site capping loop, the N-terminal cap-like domain, and the C-terminal SAM/substrate-binding domain of CbSAMT are colored red, orange, and cyan, respectively. This figure was produced with PyMOL (www.pymol.org).
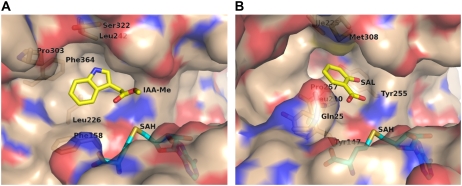
Figure 3.
Molecular surface view of the active site of AtIAMT1 (A) and CbSAMT (B). In B, residues 1 to 24, 307, and 311 are omitted. This figure was produced with PyMOL (www.pymol.org).
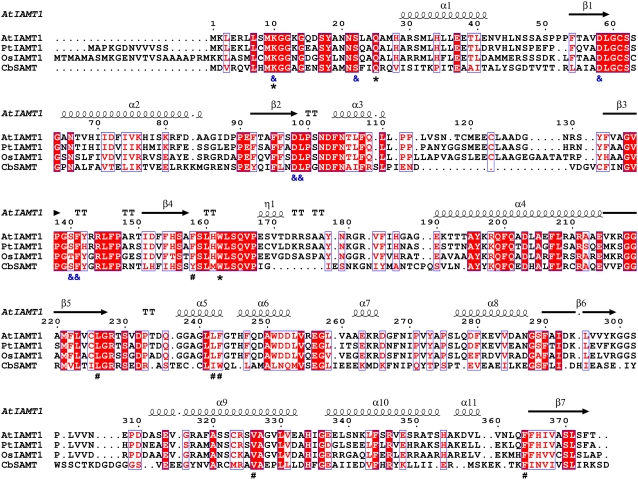
Figure 4.
Structure-based sequence alignment of IAMTs and CbSAMT. Blue frames indicate conserved residues, white characters in red boxes indicate strict identity, and red characters in white boxes indicate similarity. The secondary structure elements indicated above the alignment are those of AtIAMT1, whose structure has been experimentally determined and described here. Residues indicated with “ &” below the alignment are SAM/SAH-binding residues. Residues indicated with “*” are residues that interact with the carboxyl moiety of IAA. Residues indicated with “#” interact with the aromatic moiety of the substrate and are important for substrate selectivity. CbSAMT, C. breweri SAMT (Ross et al., 1999); PtIAMT1, poplar IAMT (Zhao et al., 2007); OsIAMT1, rice IAMT (this study). This figure was prepared with ESPript (Gouet et al., 1999).
The quaternary structure of AtIAMT1 (one homodimer observed per asymmetric unit; Fig. 1) again is shared with CbSAMT (Zubieta et al., 2003). The surface area buried in the dimerization interface is about 1,025 Å2, which represents only 6.3% of the total surface area of each monomer. As in CbSAMT, and unlike most of the plant small-molecule O-MTs structurally characterized to date (Zubieta et al., 2001, 2002), the dyad-related monomer of IAMT does not contribute to the active site of its partner molecule (Fig. 1).
The first 49 residues of AtIAMT1 in this particular set of crystal structures form a mobile loop. In fact, recognizable electron density attributable to residues 1 to 24 is noticeably absent from the refined AtIAMT1 crystal structure, which also lacks a bound IAA substrate. The mobile active-site capping loop in CbSAMT equivalent to residues 1 to 24 in AtIAMT1 closes the active site, forming a series of interatomic interactions with the carboxyl group of the bound salicylate substrate (Zubieta et al., 2003).
Active-Site Topology of AtIAMT1
As expected from sequence alignments, the residues of AtIAMT1 likely to interact with the carboxyl moiety of the IAA substrate are strictly conserved with respect to CbSAMT. These residues include Lys-10, Gln-25 (not observed in electron density and located on the mobile N-terminal active-site capping loop), and Trp-162 (Trp-151 in CbSAMT). The majority of the carboxyl-bearing substrate-binding pocket in AtIAMT1 is noticeably hydrophobic and rich in aromatic residues as previously seen in CbSAMT (Fig. 4). Residues include Phe-158 (Tyr-147 in CbSAMT), Leu-226 (Leu-210 in CbSAMT), Leu-242 (Ile-225 in CbSAMT), Phe-243 (Trp-226 in CbSAMT), Val-326 (Val-311 in CbSAMT), and Phe-364 (Phe-347 in CbSAMT).
Identification of the SABATH Gene Family in Rice
To identify the complete SABATH gene family from the fully sequenced rice genome (International Rice Genome Sequencing Project, 2005), the protein sequence of CbSAMT was initially used to search the genome sequence database of rice using the BLASTP algorithm (Altschul et al., 1990). The new SABATH-like sequences detected were in turn used reiteratively to search the same sequence database. Through this iterative sequence search, 41 sequences encoding proteins bearing significant similarity to known SABATH proteins were identified in the rice genome (Supplemental Table S1). It should be noted that, among the 41 OsSABATH sequences, 15 of them appear to encode proteins shorter than 300 amino acid residues. Some of the shorter proteins may be due to inaccurate annotation (Rouze et al., 1999) and some of them may represent pseudogenes. Some of the genes annotated to encode proteins over 350 amino acid residues in length may also be pseudogenes, as shown in Supplemental Figure S1. Additional efforts to characterize these genes will clarify whether individual OsSABATH sequences code for intact genes or pseudogenes.
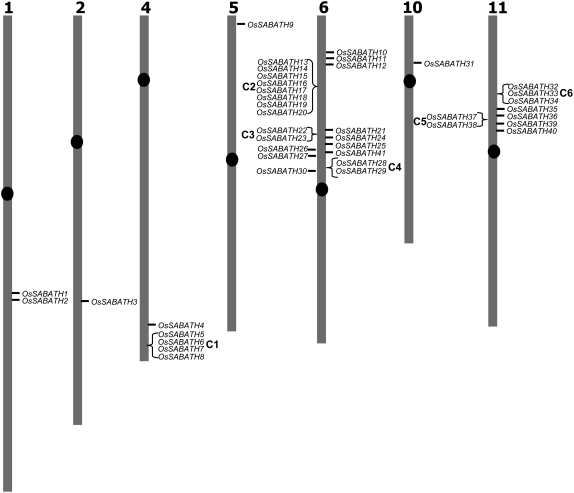
Mapping the physical locations of the 41 OsSABATH genes revealed that these genes are scattered on seven chromosomes that include chromosomes 1, 2, 4, 5, 6, 10, and 11 (Fig. 5). More than one-half of the OsSABATH genes (22) are localized on chromosome 6. In contrast, chromosomes 3, 5, and 10 each contain only one SABATH gene. Twenty-two OsSABATH genes are localized in six clusters in which OsSABATH genes are adjacent or separated by one unrelated gene. Cluster C6 contains eight OsSABATH genes (Fig. 5).
Figure 5.
Chromosomal location of OsSABATH genes. Forty-one OsSABATH genes are localized on seven chromosomes (1, 2, 4, 5, 6, 10, and 11). Twenty-two genes are situated in six clusters (C1–C6). In each cluster, neighboring genes are found either as tandem repeats or separated by one gene that is not a SABATH family member.
Expression Analysis of OsSABATH Genes
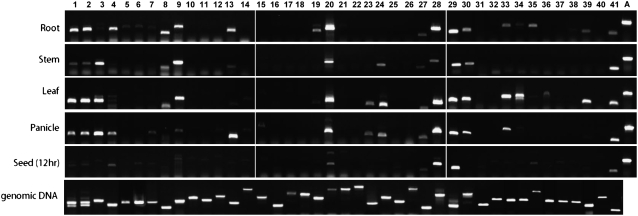
To obtain information on the biological processes in which OsSABATHs may be involved, comprehensive gene expression analyses using semiquantitative reverse transcription (RT)-PCR were performed for all OsSABATH genes using gene-specific primers. PCR employing rice genomic DNA as template was conducted to confirm the effectiveness of the primers used in RT-PCR. Gene expression analyses were performed with leaves, roots, and stems from 1-month-old seedlings, panicles from 4-month-old flowering plants, and germinating seeds.
In these experiments, results for different genes in the same organ are directly comparable because an identical aliquot of cDNA from the original RT reaction was used in each PCR. To determine whether equal amounts of cDNA were used in the reactions involving different organs, we also performed RT-PCR with primers designed to detect actin mRNA. After RT-PCR, amplified fragments from mRNAs of 23 of the 41 OsSABATH genes were obtained from at least one organ (Fig. 6). Expression of 20 genes was detected in roots, 13 genes in stems, 16 genes in leaves, 16 genes in panicles, and 10 genes in germinating seeds. Nine genes showed expression in all tissues examined. In contrast, 16 genes exhibited no expression in any of the tissues examined.
Figure 6.
Expression analysis of rice SABATH genes. Total RNA was extracted from leaves, stems, and roots of 2-week-old seedlings, panicles from 4-month-old plants, and germinating seeds, and used for RT-PCR. Numbers 1 to 41 on the top of the figure denote OsSABATH1 to OsSABATH41. Expression of an actin gene (A) was used as an internal control. PCR using rice genomic DNA as template was also performed.
Identification of OsIAMT1 and Its Biochemical Properties
The rice SABATH gene that is most similar to AtIAMT1 is OsSABATH4. OsSABATH4 encodes a protein spanning 404 amino acid residues with a calculated molecular mass of 43.8 kD. At the amino acid sequence level, OsSABATH4 is 61% identical to AtIAMT1. To determine whether this gene encodes rice IAMT, full-length cDNA of OsSABATH4 was cloned and protein expressed in Escherichia coli. The protein was purified and tested with a group of potential substrates, including IAA, indole-3-butyric acid (IBA), SA, JA, FA, and GA. Dichlorophenoxyacetic acid (2,4-D), a synthetic compound structurally highly similar to IAA, was also tested as a substrate. OsSABATH4 displayed the highest level of catalytic activity with IAA, exhibiting specific activity of 504 ± 31 pkat/mg protein. The enzyme also displayed activity with IBA and 2,4-D, but only at 2% and 5% levels of the activity measured with IAA, respectively (AtIAMT, tested for comparative purposes, possessed 12% and 30% of the activity with IBA and 2,4-D compared with its activity measured using IAA as a substrate, respectively). OsSABATH4 exhibited no activity with SA, JA, FA, and GA used as substrates (AtIAMT also had no activity with these substrates). The substrate specificity of the protein encoded by OsSABATH4 is therefore very similar to AtIAMT. Because we have not yet analyzed all rice SABATH proteins and cannot rule out the possibility that other OsSABATHs also possess IAMT activity, we named OsSABATH4 OsIAMT1.
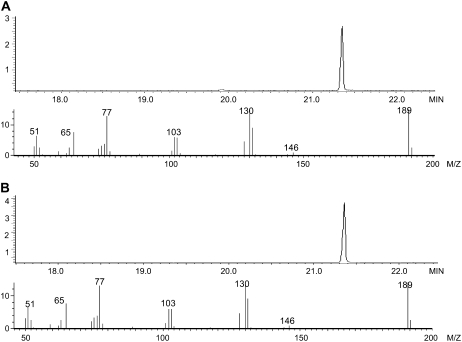
To determine the chemical structure of the product of OsIAMT1, the compound produced from the OsIAMT1 enzyme assay with IAA as a substrate was extracted with hexane and analyzed using gas chromatography (GC)-mass spectrometry (MS). As shown in Figure 7, the product showed the same retention time and mass fragmentation spectrum as the authentic methyl indole-3-acetate (MeIAA) standard, confirming that OsIAMT1 catalyzes the formation of MeIAA using SAM as a methyl donor and IAA as a methyl acceptor.
Figure 7.
GC-MS analysis of the product of the enzyme assay catalyzed by recombinant OstIAMT1 protein with IAA as the substrate. A, GC chromatogram of the hexane extract of an OsIAMT1 enzyme assay with IAA and the mass fragmentation spectrum of the methylated product. B, GC chromatogram of a MeIAA authentic standard and its mass fragmentation spectrum.
To determine the pH optimum of the enzymatic assays, OsIAMT1 was assayed with IAA at buffers with differing pH values between pH 6.5 to pH 10.0. The optimal pH was determined to be pH 7.5. At pH 6.5, the enzyme showed 20% of its maximal activity. At pH 9.0, the activity was 30% of the maximum. As observed for other SABATH proteins that have been biochemically characterized, OsIAMT1 activity can be affected by metal ions. K+, NH4+, and Na+ all stimulated OsIAMT1 activity by more than 1.5-fold. Inclusion of Ca2+ or Mg2+ resulted in an approximately 15% reduction in OsIAMT1 activity. In contrast, Mn2+, Cu2+, Fe2+, Fe3+, and Zn2+ all had a strong inhibitory effect on OsIAMT1 activity, reducing OsIAMT1 activity by more than 95%. Kinetic parameters for OsIAMT1 were also determined. Under steady-state conditions, OsIAMT1 exhibited Km values of 17.9 ± 1.2 μm and 7.3 ± 0.4 μm for IAA and SAM, respectively, and a kcat of 0.025 ± 0.0001 s−1.
Molecular Modeling of Rice and Poplar IAMTs
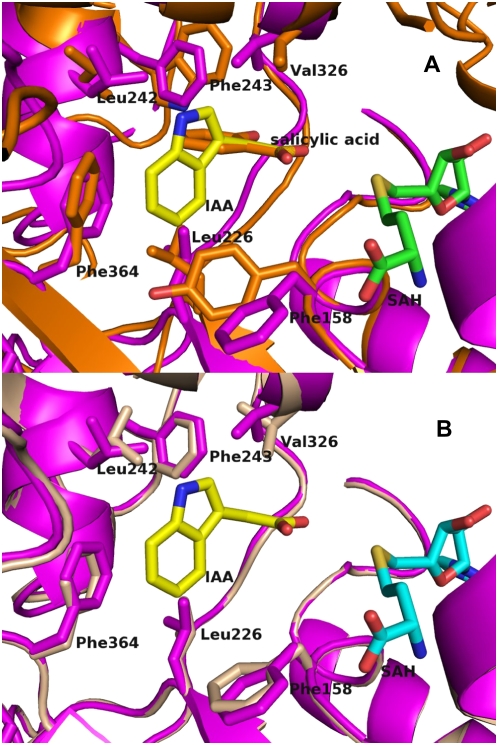
Homology models of OsIAMT1 (Fig. 8B) and PtIAMT1 (data not shown) were built with modeler (Sali and Blundell, 1993) based on the experimental AtIAMT1 structure reported here (PDB ID 3B5I). These models show a high degree of similarity of the overall structure among AtIAMT1, OsIAMT1, and PtIAMT1 (Fig. 8), which is a predictable consequence of the protein sequence similarity. Furthermore, these models also exhibit the hydrophobic residues that form the substrate-binding site previously observed in AtIAMT1 (Phe-158, Leu-226, Leu-242, Phe-243, Val-326, and Phe-364 in the AtIAMT1 sequence; Fig. 4).
Figure 8.
A, Comparison of AtIAMT (magenta) and CbSAMT (orange) active sites. B, Comparison of the active sites of AtIAMT1 (magenta) and a homology model of OsIAMT1 (wheat). The latter was calculated with a modeler (Sali and Blundell, 1993) based on the experimentally determined AtIAMT1 structure (magenta). Secondary structures are represented as ribbons and most of the active-site residues involved in substrate recognition are represented as filled and color-coded bonds. SAH is represented as green sticks, IAA as yellow sticks, and SAH as orange sticks. This figure was produced with PyMOL (http://www.pymol.org).
Phylogenetic Analysis of SABATHs
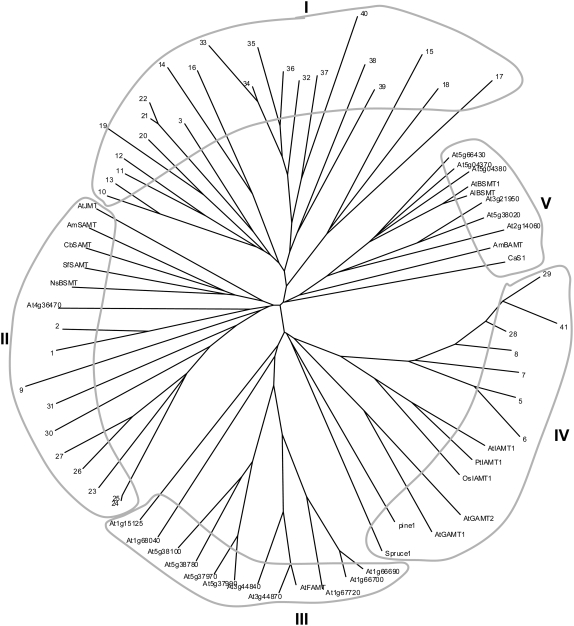
Arabidopsis was the first plant species in which the complete SABATH gene family was identified (Chen et al., 2003; D'Auria et al., 2003). To understand the evolutionary relationships among SABATH proteins, a phylogenetic tree containing the entire set of rice and Arabidopsis SABATH proteins and selected SABATH proteins from other plants was constructed (Fig. 9). When only SABATHs from rice are considered, 41 OsSABATHs group into three clades (I, II, and III). Clade I contains 23 OsSABATHs, subdivided into two subclades. One subclade contains the majority of the OsSABATH genes found on chromosome 6. The other subclade contains all OsSABATH genes localized on chromosome 11. When OsSABATH proteins and AtSABATH proteins are analyzed together, five clades emerge. Clade I appears to be rice specific. In contrast, clades III and V contain only Arabidopsis SABATHs. Considering known Arabidopsis SABATH proteins, AtFAMT resides in clade III and AtBSMT resides in clade V. Clades II and IV contain SABATHs from both Arabidopsis and rice. Two AtSABATH proteins, including AtJMT and 10 OsSABATHs, cluster in clade II. Three AtSABATHs (AtIAMT1, AtGAMT1, and AtGAMT2) and eight OsSABATHs localize in clade IV.
Figure 9.
Neighbor-joining tree based on the degree of sequence similarity between rice SABATHs, Arabidopsis SABATHs, and selected SABATHs from other plants. Numbers 1 to 41 denote OsSABATH1 to OsSABATH41. CbSAMT, C. breweri SAMT (accession no. AF133053); AmSAMT, A. majus (snapdragon) SAMT (accession no. AF515284); SfSAMT, S. floribunda SAMT (accession no. AF308570); AmBAMT, A. majus BAMT (accession no. AF198492); NsBSMT, N. suaveolens BSMT (accession no. AJ628349); Cas1, C. arabica caffeine synthase 1 (accession no. AB086414); pine 1 and spruce 1 represent SABATH-like proteins identified from pine and white spruce, respectively. Branches were drawn to scale with the bar indicating 0.1 substitutions per site.
Previously identified SABATH proteins from other plants group in clades II, IV, and V (Fig. 9). CbSAMT and SAMTs isolated from snapdragon (Antirrhinum majus), Stephanotis floribunda, and Nicotiana suaveolens sit in clade II. Snapdragon BAMT and coffee caffeine synthase (CCS1) reside in clade V. Notably, AtIAMT1, OsIAMT1, and PtIAMT1 form a monophyletic group, which is closely related to putative SABATHs identified from gymnosperm species (Fig. 9).
DISCUSSION
Structural Basis for Substrate Specialization of SABATH Proteins
The previously determined CbSAMT structure was obtained with SAH (demethylated SAM) and salicylate bound in the active site. The AtIAMT1 structure obtained and described in this article has only SAH and no visible IAA bound to its active site. The absence of well-defined electron density for the N-terminal active-site capping loop in the current structure of AtIAMT1, whereas the same loop is well ordered in the previously published CbSAMT structure, suggests that this polypeptide segment acts as a dynamic lid to lock down substrates and desolvate the carboxyl group undergoing methylation. This hypothesis is supported not only by the apparent mobility of the capping loop, which allows substrate entry, but also by the absolute conservation of the capping-loop residues interacting with the substrate's carboxyl moiety, including Lys-10 and Gln-25. Through hydrogen bonding interactions, these residues ensure that water molecules solvating the carboxyl group and reducing its reactivity are eliminated. This desolvation mechanism is a prerequisite for enhancing the intrinsic reactivity of the negatively charged carboxyl oxygen now abutting the electrophilic methyl group of bound SAM. Moreover, 42% of the residues located on the mobile loop (1–24) are strictly conserved among the four MTs shown in Figure 4.
Interestingly, standard sequence alignments and homology-based models calculated from the previously published CbSAMT structure predict that Trp-226 of CbSAMT is replaced by Gly-244 in AtIAMT1, leading to an intuitively simple explanation for the IAA specificity of IAMT1 (Zubieta et al., 2003). However, as a warning against over-reliance on homology models even for proteins possessing a high degree of sequence identity/similarity, it was observed in the experimentally determined AtIAMT1 crystallographic structure that loop α5 is shifted by one residue compared to the sequence alignments, thus superimposing Phe-243 of AtIAMT1 with Trp-226 of CbSAMT. This significant readjustment of the actual structure relative to the previously published homology model (Zubieta et al., 2003) leaves little room in this portion of the active site compared to CbSAMT. The more restricted AtIAMT1 active site relative to the original homology model based on CbSAMT suggests that, in AtIAMT1, the IAA substrate will assume quite a different conformation to avoid a clash of the indole ring of IAA with Phe-243.
To build a model of IAA bound to AtIAMT1 that takes into account the differences between the IAMT and SAMT active sites noted here, in silico docking techniques were used. The first attempts to computationally calculate a binding orientation for IAA without spatial restraints failed. This lack of initial success is likely due to the absence of the critical N-terminal active-site capping loop responsible for highly specific interactions with the carboxyl moiety of bound substrates. A second computational attempt was undertaken, this time using hard constraints to ensure that one oxygen of the carboxyl group is located within the appropriate distance for methyl transfer from SAM, and within a sphere of 1 Å diameter centered on the equivalent position in CbSAMT complexed with salicylate. The resulting docking model with favorable docking scores show that the indole ring of IAA points away from Phe-243 and forms energetically favorable van der Waals and aromatic-aromatic interactions with Phe-158 and Phe-364 (Figs. 3A and 8).
Based on these computational results, Phe-158, Pro-303, and Ser-322 appear to be primarily responsible for the IAA specificity of AtIAMT1, with Ser-322 possibly involved in forming a specific hydrogen bond with the indole ring nitrogen of IAA (upon rotation with respect to the Cα-Cβ bond; Oγ atom of Ser-322 resides as close as 2.9 Å from the indole nitrogen atom). Indeed, all three residues contribute to the IAA-binding pocket and, based on structure-based sequence alignments, are conserved residues in the three IAMTs listed and are consistently different in SAMTs (Figs. 3 and 4).
Biological Roles of IAMTs
IAA is the most abundant and active endogenous auxin in higher plants (Leyser, 2002). It modulates diverse aspects of plant growth and development, including embryogenesis, lateral and adventitious root formation, and induction of vascular differentiation (Teale et al., 2006). Methylation of IAA is likely to have multiple biological consequences. OsIAMT1, AtIAMT1, and PtIAMT1 all exhibited expression in multiple tissues (Fig. 6; Qin et al., 2005; Zhao et al., 2007), suggesting that IAMT is involved in a variety of biological processes. AtIAMT1 was shown to play a role in leaf development (Qin et al., 2005). AtIAMT1 exhibited ubiquitous expression in young leaves and edge-specific expression in old leaves. Down-regulating AtIAMT1 expression leads to dramatic epinastic leaf phenotypes (Qin et al., 2005). Poplar IAMT1 also showed higher expression in young leaves than old leaves (Zhao et al., 2007). Additionally, PtIAMT1 also displayed high expression levels in stems. Because IAA is involved in secondary wood development (Moyle et al., 2002), it was hypothesized that PtIAMT1 may serve a critical role in xylem formation in perennial woody species (Zhao et al., 2007).
OsIAMT1 also exhibited expression in multiple tissues. OsIAMT1 showed high levels of expression in roots and panicles (Fig. 6). In rice, IAA plays critical roles in root development, including elongation of the primary roots, initiation and elongation of lateral roots, formation of adventitious roots, and root gravitropism (Chhun et al., 2003). Although the mode of action in these cases is not well understood, the concentration of IAA appears to be important in regulating IAA activity in rice roots (Wang et al., 2003). The presence of OsIAMT1 transcripts in rice roots suggests that OsIAMT1 is involved in root development by regulating the homeostasis of IAA in the tissue. IAA also appears to play a role in rice grain development. During grain filling, dramatic reduction in the levels of IAA in panicles has been observed (Yang et al., 2000). The high level of OsIAMT1 transcripts in rice panicles (Fig. 6) implies that OsIAMT1 is involved in the reduced level of IAA found there. Expression of IAMTs in leaves of different plant species suggests that their function in leaf development may be evolutionarily conserved. Their divergent expression patterns in certain tissues, for instance, high expression levels in poplar stems and very low expression levels in rice stems, imply that IAMTs may also have acquired lineage-specific roles in different plant species.
Evolution of the SABATH Gene Family
Rice is the second plant species, after Arabidopsis, in which the entire SABATH gene family has been identified. The size of the OsSABATH family, 41 members, is larger than that of the AtSABATH family, which contains 24 members (D'Auria et al., 2003). In contrast to AtSABATH genes, which are localized on all five chromosomes, the 41 OsSABATH genes are localized on 7 of the 12 chromosomes found in rice (Fig. 5). Notably, about one-half of the OsSABATH genes are localized in clusters in which OsSABATH genes are organized as tandem repeats. This observation suggests that local duplication of OsSABATH genes contributes substantially to the large size of the OsSABATH family.
The majority of OsSABATH genes were transcribed under normal growing conditions (Fig. 6). Some of these genes, such as OsSABATH29, appear to have roles in the general biology of rice plants because they are expressed in all tissues examined. Other OsSABATH genes, such as OsSABATH19, may have a tissue-specific role because they are expressed only in some tissues. Expression analysis of OsSABATH genes in leaves, roots, and stems presented here was done with tissues from 1-month-old plants. It will be interesting to examine the developmental regulation of expression of these genes in various tissues. Genes that showed no expression in any of the tissues examined may be expressed under stress conditions. In addition, some of the expressed genes may be up-regulated by stress factors. Detailed expression analysis of OsSABATH genes is still needed to understand the biological roles of OsSABATH genes. Elucidating the biochemical functions of OsSABATH proteins will also be critical for understanding their biological roles. Identification of the complete family of SABATH genes in rice provides unprecedented opportunities for cross-species analysis of the SABATH gene family. Phylogenetic analyses of all rice and Arabidopsis SABATHs suggests that the expansion of the SABATH families in rice and Arabidopsis occurred after the split of the two lineages. It will be interesting to test whether some rice and Arabidopsis SABATHs catalyze divergent biochemical reactions that contribute to the unique biology and ecology of rice and Arabidopsis plants, respectively.
Among all OsSABATHs and AtSABATHs, OsIAMT1 is most related to AtIAMT1, implying that they are likely orthologous genes. In contrast, whether the rice genome encodes AtSABATH proteins with the same catalytic activity as AtJMT, AtBSMT, and AtFAMT, respectively, is difficult to predict from this phylogenetic analysis because each of them is more related to other AtSABATHs than to any OsSABATHs (Fig. 9). Identification and characterization of SABATH genes from related plant species will help determine whether AtJMT, AtBSMT, and AtFAMT evolved after the divergence of Arabidopsis and rice lineages. For example, a recent study showed that OsSABATH3 has BSMT activity in vitro (Koo et al., 2007). Phylogenetic placement of OsSABATH3 in the rice-specific clade I, AtBSMT in clade V, and other known SAMTs in clade II (Fig. 9) suggests that SAMTs emerged several times during the course of SABATH gene evolution. It is interesting to note that caffeine biosynthetic pathways seem to have evolved independently several times in plants as well. This conclusion was drawn based on the observation that the sequence identity between theobromine synthase and caffeine synthase within the genus of Camellia is very high, whereas the sequence identity between the N-methyltransferases involved in caffeine biosynthesis in Camellia and Theobroma is considerably lower (Yoneyama et al., 2006).
As previously demonstrated, the emergence of novel SABATH MT activity can occur rapidly and small changes in primary protein sequences can lead, as for other enzymes of specialized metabolism, to the functional emergence of SABATH proteins with altered substrate preferences (Zubieta et al., 2003; Pichersky et al., 2006). This observation poses difficulty for the functional assessment of SABATH proteins based only on overall sequence similarity to a biochemically characterized protein. Identification of conserved IAMTs from rice, Arabidopsis, and poplar, however, implies that the presence of IAMT predated the divergence of the monocotyledonous and dicotyledonous lineages. Therefore, IAMT is likely an ancient member of the SABATH protein family from which other SABATH MT activity, including JMT, SAMT, and FAMT, may have emerged. This hypothesis will be tested with the continued identification of JMT, SAMT, and FAMT in rice and poplar, their biochemical characterization, and structurally guided approaches for delineating residues that dictate substrate specificity.
MATERIALS AND METHODS
Plant Materials and Chemicals
Rice (Oryza sativa ssp. japonica ‘Nipponbare’) seeds were obtained from Dale Bumpers National Rice Research Center at Arkansas. Dehulled seeds were germinated on filter paper. After 4 d, seedlings were transferred to soil and placed in a growth chamber. Plants were grown under 14-h-light/10-h-dark photoperiods. Temperature fluctuated between 26°C (day) and 22°C (night). Relative humidity was 80% and light intensity was 400 μmol m−2 s−1. Four-week-old seedlings, which were approximately 15 cm tall, were used to collect leaves, stems, and roots for RNA extraction. Panicles were collected from 4-month-old flowering plants. For the seed sample, rice seeds were dehulled and then placed on wet filter paper in growth chambers (26°C). After 18 h, seeds were collected for RNA extraction. All chemicals were purchased from Sigma-Aldrich unless otherwise noted.
Protein X-Ray Crystallography
Full-length cDNA of AtIAMT1 was cloned into the pHIS8 expression vector (Jez et al., 2000). N-terminal His-8-tagged protein was expressed in Escherichia coli BL21 (DE3) cells. Tagged AtIAMT1 was purified from sonicates using a nickel nitrilotriacetic acid agarose column (Qiagen). The His tag was removed using thrombin protease digestion and the cleaved protein was purified to >99% homogeneity by gel filtration chromatography on a Superdex-S200 (Amersham Biosciences) FPLC column, equilibrated in 500 mm KCl, 25 mm HEPES-Na+, pH 7.5, 2 mm dithiothreitol. AtIAMT1-containing fractions were combined and concentrated to 33 mg/mL. An in-house crystallization screen was used to find the initial crystallization conditions (7% [w/v] PEG 8000, 0.25 m KSCN, 100 mm sodium succinate [pH 5.5], or 100 mm PIPES-Na+ [pH 6.5], and 14% [w/v] PEG 8000, 0.25 m KSCN, 100 mm PIPES-Na+ [pH 6.5], or 100 mm MOPSO-Na+ [pH 7.0] in the presence of 1 mm SAH), yielding 0.5-mm × 0.1-mm × 0.05-mm crystals. This first crystallization screen was followed by crystal size and growth optimization varying the concentrations and constituents of the crystallization matrix. Larger, more ordered crystals (0.5 mm × 0.1 mm × 0.1 mm) were obtained at 4°C using a protein concentration of 33 mg/mL, with the following crystallization conditions: 7% (w/v) PEG 20,000, 1 m urea, 0.3 m KNO3, 100 mm MOPSO-Na+ (pH 7.0), and 3 mm SAH. The cryoprotectant used prior to freezing crystals in liquid nitrogen consisted of a final concentration of 17% (v/v) ethylene glycol added to the mother liquor noted above for crystal growth. A 2.75 Å resolution dataset was collected at the National Synchrotron Light Source (NSLS). Data reduction was performed with the XDS program (Kabsch, 1993). The space group was P21 (a = 67.3 Å; b = 129 Å; c = 68.3 Å; β = 112.3°) with two molecules per asymmetric unit (solvent content of 63%). The AtIAMT1 structure was determined by molecular replacement using Molrep (Vagin and Teplyakov, 1997) and Clarkia breweri CbSAMT (PDB code: 1M6E, 34% sequence identity) as a template. A first structure solution, including 345 residues out of the 374 residues of AtIAMT1, was built manually into the experimental electron density maps displayed with Coot (Emsley and Cowtan, 2004) and refined with CNS (Brunger et al., 1998) and Refmac5 (Murshudov et al., 1997; see Table I for data reduction and refinement statistics). Clear electron density was observed in the active site and interpreted as a SAH molecule. Despite several attempts at soaking IAA into existing crystals or growing crystals in the presence of IAA, no IAA was observed in the active site.
Table I.
Crystallographic data and refinement statistics of AtIAMT1
Values in parentheses are for the outer resolution shell.
| Dataset | apo Form |
|---|---|
| X-ray source | NSLS |
| Space group | p21 |
| Cell parameters (Å and °) | a = 67.3, b = 129, c = 68.3, β = 112.3 |
| Wavelength (Å) | 1.009321 |
| Resolution (last shell) (Å) | 50–2.75 (2.82–2.75) |
| Total reflections (last shell) | 60,638 (4,761) |
| Unique reflections (last shell) | 20,426 (1,626) |
| Redundancy (last shell) | 2.97 (2.93) |
| Completeness (last shell) (%) | 72.4 (79.5) |
| Rsyma (last shell) (%) | 9.4 (46.9) |
| I/σ (last shell) | 12.1 (2.72) |
| Rcrystb (last shell) (%) | 25.6 (30.2) |
| Rfreec (last shell) (%) | 28.2 (35.7) |
| rmsd bonds (Å) | 0.012 |
| rmsd angles (°) | 1.45 |
| Nonhydrogen protein atoms | 5,278 |
| Nonhydrogen ligand atoms | 56 |
| Water molecules | 150 |
| Average B factor (Å2) | 50.8 |
| Ramachandran plotd | 87.4/11.4/1.2/0 |
Rsym = Σ|Ii − 〈I〉|/ΣIi, where Ii is the intensity of a reflection and 〈I〉 is the average intensity of that reflection.
Rcryst = Σ‖Fobs| − |Fcalc‖/Σ|Fobs|.
Five percent of the data was set aside for Rfree calculation.
Percentage of residues in most-favored/additionally allowed/generously allowed/disallowed regions of the Ramachandran plot.
In Silico Docking Experiments
In silico docking experiments were carried out with the software package Schrödinger (www.schrodinger.com) and, more specifically, with the subprograms LigPrep (version 1.6; Schrödinger) for energy minimization, Glide (version 3.5; Schrödinger) for docking, and Maestro for visualization. All programs were run on a bi-Opteron 64b Linux computer. Each docking experiment was carried out over an extended area, exceeding the volume of the active site.
Sequence Retrieval and Analysis
The protein sequence of CbSAMT (accession no. AF133053) was used initially as a query sequence to search against the translated rice genome database (http://www.tigr.org/tdb/e2k1/osa1) using the BLASTP algorithm (Altschul et al., 1990). Newly identified SABATH-like sequences were used reiteratively to search the same sequence database. The cutoff e value was set to e−6. The chromosome locations of the rice SABATH genes were generated by Map Viewer (http://www.ncbi.nlm.nih.gov/mapview/static/MVstart.html). Phylogenetic trees were produced using PAUP4.0 based on multiple sequence alignments made with ClustalX (Thompson et al., 1997) and viewed using the TreeView software (http://taxonomy.zoology.gla.ac.uk/rod/treeview.html).
Gene Expression Analysis via RT-PCR
Semiquantitative RT-PCR expression analysis of rice SABATH genes was performed as previously described (Chen et al., 2003). Primer sequences are shown in Supplemental Table S2. Total RNA was isolated with TRIzol (Invitrogen). One microgram of total RNA was synthesized into first-strand cDNA in a 20-μL reaction volume using the iScript cDNA synthesis kit (Bio-Rad Laboratories). One microliter of the resulting cDNA mixture was used for each PCR using the following conditions: initial denaturation at 95°C for 2 min, followed by 30 cycles at 95°C for 45 s, 54°C for 45 s, and 72°C for 60 s, and then followed by a final extension step at 72°C for 10 min.
Purification of Recombinant OsIAMT1
OsIAMT1 full-length cDNA was amplified from rice root tissues by RT-PCR using the forward primer 5′-CACCATGGCTCCTAAAGGTGACAATGTTG-3′ and the reverse primer 5′-CTACTACTATGCGGATGCTGCTATAC-3′. The resulting PCR product was cloned into the pET100/D-TOPO vector (Invitrogen). The construct was transformed into E. coli strain BL21 Codon Plus (Invitrogen). Protein expression was induced by isopropylthio-β-galactoside for 18 h at room temperature. His-tagged OsIAMT1 protein was purified from E. coli cell lysate using nickel nitrilotriacetic acid agarose following the manufacturer's instructions (Invitrogen). Protein purity was verified by SDS-PAGE and protein concentrations were determined using the Bradford assay.
Radiochemical MT Activity Assay
Radiochemical MT assays were performed in a 50-μL volume containing 50 mm Tris-HCl, pH 7.5, 1 mm substrate (IAA, 2,4-D, SA, JA, FA, or GA), 0.4 μL of 14C-SAM (Perkin-Elmer), and 0.3 μg of purified OsIAMT1. The assay was initiated with the addition of SAM and maintained at 25°C for 30 min. The reaction was stopped by the addition of 150 μL of ethyl acetate, vortexed, and phase separated using 1-min centrifugation at 14,000g. The upper organic phase was counted using a liquid scintillation counter (Beckman-Coulter). The amount of radioactivity extracted into the organic phase correlated to the amount of methyl ester formed by the recombinant enzyme and 14C-SAM. Three independent assays were performed for each compound. In addition to its use in determination of substrate specificity of OsIAMT1, the radioactive MT assay was also used to determine kinetic parameters, pH optimum, and effector effects of OsIAMT1.
Determination of Kinetic Parameters of OsIAMT1
In all kinetic analyses, the appropriate enzyme concentrations of OsIAMT1 and incubation times were chosen so that the reaction velocity was linear during the reaction time period examined. To determine the Km values for IAA and SAM, one substrate concentration was fixed at a saturating level and the concentration of the other substrate was varied. Km values and maximal velocity values were obtained as previously described (Chen et al., 2003). Final values were an average of three independent measurements after nonlinear regression analyses using the Michaelis-Menten equation.
pH Optimum for OsIAMT1 Activity
OsIAMT1 activity was determined in a 50 mm Bis-Tris propane buffer for the pH range 6.5 to 10 using the standard IAMT assay described above. The resultant kinetic constants used for determination of the pH optimum were an average of three independent assays.
Effectors
To examine effects of metal ions on OsIAMT1 activity, standard IAMT assays were performed in the independent presence of each of the following salts at 5 mm final concentration: KCl, CaCl2, NH4Cl, NaCl, MgCl2, MnCl2, CuCl2, FeCl2, and ZnCl2. Results presented were an average of three independent assays.
Product Identification
A reaction containing 150 μg of purified OsIAMT1, 1 mm IAA, and 600 μm SAM was incubated in a 1-mL reaction volume containing 50 mm Tris-HCl, pH 7.5, for 4 h at 25°C. The product was extracted with 1.5 mL of hexane, the hexane layer concentrated under N2 gas, and the resultant organic concentrate analyzed on a Shimadzu GC (GC-17A)-MS (QP 5050A) system. A DB-5 column (30 m × 0.25 i.d. × 0.25 μm) was used with helium as carrier gas at a flow rate of 1 mL/min. As a control, a similar reaction was performed, except that OsIAMT1 protein was denatured by boiling at 100°C for 10 min before addition to the assay. A MeIAA authentic standard was dissolved in ethanol, and a volume containing 1 μg of MeIAA was injected into the GC-MS in a split (1/30) mode. The GC program was as follows: 2 min at 80°C, ramp to 300°C at 8°C/min, followed by a 5-min hold at 300°C. The compound was identified by comparison of GC retention times and mass spectra with those of the authentic standard.
Homology-Based Structure Modeling
Based on the structure of AtIAMT1, homology models of OsIAMT1 and PtIAMT1 were calculated. First, a sequence alignment with AtIAMT1 was performed with BLAST (http://www.ncbi.nih.gov/BLAST) using the Blosum62 matrix. Then the homology model was calculated with the program modeler (Sali and Blundell, 1993) by generating a first model (three-dimensional alignment on template) and running 200 cycles of molecular dynamics-based simulated annealing. The OsIAMT1-IAA complex and PtIAMT1-IAA complex were then built by hand, based on the position of IAA in AtIAMT1, as calculated by in silico docking.
Sequence data from this article can be found in the GenBank/EMBL data libraries under accession number EU375746.
Supplemental Data
The following materials are available in the online version of this article.
Supplemental Figure S1. Sequence of full-length cDNA of OsSABATH33 and its premature translation termination.
Supplemental Table S1. Rice SABATH genes.
Supplemental Table S2. Primers for RT-PCR gene expression analysis.
Supplementary Material
This work was supported in part by the University of Tennessee (research start-up fund to F.C.), by the Commissariat à l'Energie Atomique, Centre National de la Recherche Scientifique, and Joseph Fourier University (grant to J.-L.F.), and by the National Science Foundation (grant nos. 0312449 to J.P.N. and 0331353 to E.P.).
The author responsible for distribution of materials integral to the findings presented in this article in accordance with the policy described in the Instructions for Authors (www.plantphysiol.org) is: Feng Chen (fengc@utk.edu).
The online version of this article contains Web-only data.
Open Access articles can be viewed online without a subscription.
References
- Altschul SF, Stephen F, Gish W, Miller W, Myers EW, Lipman DJ (1990) Basic local alignment search tool. J Mol Biol 215 403–410 [DOI] [PubMed] [Google Scholar]
- Ashihara H, Monteiro AM, Gillies FM, Crozier A (1996) Biosynthesis of caffeine in leaves of coffee. Plant Physiol 111 747–753 [DOI] [PMC free article] [PubMed] [Google Scholar]
- Brunger AT, Adams PD, Clore GM, Delano WL, Gros P, Grosse-Kunstleve RW, Jiang JS, Kuszewski J, Nilges M, Pannu NS, et al (1998) Crystallography and NMR system (CNS): a new software system for macromolecular structure determination. Acta Crystallogr D Biol Crystallogr 54 905–921 [DOI] [PubMed] [Google Scholar]
- Chen F, D'Auria JC, Tholl D, Ross JR, Gershenzon J, Noel JP, Pichersky E (2003) An Arabidopsis gene for methylsalicylate biosynthesis, identified by a biochemical genomics approach, has a role in defense. Plant J 36 577–588 [DOI] [PubMed] [Google Scholar]
- Chhun T, Taketa S, Tsurumi S, Ichii M (2003) The effects of auxin on lateral root initiation and root gravitropism in a lateral rootless mutant Lrt1 of rice (Oryza sativa L.). Plant Growth Regul 39 161–170 [Google Scholar]
- D'Auria JC, Chen F, Pichersky E (2003) The SABATH family of MTs in Arabidopsis thaliana and other plant species. In JT Romeo, ed, Recent Advances in Phytochemistry, Vol 37. Elsevier Science Ltd., Oxford, pp 253–283
- Emsley P, Cowtan K (2004) Model-building tools for molecular graphics. Acta Crystallogr D Biol Crystallogr 60 2126–2132 [DOI] [PubMed] [Google Scholar]
- Gouet P, Courcelle E, Stuart DI, Metoz F (1999) ESPript: analysis of multiple sequence alignments in PostScript. Bioinformatics 15 305–308 [DOI] [PubMed] [Google Scholar]
- International Rice Genome Sequencing Project (2005) The map-based sequence of the rice genome. Nature 436 793–800 [DOI] [PubMed] [Google Scholar]
- Jez JM, Ferrer J-L, Bowman ME, Dixon RA, Noel JP (2000) Dissection of malonyl-CoA decarboxylation from polyketide formation in the reaction mechanism of a plant polyketide synthase. Biochemistry 39 890–902 [DOI] [PubMed] [Google Scholar]
- Kabsch W (1993) Automatic processing of rotation diffraction data from crystals of initially unknown symmetry and cell constants. J Appl Crystallogr 26 795–800 [Google Scholar]
- Kato M, Mizuno K, Crozier A, Fujimura T, Ashihara H (2000) Caffeine synthase gene from tea leaves. Nature 406 956–957 [DOI] [PubMed] [Google Scholar]
- Koo YJ, Kim MA, Kim EH, Song JT, Jung C, Moon JK, Kim JH, Seo HS, Song SI, Kim JK, et al (2007) Overexpression of salicylic acid carboxyl methyltransferase reduces salicylic acid-mediated pathogen resistance in Arabidopsis thaliana. Plant Mol Biol 64 1–15 [DOI] [PubMed] [Google Scholar]
- Leyser O (2002) Molecular genetics of auxin signaling. Annu Rev Plant Biol 53 377–398 [DOI] [PubMed] [Google Scholar]
- McCarthy AA, McCarthy JG (2007) The structure of two N-methyltransferases from the caffeine biosynthetic pathway. Plant Physiol 144 879–889 [DOI] [PMC free article] [PubMed] [Google Scholar]
- Mizuno K, Okuda A, Kato M, Yoneyama N, Tanaka H, Ashihara H, Fujimura T (2003) Isolation of a new dual-functional caffeine synthase gene encoding an enzyme for the conversion of 7-methylxanthine to caffeine from coffee (Coffee arabica L.). FEBS Lett 534 75–81 [DOI] [PubMed] [Google Scholar]
- Moyle R, Schrader J, Stenberg A, Olsson O, Saxena S, Sandberg G, Bhalerao RP (2002) Environmental and auxin regulation of wood formation involves members of the Aux/IAA gene family in hybrid aspen. Plant J 31 675–685 [DOI] [PubMed] [Google Scholar]
- Murfitt LM, Kolosova N, Mann CJ, Dudareva N (2000) Purification and characterization of S-adenosyl-L-methionine: benzoic acid carboxyl methyltransferase, the enzyme responsible for biosynthesis of the volatile ester methyl benzoate in flowers of Antirrhinum majus. Arch Biochem Biophys 382 145–151 [DOI] [PubMed] [Google Scholar]
- Murshudov GN, Vagin AA, Dodson EJ (1997) Refinement of macromolecular structures by the maximum-likelihood method. Acta Crystallogr D Biol Crystallogr 53 240–255 [DOI] [PubMed] [Google Scholar]
- Negre F, Kolosova N, Mann CJ, Dudareva N (2002) Novel-S-adenosyl-L-methionine:salicylic methyltransferase, an enzyme responsible for biosynthesis of methyl salicylate and methyl benzoate, is not involved in floral scent production in snapdragon flowers. Arch Biochem Biophys 406 261–270 [DOI] [PubMed] [Google Scholar]
- Ogawa M, Herai Y, Koizumi N, Kusano T, Sano H (2001) 7-Methylxanthine methyltransferase of coffee plants—gene isolation and enzymatic properties. J Biol Chem 176 8213–8218 [DOI] [PubMed] [Google Scholar]
- Pichersky E, Noel JP, Dudareva N (2006) Biosynthesis of plant volatiles: nature's diversity and ingenuity. Science 311 808–811 [DOI] [PMC free article] [PubMed] [Google Scholar]
- Pott MB, Hippauf F, Saschenbrecker S, Chen F, Kiefer I, Slusarenko A, Ross J, Noel JP, Pichersky E, Effmert U, et al (2004) Biochemical and structural characterization of benzenoid carboxyl methyltransferases involved in floral scent production in Stephanotis floribunda and Nicotiana suaveolens. Plant Physiol 135 1946–1955 [DOI] [PMC free article] [PubMed] [Google Scholar]
- Qin G, Gu H, Zhao Y, Ma Z, Shi G, Yang Y, Pichersky E, Chen F, Liu M, Chen Z, et al (2005) An indole-3-acetic acid carboxyl methyltransferase regulates Arabidopsis leaf development. Plant Cell 17 2693–2704 [DOI] [PMC free article] [PubMed] [Google Scholar]
- Ross JR, Nam KH, D'Auria JC, Pichersky E (1999) S-adenosyl-L-methionine:salicylic acid carboxyl methyltransferase, an enzyme involved in floral scent production and plant defense, represents a new class of plant methyltransferases. Arch Biochem Biophys 367 9–16 [DOI] [PubMed] [Google Scholar]
- Rouze P, Pavy N, Rombauts S (1999) Genome annotation: Which tools do we have for it? Curr Opin Plant Biol 2 90–95 [DOI] [PubMed] [Google Scholar]
- Sali A, Blundell TL (1993) Comparative protein modelling by satisfaction of spatial restraints. J Mol Biol 234 779–815 [DOI] [PubMed] [Google Scholar]
- Seo HS, Song JT, Cheong JJ, Lee YH, Lee YW, Hwang I, Lee JS, Choi YD (2001) Jasmonic acid carboxyl methyltransferase: a key enzyme for jasmonate-regulated plant responses. Proc Natl Acad Sci USA 98 4788–4793 [DOI] [PMC free article] [PubMed] [Google Scholar]
- Teale WD, Paponov IA, Palme K (2006) Auxin in action: signaling, transport and the control of plant growth and development. Nat Rev Mol Cell Biol 7 847–859 [DOI] [PubMed] [Google Scholar]
- Thompson JD, Gibson TJ, Plewniak F, Jeanmougin F, Higgins DG (1997) The CLUSTAL_X windows interface: flexible strategies for multiple sequence alignment aided by quality analysis tools. Nucleic Acids Res 24 4876–4882 [DOI] [PMC free article] [PubMed] [Google Scholar]
- Vagin A, Teplyakov A (1997) MOLREP: an automated program for molecular replacement. J Appl Crystallogr 30 1022–1025 [Google Scholar]
- Varbanova M, Yamaguchi S, Yang Y, McKelvey K, Hanada A, Borochov R, Yu F, Jikumaru Y, Ross J, Cortes D, et al (2007) Methylation of gibberellins by Arabidopsis GAMT1 and GAMT2. Plant Cell 19 32–45 [DOI] [PMC free article] [PubMed] [Google Scholar]
- Wang S, Taketa S, Ichii M, Xu L, Xia K, Zhou X (2003) Lateral root formation in rice (Oryza sativa): differential effects of indole-3-acetic acid and indole-3-butyric acid. Plant Growth Regul 41 41–47 [Google Scholar]
- Yang J, Peng S, Visperas RM, Sanico AL, Zhu Q, Gu S (2000) Grain filling pattern and cytokinin content in the grains and roots of rice plants. Plant Growth Regul 30 261–270 [Google Scholar]
- Yang Y, Yuan JS, Ross J, Noel JP, Pichersky E, Chen F (2006) An Arabidopsis thaliana methyltransferase capable of methylating farnesoic acid. Arch Biochem Biophys 448 123–132 [DOI] [PMC free article] [PubMed] [Google Scholar]
- Yoneyama N, Morimoto H, Ye C-X, Ashihara H, Mizuno K, Kato M (2006) Substrate specificity of N-methyltransferase involved in purine alkaloids synthesis is dependent upon one amino acid residue of the enzyme. Mol Genet Genomics 275 125–135 [DOI] [PubMed] [Google Scholar]
- Zhao N, Guan J, Lin H, Chen F (2007) Molecular cloning and biochemical characterization of indole-3-acetic acid methyltransferase from poplar. Phytochemistry 68 1537–1544 [DOI] [PubMed] [Google Scholar]
- Zubieta C, He XZ, Dixon RA, Noel JP (2001) Structures of two natural product methyltransferases reveal the basis for substrate specificity in plant O-methyltransferases. Nat Struct Biol 8 271–279 [DOI] [PubMed] [Google Scholar]
- Zubieta C, Koscheski P, Ross JR, Yang Y, Pichersky E, Noel JP (2003) Structural basis for substrate recognition in the salicylic acid carboxyl methyltransferase family. Plant Cell 15 1704–1716 [DOI] [PMC free article] [PubMed] [Google Scholar]
- Zubieta C, Kota P, Ferrer J-L, Dixon RA, Noel JP (2002) Structural basis for the modulation of lignin monomer methylation by caffeic acid/5-hydroxyferulic acid 3/5-O-methyltransferase. Plant Cell 14 1265–1277 [DOI] [PMC free article] [PubMed] [Google Scholar]
Associated Data
This section collects any data citations, data availability statements, or supplementary materials included in this article.


