

Abstract
We examined the in vitro inhibition of human monocyte-derived dendritic cells (DC) maturation via NF-κB blockade on T cell allo-stimulation, cytokine production, and regulatory T cell generation. DC were generated from CD14+ monocytes isolated from peripheral blood using GM-CSF and IL-4 for differentiation and TNF-α, IL-1β, and PGE2 as maturational stimuli with or without the NF-κB inhibitors, BAY11-7082 (BAY-DC) or Aspirin (ASA-DC). Stimulator and responder cells were one vs two HLA-DR mismatched in direct vs indirect presentation assays. Both BAY-DC and ASA-DC expressed high levels of HLA-DR and CD86 but always expressed less CD40 compared to controls. Some experiments showed slightly lower levels of CD80. Both BAY- and ASA- allogeneic DC and autologous alloantigen pulsed DC were weaker stimulators of T cells (by MLR) compared to controls, and there was reduced IL-2 and IFN-γ production by T cells stimulated with BAY-DC or ASA-DC (by ELISPOT) (more marked results were always observed with ASA-treated DC). In addition NF-κB blockade of DC maturation caused the generation of T cells with regulatory function (T regs) but only when T cells were stimulated by either allogeneic (direct presentation) or alloantigen pulsed autologous DC (indirect presentation) with one HLA-DR mismatch and not with two HLA-DR mismatched (either direct or indirect presentation). However, the T regs generated from these ASA-DC showed similar FoxP3 mRNA expression as those from non-treated DC. Extension of this study to human organ transplantation suggests potential therapies using one DR matched NF-κB blocked DC to help generate clinical tolerance.
Keywords: Allorecognition, Dendritic cells, NF-κB inhibitors, T reg, FoxP3
INTRODUCTION
Infusion of donor bone marrow cells may have a regulatory effect in human solid organ transplants (1–4). In vitro experiments have demonstrated that bone marrow cells anergize T cells in peripheral blood (5, 6), bias T cell responses towards a Th2 type (7), and inhibit the generation of antigen-specific cytotoxic T cell responses (8). It has been hypothesized that immature dendritic cells (DC) present in the infused allogeneic bone marrow graft may play a role in establishment of peripheral allograft tolerance by induction of regulatory T cells (9–12). Additionally, mesenchymal stem cells in the bone marrow graft have been proposed to alter the development of dendritic antigen presenting cells, (DC) in particular, resulting in a “semi-mature” phenotype that induces T cell unresponsiveness (13).
Recent studies have suggested that immature DC (iDC) can generate inhibition of alloreactivity via reduced expression of costimulatory molecules, including CD80, CD86, and CD40 (14). The presentation of antigens by immature DC in the absence of a second signal appears not only to cause T cell anergy but to lead to active inhibition of immune responses by induction of regulatory cells (14). Jonuit et al demonstrated that repetitive stimulation of T cells with allogeneic iDC resulted in development of induced IL-10 secreting CD4+ T cells with regulatory properties (15). Dhodapkar et al demonstrated that injection of human antigen-bearing iDC leads to antigen-specific inhibition of preexisting effector T cell function in two volunteers (16). Infusion of iDC derived from murine bone marrow cells has also been shown to prolong allograft survival in several preclinical models (17, 18).
A crucial pathway for the maturation of DC by either in vivo or in vitro inflammatory stimuli involves the transcription factor NF-κB. The different members of this family can form a variety of homo and heterodimers and may be associated with inhibitory proteins causing retention in the cytoplasm. RelB is a member of the NF-kB transcription factor family and is the most crucial NF-kB subunit for expression of CD40, CD86 and MHC class II on DC during maturation (19). Upon DC activation, RelB is translocated to the nucleus where it upregulates transcription of NF-κB needed for DC maturation and the second signal for T cell activation. Additionally, RelB transcriptionally upregulates its own expression, leading to increased total RelB protein (20, 21). Infusion of murine DC whose maturation process and CD40 expression was inhibited via blocking of NF-κB using NF-κB-decoy oligodeoxynucleotides has also been shown to prolong allograft survival (22, 23). In similar experiments, CD40-deficient DC from murine bone marrow precursors cultured in the presence of an inhibitor of NF-κB, BAY 11-7082, were able to suppress previously primed immune responses and favored the development of antigen-specific regulatory T cells that could confer tolerance to the same antigen in an adoptive transfer model (19). Another pharmacological inhibitor of NF-κB, acetylsalicylic acid (aspirin, ASA), inhibits DC maturation in vitro (24). ASA-treated murine DC were poor stimulators of naive allogeneic T cell proliferation and they inhibited IL-2 production in responding T cells. These findings may have important implications for the manipulation of DC function for potential therapeutic application (25, 26).
In the present report we studied the in vitro response of human T cells stimulated by either allogeneic DC or allo-antigen pulsed autologous DC treated by NF-κB blockade with BAY11-7082 or ASA. We tested the effect on CD40 expression, allo-proliferation and the modulation of Th1 cytokine production in responding T cells, as well as to whether T regulatory cells could be developed in vitro.
Material and Methods
Human subjects, cell preparation and histocompatibility typing
Human peripheral blood was collected from normal healthy adult volunteer donors after obtaining informed consent according to the guidelines of the Institutional Review Board of the University of Miami. Peripheral blood mononuclear cells (PBMC) were purified by Ficoll-Hypaque (Sigma, St. Louis, MO) and washed with PBS from which monocytes and T cells were isolated using CD14 and CD3 Isolation Kits respectively (Miltenyi Biotec, Auburn, CA) following the manufacturer’s protocol. Briefly, after incubation with CD14 or CD3 microbeads (20 µl per 1 × 10⁷ cells) for 15 minutes at 4°C the cells were washed and separated by positive selection through columns placed in the magnetic field of a MACS separator (Miltenyi Biotec, Auburn, CA). Purity was 92 % or greater by flow cytometry. In all experiments cell culture was with RPMI -1640 (Gibco-BRL, Grand Island, NY) containing 15% heat-inactivated normal human AB serum (NABI, Gemini Bio-Products, Woodland, CA), 2mM L-glutamine, 10 mM HEPES, and 1x antibiotic-antimycotic solution (all from Gibco-BRL, Grand Island, NY). Serological and DNA histocompatibility typing was performed on these unrelated laboratory volunteers by the University of Miami Histocompatibility testing laboratory.
Generation of dendritic cells
CD14+ monocytes were cultured in 6-well plates using 2×10⁶ cells in 3 ml of media also supplemented with 5 ng/ml human recombinant GM-CSF and 10 ng/ml IL-4 (both from Sigma, St. Louis, MO) for 10 days at 37C, 5% CO2 and 97% humidity. To induce maturation (designated mature DC) an additional 10 ng/ml TNF-α, 1 µg/ml PGE2 (both from Sigma, St. Louis, MO) and 10 µg/ml IL-1β (BD Pharmingen, San Diego, CA) was added for the final 48 h. Except in Figure 2, where both immature and mature DC were analyzed, all experiments assayed matured DC and are simply designated as “DC”. Treated DC were incubated continuously from day 1 to 10 with either BAY 11-7082 (BAY, 1.25µM, 2.5µM or 5µM; Calbiochem, La Jolla, CA) or with acetylsalicylic acid (ASA, 0.5 mM, 2mM, 3mM or 5mM; Sigma, St. Louis, MO), henceforth referred to as BAY-DC and ASA-DC, respectively. In some experiments, on days 3 and 5 of culture, DC were pulsed with 2×10⁶ allogeneic PBMC, made apoptotic by irradiation (8000 rads), differing by either one or two DR mismatches in a ratio of 1:1 PBMC:DC. In all experiments, one third of the media was removed and replaced with the same amount of fresh media with the corresponding differentiation or maturation growth factors and with or without BAY or ASA every second day during the entire culture period. The DCs were harvested for analysis on day 10 and cell viability was assessed by trypan blue.
Figure 2. Optimization of kinetics for T cell allogeneic proliferation at days 3, 5 and 7 indicate BAY- or ASA-treated DC are poor stimulators.
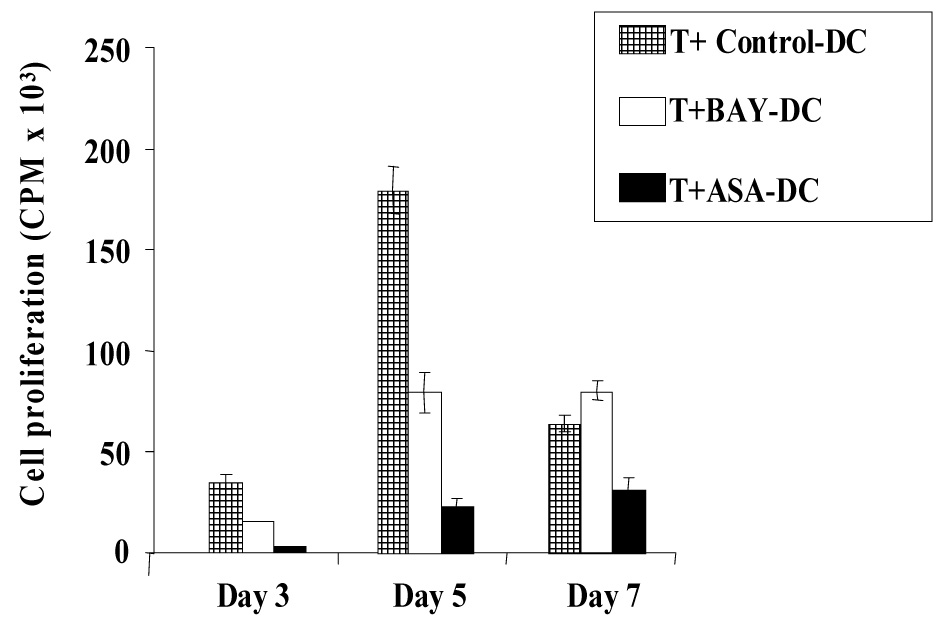
Purified T cells were added to irradiated allogeneic DC in a ratio of 10:1. Cells were plated in triplicate and T cell proliferation was measured by [³H] thymidine incorporation. Proliferation of T cells stimulated by control DC peaked at day 5. Proliferation in response to BAY-DC and ASA-DC was reduced by 2.2 fold (p=0.007) and 7.7-fold (p=0.002) respectively on day 5. Proliferation of T cells alone was always below 300 CPM (representative of three independent experiments).
Western blot
Western blots for RelB and Actin were performed as previously described (27). Briefly, total cell lysates were made from untreated CD14+ cells at day 0 and from Control-DC, BAY-DC and ASA-DC after the differentiation and maturation process (see above). Protein levels were quantitated by using the Micro BCA reagent kit (Pierce, Rockford, IL). Equal amounts of protein (10 µg) were separated by SDS-PAGE (4% stacking/8% resolving), electroblotted to PVFD (Millipore Corp., Bedford, MA) membranes, and probed with antibodies against RelB (C-19; Santa Cruz Biotechnology, Santa Cruz, CA) and Actin (Sigma, St. Louis, MO). Chemiluminescent detection (ECL; Amersham Pharmacia Biotech, Little Chalfont, UK) was quantified by using ScionImage program. RelB values of each sample were normalized to the loading control (Actin). For each sample the ratio RelB/Actin was calculated. Results are expressed as fold increase in optical density (O.D.) compared to CD14+ cells at day 0.
Antibody staining and flow cytometry
To follow monocyte purification, DC treatment groups were stained with an anti-CD14-FITC (BD Pharmingen, San Diego, CA), which is not blocked by anti-CD14-microbeads. On day 10, Control-DC, BAY-DC and ASA-DC were washed and stained with DC markers, CD11c-APC, CD40-PE, CD80-FITC, CD83-APC, CD86-PE, DC-SIGN-PE, HLA-DR-PerCP, and general lineage markers Lin1-FITC (all from BD, San Diego, CA). To follow T cell purification, cells were stained with CD2-PE (BD, San Diego, CA). Briefly, the cell subgroups were rinsed with PBS, repelleted, resuspended in FACS buffer and stained for 30 min at 4°C with each antibody on ice followed by analysis using fluorescence-activated flow cytometry (FACS LSR; Becton Dickinson) and Cellquest® software. Dead cells or cellular debris were excluded by gating.
T cell proliferation assay
Allogeneic responder T cells were cultured in triplicate with irradiated (3000 rad), washed DC. The DC were either from one or two HLA-DR mismatched (these were also disparate in the HLA A and B loci) stimulator (or control autologous) BAY-DC, ASA-DC or Control-DC in 96-well flat bottom plates using 1×10⁵ T cells and 1×10⁴ DC in a total volume of 200 µl/well of complete culture medium at 37°C in 5% CO2 for 3, 5 and 7 days. Wells were pulsed with 1 µCi/well of [³H] thymidine for the last 18 hrs before the assay point, harvested, and radioactive incorporation measured in a WALLAC 1205 Betaplate Liquid Scintillation Counter.
Evaluation of anergy
In direct presentation experiments, 105 T cells primed with Control-DC, BAY-DC, or ASA-DC (one vs two HLA-DR mismatched) were restimulated with allogeneic mature 104 DC from the same DC donor. In indirect presentation experiments, 105 T cells primed with Control-DC or ASA-DC pulsed with apoptotic allogeneic PBMC (one vs two HLA-DR mismatched) were restimulated with mature 104 DC pulsed from the same donor as the original DC pulsed as described above. Cell proliferation was performed in a total volume of 200 µl/well or with PMA (10 ng/ml) and ionomycin (200 ng/ml) for 3 days. Wells were pulsed with 1 µCi/well of [³H] thymidine for the last 18 hrs before the assay point, harvested and radioactive incorporation was measured in a WALLAC 1205 Betaplate Liquid Scintillation Counter.
Analysis of regulatory activity of T cells generated in the presence of treated DCs
To analyze whether T cells cultured with DC treated as above, would develop into a population of cells that were capable of inhibiting/regulating fresh T cell proliferation, CD3+ cells were stimulated with allogeneic mature one or two HLA-DR mismatched Control-DC, BAY-DC, or ASA-DC for 5 days. The primed T cells were then harvested, isolated using CD3 microbeads and rested at a concentration of 1×10⁶ cell/ml in the culture medium. After 2 days, primed T cells were cocultured with fresh isolated autologous T cells and fresh allogeneic mature irradiated (Control) DC, from the same donors as used for the initial priming step, were added to analyze the influence of the primed (“T reg” cells) on fresh T cell proliferation. Proliferation was measured on day 3. In separate experiments, to mimic the indirect pathway of alloantigen presentation in vitro, we generated Control-DC and ASA-DC pulsed with apoptotic (described above) allogeneic one vs two DR mismatched PBMC. The pulsed-DC were used to prime autologous CD3+ T cells (indirect presentation). After 5 days, primed T cells were collected and rested at a concentration of 1×10⁶ cells/ml. After 2 days, a coculture with 1×10⁵ of these primed T cells plus 1×10⁵ freshly isolated CD3+ cells and 1×10⁴ fresh Control-DC was performed. Cultures were performed in 96 well plates and proliferation was measured by [³H] thymidine incorporation at day 3.
Transwell experiments
In the bottom well of 24 well plates, 3 × 10⁵ T cells were cultured with 3 × 10⁴ irradiated mature DC in 600 µl, in a ratio of 10:1 responders:stimulators. Three × 104 irradiated Control-DC or BAY-DC were either added directly to the MLR bottom wells or were placed in upper transwell chambers. Cultures were pulsed with [³H] thymidine 18 hrs before harvesting. On days 3 and 5 of culture, cells from the bottom chambers were transferred to 96-well plates in triplicate, and the incorporated radioactivity was measured as above by using a WALLAC 1205 Betaplate Liquid Scintillation Counter.
Cytokine analysis by ELISPOT
IL-2, IL-4, Il-10, and IFN-γ producing cells were quantified by standard ELISPOT assay as recommended by the manufacturer (BD Biosciences, San Diego, CA). Briefly, T cells previously cultured for 5 days with Control-DC, BAY-DC, ASA-DC or autologous PBMC, were purified using CD3 microbeads and incubated in 96-well plates previously coated with purified anti-human IL-2, IL-4, IL-10, or IFN-γ mAb at concentrations ranging from 1×10⁴ to 2 × 10⁵ cells/well in 200 µl of medium for 36–48 hrs. Biotinylated anti-human IL-2, IL-4, IL-10, or IFN-γ mAb was used as the detecting antibody, streptavidin-horseradish peroxidase conjugate was used as the enzyme, and AEC (3-Amino-9-ethylcarbazole) chromogen, which is a substrate for peroxidase and is a widely-used chromogen for ELISPOT, was used for color development.
Quantitative RT-PCR for FoxP3 expression
After pooling the cultures, CD3+ cells were isolated from cells primed with control-DC, BAY-DC or ASA-DC using microbeads. Total RNA from 1×10⁶ CD3+ cells was extracted using Trizol reagent (Gibco BRL Life Technologies Inc) according to the manufacturer’s protocol. Quantitative PCR was performed in duplicate with the human FOXP-3 kit (LC kit search, Heidelberg, Germany) using the light cycler (Roche, Indianapolis ID) and the DNA master syber green kit (Roche, Indianapolis ID). FoxP3 levels were expressed as copies per 5000 total CD3+ cells. All levels were normalized with the housekeeping gene glyceraldehyde-3-phosphate dehydrogenase (GAPDH). The normalized FoxP3 results were calculated by the following equation (28):
Statistics
All error bars shown in Figure 1–Figure 6 represent one standard deviation above and below the mean. Statistical evaluation of these data was performed using ordinary t-tests. P-values of 0.05 or less were considered statistically significant. Due to the fact that the distribution of proliferation was skewed towards larger values and followed much more closely a log normal rather than normal distribution, the statistical analysis was performed using log transformed data for experiments to evaluate anergy, regulatory activity of T cells generated in the presence of treated DC, and regulatory activity as measured by FoxP3 expression (the results in Figure 7 and Figure 8). With log transformed data, comparisons performed on the original scale are based on percent rather than absolute differences, and the geometric mean rather than arithmetic mean is used. It should also be noted that the geometric mean is multiplied and divided (rather than added and subtracted) by its standard error (SE) when showing variability about the mean and in calculating confidence intervals. P-values were based on analysis of variance t-tests of the treatment effects while controlling for experiment to experiment differences via analysis of variance. The geometric mean along with its SE was calculated for each treatment across experiments and replications. Finally, since for most of the treatment conditions the percentage of total variability due to experiment to experiment within the same group (rather than replicate to replicate within experiment) differences was greater than 90%, the power to detect relatively small differences between 2 treatments applied within the same experiment was high, even with relatively few (i.e., 5) experiments performed.
Figure 1. Culture of DC with increasing concentrations of BAY11-7082 and ASA decreases their ability to stimulate T cell proliferation.
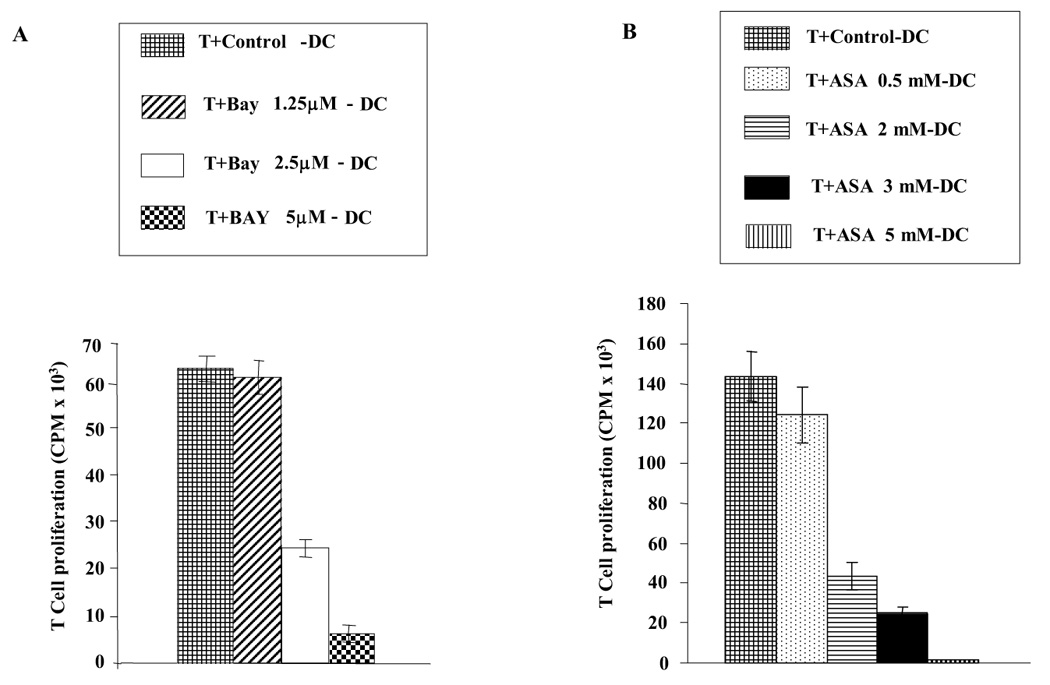
Purified T cells were added to irradiated allogeneic DC in a ratio of 10:1. Responder and stimulator cells were mismatched by two HLA-DR. Cells were plated in triplicate and T cell proliferation was measured via [³H] thymidine incorporation at day 5. A: T cell proliferation induced by allogeneic DC that were cultured with increasing concentrations of BAY11-7082 (1.25 µM to 5.0 µM) B: T cell proliferation induced by allogeneic DC cultured with increasing concentrations of ASA (0.5 mM, 2 mM, 3 mM or 5mM). Results in A and B are each representative of four independent experiments.
Figure 6. Frequency of IL-2, IL-4, IL-10, and IFN-γ producing T cells determined by ELISPOT assay.
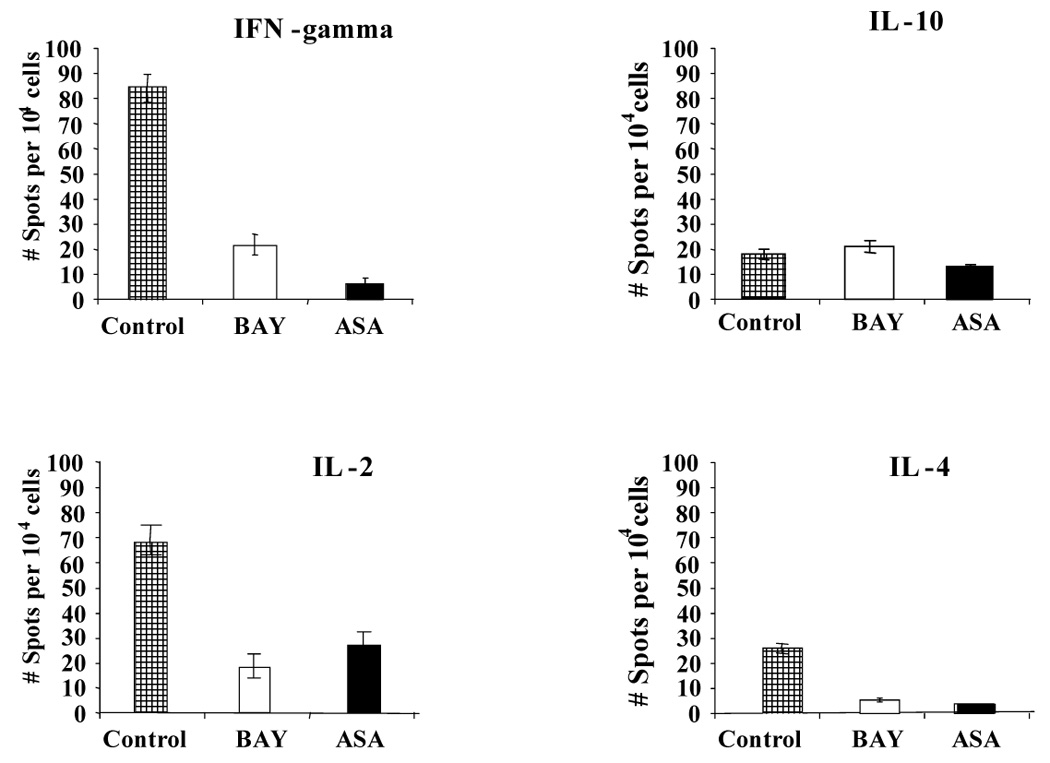
Two HLA-DR mismatched T cells were harvested after 5 days of coculture with allogeneic Control-DC, BAY-DC, ASA-DC and plated into ELISPOT plates. The frequency of cytokine producing cells was measured after 36 hrs. T cells cocultured with treated-DC were found to produce reduced levels of IFN-γ (p value for BAY and ASA were 0.02 and 0,006 respectively), and IL-2 (p value for BAY and ASA were 0.02 and 0.03 respectively), compared to T cells cocultured with control DC. IL-4 production was somewhat decreased in T cells previously cultured with BAY-DC or ASA-DC (p values less than 0.05), suggesting no Th2 shift in cytokine production. No statistically significant differences in IL-10 production were detected. For each cytokine, one graph representative of at least three separate experiments is shown. Results are expressed as mean number of spots per 104 cells +/− standard deviation.
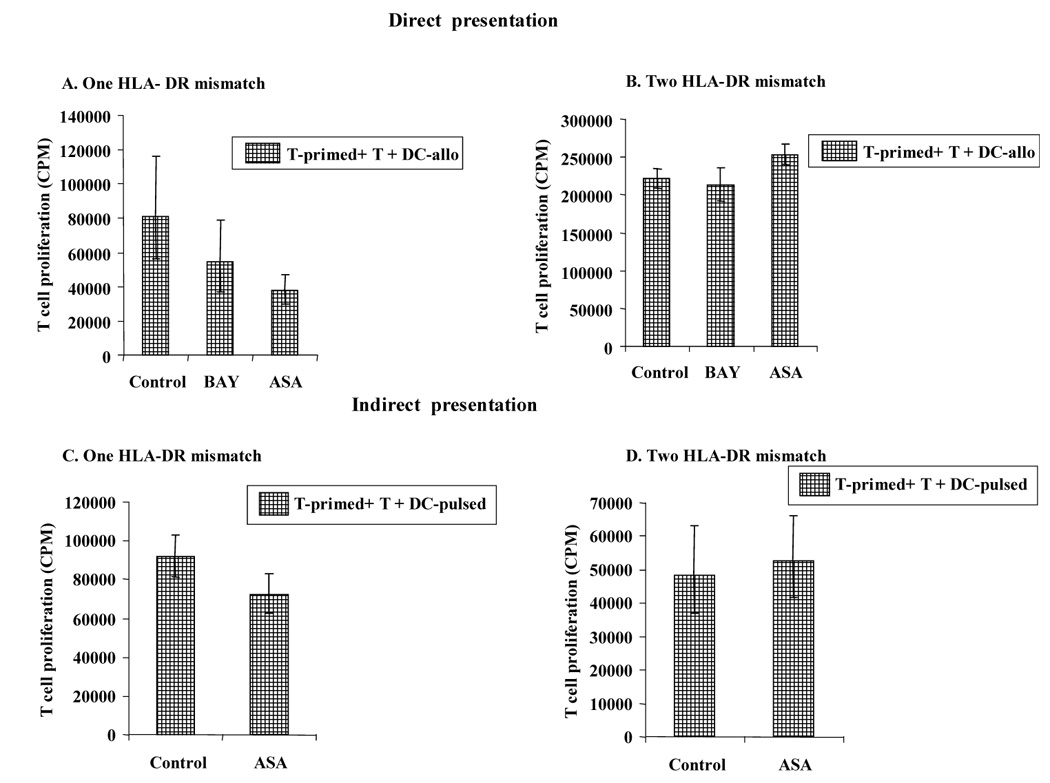
Figure 7. Comparison of direct and indirect alloantigen presentation with one versus two HLA-DR mismatches in generating anergy.
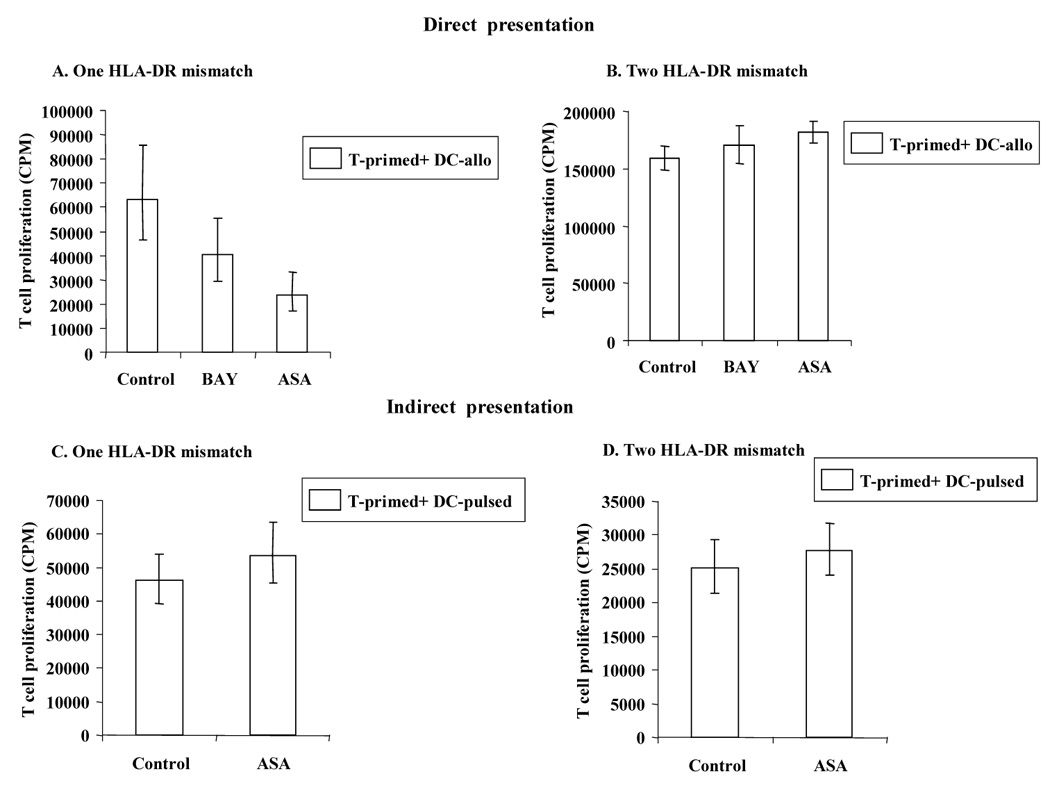
In the direct allopresentation experiment (A, B), after 5 days of coculture with Control- DC, BAY-DC or ASA-DC (condition shown on x-axis), T cells were harvested and restimulated with fresh irradiated DC (DC allo) from the same donor, in a ratio of 10:1 T:DC. Cells were plated in triplicate and T cell proliferation was measured by [³H] thymidine incorporation on day 3 (optimal time point, data not shown). A. Using ASA-DC with one HLA-DR mismatch T cell unresponsiveness/anergy was induced (p values: BAY-DC = 0.01 and ASA-DC < 0.0001). B. BAY-DC or ASA-DC with two HLA-DR mismatches do not induce T cell anergy (p value: BAY-DC = 0.96). However, in some experiments, T cells primed with ASA-DC yielded greater proliferation than Control-DC (p = 0.01). In the indirect allopresentation experiment (C, D), T cells were stimulated with Control- DC, or ASA-DC (condition shown on x-axis) that were pulsed either with one HLA-DR mismatch or two HLA-DR mismatches. After 5 days, the primed T cells were cocultured with fresh autologous control DC pulsed with alloantigen (DC-pulsed) as described above, in a ratio of 10:1 T:DC. Cells were plated in triplicate and T cell proliferation was measured by [³H] thymidine incorporation on day 3. C–D: ASA-DC either with one or two HLA-DR mismatches do not induce T cell anergy (p values = 0.3 and 0.4 respectively). In some experiments, same as described in B, T cells primed with ASA-DC yielded greater proliferation than Control-DC. The open columms represent the geometric means, across experiments and replications within experiment (A: n =6, B: n= 5, C: n= 7 and D: n= 7). N represents the number of experiments, and the total sample size was equal to n times the number of replicates performed within each experiment. Standard error bars of each group of sample are shown above and below the vertical bars.
Figure 8. Direct and indirect presentation of alloantigens with one HLA-DR mismatch generated T cells with inhibitory activity.
A–B. Direct Presentation: T cells were stimulated by allogeneic Control-DC, BAY-DC or ASA-DC with one HLA-DR mismatch. After 5 days, the primed T cells were purified with CD3 microbeads, rested for 2 days and cocultured with fresh T cells and fresh Control-DC matured with TNFα, PGE2 and IL-1β, as described in material and methods. T cell proliferation was measured at day 3 (the optimal time point, data not shown) by MLR. Significant differences in T cell proliferation were observed between Control-DC and treated-DC with one HLA-DR mismatch (p values: BAY-DC = 0.03 and ASA-DC <0.0001) whereas no significant differences were observed with two HLA-DR mismatch (p values: BAY-DC=0.96 and ASA-DC=0.04). The vertical bars represent the geometric means, across experiments and replications within experiment (A: n = 5 and B: n = 3). C–D. Indirect presentation: T cells were stimulated with autologous control DC or ASA-DC, both of these were pulsed with apoptotic allogeneic PBMC with either one HLA-DR mismatch or two HLA-DR mismatches. After 5 days, the primed T cells were purified, rested for 2 days and cocultured with fresh autologous T cells and fresh autologous control DC pulsed with alloantigen as described above. T cell proliferation was significantly inhibited when T cells were primed with autologous ASA-DC pulsed with allogeneic PBMC with one HLA-DR mismatch (p = 0.03). However no inhibition was observed when T cells were primed with ASA-DC pulsed with allogeneic PBMC with two HLA-DR mismatches (p = 0.49). The open columms represent the geometric means, across experiments and replications within experiment (C: n = 7 and D: n = 7). N represents the number of experiments, and the total sample size was equal to n times the number of replicates performed within each experiment. Standard error bars of each group of sample are shown above and below the vertical bars.
RESULTS
Increasing concentrations of BAY11-7082 and ASA in DC decreases their ability to stimulated T cell proliferation
To optimize the amount of NF-κB inhibitor to be used in each experiment, DC were treated continuously from day 1 to day 10 with increasing doses of BAY 11-7082 (1.25, 2.5 or 5 µM) or ASA (0.5, 2, 3 or 5 mM). The results demonstrated that increased doses gave a progressively decreased capacity to stimulate T cell proliferation with both inhibitors (Fig.1). However, cell viability was also affected by the higher doses of both inhibitors. Cells treated with 1.25 µM and 2.5 µM BAY had 70–80 % viability and with 5µM BAY had very low viability (3–5 %). Although cells treated with 0.5 mM, 2 mM or 3 mM ASA showed no big differences in viability compared to controls (80–95 % viability), cells treated with 5mM ASA showed very low viability (1–3 %). Therefore, in order to optimize cell viability and inhibition of NF-κB, subsequent experiments were carried out using 2.5 µM BAY and 3 mM ASA.
Optimization of kinetics for T cell allogeneic proliferation indicate that BAY- or ASA-treated DC are poor stimulators of allogeneic T cell proliferation
Mature Control-DC were potent stimulators of allogeneic T cell proliferation, as measured by [³H] thymidine incorporation using a ratio of 10:1 T cells: DC (Figure 2). Mature ASA-DC, and in most cases BAY-DC, failed to strongly stimulate T cell proliferation. This effect was most pronounced at day 5, when proliferation peaked in T cells stimulated by Control-DC, whereas BAY-DC and ASA-DC (at optimum treatment concentrations) caused 2.2-fold and 7.7-fold less proliferation respectively compared to Control-DC.
Human monocyte-derived DC generated in the presence of Bay 11-7082 or ASA have reduced levels of RelB protein expression
The transciption factor RelB, a member of the NF-κB family and transcriptionally regulated by other NF-kB members, was used as a read out of NF-kB activation. RelB protein expression was measured in total cell extracts from Control, BAY-DC, and ASA-DC by Western blot (Fig. 3A). The increase in RelB expression relative to CD14+ monocytes on Day 0 was calculated (Fig 3B). Control, unstimulated CD14+ monocytes showed very low expression of RelB (lane 1). Immature Control-DC cultured from monocytes in GM-CSF (which activates NF-κB (25)) and IL-4 for 8 days increased expression of RelB 17.6-fold relative to the Day 0 CD14+ monocytes (lane 2). In immature DC cultured from monocytes in GM-CSF and IL-4 for 8 days in which NF-κB was blocked by either BAY or ASA, RelB expression was increased only 10.5 and 0.4-fold respectively (lanes 3 and 4). Control-DC matured with a cocktail of TNF-α, IL-1β, and PGE2 had the most dramatic increase (30.1-fold) in RelB expression (lane 5) compared to the Day 0 CD14+ monocytes. By contrast, in both BAY-DC and ASA-DC, given the same maturation cocktail, RelB expression increased only 13.1-fold in BAY-DC and 0.3-fold in ASA-DC (lanes 6 and 7), ie., in mature BAY-DC RelB expression was less than half that of mature Control-DC, and in mature ASA-DC almost no RelB expression was detected. Both BAY11-7082 and ASA have been reported to block the TNF-α inducible phosphorylation of inhibitory IkB proteins, resulting in less nuclear translocation of NF-κB (19, 24). However, in contrast to ASA, a dose of BAY high enough to maximally inhibit RelB was not reached due to toxicity.
Figure 3. NF-κB inhibitors, BAY and especially ASA decrease RelB in immature and mature DC.
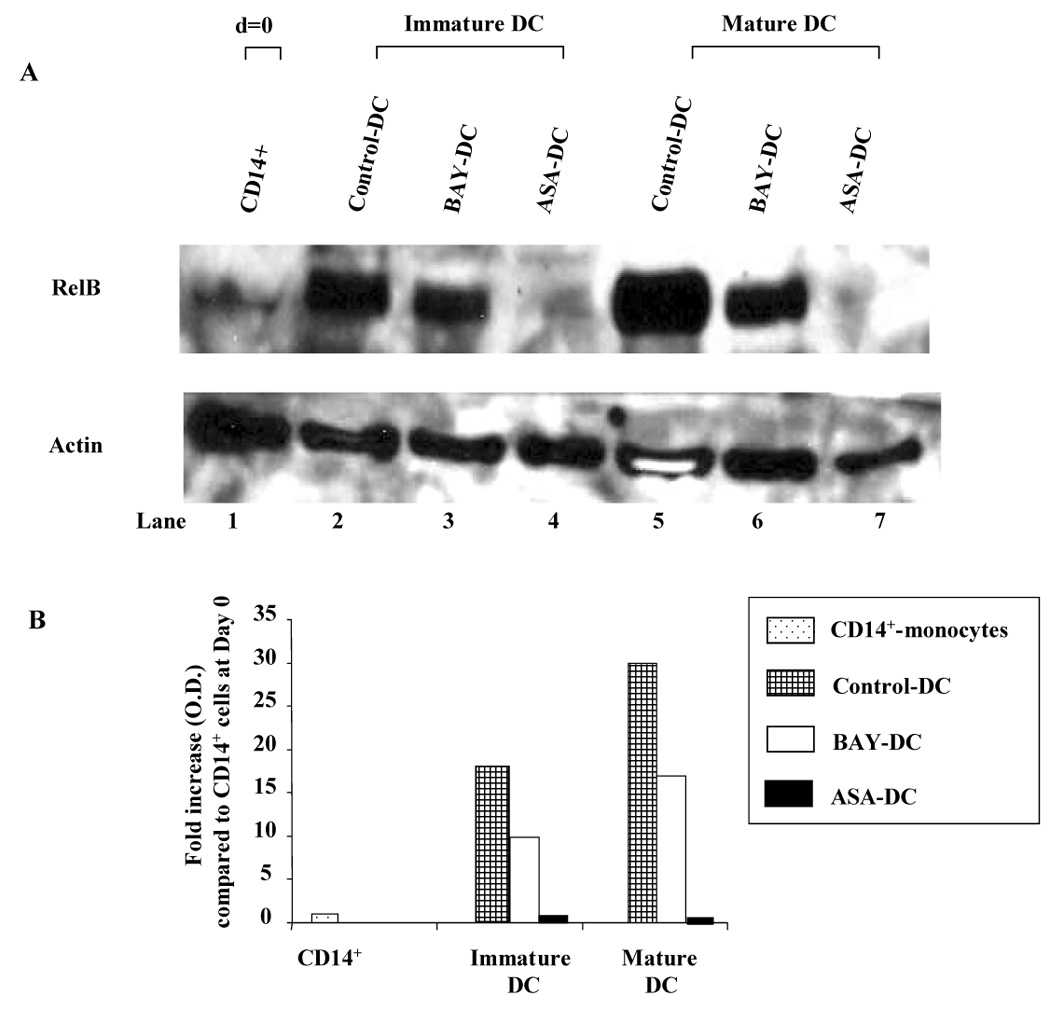
A: RelB expression of DC treated with and without NF-kB inhibitors. CD14+ monocytes were cultured in complete medium with GM-CSF and IL-4 in the presence or absence of NF-kB inhibitors, BAY 11-7082 (2.5 µM) or ASA (3 mM) (immature DC: lanes 2–4). During the last 48 h, the culture was supplemented with a cocktail containing TNF-α, PGE2 and IL-1β to induce DC maturation (mature DC: lanes 5–7). Equal amounts of protein were analyzed by Western blot using Abs specific for RelB or Actin. Lane 1: CD14+ monocytes (day 0), Lane 2: Immature control DC, Lane 3: Immature BAY-DC, Lane 4: Immature ASA-DC, Lane 5: Mature Control DC, Lane 6: Mature BAY-DC, Lane 7: Mature ASA-DC. Unstimulated CD14+ cells at day 0 (lane 1) showed very low levels of RelB as expected. RelB expression was consistently lower in immature and mature BAY- and ASA-DC compared to immature and mature control DC. Results are representative of three independent experiments. B: Scanned analysis of the increase in RelB relative to CD14+ monocytes on Day 0. After 8 days of incubation with GM-CSF and IL-4, RelB had increased 17.6 fold in immature control DC, but only 10.5 fold in immature BAY-DC and 0.4 fold in immature ASA-DC. After 48 hour maturation with TNF-α, PGE2 and IL-1β, RelB expression had increased 30.1 fold in mature control DC, but only 13.1 in mature BAY-DC and 0.3 fold in mature ASA-DC. RelB values of each sample were normalized to the loading control (Actin). Results are expressed as fold increase in optical density (O.D.) compared to CD14+ cells at day 0. Vertical columns represent the values obtained in one representative experiment in which the ratio of RelB/Actin was calculated.
Human monocyte-derived DC “matured” in the presence of BAY 11-7082 or ASA express high levels of HLA-DR and CD86, slightly reduced CD80 and markedly reduced CD40
As a consequence of blocking RelB, DC maturation in response to TNF-α, PGE2 and IL-1β stimulus was impaired. DC cultures were initiated with CD14+ monocytes (more than 92 % purity) that were negative for all DC markers. Upon maturation, control, BAY-DC, and ASA-DC had greatly diminished expression of CD14 (13–20%, data not shown) as expected and expressed high levels of DC markers, DC-SIGN (90–99 %, data not shown) and CD11c (Fig 4). Mature BAY-DC and ASA-DC expressed high levels of HLA-DR and CD86, similar to Control-DC. The expression CD80 was slighly lower in BAY-DC and ASA-DC (Fig. 4). However, mature BAY-DC showed a one third reduction in the number of cells expressing CD40 while ASA-DC showed two thirds reduction, the most profound effect. The amount of CD40 expressed by the remaining positive cells was also greatly reduced, see especially ASA-DC (Fig. 4).
Figure 4. Mature BAY- and ASA-treated DC express less CD40 per cell and have fewer cells expressing CD40 than Control-DC.
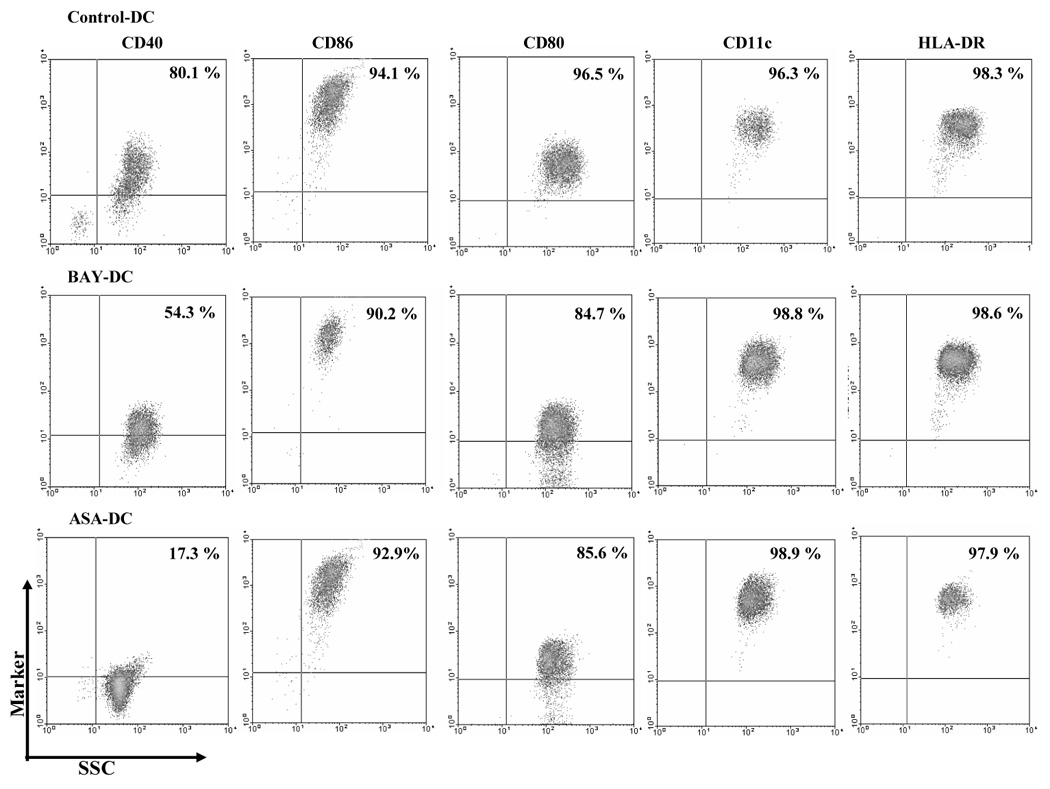
Control, BAY- or ASA-treated DC were stained with directly conjugated antibodies, fixed and analyzed by flow cytometry. Dead cells were excluded from analysis by gating and a second gating was made on DC-SIGN+ cells, expressed in 90–99 % of the population, to assess the other DC markers. Control-DC, ASA-DC, and BAY-DC expressed similarly high levels of HLA-DR and CD11c as well as the costimulatory marker CD86. Here the expression level of the CD80 marker was slightly lower compared to Control-DC. The number of cells expressing CD40 was reduced in BAY- and ASA-treated DC compared with control DC (p = 0.002 and 0.0001 respectively) and the amount of CD40 per cell also reduced, especially in ASA-DC. The percentage of cells stained with each marker is represented in the upper-right quadrant. This study was representative of 3 independent experiments.
Transwell experiments indicate that BAY-treated DC are not toxic to T cells
The BAY-DC were always washed three times after harvesting. However, since NF-κB is also a key transcription factor required for T cell proliferation, we wished to exclude the possibility that residual BAY from treated DC cultures was exerting a blocking or even a direct cytotoxic effect on T cells using transwell experiments (Fig. 5). Our results indicated that T cell proliferation was not inhibited by transfer of BAY from DC (Fig. 5). Thus prior inhibition of NF-κB activity of the DC and resultant deficiency in CD40 expression were consistent with the poor allostimulatory function of BAY-treated DC.
Figure 5. Decrease in T cell proliferation is not due to either blocking or toxic effects of BAY released from previously treated DC.
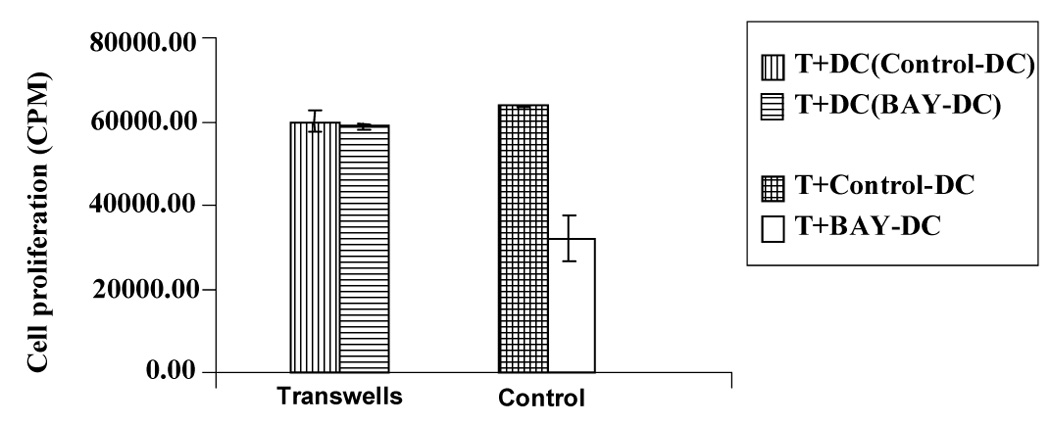
T cells and allogeneic DC were cultured in the bottom of the transwell. In the upper chamber, Control-DC or BAY-DC (at 2.5 µM) were added (as indicated in the box). There was no significant difference in T cell proliferation when comparing the control and BAY-DC (p=0.54) (left bars, transwell). As a control, standard T cell proliferation assays were done in parallel as previously (right bars). Proliferation was lower in the cultures containing BAY-DC (p=0.03). Results are representative of three independent experiments.
T cells primed by two DR mismatched BAY- or ASA-treated DC fail to develop a robust Th1 or Th2 type cytokine response and do not produce high levels of IL-10
Cytokine production by T cells stimulated with BAY-DC or ASA-DC by direct presentation of alloantigen were analyzed as to whether the influence of the maturational state of treated DC appeared to skew the overall T cell response towards Th1 or Th2. To this end, T cells were primed for 5 days with two DR mismatched mature allogeneic Control-DC, BAY-DC, ASA-DC or autologous PBMC, and then re-isolated using CD3 microbeads. ELISPOTs were used to analyze the cytokine production profiles of these primed T cells in the immediate 36–48 hrs after harvest. The number of spots for 104 T cells cultured with autologous PBMC were: IFN-gamma = 20; IL-2 = 3, IL-4 = 3 and IL-10 = 5. As expected, the Control-DC induced a strong differentiation of the naive fresh T cells into Th1 type cells that produced large amounts of IL-2 and IFN-γ but relatively low amounts of IL-4 and IL-10 (Figure 6). Two DR mismatched T cells primed with BAY-DC or ASA-DC failed to develop a robust Th1 type response and produced only small amounts of the growth-promoting cytokines IL-2 and IFN-γ. However they also produced low levels of IL-4 and the levels of IL-10 were comparable with controls, indicating that these T cells did not differentiate into Th2 cells. Because treated DC failed to stimulate strong development of IFN-γ producing T cells, the overall ratio of IFN-γ to IL-10 producing T cells was reduced. In Control-DC, the ratio was 4.8, in BAY-DC it was 1.1 and in ASA-DC it was 0.4. This suggests that while strong Th2 development is not initiated, T cells stimulated even by two DR mismatched BAY-DC or ASA-DC may be shifted away from a predominant Th1 response and definitely greatly reduced in the amount of Th1 cytokine produced.
T cells primed directly by allogeneic BAY- or ASA-treated DC with one HLA-DR mismatch are anergic
Table 1 shows the samples analyzed in the direct presentation experiments either with one or two HLA-DR mismatch and their T cell proliferation. The anergy results are also summarized in Fig. 7A and B. T cells primed with mature (one vs two HLA-DR mismatched) Control-DC, BAY-DC, or ASA-DC for 5 days were restimulated with allogeneic DC from the same donor as the original DC (second stimulation) for 3 days. The control for this experiment was the primed T cells without additional stimulation in the secondary culture which always gave low levels of proliferation (between 3–10 fold less proliferation, data not shown). Only T cells previously primed with BAY-DC or ASA-DC with one HLA-DR mismatch appeared to be less responsive ie., anergic, as shown by, e.g. the proliferative response of BAY-DC or ASA-DC-treated T cells being lower than that of Control-DC- treated DC (p = 0.01 and p < 0.0001, respectively) (Figure 7A). T cells previously primed with two DR mismatched BAY-DC or ASA-DC were not anergic (Table 1B and Fig. 7B). Proliferation of T cells previously primed with BAY-DC was not statistically different from T cells previously primed with Control-DC (p = 0.1), however, T cells stimulated with ASA-DC demonstrated greater proliferation than T cells stimulated by Control-DC (p = 0.01) (Fig. 7B). These results suggest that these cells were not anergic but sensitized to subsequent activation.
Table 1.
| Table 1A: Direct presentation. (1 DR mismatch) | |||||||
|---|---|---|---|---|---|---|---|
| Exp. | Haplotype | Anergy (Fig. 7A) | Regulatory activity (Fig. 8A) | ||||
| (T primed + DC-allo) |
(T primed + T fresh + DC-allo) |
||||||
| Control | BAY | ASA | Control | BAY | ASA | ||
| 1. | T cells: A23,31; B44,60; DR3,15 DC: A26,30; B38,18;DR3, - | 57,318 ± 1,971 | 38,228 ± 857 | 10,950 ± 2,300 | 106,725 ± 13,329 | 6,414 ± 1,520 | 24,568 ± 3290 |
| 2. | T cells: A2,29; B44,-; DR4,7 DC:A1,2; B52,50; DR7,15 | 31,420 ± 1,993 | 13,695 ± 553 | 4,348 ± 659 | 47,808 ± 10,674 | 18,714 ± 293 | 25,734 ± 2,536 |
| 3. | T cells: A2,29; B44,-; DR10,15 DC: A3,11; B7,38; DR15,- | 8,189 ± 1,808 | 8,202 ± 3,378 | 6,075 ± 2,949 | 11,984 ± 2,281 | 9,290 ± 1,446 | 12,164 ± 1,082 |
| 4. | T cells: A2,3; B27,37; DR1,7 DC: A11,25; B7,63; DR1,- | 65,230 ± 6,686 | 44,500 ± 3,705 | 47,720 ± 5,048 | 88,096 ± 12,828 | 62,238 ± 3,587 | 47,559 ± 4,591 |
| 5. | T cells: A24,26; B27,57; DR4,7 DC: A2,3; B35,50; DR7, 17 | 522,008 ± 14,187 | 546,723 ± 26,967 | 148,517 ± 19,926 | 561,765 ± 26,047 | 567,810 ± 46,866 | 148,987 ± 16,661 |
| 6. | T cells: A1,2; B27,53; DR7,13 DC: A2,3; B27,37; DR1, 7 | 126,785 ± 1,654 | 10,540 ± 1,568 | 92,279 ± 1,840 | |||
| Exp. Indicates the number of the experiment performed. Numbers in the table represent the T cell proliferation ± standard deviation. In the Haplotype column the HLA typing of T primed cells (Fig. 7A and Fig 8A) and fresh T cells (T cells) (Fig. 8A) and dendritic cells (DC) are given. T cell proliferation obtained in the experiment to evaluate anergy (see Material and Methods, Fig.7A) is given under Anergy column. T cell proliferation in the experiments to analyze regulatory activity (see Material and Methods, Fig 8A) are given under the Regulatory Activity column. Control, BAY and ASA indicates whether the NF-kB inhibitor was used or not during the generation of dendritic cells. | |||||||
| Table 1B: Direct presentation. (2 DR mismatch) | |||||||
|---|---|---|---|---|---|---|---|
| Exp. | Haplotype | Anergy (Fig. 7B) | Regulatory activity (Fig. 8B) | ||||
| (T primed + DC-allo) |
(T primed + T fresh + DC-allo) |
||||||
| Control | BAY | ASA | Control | BAY | ASA | ||
| 1. | T cells: A26,33; B44,58; DR9,13 DC: A24,26; B27,57; DR4,7 | 164,917 ± 29,029 | 146,409 ± 5,313 | 175,818 ± 4,716 | 252,775 ± 16,592 | 185,526 ± 3,659 | 217,009 ± 4,753 |
| 2. | T cells: A26,33; B44,58; DR9,13 DC: A2,28; B18,44; DR4,11 | 193,465 ± 22,616 | 293,766 ± 20,035 | 260,619 ± 5,935 | 251,691 ± 77,519 | 376,625 ± 58,738 | 314,194 ± 3,098 |
| 3. | T cells: A2,28; B18,44; DR4,11 DC: A2,-; B41,51; DR13,15 | 108,414 ± 12,808 | 129,857 ± 8,131 | 145,920 ± 7,889 | 196,324 ± 60,541 | 177,801 ± 6,980 | 247,410 ± 21,608 |
| 4. | T cells: A3,28; B18,55; DR16,- DC: A3,-; B7,35; DR1,13 | 160,993 ± 37,906 | 152,710 ± 17,718 | 161,113 ± 4,937 | 194,190 ± 12,157 | 167,498 ± 12,378 | 200,430 ± 6,652 |
| 5. | T cells: A2,28; B18,44; DR4,11 DC: A2,30; B27,51; DR1,13 | 190,734 ± 20,773 | N.D | 183,491 ± 3,975 | 235,321 ± 17,166 | N.D | 316,808 ± 20,511 |
| Exp. Indicates the number of the experiment performed. Numbers in the table represent the T cell proliferation ± standard deviation. In the Haplotype column the HLA typing of T primed cells (Fig. 7B and Fig. 8B) and fresh T cells (Fig. 8B) (T cells) and dendritic cells (DC) are given. T cell proliferation obtained in the experiment to evaluate anergy (see Material and Methods, Fig. 7B) is given under Anergy column. T cell proliferation in the experiments to analyze regulatory activity (see Material and Methods, Fig. 8B) are given under the Regulatory Activity column. Control, BAY and ASA indicates with NF-kB inhibitor was used or not during the generation of dendritic cells. N.D: not determined. | |||||||
Table 2 shows all the results obtained in the indirect presentation experiments either with one or two HLA-DR mismatch. T cells were primed with Control-DC and ASA-DC that were pulsed with apoptotic allogeneic PBMC with either one or two HLA-DR mismatches. After 5 days, primed T cells were collected and restimulated for three days with fresh mature Control-DC from the same donor as the original DC, indirectly pulsed as described above. Proliferation from T cells previously primed with ASA-DC pulsed with alloantigens, either with one or two HLA-DR mismatches, was not statistically different from T cells primed with Control-DC (p =0.3 and p = 0.4 respectively) indicating that they were not anergic (Table 2A/B and Figure 7C/D). In general, T cells stimulated with ASA-DC pulsed either with one or two HLA-DR mismatches, showed slightly higher proliferation than T cells stimulated with Control-DC, i.e. were not anergic (Table 2).
Table 2.
| Table 2A: Indirect presentation. (1 DR mismatch) | |||||
|---|---|---|---|---|---|
| Exp. | Haplotype | Anergy (Fig. 7C) | Regulatory activity (Fig. 8C) | ||
| (T primed + DC-pulsed) |
(T primed + T fresh + DC-pulsed) |
||||
| Control | ASA | Control | ASA | ||
| 1. | DC and T cells: A2,-; B41,51; DR13,15 PBMC for pulsing: A1,24; B27,53; DR7,13 | 15,600 ± 1,761 | 12,195 ± 1,336 | 51,362 ± 5,183 | 21,845 ± 1,908 |
| 2. | DC and T cells: A2,3; B35,50; DR7,17 PBMC for pulsing: A1,24; B27,53; DR7,13 | 29,582 ± 2,075 | 37,855 ± 3,104 | 73,141 ± 7,516 | 59,654 ± 4,041 |
| 3. | DC and T cells: A2,29; B44,-; DR4,7 PBMC for pulsing: A1,24; B27,53; DR7,13 | 36,891 ± 3,846 | 54,028 ± 6,705 | 100,343 ± 14,925 | 55,256 ± 9,696 |
| 4. | DC and T cells: A3,24; B7,44; DR7,15 PBMC for pulsing: A1,24; B27,53; DR7,13 | 137,329 ± 14,139 | 121,982 ± 3,120 | 192,481 ± 12,690 | 124,201 ± 13,196 |
| 5. | DC and T cells: A2,28; B18,48; DR4,11 PBMC for pulsing: A2,31; B62,50; DR4,8 | 119,667 ± 12,182 | 113,340 ± 20,173 | 178,356 ± 22,100 | 162,884 ± 8,007 |
| 6. | DC and T cells: A23,26; B14,27; DR1,7 PBMC for pulsing: A1,24; B27,53; DR7,13 | 35,320 ± 2,671 | 58,420 ± 7,944 | 48,128 ± 7,850 | 62,370 ± 3,745 |
| 7. | DC and T cells: A1,10; B18,52; DR3,15 PBMC for pulsing: A11,29; B44,-; DR7,15 | 44,933 ± 4,167 | 61,206 ± 7,160 | 90,445 ± 8,447 | 114,207 ± 12,344 |
| Exp. Indicates the number of the experiment performed. Numbers in the table represent the T cell proliferation ± standard deviation. In the Haplotype column the HLA typing of T primed cells (Fig. 7C and Fig. 8C) and fresh T cells (T cells) (Fig. 8C), dendritic cells (DC) and allogeneic PBMC used to pulsed DC are given. T cell proliferation obtained in the experiment to evaluate anergy (see Material and Methods, Fig. 7C) is given under Anergy column. T cell proliferation in the experiments to analyze regulatory activity (see Material and Methods, Fig. 8C) are given under the Regulatory Activity column. Control, BAY and ASA indicates whether the NF-k inhibitor was used or not during the generation of dendritic cells. | |||||
| Table 2B: Indirect presentation. (2 DR mismatch) | |||||
|---|---|---|---|---|---|
| Exp. | Haplotype | Anergy (Fig. 7D) | Regulatory activity (Fig. 8D) | ||
| (T primed + DC-pulsed) |
(T primed + T fresh + DC-pulsed) |
||||
| Control | ASA | Control | ASA | ||
| 1. | DC and T cells: A24,26; B27,57; DR4,7 PBMC for pulsing: A3,28; B18,35; DR12,14 | 42,661 ± 2,673 | 50,381 ± 1,892 | 46,569 ± 3,087 | 52,467 ± 2,754 |
| 2. | DC and T cells: A1,10; B18,52; DR3,15 PBMC for pulsing: A2,3; B35,50; DR7,8 | 26,353 ± 1,121 | 22,697 ± 2,999 | 64,742 ± 2,367 | 80,921 ± 2,144 |
| 3. | DC and T cells: A2,3; B27,37; DR1,7 PBMC for pulsing: A3,28; B18,35; DR12,14 | 9,158 ± 293 | 9,215 ± 1,210 | 9,530 ± 659 | 9,208 ± 374 |
| 4. | DC and T cells: A3,28; B18,55; DR16,- PBMC for pulsing: A1,24; B27,53; DR7,13 | 35,554 ± 3,544 | 44,804 ± 3,808 | 43,851 ± 3,092 | 65,706 ± 5,445 |
| 5. | DC and T cells: A2,30; B27,51; DR1,13 PBMC for pulsing: A2,29; B44,-; DR10,15 | 17,487 ± 1,963 | 15,899 ± 1,293 | 20,288 ± 2,136 | 16,158 ± 1,266 |
| 6. | DC and T cells: A2,28; B 18,48; DR4,11 PBMC for pulsing: A1,24; B27,53; DR7,13 | 70,016 ± 2,680 | 56,353 ± 6,266 | 211,561 ± 13,404 | 123,707 ± 18,089 |
| 7. | DC and T cells: A2,3; B35,38; DR12,13 PBMC for pulsing: A2,29; B44,-; DR10,15 | 29,827 ± 1,828 | 29,784 ± 1,825 | 244,188 ± 9,212 | 223,157 ± 26,438 |
| Exp. Indicates the number of the experiment performed. Numbers in the table represent the T cell proliferation ± standard deviation. In the Haplotype column the HLA typing of T primed cells (Fig. 7D and Fig. 8D) and fresh T cells (T cells) (Fig. 8D), dendritic cells (DC) and allogeneic PBMC used to pulsed DC are given. T cell proliferation obtained in the experiment to evaluate anergy (see Material and Methods, Fig. 7D) is given under Anergy column. T cell proliferation in the experiments to analyze regulatory activity (see Material and Methods, Fig. 8D) are given under the Regulatory Activity column. Control, BAY and ASA indicates whether the NF-k inhibitor was used or not during the generation of dendritic cells. | |||||
Direct and indirect presentation of alloantigen with one HLA-DR mismatch generates T cells with inhibitory/regulatory activity
In the context of transplantation, DC can sensitize alloreactive T cells via two pathways. The direct pathway is initiated by donor DC presenting intact donor MHC molecules. The indirect pathway results from recipient DC processing and presenting donor MHC as peptide to recipient T cells in a self-MHC restricted manner (29, 30).
In direct presentation experiments, T cells were stimulated with mature Control-DC, BAY-DC, or ASA-DC for 5 days. The primed T cells were harvest and rested for 2 days and then coculture with freshly isolated CD3+ and allogeneic DC from the same donor as the original DC (second stimulation) for 3 days. Separate experiments were conducted using T cells primed by DC that were allogeneic by either one or two HLA-DR mismatch. Table 1 shows the results obtained in direct presentation experiments with one or two HLA-DR mismatch. T cells previously primed directly with BAY or ASA-treated DC with one HLA-DR mismatch clearly inhibited T cell proliferation (p = 0.03 and p < 0.0001 respectively) (Fig. 8A) in contrast with T cells that were primed with DC with two HLA-DR mismatches that did not inhibit T cell proliferation (Fig. 8B). Also T cells previously primed with two HLA-DR mismatch ASA-DC showed slightly higher T cell proliferation than T cells stimulated with Control-DC. (BAY-DC, p= 0.96 and ASA-DC, p = 0.04 respectively) (Fig 8B).
To mimic indirect presentation, Control-DC and ASA-DC were pulsed with apoptotic allogeneic PBMC with either one or two HLA-DR mismatches. Pulsed-DC were used to prime autologous CD3+ T cells. After 5 days, primed T cells were collected and rested for 2 days and then a coculture with primed T cells plus freshly isolated CD3+ cells and fresh Control-DC, indirectly pulsed as described above, was performed. Table 2 shows all the results obtained in the indirect presentation experiments with one or two HLA-DR mismatch. T cells previously primed with autologous ASA-DC pulsed with one HLA-DR-mismatch (indirect presentation) (Table 2A, Fig. 8C) were able to significantly inhibit fresh T cell proliferation (p = 0.03) specially in 4 of 7 cultures, but T cells primed with autologous ASA-DC pulsed with two HLA-DR mismatched apoptotic cells did not inhibit T cell proliferation in a significant manner (p = 0.49) (Table 2B and Fig 8D).
In all experiments performed above, secondary stimulation was performed with the mixture of primed T cells, freshly isolated T cells and fresh DC. Because primed/regulatory T cells were already sensitized with DC, we measured what proportion of the total proliferation in these cultures could be due to their contribution. We have attempted to control for the “background” T primed/regulatory T cell proliferation by subtracting the response of these cells from the total. To determine the proliferation of fresh T cells directly and indirectly stimulated, proliferation of primed/regulatory T cells stimulated with fresh Control-DC (in Table 1 and Table 2 under Anergy column: primed T + DC) were subtracted from proliferation in the second stimulation (in Table 1 and Table 2 under Regulatory column: primed T + T fresh + DC). Results were comparable to previous analyses, ie., T cells primed with ASA-DC with one HLA-DR mismatch inhibited fresh T cell proliferation.
These results suggest that in certain MHC restricted and lesser HLA disparate reactions, NF-kB inhibited DC, presenting alloantigens in the context of self MHC, can induce the development of T cells with some regulatory function.
FoxP3 mRNA expression was evaluated using real time quantitative PCR in T cells primed with Control-DC versus ASA-DC, both pulsed with one HLA-DR allogeneic PBMC. Results comparing the FoxP3 expression in all experiments performed (n=7) showed no statistical differences (p = 0.89) between alloantigen pulsed ASA-DC and non-treated DC.
DISCUSSION
The ability of human DC to effect tolerance induction appears to be related to their functional state of maturation (31, 32). Nuclear localization of the NF-κB transcription factor RelB has previously been show to regulate DC differentiation and antigen presenting function through regulation of MHC and CD40 molecule expression (21). In vivo, the expression of RelB mRNA and protein correlates with the activated phase of peripheral blood DC and the postmigration stage of tissue DC development (33). In the absence of inflammation, immature DC continuously take up self antigen in the form of apoptotic cell bodies, which appear to actively suppress NF-κB activity (33), and thereby lack nuclear RelB expression and cell surface CD40. Also, antigen presentation in the context of MHC (signal 1) alone in the absence of signal 2 (CD80/86) has been shown to induce T cell anergy (35).
However, the clinical application of immature DC may not be suitable for the inhibition of allograft rejection because the immature DC which home into the damaged tissue where chronic inflammation is always present are not likely to remain immature in vivo after recirculation (36). A modified but terminally differentiated DC that cannot respond to an inflammatory stimulus and develop into an immunostimulatory mature DC, as we have developed here, may be more desirable.
The present report demonstrates that BAY 11-7082 or aspirin (ASA) inhibit the maturation of human monocyte-derived DC. Treatment with BAY or ASA resulted in a decrease in total RelB protein in both mature as well as immature DC. These results are consistent with previous observations demonstrating that both these compounds inhibit IκBα-kinase, thus blocking cytoplasmic degradation of IκB and nuclear translocation of RelB, thus blocking further transcription of RelB (19, 24). The resulting BAY- and ASA-treated DC express high levels of MHC class II and CD86. There were slightly lower levels of CD80 but always notably deficient expression of CD40. BAY- and ASA-treated DC had a reduced costimulatory capacity for T cell activation and were poor stimulators of T cell proliferation in MLR. Hackstein et al. demonstrated that when ASA-treated DC were injected into mice, the DC migrated to T cell areas of the draining lymph nodes and were poor stimulators of naïve T cells in vivo (25). This effect was long lasting after the removal of ASA, indicating a sustained change in DC maturation.
In experiments using the direct antigen presentation pathway, T cells cultured with either allogeneic BAY- or ASA-treated DC (two HLA-DR mismatches) produced reduced levels of IL-2 and IFN-γ, indicating a poor Th1 response while IL-10 production was never statistically increased compared to T cells treated by Control-DC, indicating that they did not differentiate into IL-10 secreting Tr1 type cells as initially hypothesized. Additionally, treated-DC apparently did not activate natural (pre-exisiting) CD4+ CD25+ T regulatory cells to secrete significantly increased levels of IL-10.
The decreased production of IL-2 and IFN-γ, cytokines which act as T cell growth factors, is consistent with decreased proliferation in response to allostimulation. Thompson et al. demonstrated that T cells stimulated with BAY-treated DC do not progress past the G0/G1 resting phase of the cell cycle (37). Our data confirm their observation that the decrease in proliferation was associated with a decrease in IFN-γ, which requires progression through the cell for its production.
T cell anergy is classically hypothesized to occur when T cells are stimulated through their TCR in the absence of strong costimulation. Although T regulatory cells are able to proliferate in vivo, they are characteristically anergic to TCR stimulation in vitro and induce anergy in neighboring T cells by suppressing IL-2 production or availability (36, 38). Previous in vitro work has demonstrated that bone marrow cells induce anergy in CD3+ T cells from peripheral blood possibly due to lack of costimulatory markers on the immature APC (6). Our results showed that T cells primed with completely allogeneic (two HLA-DR mismatches) treated-DC or T cells primed with alloantigen pulsed treated-DC (one or two HLA-DR mismatch) were not anergic and proliferated robustly in response to allogeneic DC or PMA/Ionomycin stimulation. These results are in agreement with previous Thompson report where BAY-treated DC were not anergic but sensitized to subsequent activation (37). Interestingly, when ASA-DC allogeneic to the T cells by only one HLA-DR mismatch were used, the T cells appeared to be anergic and also induced less proliferation in fresh T cells suggesting some regulatory activity.
Recent studies involving MHC knockout mice suggest that T regulatory cells require a self MHC for their development (39). Allo-peptide specific T regulatory cells can be expanded in vitro by priming purified CD4+ CD25+ cells with autologous immature DC loaded with HLA antigens (40). We theorize that T cells with regulatory function might be induced by autologous CD40-deficient DC primed to present donor alloantigen. Our results indicate that T cells cocultured with autologous CD40-deficient DC (ASA-DC) pulsed with apoptotic alloantigen (only with one HLA-DR mismatch) are able to subsequently suppress the proliferation of freshly isolated T cells stimulated with DC primed to present the same alloantigen. The type of the T cells with suppressor/regulatory capacity generated in our conditions are under current investigation. We also performed some preliminary experiments where primed/regulatory cells were irradiated and cocultured with freshly isolated T cells and allogeneic DC with one HLA-DR mismatch (second stimulation). The results showed that irradiated T cells previously primed with ASA-DC with one HLA-DR mismatch clearly inhibited fresh T cell proliferation, which are in complete agreement with our previous finding using primed T cells without irradiation. These experiments also suggest that the T regulatory cells generated here are irradiation resistant. Therefore with two independent approaches, ie. Irradiating the T primed/regulatory cells (here) or subtracting their activity from total (see Results) we were able to remove the contribution to proliferation of these cells to the proliferation of the responder cells.
In general T cells with some regulatory capacity were generated only when T cells were primed with allogenic treated-DC or with alloantigen pulsed treated-DC with one HLA-DR mismatch and not with two HLA-DR mismatch. At this time, we can not account for the differences found between one and two HLA-DR but our preliminary results suggest that it may be related to differences in the cytokine secretion profile, with more IFNγ abrogating a potential T regulatory phenotype in the two HLA-DR mismatch. More extensive experiments have to be performed to address these findings.
Thompson et al found that either mature allogeneic or autologous DC in which NF-κB was inhibited by treatment with BAY could not render T cells anergic and in fact the T cells were sensitized such that they proliferated to a greater extent than T cells primed with control mature DC (37). Also they could not detect regulatory T cells in their cultures. However, the HLA-DR typing of the donors was not described in their study.
In contrast to the Thompson report, a recent study described human monocyte-derived DC treated with combinations of vitamins C and E to inhibit NF-κB and oxidative pathways which prevent DC maturation and generate regulatory T cells (41). Probably, the differences in the signaling pathways affected by antioxidative vitamins and the NF-κB inhibitors used in this study may explain the differences in the results obtained. Very recently, Buckland et al reported that aspirin-treated human DC have increased ILT-3 and induce hyporesponsiveness and regulatory activity in alloreactive T cells (42). In general, these findings are in agreement with our study.
Important conclusions in our study are that ASA-treated DC consistently give lower expression of RelB protein, cell surface CD40, and were poorer stimulators of T cell proliferation in MLR than BAY-treated DC. In addition, T cells primed with ASA-treated DC with one HLA-DR mismatch gave stronger inhibition of fresh T cell proliferation indicating the presence of T cells with regulatory activity. According to our results we recommend the use of ASA rather than BAY to inhibit NF-κB during human DC differentiation to generate anergy or regulatory T cells.
In general, our results give more information about inhibition of NF-kB during the differentiation process of human DC with one and two HLA-DR mismatch, which could help to better understand of the mechanisms by which human DC can modulate T cell function in vivo vs. in vitro. These studies show that DC can promote T regulatory cell development may have important implications for the development of tolerogenic DC that may be used as adjuvant therapy for increasing tolerance in solid organ transplants.
ACKNOWLEDGMENTS
We thank Alain Diaz for performing some experiments, for data analysis and overall support, Jim Phillips for assistance with FACS analysis and Michelle Perez for secretarial assistance with the manuscript.
This work was supported by the National Institutes of Health grant No. R01DK25243-25 and Miami Veterans Affairs Medical Center research support to JM.
ABBREVIATIONS
- ASA
acetylsalicylic acid
- BAY
(E)3-[4-t-Methylphenyl)-sulfonyl]-2-propenenitrile
- DC
dendritic cells
- FoxP3
Forkhead box (Fox) winged helix DNA binding domain, transcription factors (P3)
- GM-CSF
granulocyte macrophage-colony-stimulating factor
- HLA
human leukocyte antigen
- IL
interleukin
- NF-κB
nuclear factor kappa B
- PBMC
peripheral blood mononuclear cells
- PGE2
prostoglandin E2
- PMA
phorbol myristic acetate
- TNFα
tumor necrosis factor-alpha
- T reg
T regulatory cells
Footnotes
Publisher's Disclaimer: This is a PDF file of an unedited manuscript that has been accepted for publication. As a service to our customers we are providing this early version of the manuscript. The manuscript will undergo copyediting, typesetting, and review of the resulting proof before it is published in its final citable form. Please note that during the production process errors may be discovered which could affect the content, and all legal disclaimers that apply to the journal pertain.
REFERENCES
- 1.Ciancio G, Burke GW, Garcia-Morales R, Suzart K, Rosen A, Ricordi C, Kenyon NS, Mathew JM, Tzakis AG, Esquenazi V, Miller J. Effect of living-related donor bone marrow infusion on chimerism and in vitro immunoregulatory activity in kidney transplant recipients. Transplantation. 2002;74:488. doi: 10.1097/00007890-200208270-00010. [DOI] [PubMed] [Google Scholar]
- 2.Zeng D, Lan F, Hoffmann P, Strober S. Suppression of graft-versus-host disease by naturally occurring regulatory T cells. Transplantation. 2004;77:S9. doi: 10.1097/01.TP.0000106475.38978.11. [DOI] [PubMed] [Google Scholar]
- 3.Higuchi M, Zeng D, Shizuru J, Gworek J, Dejbakhsh-Jones S, Taniguchi M, Strober S. Immune tolerance to combined organ and bone marrow transplants after fractionated lymphoid irradiation involves regulatory NK T cells and clonal deletion. J Immunol. 2002;169:5564. doi: 10.4049/jimmunol.169.10.5564. [DOI] [PubMed] [Google Scholar]
- 4.Lagoo-Deenadayalan S, Lagoo AS, Lemons JA, Lorenz HM, Bass JD, McDaniel DO, Hardy KJ, Barber WH. Donor specific bone marrow cells suppress lymphocyte reactivity to donor antigens and differentially modulate TH1 and TH2 cytokine gene expression in the responder cell population. Transp Immunol. 1995;3:124. doi: 10.1016/0966-3274(95)80039-5. [DOI] [PubMed] [Google Scholar]
- 5.Mathew JM, Garcia-Morales RO, Carreno M, Jin Y, Fuller L, Blomberg B, Cirocco R, Burke GW, Ciancio G, Ricordi C, Esquenazi V, Tzakis AG, Miller J. Immune responses and their regulation by donor bone marrow cells in clinical organ transplantation. Transpl Immunol. 2003;11:307. doi: 10.1016/S0966-3274(03)00056-X. [DOI] [PubMed] [Google Scholar]
- 6.Jim Y, Fuller L, Carreno M, Esquenazi V, Blomberg BB, Wei YT, Ciancio G, Burke GW, 3rd, Tzakis A, Ricordi C, Miller J. Functional and phenotypic properties of peripheral T cells anergized by autologous CD3(+) depleted bone marrow cells. Hum Immunol. 2002;63:567. doi: 10.1016/s0198-8859(02)00402-0. [DOI] [PubMed] [Google Scholar]
- 7.Jin Y, Fuller L, Wei Y, Blomberg BB, Miller J, Esquenazi V. Bone marrow cells promote TH2 polarization and inhibit virus-specific CTL generation. Hum Immunol. 2002;61:1233. doi: 10.1016/s0198-8859(00)00206-8. [DOI] [PubMed] [Google Scholar]
- 8.Jin Y, Fuller L, Esquenazi V, Blomberg BB, Rosen A, Tzakis AG, Ricordi C, Miller J. Bone marrow cells inhibit the generation of autologous EBV-specific CTL. Hum Immunol. 2000;61:538. doi: 10.1016/s0198-8859(00)00120-8. [DOI] [PubMed] [Google Scholar]
- 9.Toungouz M, Donckier V, Goldman M. Tolerance induction in clinical transplantation: the pending questions. Transplantation. 2003;75:58S. doi: 10.1097/01.TP.0000067955.60639.D5. [DOI] [PubMed] [Google Scholar]
- 10.Jin Y, Fuller L, Ciancio G, Burke GW, 3rd, Tzakis AG, Ricordi C, Miller J, Esquenzai V. Antigen presentation and immune regulatory capacity of immature and mature-enriched antigen presenting (dendritic) cells derived from human bone marrow. Hum Immunol. 2004;65:93. doi: 10.1016/j.humimm.2003.11.002. [DOI] [PubMed] [Google Scholar]
- 11.Delis S, Ciancio G, Burke GW, 3rd, Garcia-Morales R, Miller J. Donor bone marrow transplantation: chimerism and tolerance. Transpl Immunol. 2004;13:105. doi: 10.1016/j.trim.2004.05.006. [DOI] [PubMed] [Google Scholar]
- 12.Fudaba Y, Spitzer TR, Shaffer J, Kawai T, Fehr T, Delmonico F, Preffer F, Tolkoff-Rubin N, Dey BR, Saidman SL, Kraus A, Bonnefoix T, McAfee S, Power K, Kattleman K, Colvin RB, Sachs DH, Cosimi AB, Sykes M. Myeloma Responses and Tolerance Following Combined Kidney and Nonmyeloablative Marrow Transplantation: In Vivo and In Vitro Analyses. Am J Transplant. 2006;6:2121. doi: 10.1111/j.1600-6143.2006.01434.x. [DOI] [PubMed] [Google Scholar]
- 13.Bethy S, Borovsky Z, Mevorach D, Liebergall M, Gazit Z, Aslan H, Galun E, Rachmilewitz J. Human mesenchymal stem cells alter antigen-presenting cell maturation and induce T cell unresponsiveness. Blood. 2005;105:2214. doi: 10.1182/blood-2004-07-2921. [DOI] [PubMed] [Google Scholar]
- 14.Steinman RM, Hawiger D, Liu K, Bonifaz L, Bonnyay D, Mahnke K, Iyoda T, Ravetch J, Dhodapkar M, Inaba K, Nussenzweig M. Dendritic cell function in vivo during the steady state: a role in peripheral tolerance. Ann N Y Acad Sci. 2003;987:15. doi: 10.1111/j.1749-6632.2003.tb06029.x. [DOI] [PubMed] [Google Scholar]
- 15.Jonuleit H, Schmitt E, Schuler G, Knop J, Enk A. Induction of IL-10–producing, nonproliferating CD4+ T cells with regulatory properties by repetitive stimulation with allogeneic immature dendritic cells. J Exp Med. 2000;192:1213. doi: 10.1084/jem.192.9.1213. [DOI] [PMC free article] [PubMed] [Google Scholar]
- 16.Dhodapkar MV, Steinman RM, Krasovsky J, Munz C, Bhardwaj N. Antigen-specific inhibition of effector T cell function in humans after injection of immature dendritic cells. J Exp Med. 2001;193:233. doi: 10.1084/jem.193.2.233. [DOI] [PMC free article] [PubMed] [Google Scholar]
- 17.Lutz MB, Suri RM, Niimi M, Ogilvie AL, Kukutsch NA, Rossner S, Schuler G, Austyn JM. Immature dendritic cells generated with low doses of GM-CSF in the absence of IL-4 are maturation resistant and prolong allograft survival in vivo. Eur J Immunol. 2000;30:1813. doi: 10.1002/1521-4141(200007)30:7<1813::AID-IMMU1813>3.0.CO;2-8. [DOI] [PubMed] [Google Scholar]
- 18.Thomson AW, Lu L. Are dendritic cells the key to liver transplant tolerance? Immunol Today. 1999;20:27–32. doi: 10.1016/s0167-5699(98)01378-4. [DOI] [PubMed] [Google Scholar]
- 19.Martin E, O’Sullivan B, Low P, Thomas R. Antigen-specific suppression of a primed immune response by dendritic cells mediated by regulatory T cells secreting interleukin-10. Immunity. 2003;18:155. doi: 10.1016/s1074-7613(02)00503-4. [DOI] [PubMed] [Google Scholar]
- 20.Pettit AR, Quinn C, MacDonald KP, Cavanagh LL, Thomas G, Townsend W, Handel M, Thomas R. Nuclear localization of RelB is associated with effective antigen-presenting cell function. J Immunol. 1997;159:3681. [PubMed] [Google Scholar]
- 21.O'Sullivan BJ, MacDonald KP, Pettit AR, Thomas R. RelB nuclear translocation regulates B cell MHC molecule, CD40 expression, and antigen-presenting cell function. Proc Natl Acad Sci. 2000;97:11421. doi: 10.1073/pnas.97.21.11421. [DOI] [PMC free article] [PubMed] [Google Scholar]
- 22.Bonham CA, Peng L, Liang X, Chen Z, Wang L, Ma L, Hackstein H, Robbins PD, Thomson AW, Fung JJ, Qian S, Lu L. Marked prolongation of cardiac allograft survival by dendritic cells genetically engineered with NF-kappa B oligodeoxyribonucleotide decoys and adenoviral vectors encoding CTLA4-Ig. J Immunol. 2002;169:3382. doi: 10.4049/jimmunol.169.6.3382. [DOI] [PubMed] [Google Scholar]
- 23.Xu MQ, Suo YP, Gong JP, Zhang MM, Yan LN. Prolongation of liver allograft survival by dendritic cells modified with NF-kappaB decoy oligodeoxynucleotides. World J Gastroenterol. 2004;10:2361. doi: 10.3748/wjg.v10.i16.2361. [DOI] [PMC free article] [PubMed] [Google Scholar]
- 24.Yin MJ, Yamamoto Y, Gaynor RB. The anti-inflammatory agents aspirin and salicylate inhibit the activity of I(kappa)B kinase-beta. Nature. 1998;396:77. doi: 10.1038/23948. [DOI] [PubMed] [Google Scholar]
- 25.Hackstein H, Morelli AE, Larregina AT, Ganster RW, Papworth GD, Logar AJ, Watkins SC, Falo LD, Thomson AW. Aspirin inhibits in vitro maturation and in vivo immunostimulatory function of murine myeloid dendritic cells. J Immunol. 2001;166:7053. doi: 10.4049/jimmunol.166.12.7053. [DOI] [PubMed] [Google Scholar]
- 26.Matasic R, Dietz AB, Vuk-Pavlovic S. Cyclooxygenase-independent inhibition of dendritic cell maturation by aspirin. Immunology. 2000;101:53. doi: 10.1046/j.1365-2567.2000.00065.x. [DOI] [PMC free article] [PubMed] [Google Scholar]
- 27.Davis TA, Saini AA, Blair PJ, Levine BL, Craighead N, Harlan DM, June CH, Lee KP. Phorbol Esters Induce Differentiation of Human CD34+ Hemopoietic Progenitors to Dendritic Cells: Evidence for Protein Kinase C-Mediated Signaling. J Immunol. 1998;160:3689. [PubMed] [Google Scholar]
- 28.DePrimo SE, Diehn M, Nelson JB, Reiter RE, Matese J, Fero M, Tibshirani R, Brown PO, Brooks JD. Transcriptional programs activated by exposure of human prostate cancer cells to androgen. Genome Biology 3: Research 0034.1. 2002 doi: 10.1186/gb-2002-3-7-research0032. [DOI] [PMC free article] [PubMed] [Google Scholar]
- 29.Suciu-Foca N, Ciubotariu R, Itescu S, Rose EA, Cortesini R. Indirect allorecognition of donor HLA-DR peptides in chronic rejection of heart allografts. Transplant Proc. 1998;30:3999. doi: 10.1016/s0041-1345(98)01318-9. [DOI] [PubMed] [Google Scholar]
- 30.Harris PE, Cortesini R, Suciu-Foca N. Indirect allorecognition in solid organ transplantation. Rev Immunogenet. 1999;1:297. [PubMed] [Google Scholar]
- 31.Jonuleit H, Schmit E, Schuler G, Knop J, Enk AH. Induction of interleukin 10-producing, non-proliferating CD4+ T cells with regulatory properties by repetitive stimulation with allogeneic immature human dendritic cells. J Exp Med. 2000;192:1213. doi: 10.1084/jem.192.9.1213. [DOI] [PMC free article] [PubMed] [Google Scholar]
- 32.Dhodapkar MV, Steinman RM, Krasovsky J, Munz C, Bhardwaj N. Antigen-specific inhibition of effector T cell function in humans after injection of immature dendritic cells. J Exp Med. 2001;193:233. doi: 10.1084/jem.193.2.233. [DOI] [PMC free article] [PubMed] [Google Scholar]
- 33.Clark GJ, Gunningham S, Troy A, Vuckovic S, Hart DN. Expression of the RelB transcription factor correlates with the activation of human dendritic cells. Immunology. 1999;98:189. doi: 10.1046/j.1365-2567.1999.00829.x. [DOI] [PMC free article] [PubMed] [Google Scholar]
- 34.Thompson AG, Pettit AR, Padmanabha J, Mansfield H, Frazer IH, Strutton GM, Thomas R. Nuclear RelB+ cells are found in normal lymphoid organs and in peripheral tissue in the context of inflammation, but not under normal resting conditions. Immunol. Cell Biol. 2002;80:164. doi: 10.1046/j.1440-1711.2002.01070.x. [DOI] [PubMed] [Google Scholar]
- 35.Rocha B, Tanchot C, Von Boehmer H. Clonal anergy blocks in vivo growth mature T cells and can be reversed in the absence of antigen. J Exp Med. 1993;177:1517. doi: 10.1084/jem.177.5.1517. [DOI] [PMC free article] [PubMed] [Google Scholar]
- 36.Roncarolo MG, Levings MK, Traversari C. Differentiation of T regulatory cells by immature dendritic cells. J Exp Med. 2001;193:F5. doi: 10.1084/jem.193.2.f5. [DOI] [PMC free article] [PubMed] [Google Scholar]
- 37.Thompson AG, O'Sullivan BJ, Beamish H, Thomas R. T cells signaled by NF-κB−dendritic cells are sensitized not anergic to subsequent activation. J Immunol. 2004;173:1671. doi: 10.4049/jimmunol.173.3.1671. [DOI] [PubMed] [Google Scholar]
- 38.Takahashi T, Kuniyasu Y, Toda M, Sakaguchi N, Itoh M, Iwata M, Shimizu J, Sakaguchi S. Immunologic self-tolerance maintained by CD25+CD4+ naturally anergic and suppressive T cells: induction of autoimmune disease by breaking their anergic/suppressive state. Int Immunol. 1998;10:1969. doi: 10.1093/intimm/10.12.1969. [DOI] [PubMed] [Google Scholar]
- 39.Hanash AM, Levy RB. Donor CD4+CD25+ T cells promote engraftment and tolerance following MHC-mismatched hematopoietic cell transplantation. Blood. 2005;105:1828. doi: 10.1182/blood-2004-08-3213. [DOI] [PubMed] [Google Scholar]
- 40.Jiang S, Camara N, Lombardi G, Lechler RI. Induction of allopeptide-specific human CD4+CD25+ regulatory T cells ex vivo. Blood. 2003;102:2180. doi: 10.1182/blood-2003-04-1164. [DOI] [PubMed] [Google Scholar]
- 41.Tan PH, Sagoo P, Chan C, Yates JB, Campbell J, Beutelspacher SC, Foxwell BM, Lombardi G, George AJ. Inhibition of NF-kappa B and oxidative pathways in human dendritic cells by antioxidative vitamins generates regulatory T cells. J Immunol. 2005;174:7633. doi: 10.4049/jimmunol.174.12.7633. [DOI] [PubMed] [Google Scholar]
- 42.Buckland M, Jago CB, Fazekasova H, Scott K, Tan PH, George AJ, Lechler R, Lombardi G. Aspirin-Treated Human DCs Up-Regulate ILT-3 and Induce Hyporesponsiveness and Regulatory Activity in Responder T Cells. Am J Transplant. 2006;6:2046. doi: 10.1111/j.1600-6143.2006.01450.x. [DOI] [PubMed] [Google Scholar]