

Abstract
Suprachiasmatic nucleus (SCN) neurons generate circadian rhythms, and these neurons normally exhibit loosely-synchronized action potentials. Although electrotonic coupling has long been proposed to mediate this neuronal synchrony, ultrastructural studies have failed to detect gap junctions between SCN neurons. Nevertheless, it has been proposed that neuronal gap junctions exist in the SCN; that they consist of connexin32 or, alternatively, connexin36; and that connexin36 knockout eliminates neuronal coupling between SCN neurons and disrupts circadian rhythms. We used confocal immunofluorescence microscopy and freeze-fracture replica immunogold labeling to examine the distributions of connexin30, connexin32, connexin36, and connexin43 in rat and mouse SCN and used whole-cell recordings to re-assess electrotonic and tracer coupling. Connexin32-immunofluorescent puncta were essentially absent in SCN but connexin36 was relatively abundant. Fifteen neuronal gap junctions were identified ultrastructurally, all of which contained connexin36 but not connexin32, whereas nearby oligodendrocyte gap junctions contained connexin32. In adult SCN, one neuronal gap junction was >600 connexons, whereas 75% were smaller than 50 connexons, which may be below the limit of detectability by fluorescence microscopy and thin-section electron microscopy. Whole-cell recordings in hypothalamic slices revealed tracer coupling with Neurobiotin in <5% of SCN neurons, and paired recordings (>40 pairs) did not reveal obvious electrotonic coupling or synchronized action potentials, consistent with few neurons possessing large gap junctions. However, most neurons had partial spikes or spikelets (often <1 mV), which remained after QX-314 had blocked sodium-mediated action potentials within the recorded neuron, consistent with spikelet transmission via small gap junctions. Thus, a few “miniature” gap junctions on most SCN neurons appear to mediate weak electrotonic coupling between limited numbers of neuron pairs, thus accounting for frequent detection of partial spikes and hypothetically providing the basis for “loose” electrical or metabolic synchronization of electrical activity commonly observed in SCN neuronal populations during circadian rhythms.
Keywords: immunocytochemistry, electrical synapse, freeze-fracture replica immunogold labeling, spikelet, metabolic coupling, synchrony
The suprachiasmatic nucleus (SCN) is the primary generator of the circadian rhythm in mammals [reviewed by van den Pol and Dudek (1993); Ibata et al. (1999); Hastings and Herzog, 2004]. Electrophysiological evidence from single-unit recordings (Green and Gillette, 1982) and days-long multiple-unit recordings of SCN neurons in hypothalamic slices (Bouskila and Dudek, 1993; Gribkoff et al., 2003) revealed that neurons in the isolated SCN generate a coordinated circadian rhythm of loosely synchronized electrical activity regulated by oscillatory mechanisms involving transcription and translation of circadian genes (Hastings and Herzog, 2004). Excitatory glutamatergic inputs from the retina mediate entrainment of the circadian rhythm to the environmental light-dark cycle (Kim and Dudek, 1991; Castel et al., 1993; Mintz et al., 1999). Although the intact SCN has a “free-running” (i.e., not entrained by environmental cues) oscillatory pattern of electrical activity that approximates 24 h, isolated SCN neurons have rhythms that range from about 20 h to 28 h (Welsh et al., 1995; Honma et al., 1998, 2004). The presence of circadian rhythms in “free-running” animals suggests that SCN neurons are normally synchronized by intercellular mechanisms that coordinate the circadian rhythms of individual SCN neurons and maintain the population rhythm of SCN electrical activity.
The intercellular mechanisms that synchronize the electrical rhythms of individual SCN neurons remain largely unknown, but one possibility involves the activity of local GABAergic neurons. Neurons of the SCN release GABA as an inhibitory neurotransmitter [see van den Pol and Dudek (1993)], and anatomical studies have suggested that SCN neurons have local axonal projections that interconnect these neurons via GABAergic synapses (van den Pol, 1980). Electrophysiological studies using whole-cell recordings from SCN neurons in hypothalamic slices have provided evidence that action potentials in these neurons evoke GABAA-receptor-mediated postsynaptic currents in other SCN neurons (Strecker et al., 1997), and that local GABAergic circuits may contribute to synchronization of SCN neurons (Liu and Reppert, 2000; Wagner et al., 2006). However, mechanisms that could underlie GABA-mediated synchronization are not established.
Another hypothesis for synchronization of SCN neurons during circadian rhythms is electrotonic and/or metabolic coupling through gap junctions that directly link SCN neurons (van den Pol and Dudek, 1993). However, ultrastructural studies using thin-section transmission electron microscopy (TEM) did not observe gap junctions between SCN neurons (van den Pol, 1980). Moreover, electrophysiological studies with dual intracellular recording of cultured SCN slices found no direct evidence for electrotonic coupling, even though electrical coupling was extensive between nearby glial cells (Welsh and Reppert, 1996). Nevertheless, SCN neurons in hypothalamic slices bathed in calcium-free solutions (which block chemical synaptic transmission) generated synchronous bursts of electrical activity, suggesting that electrical synchronization, possibly via gap junctions, can occur in the SCN without the participation of active chemical synapses (Bouskila and Dudek, 1993). Subsequently, dye- and tracer-coupling studies and indirect electrophysiological evidence suggested that at least some SCN neurons are electrotonically coupled, presumably through gap junctions (Jiang et al., 1997; Colwell, 2000). Moreover, connexin32 (Cx32) was reported in virtually all SCN neurons (Colwell, 2000). However, neither ultrastructurally-defined gap junctions nor immunocytochemically-localized connexin has been documented in SCN neurons. More recently, dual whole-cell recordings provided evidence for electrotonic coupling and spike-for-spike synchrony in slices of normal rat SCN, whereas electrotonic coupling was not detected in SCN slices from connexin36-knockout mice, which were also reported to have disrupted circadian rhythms (Long et al., 2005). Based largely on this electrophysiological evidence and citing an unpublished abstract (Rash et al; Soc. Neurosci. Abstr. 749.11, 2002) for immunocytochemical precedent, Long and coworkers (Long et al., 2005) proposed Cx36 as the primary or sole connexin in neuronal gap junctions in SCN, and suggested that Cx36 deletion disrupted circadian rhythms. Among the 21 connexins known to be present in mammals (Condorelli et al., 1998; Söhl and Willecke, 2003; Willecke et al., 2002), both Cx36 and Cx45 have been demonstrated in ultrastructurally-defined neuronal gap junctions (Rash et al., 2000, 2001, 2005; Fukuda et al., 2006; Kamasawa et al., 2006), and there is immunocytochemical evidence for neuronal expression of Cx50 and Cx57 in retina (Massey et al., 2003; Hombach et al, 2004; O’Brien et al., 2006). In view of controversies surrounding the existence and connexin composition of neuronal gap junctions in SCN, we used confocal immunofluorescence microscopy and freeze-fracture replica immunogold labeling (FRIL) to document gap junctions in SCN neurons and to identify the constituent connexins in neurons vs. glia, and whole-cell recordings from hypothalamic slices to re-assess tracer and electrotonic coupling.
A portion of these data have been presented in abstract form (Rash et al; Soc. Neurosci. Abstr. 749.11, 2002).
EXPERIMENTAL PROCEDURES
All experiments were conducted according to the Principles of Laboratory Animal Care (NIH publication No. 86-23, Rev. 1985), with minimization of stress to and number of animals used. Ethical care and treatment of animals was conducted in accordance with individual protocols approved by the Institutional Animal Care and Use Committees of the respective institutions. For euthanasia, anesthetized animals were decapitated, consistent with recommendations of the Capital Panel on Euthanasia of the American Veterinary Association. For the electrophysiological studies, all animals were euthanized between 9–10 AM (ZT=3:00–4:00). For ultrastructural analysis, all animals were fixed between 11 AM and 1 PM (i.e., at Zeitgeber time ZT=5–7), which approximates the Zeitgeber time of the electrophysiological experiments after equilibration of slices (see below), and is similar to those in other studies (Long et al., 2005).
Light microscope immunocytochemistry
Twelve Cx36 homozygous wild-type (Cx36 +/+) and eight Cx36 homozygous knockout (Cx36 −/−) mice were used for fluorescence analysis. Mice were bred at the University of Manitoba Central Animal Care Services. Colonies of wild-type and Cx36 knockout mice were established from heterozygous (Cx36+/−) (LacZ-neoR+/−) mice with F2 C57/B6-129vEv mixed background [(Deans et al., 2001); kindly provided by Dr. D. Paul, Harvard University] and genotyped as previously described (Li et al., 2004). Animals at ZT=4:00–7:00 were deeply anesthetized with Equithesin and perfused transcardially and sequentially with three solutions consisting of 4°C pre-fixative (0.9% saline in 50 mM sodium phosphate buffer, pH 7.4, PBS), then 2% formaldehyde from freshly depolymerized paraformaldehyde plus 0.2% picric acid fixative, followed by perfusion with 10% sucrose in PBS(Li et al., 2004). Tissues were stored at 4°C for at least 24 h in cryoprotectant solution prior to sectioning and collection of cryostat sections on gelatinized glass slides.
Sections of brain containing the anterior to posterior poles of the SCN from wild-type mice and Cx36 knockout mice were incubated for 16 h at 4°C with one or two of 13 primary antibodies (Table 1). The anti-Cx36 antibodies obtained from Invitrogen/Zymed Laboratories (Camarillo, CA, USA) were against two different epitopes of the Cx36 protein sequence (Li et al., 2004). All Cx36 antibodies were diluted in Tris buffered saline Triton buffer (TBSTr) consisting of 50 mM Tris-HCl, pH 7.6, 1.5% NaCl, 0.3% Triton X-100 and 10% normal goat serum. After primary antibody incubation, sections were washed for 1 h in TBSTr and incubated for 1.5 h at room temperature with either AlexaFluor 488-conjugated goat anti-rabbit IgG (diluted 1:1000) (Molecular Probes, Eugene, OR, USA) or FITC-conjugated donkey anti-rabbit or FITC-conjugated horse anti-mouse IgG (diluted 1:200) (Jackson ImmunoResearch Laboratories, West Grove, PA, USA). Following secondary incubation and washes, sections were washed for 15 min in phosphate-buffered saline (PBS, 25 mM sodium phosphate buffer, pH 7.4, 0.9% NaCl) and counterstained with NeuroTrace 530/615 red fluorescent Nissl stain (Molecular Probes) in PBS for 10 min, and then washed for 15 min in PBS prior to application of antifade medium and coverslipping. Additional sections were incubated simultaneously with rabbit polyclonal anti-Cx32 antibody Ab34-5700 (Invitrogen/Zymed) and monoclonal anti-2,’3′-cyclic nucleotide 3′-phosphodiesterase (anti-CNPase; Sternberger Monoclonals, Inc., Baltimore, MD, USA) in TBSTr containing 5% normal donkey serum. Sections were washed for 1 h in TBSTr, incubated for 1.5 h with FITC-conjugated donkey anti-rabbit IgG diluted 1:200 and Cy3-conjugated goat anti-mouse IgG diluted 1:200 (Jackson ImmunoResearch Laboratories), washed for 20 min in TBSTr and for an additional 30 min in 50 mM Tris-HCl, pH 7.4. For labeling of Cx30 and Cx43, sections were incubated simultaneously with rabbit polyclonal anti-Cx30 (Ab71-2200) and mouse monoclonal anti-Cx43 (Ab35-5000), washed, then incubated simultaneously with FITC-conjugated donkey anti-rabbit IgG diluted 1:200 and Cy3-conjugated goat anti-mouse IgG diluted 1:200. After a final wash and application of anti-fade medium, all sections were coverslipped. Immunofluorescence was examined using a Zeiss Axioskop2 fluorescence microscope and an Olympus Fluoview IX70 confocal microscope. Images were obtained using Carl Zeiss Axiovision 3.0 image software (Carl Zeiss Canada, Toronto, ON) and assembled using Adobe Photoshop CS (Adobe Systems, San Jose, CA, USA), Northern Eclipse 5.0 (Empix Imaging, Missisagua, Ontario, Canada), and CorelDRAW Graphics Suite 12 (Corel Corporation, Ottawa, ON, Canada).
Table 1.
Antibodies and concentrations used for immunohistochemistry and FRIL.
| Antibody | Type | Species | Epitope; Designation | Dilution* | Source |
|---|---|---|---|---|---|
| Cx36 | polyclonal | rabbit | c-terminus; Ab36-4600 | 1 μg/ml, 10 μg/ml | Invitrogen/Zymed |
| Cx36 | polyclonal | rabbit | c-terminus; Ab51-6300 | 1 μg/ml, 10 μg/ml | Invitrogen/Zymed |
| Cx36 | polyclonal | rabbit | aa298-318; Rash et al., 2000 | 10 μg/ml | JI Nagy** |
| Cx36 | monoclonal | mouse | c-terminus; Ab37-4600 | 3 μg/ml, 10 μg/ml | Invitrogen/Zymed |
| Cx32 | polyclonal | rabbit | c-terminus; Ab34-5700 | 1 μg/ml | Invitrogen/Zymed |
| Cx32 | polyclonal | rabbit | cytoplasmic loop; Ab71-0600 | 10 μg/ml | Invitrogen/Zymed |
| Cx32 | monoclonal | mouse | cytoplasmic loop; Ab13-8200 | 10 μg/ml | Invitrogen/Zymed |
| Cx32 | monoclonal | mouse | aa95-125, mid region; MAB3069 | 10 μg/ml | Chemicon |
| Cx30 | polyclonal | rabbit | c-terminus; Ab71-2200 | 3 μg/ml, 10 μg/ml | Invitrogen/Zymed |
| Cx43 | monoclonal | mouse | c-terminus; Ab35-5000 | 3 μg/ml | Invitrogen/Zymed |
| Cx43 | monoclonal | mouse | c-terminus; MAB3068 | 10 μg/ml | Chemicon |
| AQP4 | polyclonal | rabbit | c-terminus; AB3068 | 10 μg/ml | Chemicon |
| CNPase | monoclonal | mouse | whole protein | 1:2000 | Sternberger Monoclonals |
For FRIL, all antibodies were used at 10 μg/ml.
Previously characterized in Rash et al. (2000)
aa, amino acids
Animals; formaldehyde fixation for FRIL
Nine adult Sprague-Dawley rats (one female, eight males; 101–479 gm) and one P14 male rat (35 gm) were anesthetized with ketamine (90 mg/kg) and xylazine (8 mg/kg) administered by intraperitoneal injection. Rats were chemically fixed by whole-body perfusion (10 min) with 1%, 2% or 4% formaldehyde in Sørensen’s phosphate buffer (SPB, pH 7.4); the animals were decapitated; the brains were removed, hand-cut coronal slices were embedded in gelatin; and sections containing SCN were cut into 100-μm-thick slices using a Lancer Vibratome 3000 (Vibratome Company, St. Louis, MO) equipped with a refrigerated stage maintained at 4°C. Samples were infiltrated with 30% glycerol, ultra-rapidly frozen by contact with a −195°C copper “mirror” (Phillips and Boyne, 1984) (Gentleman Jim, Ted Pella, Inc., Redding, CA, USA) or an MF7000 Slam Freezer (Boeckler Instruments, Tucson, AZ), freeze fractured in a JEOL/RFD 9010C freeze-fracture machine (RMC/Boeckler; contact JEOL, Akishima, Japan), rotary coated with 1 nm of carbon, and unidirectionally shadowed with 1.0–1.5 nm of platinum/carbon, followed by 20 nm of carbon (Rash and Yasumura, 1999; Rash et al., 1998, 2004; as modified in Kamasawa et al., 2006). A gold “index” grid containing a droplet of 1.5–2.5% Lexan plastic dissolved in dichloroethane was placed on the frozen surface of the replica, the solvent was evaporated at −35° to −20° C, and the Lexan-stabilized samples were thawed and photo-mapped in a Molecular Dynamics Sarastro 2001 inverted laser scanning confocal microscope (no longer manufactured) or a Zeiss LSM 510 Meta confocal microscope (Carl Zeiss, Inc., Thornwood, NY). Samples were mapped both in transmitted light to reveal the location of the tissue with respect to the gold “index” grid and by fluorescence microscopy to reveal the locations of histological landmarks with respect to grid locations (Fig. 1). The optic chiasm (lower dark area in transmitted light, Fig. 1B; white area in fluorescence image, Fig. 1A), with its undulating impression of the SCN (outlined areas, Figs. 1A–B), and a ventral portion of the third brain ventricle were particularly useful landmarks that were easily recognized both in light microscopic images and in freeze-fracture replicas. Locations of gap junctions that were photographed by electron microscopy were plotted on the original light microscopic photomap of the same tissue slice (Rash et al., 1995, 1996, 1997) and transferred to their approximate locations in a single representative image from a mid-coronal section through the SCN. We use the term FRIL (rather than SDS-FRL; Fujimoto, 1995) based on precedence of FRIL (Gruijters et al., 1987) and on the combination of "confocal grid-mapped freeze fracture" (Rash et al., 1995, 1997) with SDS-FRL as FRIL (Rash et al., 2004b).
Fig. 1.
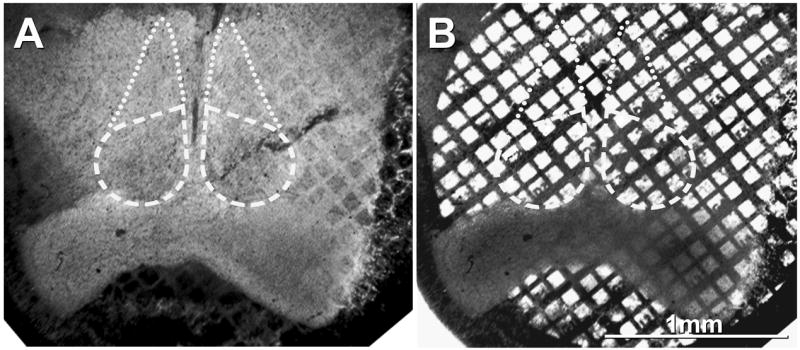
Confocal grid-map showing low-magnification immunofluorescence image (A) and bright-field image (B) of rat SCN on gold electron microscope “index” grid. All neuronal gap junctions found in this study were traced to their approximate locations on their respective photomaps and are plotted on a composite map as Figure 9.
Replica cleaning in SDS and immunogold labeling
After photomapping, grid-mapped replicas were washed for ca. 29 h at 48°–50°C in 2.5% SDS detergent and rinsed for 30–90 min in “labeling blocking buffer”, which consists of 1.5% fish gelatin digest and 10% heat inactivated goat serum (both from Sigma-Aldrich, St. Louis, MO) in SPB (Rash et al., 1989). Washed and blocking protein-treated replicas were immunogold labeled (Fujimoto, 1995; Rash and Yasumura, 1999; Furman et al., 2003) using 10 different affinity-purified antibodies to four different CNS connexins (Cx30, Cx32, Cx36 and Cx43; see Table 1). Goat anti-rabbit IgG conjugated to 10-nm and 20-nm gold beads was from Chemicon (Temecula, CA; no longer available), goat anti-rabbit IgG and goat anti-mouse IgG conjugated to the 6-nm, 12-nm, and 18-nm gold beads were from Jackson ImmunoResearch, and goat anti-rabbit IgG conjugated to 20-nm and 30-nm gold was from BBInternational, Ltd. (Ted Pella, Inc.). Controls included omission of primary antibodies to a target connexin, as well as double-labeling some replicas for one connexin plus one non-connexin membrane protein [e.g., NMDA receptors (Rash and Yasumura, 1999; Rash et al., 2001b, 2005) or aquaporin4 (AQP4) (Rash et al., 1998b; Furman et al., 2003)]. Labeled replicas were rinsed in distilled water, air dried at 60°C, and a stabilizing 20-nm coat of carbon was applied to the labeled side of the replica. The Lexan support film was removed by immersion of the labeled replicas in dichloroethane for 6–9 h.
A third control was initial “blind” examination of some replicas (i.e., without knowledge of the primary labels or sizes of secondary labels used for multiple connexins). A particular advantage of FRIL is that labeling specificity is assessed directly, based on restriction of immunogold labels to a single type of molecular array (e.g., gap junctions, tight junctions, postsynaptic densities, and AQP4 “square arrays”) in ultrastructurally-identified cells, and consistent absence of that label from any other specific ultrastructural feature (Fujimoto, 1995, 1997; Rash et al., 2004b). In typical samples with low background, the “signal-to-noise ratios” ranged from 1000:1 to 15,000:1 [for details, see (Meier et al., 2004; Rash et al., 2005)].
Electron Microscopy
Labeled replicas were examined at 100 kV in a JEOL 2000 EX-II TEM equipped with a ±60° tilting (“goniometer”) stage or in a JEOL 1200 EX TEM equipped with a ±45° tilting stage. Selected areas were photographed as stereoscopic pairs having an 8° included angle, and all images were analyzed stereoscopically. Viewing stereoscopic images, and more particularly, viewing reverse (or intaglio) stereoscopic images, was essential for discriminating 6-nm gold beads from replicated intramembrane particles (IMPs) and pits, which may be 6–10 nm, and of greater electron opacity than the 6-nm gold labels. Despite their low electron opacity, 6-nm gold beads were especially useful because they typically label at 2–8 times the labeling efficiency of progressively larger gold beads (10-, 12-, 18- and 20-nm) and, hence, may be used for semi-quantitative analysis of connexins (Rash and Yasumura, 1999; Rash et al., 2004b).
Criteria for identifying neurons and glia in freeze-fracture replicas
In FRIL replicas, neurons were identified based on 23 inclusive and exclusive criteria, as detailed previously (Rash et al., 1997). Astrocytes and their processes were identified by distinctive bundles of 10-nm “glial fibrillary acidic protein” (GFAP) filaments in their cytoplasms (but see cautionary note; Bushong et al., 2002), high density of intramembrane particles (IMPs) in both P-faces and E-faces, and by the presence of AQP4 “square arrays” in their plasma membrane P-faces and topographically “complementary” (Steere and Moseley, 1969; Challcroft and Bullivant, 1970) square arrays of pits in their plasma membrane E-faces (Landis and Reese, 1974; Rash et al., 1998b, 2004a; Furman et al., 2003). This report uses the internationally-recognized terminology for describing membrane faces in freeze-fracture replicas (Branton et al., 1975), wherein newly-cleaved and replicated “protoplasmic” fracture faces are designated by the mnemonic “P-face” and the newly-created “extraplasmic” leaflets (extracellular, extranuclear, extramitochondrial) are designated “E-faces”.
Oligodendrocyte plasma membranes were identified by low density of particles in both P- and E-faces, extended areas of particle-free membrane patches (particularly in myelin), “reciprocal patches” of mixed IMPs and pits on both E- and P-faces, and by sharing gap junctions with astrocytes (Mugnaini, 1986; Rash et al., 1997), particularly on the outermost myelin layer and at everted paranodal loops (Kamasawa et al., 2005). Ependymocytes were identified by their columnar morphology, abundant apical cilia and microvilli (both of which projected into the lumen of the third ventricle), and by abundant gap junctions on their lateral and basal plasma membranes.
Criteria for identifying gap junctions in freeze-fracture replicas
Gap junctions were identified based on well-established criteria [(Brightman and Reese, 1969; Sloper, 1972; Berdan et al., 1987; Rash et al., 1997); reviewed in Rash et al., (1998a)], including: a) uniform 8–9 nm diameter intramembrane particles in their P-faces and uniform 8–9 nm diameter pits in their E-faces; b) close packing of IMPs/pits, often in regular hexagonal array; c) maintained alignment of the rows of IMPs and pits across the step from E- to P-face within the gap junction; and d) narrowing of the extracellular space from 10–20 nm to 2–3 nm within the border of those gap junctions in which both P- and E-faces were exposed. For additional criteria, see Kamasawa et al., (2006). Within gap junctions, P-face connexon IMPs are of uniform 9-nm diameter, which is noticeably larger than virtually all other IMPs in the nearby plasma membrane P-face. Connexon E-face pits are equally distinct, making even small clusters of connexon P-face particles and E-face pits easily identifiable by their size and 10-nm center-to-center spacing (Gilula et al., 1972; Raviola and Gilula, 1975; Raviola et al., 1980; Rash et al., 1996; Meier et al., 2004).
Electrophysiology
Male Sprague Dawley rats and B6CBAF1/J mice were maintained at a temperature of 22 C with a 12-h light/dark cycle and with access to water and food ad libitum. At ZT=2:00–4:00, mice and rats (P21-P45) were anesthetized with halothane and euthanized by decapitation. The brain was rapidly removed and immersed in ice-cold oxygenated (95% O2/5% CO2) artificial cerebrospinal fluid containing: 124 mM NaCl, 24 mM NaHCO3, 1.25 mM NaH2PO4, 3 mM KCl, 2.5 mM CaCl2, 2 mM MgSO4, and 10 mM dextrose. Coronal slices (300 μm) containing the SCN were cut on a Vibratome and then transferred to a holding chamber oxygenated at 32°C and allowed to recover for 1 h. Individual brain slices were placed in a submerged recording chamber and continuously perfused (2 ml/min) with oxygenated artificial cerebrospinal fluid at 32°C. Neurons were visualized with an upright microscope (Nikon, E600FN) equipped with a 40X water-immersion objective and infrared differential interference contrast optics. Somatic recordings were made with microelectrodes (2–5 MΩ) pulled from glass (KG-33) capillary tubing (1.65 mm OD, 1.20 mm ID, Garner Glass, Claremont, CA) on a Flaming-Brown microelectrode puller (Sutter Instruments). The patch pipette solution contained: 130 mM K+-gluconate, 10 mM HEPES, 1 mM NaCl, 1 mM CaCl2, 5 mM EGTA, 2 mM ATP, 0.5% Neurobiotin, pH adjusted to 7.2–7.3 with KOH. For some recordings, QX-314 [N-(2,6-dimethylphenylcarbamoylmethyl)triethylammonium bromide; 5 mM] was added to the pipette solution. To block fast synaptic transmission, D,L-2-amino-5-phosphonovaleric (AP-5; 50 μM), 6,7-dinitroquinoxaline (DNQX; 20 μM; Sigma), and bicuculline methiodide (BIC; 30 μM) were added to the bath.
Functional connections between pairs of neurons from the SCN were assessed with dual patch-clamp recording techniques. Simultaneous cell-attached and whole-cell recordings from neuronal pairs were performed using two Axopatch 1 D amplifiers (Axon Instruments, Foster City, CA). The data were low-pass filtered at 2 kHz, digitized at 10 kHz and stored on-line using PCLAMP 8.1 software (Axon Instruments, Foster City, CA). The following criteria were used to accept a recording: the series resistance was <20 MΩ, input resistance was >500 MΩ, resting membrane potential was >–40 mV, and overshooting action potentials were present. Dual recordings were performed on pairs of neurons whose somata were separated by 0–30 μm. Mini-Analysis software (Synaptosoft, Inc., Decatur, GA) was used to detect spikes and calculate the cross-correlograms for paired spike trains ranging from 10–15 min in duration.
For the tracer coupling experiments, neurobiotin (Kita and Armstrong, 1991) (Vector Laboratories, Burlingame, CA) was injected into cells with 1 nA depolarizing pulses (100 ms at 5 Hz). After 20 min, the slices were removed from the recording chamber and fixed overnight in 10% buffered formalin at 4°C. Slices were rinsed several times with PBS, treated with H2O2 (3%) to block endogenous peroxidase activity, incubated in an avidin-biotin complex (Vector Laboratories, Burlingame, CA; 1:500) with Triton X-100 (0.1%) for 4–6 h at room temperature, and reacted with 3,3′-diaminobenzidene tetrahydrochloride. A total of 58 cells were injected, and 30 neurobiotin-labeled neurons were recovered. To control for non-specific staining, neurobiotin-filled electrodes were randomly placed in separate slices containing the SCN, and the same injection and histological procedures were performed. The non-specific staining procedure did not result in any labeled neurons (from n=5).
RESULTS
LM immunocytochemical localization of Cx36 vs. Cx32
Immunofluorescence labeling of Cx36 in adult mouse SCN is shown in Figure 2. Although the paired suprachiasmatic nuclei are readily identifiable by dark-field illumination of unstained sections, and by their anatomical proximity to the optic chiasm (ventrally) and third ventricle (medially), some sections were Nissl-stained with red fluorochrome to aid delineation of the SCN borders (Figs. 2A,B). Analysis of immunolabeling for Cx36 at various rostro-caudal areas of the SCN in fields comparable to that shown in Figure 2B, including caudal (Fig. 2C), midlevel (Fig. 2D) and rostral levels (Fig. 2E), revealed fine Cx36-positive puncta throughout the SCN. Although not mapped quantitatively, dorsal and particularly dorso-medial regions contained slightly higher densities of puncta as compared with other areas; illustrated at posterior and anterior levels (Figs. 2C,E). Overall, immunopositive puncta were generally much smaller and were present in substantially lower density than in retina, inferior olivary nucleus, reticular thalamic nucleus and basomedial nucleus of the amygdala (Li et al., 2004; Rash et al., 2004b; Kamasawa et al., 2006), but were comparable in numbers to those observed in hippocampus and appeared several-fold greater than in cerebral cortex (Nagy, unpublished observations). Notably, the SCN contained a substantially greater density of Cx36-positive puncta than surrounding hypothalamic areas, and this feature alone was sufficient to distinguish SCN from surrounding tissue (Fig. 2E). Similar densities and consistent patterns of labeling were observed in all animals examined using three different anti-Cx36 antibodies, including Ab36-4600 (Fig. 2), Ab51-6300 (not shown) and Ab37-4600 (not shown), and similar results were obtained with these antibodies in rats (not shown). Further, sections processed simultaneously from Cx36-knockout mice revealed an absence of Cx36 immunolabeling in the SCN (Fig. 2F) and in all other CNS regions examined. However, a few “speckles” were evident, similar to the numbers present after omission of primary antibody in both normal and Cx36 knockout animals, and these may represent artifactual deposits of clumped secondary antibody (Rash and Yasumura, 1999; Kamasawa et al., 2006).
Fig. 2.

Immunofluorescence labeling of Cx36 in the SCN of adult mouse. (A) Low magnification bilateral view of Nissl-stained SCN. (B,C) Higher magnifications of the same field within a caudal level of the SCN Nissl-stained with red fluorochrome (B), and showing fine, punctate labeling for Cx36 (C). (D,E) Similar fields of the SCN as in B, showing punctate immunolabeling for Cx36 at midlevel through the nucleus (D) and at a rostral level (E). (F): Similar field of the SCN as in B and C, except from a Cx36 knockout mouse showing an absence of immunofluorescence puncta. (G,H) Confocal immunofluorescence showing Cx36-positive puncta in a z-stack of 10 sections through 6 μm of the SCN, and higher magnification of a cluster of puncta in the dorso-medial region of the SCN. Scale bars: A, 100 μm; B–F, 100 μm (shown in F); G,H, 10 μm.
Distribution of Cx36 in the SCN is shown by confocal immunofluorescence microscopy at low magnification in a 6-μm thick z-stack (Fig. 2G) and at higher magnification in a single scan (Fig. 2H). Labeling of Cx36 appeared as either fine or coarse puncta, which were organized in random arrays or in short, linear patterns. Variations in size of Cx36-immunopositive puncta and their occasional accumulation in clusters were particularly evident at higher magnification (Fig. 2H). The number of puncta that were present within the confines of the SCN in 6-μm z-stacks measuring 118 μm × 118 μm from four different mice yielded a mean of 204 puncta (± 35, SEM) per SCN z-stack. Based on a measured volume of 2.47×107 μm3 per SCN nucleus in both P6 and P30 mice (Herzog et al., 2000), we estimate that there are ca. 120,000 Cx36-immunoreactive puncta in the ca. 16,000 neurons that comprise the paired SCN, or 7.5 immunofluorescence-detectable puncta per neuron (Fig. 2H).
FRIL localization of Cx36 but not Cx32 in neuronal gap junctions in adult SCN
In FRIL samples, we detected 12 neuronal gap junctions in adult (Figs. 3,4) and three neuronal gap junctions in P14 SCN (Fig. 5), all of which were labeled for Cx36, whereas Cx32 was found only in oligodendrocyte gap junctions (see below). In low- to high-magnification electron micrographs of a neuronal cell body in the ventro-medial portion of the SCN (Fig. 3), the somatic plasma membrane (boxed area in Fig. 3A), outer nuclear membrane (N) and cross-fractured cytoplasm (asterisk) are seen. Although there was minor separation of the replica from the Lexan/carbon support film, even those cracked and partially-disrupted ultrastructural features were maintained in position by the Lexan and secondary carbon support films. Stereoscopic examination of the replica and its continuous, underlying carbon support film allowed positive confirmation that this particular gap junction was on a neuronal cell body that was mapped to the ventro-medial aspect of the SCN. (For mapping, see below.) At higher magnification (Fig. 3B), a major portion of this large “reticular” gap junction is seen, with its 622 exposed connexons labeled by 60 18-nm gold beads [Labeling Efficiency (defined in Rash and Yasumura, 1999) of LE = 1:10]. Reticular gap junctions, such as this one, differ from “plaque” gap junctions in that reticular gap junctions have one or more relatively small internal patches of membrane that are devoid of connexons or connexon imprints. Immunogold labeling for Cx36 provided further confirmation of the ultrastructural identification of this cluster of 10-nm IMPs as a gap junction. Moreover, stereoscopic imaging (Fig. 3C) reveals that all gold labels are in the residual cytoplasm beneath the replica, where they label cytoplasmic epitopes of Cx36; and almost all gold beads are within the 28-nm “zone of potential labeling” (Kamasawa et al., 2006) for these tightly-aggregated IMPs (Fig. 3B, red overlay). In almost all cases, multiple gold beads for Cx36 were present in each neuronal gap junction. Because each gold bead acts as an independent label, each gold bead represents a separate confirmation of Cx36 in neuronal gap junctions.
Fig. 3.
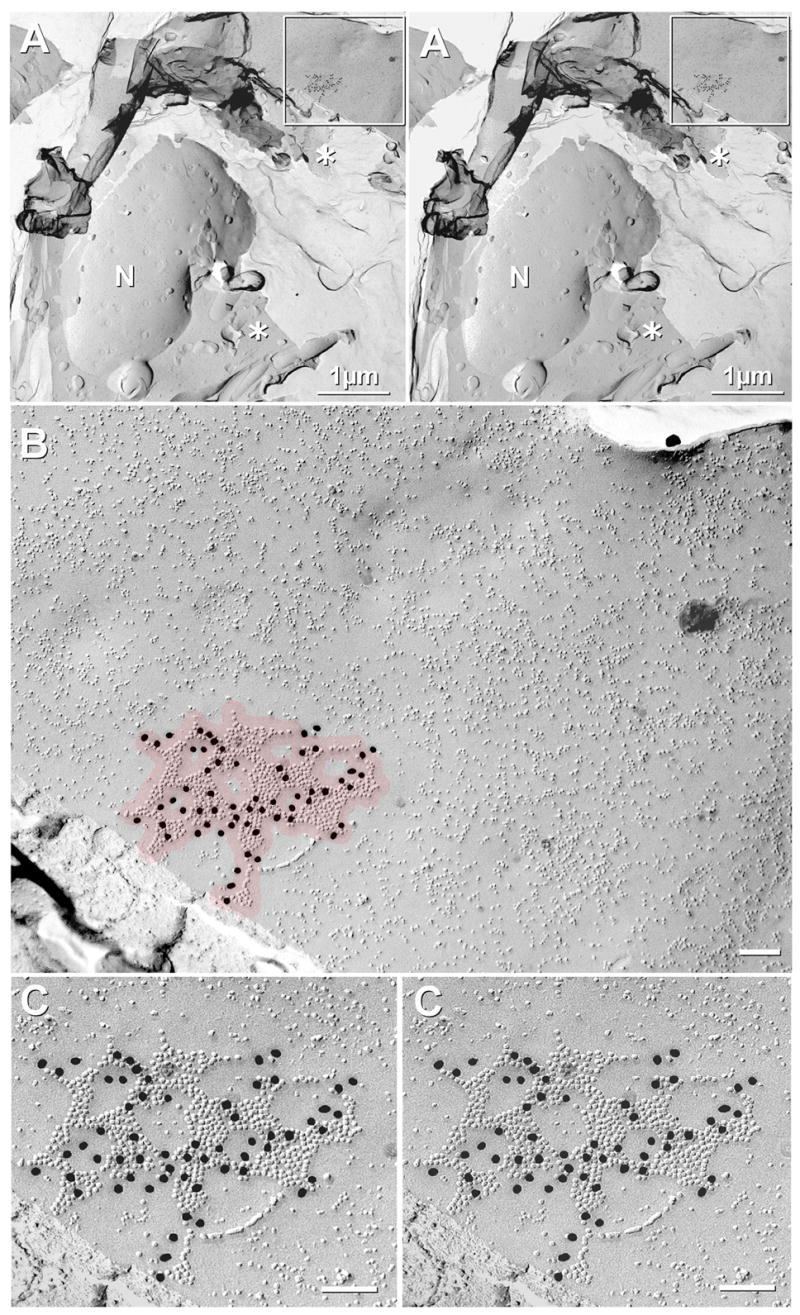
Low magnification to high magnification stereoscopic views of Cx36-labeled gap junction on plasma membrane of neuronal cell body in ventromedial aspect of SCN in a sample that was doubled-labeled for Cx36 (18-nm gold beads) and Cx32 (6 nm and 12 nm gold beads, none present in this image; but see Fig. 6C–E). (A) Stereoscopic image reveals the continuity of the cytoplasm (asterisk), as maintained by the secondary carbon support film applied before removal of the Lexan support layer (inset shown at higher magnification as B,C). The neuronal nucleus (N) has ca. 45 nuclear pores. (B) Overview of immunogold labeled “reticular” gap junction in broad expanse of neuronal plasma membrane. Red overlay indicates the 28-nm “zone of probable labeling” for connexons (Kamasawa et al., 2006). Note the absence of non-specific “background” labeling. Connexons are 9–10 nm, whereas other IMPs range from 4–8 nm in diameter. (C) High-magnification stereoscopic image of Cx36-labeled gap junction. Sixty gold beads label 622 connexons [Labeling efficiency, LE = 1:10 (Rash and Yasumura, 1999)]. N = nucleus; * = cytoplasm.
In this and subsequent FRIL electron micrographs, calibration bars are 0.1 μm, unless otherwise indicated.
Fig. 4.
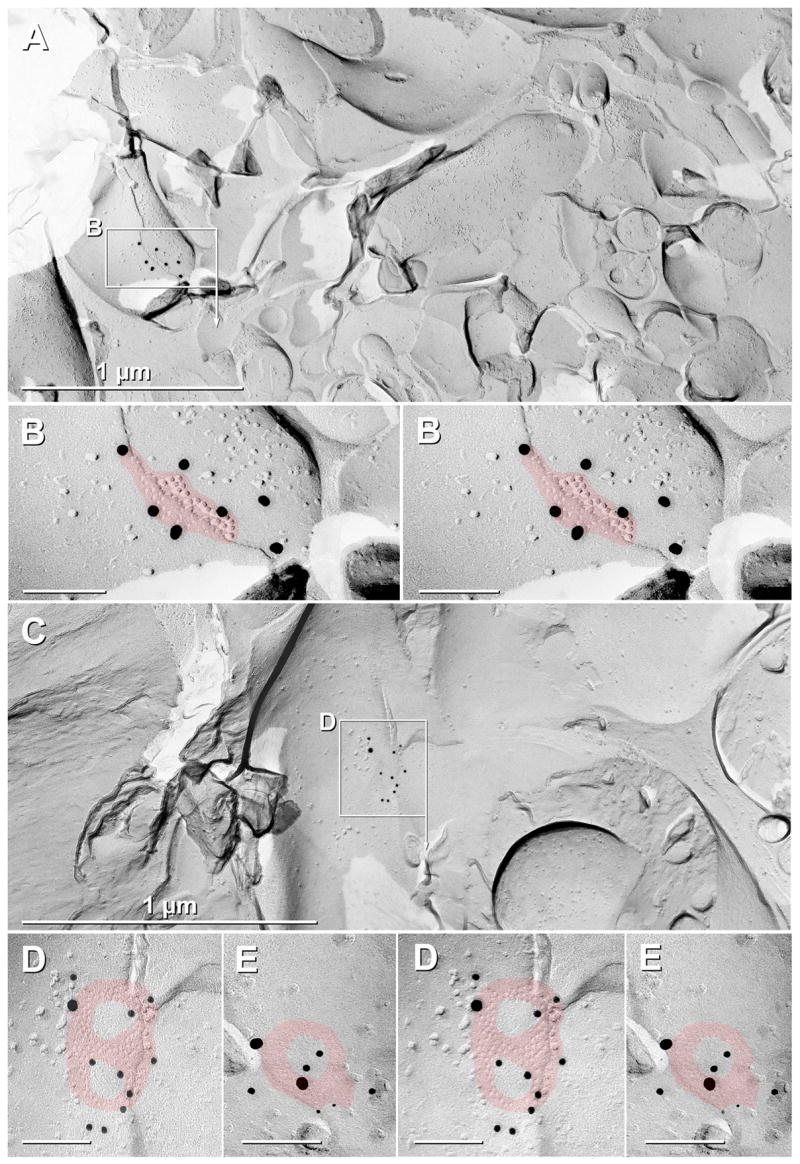
Examples of small “plaque” and “reticular” gap junctions in SCN after double-labeling for Cx36 and Cx32 (A–B), single labeling for Cx36 (C–D), and double-labeling for Cx36 (E). (A,B) A small “plaque-type” gap junction (B; red overlay; 45 connexons) is immunogold labeled by seven 18 nm gold beads. (C,D) Intermediate-size “figure-8” reticular gap junction linking an unidentified nerve terminal to a large dendrite in the SCN. At higher magnification (D), one 18 nm gold bead and 10 12 nm gold beads are discerned beneath the gap junction (red overlay; 84 connexons ). (E) The simplest of reticular gap junctions in SCN is seen as a closed circle or “0”. This gap junction (red overlay; 40 connexons) is labeled by two 18 nm gold beads, four 12 nm gold beads, and two 6 nm gold beads (arrows). 18 nm gold = Cx36 polyclonal antibody; 6 nm and 12 nm gold = Cx36 monoclonal antibody
Fig. 5.
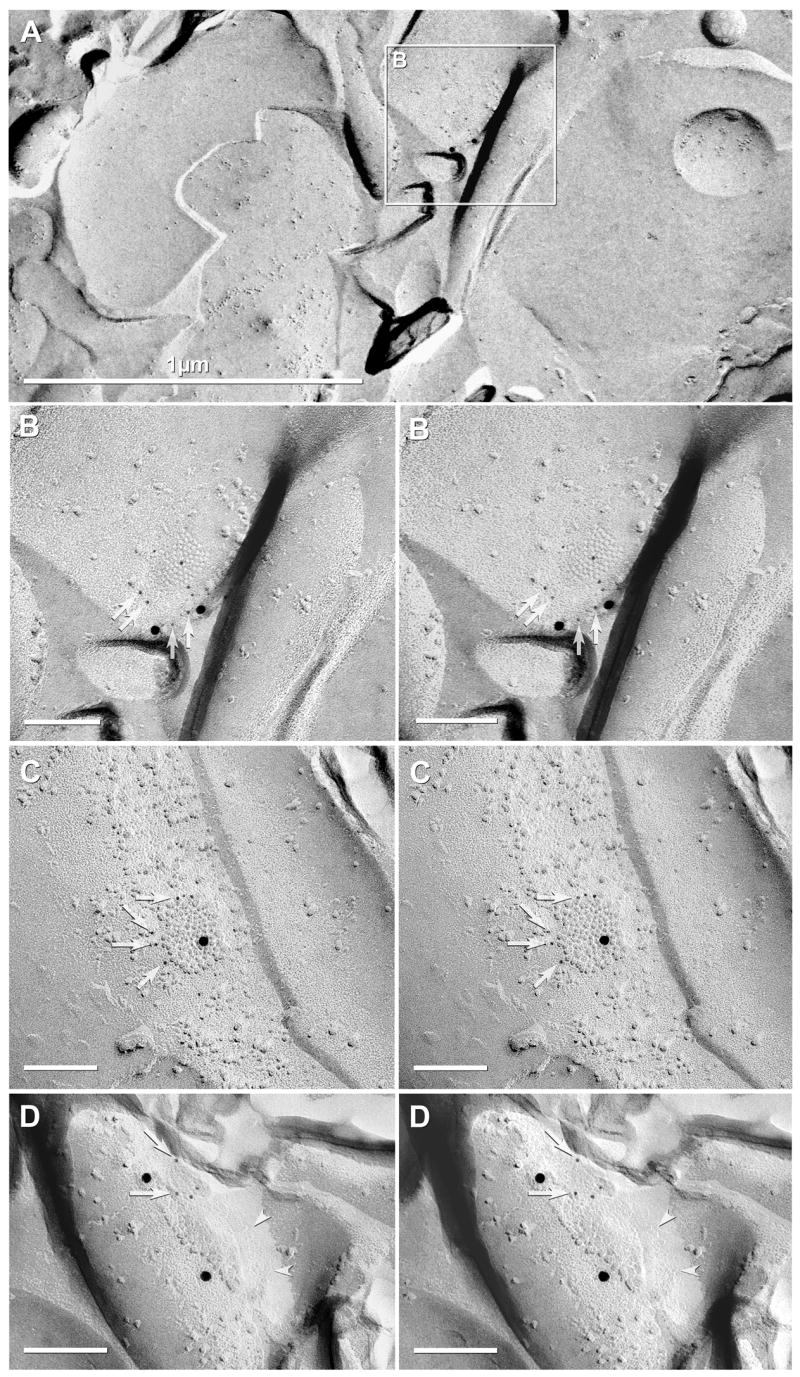
Two larger and one intermediate-size plaque gap junction in P14 rat SCN double-labeled for Cx32 (none present) and Cx36. (A–B) Single intermediate-size plaque gap junction (65 connexons) labeled for Cx36 by nine 6-nm gold beads (arrows) and two 18-nm gold beads. (C) Slightly larger neuronal gap junction with 123 connexons labeled by seven 6-nm gold beads (arrows) and one 18-nm gold bead. (D) Neuronal gap junction with ca. 199 connexons labeled by four 6-nm gold beads (arrows) and two 18-nm gold beads. Because of the low local angle of shadow, more than half the connexons were not shadowed with platinum but are faintly delineated by the primary carbon coat, as discerned by stereoscopic viewing (C–D). The edge of gap junction is indicated by arrowheads. The number of connexons was calculated based on area of gap junction and 10-nm spacing in plaque gap junctions (Kamasawa et al., 2006).
Eleven additional Cx36-labeled neuronal gap junctions were found in adult SCN, all on dendrites (Fig. 4). Adult gap junctions included three small reticular gap junctions (Fig. 4D–E), six small plaque gap junctions (Fig. 4B), one small “string” gap junction (not shown), and one small “meandering” gap junction (not shown). (For classification of gap junction morphologies in neurons, see Kamasawa et al., 2006). Overall in adult SCN, 92% (11/12) of labeled neuronal gap junctions had fewer than 100 connexons and 75% (9/12) contained fewer than 50 connexons. In contrast, two of the three plaque gap junctions found in a single replica of P14 SCN were larger than 100 connexons (Fig. 5), consistent with previous reports of relatively stronger coupling of immature neurons (Fulton et al., 1980; Walton and Navarette, 1991).
As a separate verification of Cx36 in neuronal gap junctions, one sample was double-labeled using both monoclonal and polyclonal antibodies to Cx36. Two sizes of gold beads for monoclonal anti-Cx36 (6-nm and 12-nm gold) and one size (18-nm gold beads) for polyclonal anti-Cx36 (Fig. 4E) provided for independent verification of antibody labeling specificity within individual gap junctions.
In the same Cx36/Cx32 double-labeled replica of adult SCN as shown in Figures 3 and 4A–B, Cx32 (6-nm and 12-nm gold beads) was not detectable in any of those same neuronal gap junctions, but Cx32 was found in nearby oligodendrocyte gap junctions (see below), thereby separately demonstrating: a) that Cx32 is not a primary (or detectable) component of neuronal gap junctions in SCN, and b) that absence of Cx32 in neuronal gap junctions cannot be attributed to “false negatives” due to inactive primary or secondary labels. In addition, Cx32 was not present in any of three Cx36-immunogold-labeled plaque gap junctions in the P14 rat SCN (Fig. 5) that had been double labeled for Cx36 and Cx32. Overall, Cx32 was not detected in any neuronal gap junctions in this or any other replicas, including an additional four replicas that had been single-labeled for Cx32 or double-labeled for Cx32 plus other connexins or other membrane proteins (e.g., Cx43 or AQP4).
LM immunocytochemical localization of Cx32
In sections double-labeled for Cx32 and the oligodendrocyte marker CNPase, the SCN was readily distinguished from surrounding hypothalamic regions by its conspicuously low density of CNPase-positive structures, whereas adjacent areas contained numerous immunopositive cell bodies and dense labeling of myelinated fiber bundles (Fig. 6A1). Labeling for Cx32 was sparse within the SCN, whereas surrounding areas displayed a moderate distribution of Cx32-positive cell bodies (Fig. 6A2), which were identified as oligodendrocyte somata based on their co-labeling with CNPase (Fig. 6A3). Labeling for Cx32 within SCN, although rare, was invariably associated with CNPase-positive elements, including both oligodendrocyte somata and fibers (Fig. 6B).
Fig. 6.

Immunofluorescence and FRIL localization of Cx32 in the SCN and adjacent hypothalamic areas of adult mouse. (A,B) Borders of the SCN are outlined by white line at low (A) and higher magnification (B). Double labeling in the same field shows sparse distribution of the oligodendrocyte marker CNPase (A1) and Cx32 (A2) within the SCN. Dense labeling for CNPase associated with myelinated fibers is evident outside the SCN (A1), and surrounding oligodendrocyte somata are immunopositive for both CNPase (A1, arrows) and Cx32 (A2, arrows), as seen in overlay (A3, arrows). CNPase-positive oligodendrocyte somata are infrequently seen within the SCN (B1, arrowheads), and these are also immunolabeled for Cx32 (B2, arrowheads), as seen in overlay (B3, arrowheads). Scale bars, 100 μm in A,B. (C) FRIL image of Cx32-labeled gap junction on paranodal loops of myelin (C,D) and on outer surface of myelin (E) (all from same replica as Figure 3). Ax, axoplasm. 1,2,3,4 = numbered paranodal loops. High magnification stereoscopic views (D, left pair of images) and reverse stereoscopic images (D, right pair of images). Two sizes of immunogold beads for Cx32 [6-nm (arrows) and 12-nm] independently demonstrate the presence of Cx32 in paranodal gap junctions. (E) A small gap junction on the outer surface of myelin after double-labeling for Cx32 (one 12-nm gold bead present) plus Cx36 (18nm gold; none present). As implied by confocal microscopy (A–B), Cx32-containing gap junctions were extremely rare within the borders of the SCN. E = E-face; P = P-face.
FRIL localization of Cx32 to oligodendrocyte gap junctions in adult SCN
In five FRIL replicas from SCN labeled for Cx32 (three for Cx32+Cx36, one for Cx32+Cx43, and one for Cx32 only), immunogold beads for Cx32 were found only rarely, but always on oligodendrocyte gap junctions, consistent with observations from LM. Cx32 labeling was found in small gap junctions on oligodendrocyte somata [not shown, but see Kamasawa et al. (2005)], on paranodal loops of myelin (Fig. 6C,D; paranodal loops are numbered 1–4), and on the outer surface of myelin (Fig. 6E). Figures 6C,D provide further documentation of Cx32 in ultrastructurally-defined plaque gap junctions on paranodal loops of myelin in the vertebrate CNS (Kamasawa et al., 2005), confirming suggestions for the existence of Cx32 in paranodal loops based on light microscopic immunocytochemistry (Li et al., 1997; Balice-Gordon et al., 1998; Nagy et al., 2003a, 2003b, 2004). In high-magnification stereoscopic views (Fig. 6D, left pair of images), and particularly in the reverse stereoscopic images (Fig. 6D, right pair of images), two sizes of immunogold beads (6-nm and 12-nm) associated with labeling of Cx32, confirmed that Cx32 is present in these small gap junctions (Fig. 6D,E; green overlay). The use of two sizes of gold beads to label Cx32 provided additional confidence in specificity of labeling for this relatively low-abundance connexin in the SCN. However, the smaller gold beads were difficult to discern on the TEM viewscreen at 10,000X magnification examined with a 10X binocular viewer (equivalent to viewing at 100,000X), thereby requiring photography and viewing in high-magnification stereoscopic and reverse stereoscopic images to confirm their presence (Fig. 6D). Despite exhaustive searches in these replicas, gap junctions were not labeled for Cx32 in neurons, astrocytes or ependymocytes (see above).
LM localization of Cx43 and Cx30 in and near the SCN
Double-labeling for Cx43 and Cx30 revealed higher levels of these connexins in the SCN than in adjacent hypothalamic areas (Fig. 7A). Immunolabeling for both connexins was exclusively punctate, and was either randomly distributed or concentrated in patches, particularly in the case of Cx30 (Fig. 7A2,7A3). A distinct difference in labeling was evident in ependymal cells lining the third ventricle, where Cx43 was present at high density (Fig. 7A1) and Cx30 was nearly absent (Fig. 7A2). Although the degree of Cx30/Cx43 co-localization was difficult to discern at low magnification, confocal analysis indicated that nearly all of the Cx30-immunopositive puncta within the SCN, as shown near the ependymal layer, were also immunopositive for Cx43 but, conversely, most Cx43-positive puncta in the ependymal layer were not positive for Cx30 (Fig. 7B). However, minimal co-localization of a few small puncta occurred at the base of ependymocytes (Fig. 7B) – possibly at ependymocyte/astrocyte junctions, as found in conventional thin-section TEM images (Mugnaini, 1986; Rash et al., 1997).
Fig. 7.
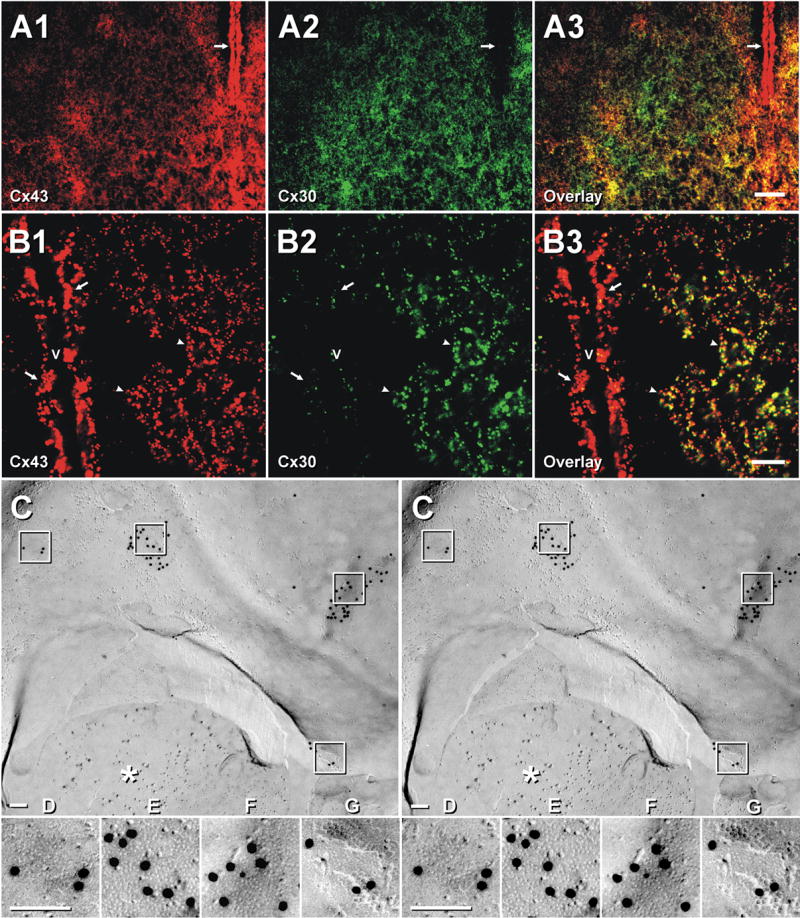
Immunofluorescence and FRIL labeling for Cx43 and Cx30 in the SCN and adjacent hypothalamic areas of adult mouse (A,B) and rat (C–G). Double labeling for Cx43 (A1) and Cx30 (A2) in a adult mouse SCN. Higher densities of Cx43- and Cx30-immunopositive puncta are seen within the SCN than in adjacent hypothalamic areas (A1–A3). Ependymal cells lining the third ventricle contain abundant Cx43 (A1 arrow) but lack Cx30 (A2, arrow). (B) Confocal immunofluorescence of the SCN showing co-localization of Cx43 (B1, arrowheads) and Cx30 (B2, arrowheads) as seen in overlay (B3, arrowheads). Ependymal cells are intensely labeled for Cx43 (B1, arrows) but are sparsely labeled for Cx30 adjacent to neuropil (B2, arrows). v, third ventricle. Scale bars: A, 50 μm; B, 10 μm. (C–G) Oligodendrocyte-to-astrocyte gap junctions in FRIL replica of SCN after immunogold labeling for Cx43 (20-nm gold beads) and AQP4 (10-nm gold beads). asterisk = GFAP filaments in astrocyte cytoplasm. Oligodendrocyte plasma membrane E-face has four gap junctions, portions of which are inscribed and shown in higher magnification stereoscopic images (D–G), which reveals the characteristic close spacing of E-face connexon pits. One gap junction (G) reveals the fracture step from oligodendrocyte E-face to astrocyte P-face. All E-face labeling of gap junctions is to cytoplasmic determinants of connexons in the underlying astrocyte plasma membrane (Massa and Mugnaini, 1982; Mugnaini, 1986; Rash et al., 1997, 2001b).
FRIL localization of Cx43 in the astrocyte-side of oligodendrocyte/astrocyte gap junctions
Astrocyte/astrocyte and oligodendrocyte/astrocyte gap junctions identified in FRIL replicas of SCN were almost always immunogold labeled for Cx43 (Fig. 7C–G). Astrocyte processes were identified by the presence of GFAP filaments in their cytoplasms (Fig. 7C, asterisk) and by the presence of AQP4 square arrays (not shown) in their plasma membranes (Rash et al., 1998b, 2004a; Furman et al., 2003). Oligodendrocyte plasma membranes were characterized by the presence of one or more gap junctions that were surrounded by discontinuous rows of E-face IMPs (Fig. 7F) that we previously designated as oligodendrocyte-specific “lariats” (Rash et al., 1997). In this small portion of oligodendrocyte plasma membrane, four oligodendrocyte-to-astrocyte gap junctions are present, and portions of each (boxes) are shown at higher magnification to reveal the characteristic irregular close spacing of E-face pits (Fig. 7D–G). In addition, where the fracture plane stepped from oligodendrocyte E-face to astrocyte P-face (Fig. 7G), the extracellular space was narrowed to 3 nm. When viewed from oligodendrocyte toward the underlying astrocyte, the gap junction oligodendrocyte E-faces and astrocyte P-faces were labeled for Cx43, as previously demonstrated in other CNS regions (Rash et al., 2001b)
Co-localization of Cx43 and Cx30 in astrocyte gap junctions; only Cx43 in ependymocyte gap junctions
In FRIL replicas, ependymocytes were positively identified by their anatomical location (see Fig. 1A), as well as by the presence of numerous cilia and microvilli on their apical surfaces (Fig. 8A), a few AQP4 square arrays in their plasma membranes (Rash et al., 1998b), and bundles of 10-nm GFAP-like filaments in their cytoplasms (Rash et al., 1998b). In SCN samples labeled for Cx43 and AQP4, gap junctions linking lateral margins of ependymocytes were abundant, and almost all of those were well labeled for Cx43 (Fig. 8A,B). In samples double-labeled for Cx43+Cx30, ependymocyte/ependymocyte gap junctions were labeled only for Cx43, but not for Cx30 (Fig. 8C), whereas gap junctions between nearby astrocytes were usually labeled for both Cx43 and Cx30 (Fig. 8D). In astrocyte/astrocyte gap junctions, labeling for Cx30 was robust, sometimes exceeding labeling for Cx43 (Fig. 8D). When cross-fractured, astrocytes were often identified by distinctive glial fibrillary acidic protein (GFAP) filaments in their cytoplasms (Fig. 8E, G) and by labeling of their gap junctions for Cx43 (Fig. 8E, 10-nm gold beads).
Fig. 8.
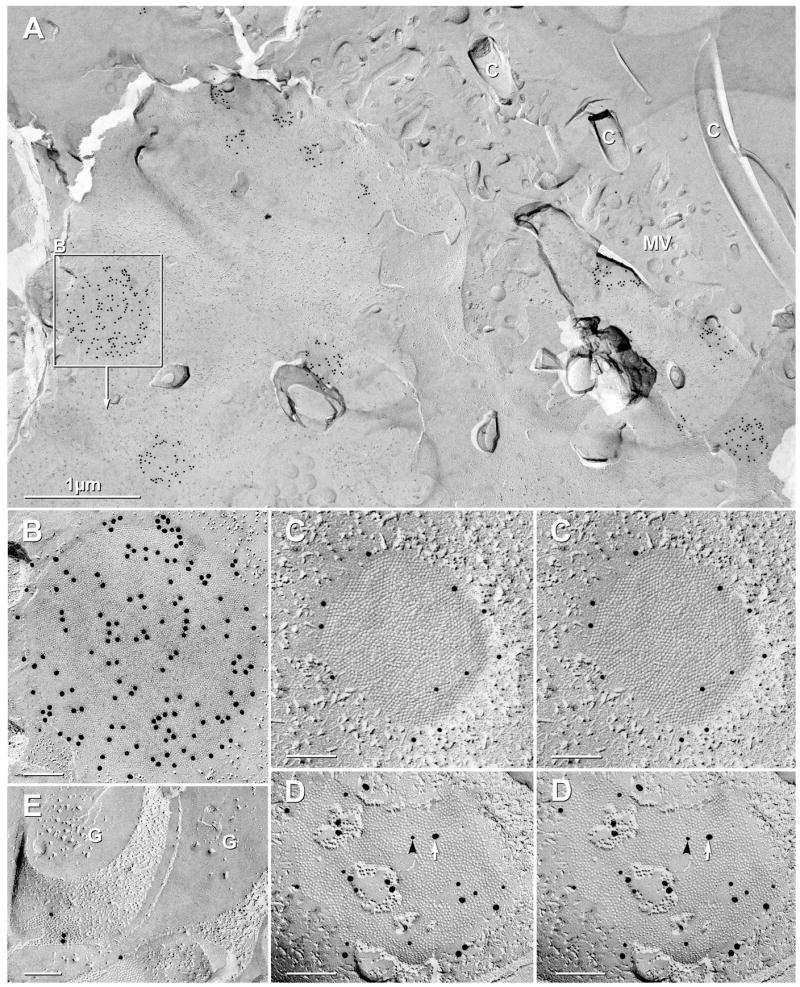
Ependymocyte and astrocyte gap junctions labeled for Cx43 vs. Cx30. (A,B) In a small area of a FRIL sample double-labeled for Cx43 (20-nm gold) and AQP4 (10-nm gold beads), 16 gap junctions linking lateral margins of ependymocytes were well labeled for Cx43. C = cilia; MV = microvilli. Inscribed area shown at higher magnification as (B). (B) Ependymocyte gap junction E-face heavily labeled for Cx43. (C–D) In stereoscopic images of ependymocyte-to-ependymocyte gap junctions double-labeled for Cx43 and Cx30, gap junctions were labeled only for Cx43 (C; 10-nm gold) but not for Cx30 (20-nm gold; none present), whereas gap junctions between astrocytes (D) were labeled for both Cx43 (10-nm gold, black arrowhead) and Cx30 (20-nm gold, white arrow). (E) Sub-ependymal astrocyte gap junction labeled for Cx43. From the same sample as Fig. 7C and 8A–B. G = GFAP filaments in astrocyte cytoplasm.
Fig. 10.

Spikelets occurred spontaneously in SCN neurons. (A) Representative patch clamp recordings of spontaneous firing from SCN neurons in the presence of DNQX (20 μM), AP-5 (50 μM), and BIC (30 μm). Action potentials recorded from an SCN neuron at low gain (A1) and after time scale expansion at higher gain (A2) were associated with fast spikelets (0.7 mV, 6 ms), which were often seen on the rising phase of the action potential (arrows). (B) Comparison of spikelets and excitatory postsynaptic potentials (EPSPs). The spikelets recorded from SCN neurons were often biphasic (B1; averaged responses, n=25), but could appear relatively monophasic (B2; averaged responses, n=25), while EPSPs were monophasic (B3; averaged responses, n=25, recorded in the presence of BIC [30 μM] without DNQX and AP-5).
Overall, more than 500 Cx43-labeled astrocyte and ependymocyte gap junctions were examined in SCN samples, and more than 250 were photographed. In contrast, no examples of Cx43-labeled neuronal gap junctions were encountered, nor were examples of astrocyte/neuron gap junctions observed, either labeled or unlabeled. In addition, no ependymocyte gap junctions contained Cx30, Cx32 or Cx36.
FRIL mapping of connexins
The location of each neuronal and glial gap junction was plotted on a representative confocal photomap of one of the specimens. In a composite photomap of one FRIL sample (Fig. 9), 15 locations containing neuronal gap junctions are indicated, 12 in adult SCN, including three in the subparaventricular output zone of the SCN (Saper et al., 2005). The left side contains locations of five Cx36-labeled neuronal gap junctions and two Cx32-labeled oligodendrocyte gap junctions found in a single Cx32+Cx36 double-labeled replica. (The asterisk designates the only gap junction found on a neuron cell body; from Fig. 3.) The low number of Cx32 immunofluorescent puncta seen by confocal microscopy (Figs. 6A,B) is reflected in the difficulty in detecting Cx32-containing gap junctions by FRIL. The right side of the map shows the locations of the remaining 10 Cx36-labeled gap junctions (red dots and red triangles), one Cx32-labeled oligodendrocyte gap junctions (green dot), one Cx43-labeled astrocyte gap junction (blue dot) and one Cx43-labeled ependymocyte gap junction (blue dot on 3rd ventricle). Unmapped are >50 Cx43-labeled ependymocyte gap junctions, >200 Cx43-labeled astrocyte gap junctions, and more than a dozen Cx43/Cx30 double-labeled astrocyte gap junctions. Many additional examples of labeled astrocyte gap junctions were found but not photographed because they were essentially confirmatory and did not constitute exceptions to the labeling patterns reported here and elsewhere (Rash et al., 2001b).
Fig. 9.

Composite confocal grid map of Cx36-labeled gap junctions on photomapped SCNs, including one on neuronal cell body (red asterisk) and 11 on dendrites (red dots) of adult, plus three on dendrites of P14 (red triangles). Left side of image illustrates locations of gap junctions in a single replica that was double-labeled for Cx36 plus Cx32 (red asterisk, Fig. 3; and red dots, from Figs. 4A–B designate neuronal gap junctions; green dots designate oligodendrocyte gap junctions, from Fig. 6C–E). Right side of image presents data compiled from five replicas from adult and one replica from P14. Red triangles = neuronal gap junctions from P14, Fig. 5; blue dots = astrocyte gap junctions (lower blue dot, Fig. 8E) and ependymocyte gap junctions (upper blue dot, Fig. 8A,B); dashed lines = SCN; dotted lines = subparaventricular extension of the SCN (Saper et al., 2005).
Tracer coupling with Neurobiotin
To test for tracer coupling in the SCN, whole-cell patch clamp recordings made under visual control were obtained from single SCN neurons. The tracer, Neurobiotin (286 Da, Kita and Armstrong, 1991), was injected by intermittent depolarizing pulses over time periods ranging from 5–60 min. Of the 58 SCN neurons injected, 28 tracer-stained single SCN neurons were recovered, 29 were not successfully contrasted, and only one example of two neurons showed evidence for tracer coupling after injection of a single SCN neuron (not shown because tracer coupling was seen only once). In contrast to SCN neurons, injection of a single astrocyte using the same technique resulted in the labeling of a large population of cells within the SCN (not shown).
Electrophysiology
To test for electrical coupling in the SCN, patch clamp recordings were performed on single neurons or pairs of neurons. Fast synaptic transmission was blocked by the glutamate receptor antagonists, DNQX (20 μM) and AP-5 (50 μM), and the GABAA receptor antagonist, BIC (30 μM). Spikelets occurred spontaneously but not synchronously in 48% of the paired recordings (n=12/25) under conditions when synaptic transmission was blocked (Fig. 10A2 and 10B1–2). Spikelets could precede (Fig. 10A) or follow action potentials, and they were also present at hyperpolarized potentials (−60 to −80 mV). While the amplitude of spikelets varied from <0.5 mV to 2 mV and their durations from 2 to12 ms, the waveform of the spikelets was either monophasic or biphasic (Fig. 10B1–2), and was appreciably different from the waveform of excitatory postsynaptic potentials (EPSPs; Fig. 10B3). Therefore, as previously reported, almost half of SCN neurons exhibited spontaneous spikelets (Wheal and Thomson, 1984; Kim and Dudek, 1992).
The criteria to detect spikelets in our experiments were the same as has been used in other electrophysiology studies on spikelets or partial spikes, namely, a much faster rise than decay time, and a much faster decay time than for a typical EPSP, which decays at approximately the membrane time constant. In particular, Fig. 10 (compare the spikelets in B1 and B2 vs. the EPSP in B3) shows that the EPSPs have a much slower decay than the spikelets (i.e., on the order of 10’s of milliseconds versus a few milliseconds). The data were averaged to enhance the signal-to-noise ratio. A biphasic spikelet presumably derives from an action potential with a large-amplitude hyperpolarizing afterpotential, while a monophasic spikelet is presumed to arise from an action potential with a small or non-existent hyperpolarizing afterpotential.
Spikelets are thought to represent either the attenuated transmission of an action potential from an electrically coupled neuron (MacVicar and Dudek, 1981) or ectopic action potentials generated distally in the dendrite or axon (e.g., Eyzaguirre and Kuffler, 1955; Spencer and Kandel, 1961). To investigate the possibility that spikelets were mediated by sodium spikes propagating from compartments within the recorded cell, we performed whole-cell recordings from single SCN neurons with the sodium channel blocker, QX-314, in the pipette solution (n=6). Within a minute after rupturing the membrane and obtaining a whole-cell recording, QX-314 progressively eliminated spontaneous and evoked action potentials (Fig. 11A). In the presence of QX-314 in the recorded cells, spikelets could still be recorded from SCN neurons (Fig. 11B1); and increasing the excitability of the network by the application of the potassium channel blocker 4-AP (500 μM) increased the frequency and amplitude of the spikelets (not shown). In contrast, bath application of tetrodotoxin (1 μM) blocked the spikelets (Fig. 11B2).
Fig. 11.

Spikelets recorded in the presence of the sodium channel blocker, QX-314, in the patch pipette. (A) Action potentials from the recorded cell (A1) were eliminated with QX-314 (5 mM, A2) in the patch pipette. This trace was the first response to depolarizing current after obtaining the whole-cell recording (i.e., thus, no pre-baseline), and the last response with action potentials. (B) In the presence of QX-314 and low concentrations of 4-AP (500 μM), spikelets (arrows) were clearly detectable from the noise (B2) and were suppressed by bath application of tetrodotoxin (1 μM, B2). Membrane potential was held at −70 mV.
To test for direct electrical interactions, hyperpolarizing current pulses of various intensities and durations were injected into SCN neurons, and the recordings were examined for direct current flow between pairs. Cells were tested for electrotonic coupling by using both low- and high-amplitude current injections (i.e., current injections that gave small voltage changes and changes of up to 150 mV) at both short and long durations. We did not detect any damage to the recorded neurons during the strong current injections, and we found no evidence of reciprocal voltage responses in any of the pairs (Figs. 12A,B; n=15). Thus, no evidence for electrotonic coupling was seen in paired recordings, even though we estimate that coupling with a coefficient as low as 0.01 could have been detected in these paired recordings.
Fig. 12.

The absence of detectable electrotonic coupling in paired recordings from SCN neurons. (A) Cell 1 (top of panel) was injected with negative current pulses of various intensities (1–4) and the voltage responses recorded from cell 2 (i.e., the four traces at the bottom of the panel; 1–4) are shown as single sweeps corresponding to the four negative current pulses above. (B) Cell 1 was injected with negative current pulses of long duration (1 nA, 600 msec), but no post-junctional voltage deflection was recorded in cell 2 (i.e., lack of evidence for electrotonic coupling between this pair). However, spontaneous spikelets were recorded from cell 2, presumably arising from coupling between cell 2 and a third cell.
Dual cell-attached (n=7) and whole-cell recordings (n=25) from pairs of SCN neurons were performed to determine the synchrony of spike activity (Fig. 13A,B). The rate of firing was controlled by tonic current passage. Cross-correlation analysis of the sodium spike activity of neighboring SCN neurons revealed no peak at time 0, indicating that the spike activity was asynchronous. In neural networks, electrical coupling can function as a low-pass filter. Thus, our ability to detect synchronized firing may have been influenced by the attenuation of the fast sodium spike in the coupled neuron. We tested whether broadening the presynaptic spike would promote synchrony between SCN neuronal pairs. Bath application of 4-AP (2.5 mM) prolonged the duration of the sodium spike and initiated a complex burst pattern consisting of sodium- and calcium-mediated spikes. However, cross-correlograms of spike activity in the presence of 4-AP also did not reveal a peak, indicating that neither the prolonged sodium spikes nor the calcium spikes were synchronized (Fig. 13C; n=14).
Fig. 13.

Simultaneous patch-clamp recordings of spike activity from pairs of SCN neurons. The bath contained DNQX (20 μM), APV (50 μM), BIC (30 μM) to block fast synaptic transmission, and firing rate was adjusted to 4–10 Hz. (A) Cell-attached recordings of extracellular spike activity recorded from a pair of SCN neurons (upper trace cell 1, bottom trace cell 2) and the corresponding cross-correlogram (bin width, 20 ms). (B) Whole-cell recordings of sodium spikes recorded from a pair of SCN neurons (upper trace cell 1, bottom trace cell 2) and the corresponding cross-correlogram (bin width, 20 ms). (C) Whole-cell recordings of sodium and calcium spikes recorded in the presence of 4-AP from a pair of SCN neurons (upper trace cell 1, bottom trace cell 2) and the corresponding cross-correlogram (bin width, 20 ms). Cross-correlation analysis in A, B and C indicated asynchronous spike activity.
DISCUSSION
This report provides the first ultrastructural evidence for neuronal gap junctions in the SCN, the first immunocytochemical evidence that these neuronal gap junctions are composed of Cx36, and immunocytochemical and FRIL evidence that SCN neuronal gap junctions do not contain Cx32, as had been suggested (Colwell, 2000). We show that neuronal gap junctions in SCN were present in two major classes – a few large “conventional” gap junctions vs. more abundant miniature (“mini”) gap junctions, most of which were smaller than 50 connexons. Our data also support the hypothesis of cell-type-specific expression of the other three connexins tested, with Cx32 confined to oligodendrocyte gap junctions; Cx30 and Cx43 in astrocyte gap junctions; and Cx43 (but none of the other connexins) in ependymocyte junctions, extending similar data from other regions of the CNS (Rash et al., 2001a, 2001b; Nagy et al., 2003a., 2003b, 2004; Kamasawa et al., 2005, 2006). The physiological data in the current study also demonstrate that the proportion of cell pairs that show evidence for electrotonic or tracer coupling or spike-to-spike synchrony is quite low (i.e., no spike synchrony in our study and only one pair of tracer-coupled neurons). Based on the data from both the light and electron microscopic observations and from the electrophysiological recordings, the pattern of electrotonic coupling between neurons in the SCN occurs mostly via miniature gap junctions between pairs or small groups of SCN neurons. Consequently, pairs of SCN neurons rarely show detectable coupling or synchrony even though many if not most SCN neurons have spikelets, which result primarily or exclusively from electrotonic coupling to another (or only a few) other SCN neurons (Fig. 14).
Fig. 14.

Schematic diagram of a hypothetical pattern of a coupled SCN neuronal network (A), and examples of weak synchrony during spontaneous activity of SCN neurons after active chemical synaptic transmission was blocked with low-calcium solutions (B). (A) Thick lines between neurons indicate strong coupling via large gap junctions; thin lines indicate weak coupling from small gap junctions. White circles show neurons without gap junctions, which do not show coupling or spikelets. Gray circles are neurons linked by “mini” gap junctions (thin connecting lines), which would be detected as weak coupling only if both coupled cells were recorded, but even then, would show small spikelets only when one of the weakly coupled neurons fires an action potential during the recording period. Black circles indicate the small fraction of SCN neurons that are more strongly coupled by larger gap junctions (thick connecting lines). Simultaneous recording from two SCN neurons more strongly coupled by larger gap junctions would show coupling coefficients of >0.1 and larger spikelets if the coupled neuron fired an action potential. (A, substantially modified from Dudek et al., 1983; B, modified from Bouskila and Dudek, 1993).
Immunofluorescent puncta for Cx36 were present at moderate density in the SCN. As in retina and spinal cord, many neuronal gap junctions in adult SCN were so small that they would probably have been difficult to detect by confocal immunofluorescence microscopy (Kamasawa et al., 2006). The few large gap junctions detected by FRIL in adult SCN (1 of 12) would account for both rare tracer coupling (<5% of SCN neurons) and the few examples of coupling ratios >0.10 reported by Long et al. (2005). In contrast, the relatively more abundant “mini” gap junctions found by FRIL may account for the more frequent examples of coupling ratios <0.10 (Long et al., 2005) and the smallest of the partial spikes in SCN neurons. Because QX-314 is able to spread throughout each of the recorded SCN neurons, but probably did not cross the “mini” gap junctions in sufficient amounts to block action potentials in the coupled cells (at least in the time course of our experiments), the partial spikes or spikelets previously observed in the SCN (Wheal and Thomson, 1984; Kim and Dudek, 1992) and consistently observed in the present recordings presumably represent electrotonic coupling potentials rather than dendritic or axonal spikes in the recorded neurons (e.g., Eyzaguirre and Kuffler, 1955; Spencer and Kandel, 1961). Therefore, the low-amplitude partial spikes, often barely discernable from electrical noise, detected in roughly half of the SCN neurons presumably reflect weak coupling by “mini” gap junctions.
Detection of neuronal gap junctions in SCN
By confocal microscopy, we estimated ca. 120,000 fluorescent puncta in the paired SCN of mice, for an average of 7.5 immunofluorescence-detectable puncta for each of the approximately 16,000 neurons (van den Pol, 1980). Based on the near absence of immunofluorescent puncta in Cx36 KO mice, the rate of false-positive puncta is estimated to be very low. Conversely, with respect to false negatives, our recent quantitative confocal and FRIL studies of >2000 gap junctions varying from 4 to 3000 connexons in rodent retina suggest that the constraints of labeling and immunofluorescence imaging may limit light-microscopic detection of the smallest gap junctions (i.e., <30–50 connexons; Kamasawa et al., 2006). Thus, FRIL data suggesting that more than half of neuronal gap junctions in SCN have fewer than 50 connexons implies the possibility of additional “mini” gap junctions per neuron. Regardless, each SCN neuron appears to be detectably coupled to one or two other neurons, but may be more weakly coupled to additional neurons by a small but unknown number of “mini” gap junctions.
Conventional thin-section TEM is not capable of identifying “mini” gap junctions because they are smaller than the 60–90 nm thickness of typical TEM sections (Sotelo and Korn, 1978; Berdan et al., 1987; Rash et al., 1998a). For example, in thin-section studies of adult rat spinal cord, only large gap junctions had been detected, and then, only in the caudal extent of the lumbosacral enlargement in the nucleus of the bulbocavernosus (Matsumoto et al., 1988, 1989). By comparison, conventional freeze fracture and FRIL allowed identification of small gap junctions based on well-established ultrastructural criteria (Massa and Mugnaini, 1982; Mugnaini, 1986; Rash et al., 1996, 1997, 1998a; Meier et al., 2004). In a freeze-fracture study of spinal cord, we found ca. 100 “mini” gap junctions between spinal cord neurons in cervical, thoracic, and lumbosacral regions (Rash et al., 1996, 1998a), with >50% of those smaller than 45 connexons (Rash et al., 1996). Subsequently, Cx36-fluorescence immunocytochemistry and FRIL revealed the abundance of similar neuronal “mini” gap junctions in several other regions of the CNS, including retina and locus coeruleus (Kamasawa et al., 2006; Rash et al., 2007).
Correlation of microscopical and electrophysiological data
The relatively rare occurrence of large Cx36-containing gap junctions between SCN neurons may account for the rare observation of tracer coupling of these neurons (Welsh and Reppert, 1996). Current data support those of Jobst et al. (2004), who found tracer coupling in only 2 of 21 calbindin-positive neurons in the SCN, and those of Long and coworkers (2005), who reported electrotonic coupling with coupling coefficients >0.10 and spike-for-spike synchrony in 5–10% of SCN neuronal pairs. However, in contrast to Long et al. (2005), we found no direct evidence of spike-for-spike synchrony. Our experiments were performed at essentially the same Zeitgeber time as Long et al. (2005), excluding differences in ZT as a possible basis for the different results. The higher incidence of coupling and possibly of stronger coupling in the reports of Long et al. (2005) and Colwell (2000) may have been due to their use of more immature animals -- i.e., postnatal day 10–14 (Colwell, 2000) and postnatal day 17–23 (Long et al., 2005) vs. postnatal day 21–45 in this report.
Circadian rhythmicity of coupling
Colwell (2000) originally proposed that SCN cells were extensively dye coupled during the day but minimally dye coupled during the night. Long et al (2005) also concluded that the proportion of electrotonically coupled neurons was related to the phase of the circadian rhythm. However, they studied coupling during only 8 of the 24-h circadian day, and did not compare to electrotonic coupling across circadian night, which would have been required to establish a circadian relationship. Long et al. (2005) stated that circadian rhythms of wheel-running behavior were “dampened,” but coordinated circadian rhythms were clearly present in their data (e.g., see Fig. 3b of Long et al., 2005). Furthermore, examination of the reported coupling coefficients (versus the percentage of coupled neurons) as a function of time (Long et al., 2005) reveals that the strength of the coupling was nearly equal before vs. after ZT 8:00 (i.e., two of the five more strongly coupled neuron pairs were recorded at approximately ZT=10 and ZT=11). This alternative analysis of the data of Long et al., (2005) does not support a diurnal difference in coupling; rather, it suggests that coupling is not under circadian regulation. If electrotonic coupling through gap junctions plays a role in synchronizing the rhythms of individual SCN “clock” neurons, there is no obvious reason why the proportion of coupled neurons or the coupling coefficient should be under circadian control (i.e., synchrony of clock cells could be achieved without the necessity of changes in coupling efficiency as a function of the circadian cycle).
Detection of spikelets
A key issue addressed here is that at least some spikelets persisted in the presence of QX-314. The potential concern that QX-314 may not have diffused into the dendrite and blocked dendritic spikes is unlikely. Neurobiotin (similar molecular weight to QX-314) rapidly and consistently stains the dendrites. Moreover, Stuart and Sakmann (1994) showed that when QX-314 was infused into the distal dendrite of a cortical pyramidal cell hundreds of micrometers from the soma (a further distance than the length of SCN dendrites), the sodium spikes in the soma were blocked within a minute or two. Thus, we propose that because QX-314 blocked the sodium-mediated action potentials within the recorded neuron, spikelets must have arisen from action potentials in one or more neurons that were coupled to the recorded cell via small gap junctions. Because we found virtually no evidence of tracer coupling under these conditions, it is reasonable to infer that QX-314 also did not detectably diffuse into the weakly coupled cells. These electrophysiological observations support the conclusions of Long and co-workers that spikelets arise from electrotonic coupling, and are consistent with the hypothesis that weak coupling and small spikelets occur either directly through “mini” gap junctions and/or involve an “intermediary” neuron linked by gap junctions to the recorded cell (see Fig. 14A). Additional studies with specific gap junction blockers could potentially test this hypothesis, assuming such agents can be shown not to alter the membrane properties of SCN neurons.
Properties of electrotonic coupling
The observation of SCN neurons not showing spikelets in the current study (ca. 50%) may reflect the relatively low number of neuronal gap junctions in the SCN. Alternatively, the SCN neurons without observed spikelets could represent cases: a) where the non-recorded coupled neuron was not spontaneously active (this seems unlikely, since most SCN neurons are thought to be spontaneously active), b) where the coupling potential in the recorded neuron triggered action potentials that masked the underlying spikelets, or c) where the spikelet was too small to be observed above the noise. The neurons with clear spikelets may represent weakly coupled cells with “mini” gap junctions, and the few cases of more strongly coupled cells may reflect the low frequency of occurrence of larger gap junctions (Fig. 14A). Most of the other coupling was between 0.02 and 0.08, which would generally be considered to be very weak, if not barely detectable. Our detection of putative spikelets <1 mV presumably represents weak coupling and demonstrates that the recordings had adequate signal-to-noise ratio to detect weak coupling du]ring paired recordings.
Functional implications of neuronal gap junctions to the generation of circadian rhythms
A fundamental conceptual problem is that there is no established mechanism by which the individual neuronal clocks in the SCN maintain a coordinated circadian rhythm of population activity and behavior. Although chemical synapses clearly regulate the electrical activity of SCN neurons, it is not clear how they might synchronize the intracellular mechanisms that underlie the circadian clock. The slow nature of the circadian clock (i.e., ca. 24 h, by definition) means that relatively small (“mini”) gap junctions among small groups of neurons throughout the SCN could, in principle, synchronize the population of SCN neurons. The observations of Schwartz and coworkers (1987) in which TTX injections into the SCN temporarily and reversibly abolished circadian rhythms is consistent with the hypothesis that gap junctions between SCN neurons mediate communication of small, diffusible circadian clock signals (i.e., the resumption of a coordinated circadian rhythm of behavior without a detectable phase change after withdrawal of the TTX suggests that the individual clock cells communicated even though TTX blocked the sodium-mediated action potentials). The small number of large gap junctions and 10-fold greater abundance of neuronal “mini” gap junctions revealed here, combined with evidence for limited coupling, suggest that coupling-mediated spike-for-spike synchronization among SCN neurons is present but relatively rare. Previous research with single- and multiple-unit recordings in hypothalamic slices containing the SCN (Bouskila and Dudek, 1993) has shown that when chemical synaptic transmission is blocked with a solution that contains a low extracellular concentration of calcium, a “loose” synchronization of action potential firing occurs (see Fig. 14B). The key result from that study was that the population of SCN neurons showed a form of synchronization that was dominated by multiple-unit bursts of action potentials where many neurons were not synchronous with other nearby neurons, and only some of the units displayed spike-for-spike synchronization. The current results provide an important ultrastructural line of support for the hypothesis that a role of gap junctions, particularly small ones, may be to synchronize electrical and metabolic activity over minutes and hours ( Bennett and Zukin, 2004) vs. the millisecond time frame typically thought to occur in spike-to-spike synchronization via larger gap junctions. In the future, it will be essential to determine the identities of the neurons on both sides of these gap junctions and the nature of the signals that are passed.
Acknowledgments
Supported by NIH (NS38121, NS39040, NS44010, and NS44395 [to JER], MH55595 [to FED]) and by the Canadian Institutes of Health Research (to JIN). We thank B. McLean for technical assistance and A.R. Magnie and B. Gebhardt for preparation of images and stereo pairs using Photoshop.
Abbreviations
- 4AP
4-aminopyridine
- Ab
antibody
- AQP4
aquaporin4
- AP-5
D-2-amino-5-phosphonopentanoate
- BIC
bicuculine methiodide
- Cx26
connexin26
- Cx30
connexin30
- Cx32
connexin32
- Cx36
connexin36
- Cx43
connexin43
- DNQX
6,7-dinitroquinoxaline
- Cy3
indocarbocyanine
- EF
E-face or extraplasmic face
- EPSPs
excitatory postsynaptic potentials
- FITC
fluorescein isothiocyanate
- FRIL
freeze-fracture replica immunogold labeling
- GABA
gamma-amino butyric acid
- GFAP
glial fibrillary acidic protein
- IgG
immunoglobulin G
- IMP
intramembrane particle or intramembrane protein
- NMDA
N-methyl D-aspartate
- PBS
phosphate buffered saline
- P-face or
protoplasmic face
- PSD
postsynaptic density
- QX-314
QX-314 Bromide (N-(2,6-Dimethylphenylcarbamoylmethyl) triethylammonium bromide)
- SCN
suprachiasmatic nucleus
- SDS
sodium dodecylsulfate detergent
- SPB
Sørensen’s phosphate buffer
- TBSTr
Tris buffered saline plus 0.3% Triton X-100
- TEM
transmission electron microscopy
Footnotes
Publisher's Disclaimer: This is a PDF file of an unedited manuscript that has been accepted for publication. As a service to our customers we are providing this early version of the manuscript. The manuscript will undergo copyediting, typesetting, and review of the resulting proof before it is published in its final citable form. Please note that during the production process errors may be discovered which could affect the content, and all legal disclaimers that apply to the journal pertain.
References
- Balice-Gordon RJ, Bone LJ, Scherer SS. Functional gap junctions in the Schwann cell myelin sheath. J Cell Biol. 1998;142:1095–1104. doi: 10.1083/jcb.142.4.1095. [DOI] [PMC free article] [PubMed] [Google Scholar]
- Bennett MVL, Zukin RS. Electrical coupling and neuronal synchronization in the mammalian brain. Neuron. 2004;41:495–511. doi: 10.1016/s0896-6273(04)00043-1. [DOI] [PubMed] [Google Scholar]
- Berdan RC, Shivers RR, Bulloch AGM. Chemical synapses, particle arrays, pseudo-gap junctions and gap junctions of neurons and glia in the buccal ganglion of Helisoma. Synapse. 1987;1:304–323. doi: 10.1002/syn.890010404. [DOI] [PubMed] [Google Scholar]
- Bouskila Y, Dudek FE. Neuronal synchronization without calcium-dependent synaptic transmission in the hypothalamus. Proc Natl Acad Sci (USA) 1993;90:3207–3210. doi: 10.1073/pnas.90.8.3207. [DOI] [PMC free article] [PubMed] [Google Scholar]
- Branton D, Bullivant S, Gilula NB, Karnovsky MJ, Moor H, Northcote DH, Packer L, Satir B, Satir P, Speth V, Staehelin LA, Steere RL, Weinstein RS. Freeze-etching nomenclature. Science. 1975;190:54–56. doi: 10.1126/science.1166299. [DOI] [PubMed] [Google Scholar]
- Brightman MW, Reese TS. Junctions between intimately apposed cell membranes in the vertebrate brain. J Cell Biol. 1969;40:648–677. doi: 10.1083/jcb.40.3.648. [DOI] [PMC free article] [PubMed] [Google Scholar]
- Bushong EA, Martone ME, Jones YZ, Ellisman MH. Protoplasmic astrocytes in CA1 stratum radiatum occupy separate anatomical domains. J Neurosci. 2002;22:183–192. doi: 10.1523/JNEUROSCI.22-01-00183.2002. [DOI] [PMC free article] [PubMed] [Google Scholar]
- Castel M, Belenky M, Cohen S, Ottersen OP, Storm-Mathisen J. Glutamate-like immunoreactivity in retinal terminals of the mouse suprachiasmatic nucleus. Eur J Neurosci. 1993;5:368–381. doi: 10.1111/j.1460-9568.1993.tb00504.x. [DOI] [PubMed] [Google Scholar]
- Challcroft JP, Bullivant S. An interpretation of liver cell membrane and junction structure based on observation of freeze-fracture replicas of both sides of the fracture. J Cell Biol. 1970;47:49–60. doi: 10.1083/jcb.47.1.49. [DOI] [PMC free article] [PubMed] [Google Scholar]
- Colwell C. Rhythmic coupling among cells in the suprachiasmatic nucleus. J Neurobiol. 2000;43:379–388. doi: 10.1002/1097-4695(20000615)43:4<379::aid-neu6>3.0.co;2-0. [DOI] [PMC free article] [PubMed] [Google Scholar]
- Condorelli DF, Parenti R, Spinella F, Salinaro AT, Belluardo N, Cardile V, Cicirata F. Cloning of a new gap junction gene (Cx36) highly expressed in mammalian brain neurons. Eur J Neurosci. 1998;10:1202–1208. doi: 10.1046/j.1460-9568.1998.00163.x. [DOI] [PubMed] [Google Scholar]
- Deans MR, Gibson JR, Sellitto C, Connors BW, Paul DL. Synchronous activity of inhibitory networks in neocortex requires electrical synapses containing connexin36. Neuron. 2001;31:477–485. doi: 10.1016/s0896-6273(01)00373-7. [DOI] [PubMed] [Google Scholar]
- Dudek FE, Andrew RD, MacVicar BA, Snow RW, Taylor CP. Recent evidence for and possible significance of gap junctions in electrotonic synapses in mammalian brain. In: Jasper HH, van Gelder NM, editors. Basic Mechanisms of Neuronal Hyperexcitability. NY: Alan R. Liss; 1983. pp. 31–73. [Google Scholar]
- Eyzaguirre C, Kuffler SW. Processes of excitation in the dendrites and in the soma of single isolated sensory nerve cells of the lobster and crayfish. J Gen Physiol. 1955;39:87–119. doi: 10.1085/jgp.39.1.87. [DOI] [PMC free article] [PubMed] [Google Scholar]
- Fukuda T, Kosaka T, Singer W, Galuske RAW. Gap junctions among dendrites of cortical GABAergic neurons establish a dense and widespread intercolumnar network. J Neurosci. 2006;26:3434–3443. doi: 10.1523/JNEUROSCI.4076-05.2006. [DOI] [PMC free article] [PubMed] [Google Scholar]
- Fujimoto K. Freeze-fracture replica electron microscopy combined with SDS digestion for cytochemical labeling of integral membrane proteins. Application to the immunogold labeling of intercellular junctional complexes. J Cell Sci. 1995;108:3443–3449. doi: 10.1242/jcs.108.11.3443. [DOI] [PubMed] [Google Scholar]
- Fujimoto K. SDS-digested freeze-fracture replica labeling electron microscopy to study the two-dimensional distribution of integral membrane proteins and phospholipids in biomembranes: practical procedure, interpretation and application. Histochem Cell Biol. 1997;107:87–96. doi: 10.1007/s004180050092. [DOI] [PubMed] [Google Scholar]
- Fulton BP, Miledi R, Takahashi T. Electrical synapses between motoneurons in the spinal cord of the newborn rat. Proc R Soc London,Ser B. 1980;206:115–120. doi: 10.1098/rspb.1980.0045. [DOI] [PubMed] [Google Scholar]
- Furman CS, Gorelick-Feldman DA, Davidson KGV, Yasumura T, Neely JD, Agre P, Rash JE. Aquaporin-4 square array assembly: Opposing actions of M1 and M23 isoforms. Proc Natl Acad Sci. 2003;100:13609–13614. doi: 10.1073/pnas.2235843100. [DOI] [PMC free article] [PubMed] [Google Scholar]
- Gilula NB, Reeves OR, Steinbach A. Metabolic coupling, ionic coupling and cell contacts. Nature. 1972;235:262–265. doi: 10.1038/235262a0. [DOI] [PubMed] [Google Scholar]
- Green DJ, Gillette R. Circadian rhythm of firing rate recorded from single cells in the rat suprachiasmatic brain slice. Brain Research. 1982;245:198–200. doi: 10.1016/0006-8993(82)90361-4. [DOI] [PubMed] [Google Scholar]
- Gribkoff VK, Pieschl RL, Dudek FE. GABA Receptor-Mediated Inhibition of Neuronal Activity in Rat SCN In Vitro: Pharmacology and Influence of Circadian Phase. J Neurophysiol. 2003;90:1438–1448. doi: 10.1152/jn.01082.2002. [DOI] [PubMed] [Google Scholar]
- Gruijters WT, Kistler J, Bullivant S, Goodenough DA. Immunolocalization of MP70 in lens fiber 16-17-nm intercellular junctions. J Cell Biol. 1987;104:565–572. doi: 10.1083/jcb.104.3.565. [DOI] [PMC free article] [PubMed] [Google Scholar]
- Hastings MH, Herzog ED. Clock Genes, Oscillators, and Cellular Networks in the Suprachiasmatic Nuclei. J Biol Rhythms. 2004;19:400–413. doi: 10.1177/0748730404268786. [DOI] [PubMed] [Google Scholar]
- Herzog ED, Grace MS, Harrer C, Williamson J, Shinohara K, Block GD. The role of Clock in the developmental expression of neuropeptides in the suprachiasmatic nucleus. J Comp Neurol. 2000;424:86–98. doi: 10.1002/1096-9861(20000814)424:1<86::aid-cne7>3.0.co;2-w. [DOI] [PubMed] [Google Scholar]
- Hombach S, Janssen-Bienhold U, Söhl G, Schubert T, Bussow H, Ott T, Weiler R, Willecke K. Functional expression of connexin57 in horizontal cells of the mouse retina. Europ J Neurosci. 2004;19:2633–2640. doi: 10.1111/j.0953-816X.2004.03360.x. [DOI] [PubMed] [Google Scholar]
- Honma S, Nakamura W, Shirakawa T, Honma Ki. Diversity in the circadian periods of single neurons of the rat suprachiasmatic nucleus depends on nuclear structure and intrinsic period. Neurosci Let. 2004;358:173–176. doi: 10.1016/j.neulet.2004.01.022. [DOI] [PubMed] [Google Scholar]
- Honma S, Shirakawa T, Katsuno Y, Namihira M, Honma Ki. Circadian periods of single suprachiasmatic neurons in rats. Neurosci Let. 1998;250:157–160. doi: 10.1016/s0304-3940(98)00464-9. [DOI] [PubMed] [Google Scholar]
- Ibata Y, Okamura H, Tanaka M, Tamada Y, Hayashi S, Iijima N, Matsuda To, Munekawa K, Takamatsu T, Hisa Y. Functional morphology of the suprachiasmatic nucleus. Frontiers in Neuroendocrinology. 1999;20:241–268. doi: 10.1006/frne.1999.0180. [DOI] [PubMed] [Google Scholar]
- Jiang ZG, Yang YQ, Allen CN. Tracer and electrical coupling of rat suprachiasmatic nucleus. Neurosci. 1997;77:1059–1066. doi: 10.1016/s0306-4522(96)00539-8. [DOI] [PubMed] [Google Scholar]
- Jobst EE, Robinson DW, Allen CN. Potential pathways for intercellular communication within the calbindin subnucleus of the hamster suprachiasmatic nucleus. Neuroscience. 2004;123:87–99. doi: 10.1016/j.neuroscience.2003.08.059. [DOI] [PubMed] [Google Scholar]
- Kamasawa N, Furman CS, Davidson KGV, Sampson JA, Magnie AR, Gebhardt B, Kamasawa M, Morita M, Yasumura T, Pieper M, Zumbrunnen JR, Pickard GE, Nagy JI, Rash JE. Abundance and ultrastructural diversity of neuronal gap junctions in the OFF and ON sublaminae of the inner plexiform layer of rat and mouse retina. Neuroscience. 2006;142:1093–1117. doi: 10.1016/j.neuroscience.2006.08.020. [DOI] [PMC free article] [PubMed] [Google Scholar]
- Kamasawa N, Sik A, Morita M, Yasumura T, Davidson KGV, Nagy JI, Rash JE. Connexin47 and connexin32 in gap junctions of oligodendrocyte somata, myelin sheaths, paranodal loops, and Schmidt-Lanterman incisures: Implications for ionic homeostasis and potassium siphoning. Neuroscience. 2005;136:65–86. doi: 10.1016/j.neuroscience.2005.08.027. [DOI] [PMC free article] [PubMed] [Google Scholar]
- Kim YI, Dudek FE. Intracellular electrophysiological study of suprachiasmatic neurons in rodents: excitatory synaptic mechanisms. J Physiol. 1991;444:269–287. doi: 10.1113/jphysiol.1991.sp018877. [DOI] [PMC free article] [PubMed] [Google Scholar]
- Kim YI, Dudek FE. Intracellular electrophysiological study of suprachiasmatic nucleus neurons in rodents: inhibitory synaptic mechanisms. J Physiol. 1992;458:247–260. doi: 10.1113/jphysiol.1992.sp019416. [DOI] [PMC free article] [PubMed] [Google Scholar]
- Kita H, Armstrong W. A biotin-containing compound N-(2-aminoethyl)biotinamide for intracellular labeling and neuronal tracing studies: Comparison with biocytin. J Neurosci Met. 1991;37:141–150. doi: 10.1016/0165-0270(91)90124-i. [DOI] [PubMed] [Google Scholar]
- Landis DMD, Reese TS. Arrays of particles in freeze-fractured astrocytic membranes. J Cell Biol. 1974;60:316–320. doi: 10.1083/jcb.60.1.316. [DOI] [PMC free article] [PubMed] [Google Scholar]
- Li J, Hertzberg EL, Nagy JI. Connexin32 in oligodendrocytes and association with myelinated fibers in mouse and rat brain. J Comp Neurol. 1997;379:571–591. doi: 10.1002/(sici)1096-9861(19970324)379:4<571::aid-cne8>3.0.co;2-#. [DOI] [PubMed] [Google Scholar]
- Li X, Olson C, Lu S, Kamasawa N, Yasumura T, Rash JE, Nagy JI. Neuronal connexin36 association with zonula occludens-1 protein (ZO-1) in mouse brain and interaction with the first PDZ domain of ZO-1. Eur J Neurosci. 2004;19:2132–2146. doi: 10.1111/j.l460-9568.2004.03283.x. [DOI] [PMC free article] [PubMed] [Google Scholar]
- Liu C, Reppert SM. GABA synchronizes clock cells within the suprachiasmatic circadian clock. Neuron. 2000;25:123–128. doi: 10.1016/s0896-6273(00)80876-4. [DOI] [PubMed] [Google Scholar]
- Long MA, Jutras MJ, Connors BW, Burwell RD. Electrical synapses coordinate activity in the suprachiasmatic nucleus. Nat Neurosci. 2005;8:61–66. doi: 10.1038/nn1361. [DOI] [PubMed] [Google Scholar]
- MacVicar BA, Dudek FE. Electrotonic coupling between pyramidal cells: A direct demonstration in rat hippocampal slices. Science. 1981;213:782–785. doi: 10.1126/science.6266013. [DOI] [PubMed] [Google Scholar]
- Massa PT, Mugnaini E. Cell junctions and intramembrane particles of astrocytes and oligodendrocytes: a freeze-fracture study. Neuroscience. 1982;7:523–538. doi: 10.1016/0306-4522(82)90285-8. [DOI] [PubMed] [Google Scholar]
- Massey SC, O'Brien JJ, Trexler EB, Li W, Keung JW, Mills SL, O'Brien J. Multiple neuronal connexins in the mammalian retina. Cell Commun Adhes. 2003;10:425–430. doi: 10.1080/cac.10.4-6.425.430. [DOI] [PubMed] [Google Scholar]
- Matsumoto A, Arnold AP, Micevych PE. Gap junctions between lateral spinal motoneurons in the rat. Brain Research. 1989;495:362–366. doi: 10.1016/0006-8993(89)90229-1. [DOI] [PubMed] [Google Scholar]
- Matsumoto A, Arnold AP, Zampighi G, Micevych PE. Androgenic regulation of gap junctions between motoneurons in the rat spinal cord. J Neurosci. 1988;8 (11):4177–4138. doi: 10.1523/JNEUROSCI.08-11-04177.1988. [DOI] [PMC free article] [PubMed] [Google Scholar]
- Meier C, Dermietzel R, Davidson KGV, Yasumura T, Rash JE. Connexin32-containing gap junctions in Schwann cells at the internodal zone of partial myelin compaction and in Schmidt-Lanterman incisures. J Neurosci. 2004;24:3186–3198. doi: 10.1523/JNEUROSCI.5146-03.2004. [DOI] [PMC free article] [PubMed] [Google Scholar]
- Mintz EM, Marvel CL, Gillespie CF, Price KM, Albers HE. Activation of NMDA receptors in the suprachiasmatic nucleus produces light-like phase shifts of the circadian clock in vivo. J Neurosci. 1999;19:5124–5130. doi: 10.1523/JNEUROSCI.19-12-05124.1999. [DOI] [PMC free article] [PubMed] [Google Scholar]
- Mugnaini E. Cell junctions of astrocytes, ependyma, and related cells in the mammalian central nervous system, with emphasis on the hypothesis of a generalized functional syncytium of supporting cells. In: Fedoroff S, Vernadakis A, editors. Astrocytes. I. New York: Academic Press; 1986. pp. 329–371. [Google Scholar]
- Nagy JI, Dudek FE, Rash JE. Update on connexins and gap junctions in neurons and glia in the mammalian central nervous system. Brain Res Brain Res Rev. 2004;47:191–215. doi: 10.1016/j.brainresrev.2004.05.005. [DOI] [PubMed] [Google Scholar]
- Nagy JI, Ionescu A-V, Lynn BD, Rash JE. Connexin29 and connexin32 at oligodendrocyte and astrocyte gap junctions and in myelin of the mouse central nervous system. J Comp Neurol. 2003a;464:356–370. doi: 10.1002/cne.10797. [DOI] [PMC free article] [PubMed] [Google Scholar]
- Nagy JI, Ionescu A-V, Lynn BD, Rash JE. Coupling of astrocyte connexins Cx26, Cx30, Cx43 to oligodendrocyte Cx29, Cx32, Cx47: Implications from normal and connexin32 knockout mice. Glia. 2003b;44:205–218. doi: 10.1002/glia.10278. [DOI] [PMC free article] [PubMed] [Google Scholar]
- O’Brien JJ, Li W, Pan F, Keung J, O’Brien J, Massey SC. Coupling between A-type horizontal cells is mediated by connexin 50 gap junctions in the rabbit retina. J Neurosci. 2006;26:11624–11636. doi: 10.1523/JNEUROSCI.2296-06.2006. [DOI] [PMC free article] [PubMed] [Google Scholar]
- Phillips TE, Boyne AF. Liquid nitrogen-based quick freezing: Experiments with bounce-free delivery of cholinergic nerve terminals to a metal surface. J Electron Microsc Tech. 1984;1:9–29. [Google Scholar]
- Rash JE, Davidson KGV, Kamasawa N, Yasumura T, Kamasawa M, Zhang C, Michaels R, Restrepo D, Ottersen OP, Olson C, Nagy JI. Ultrastructural localization of connexins (Cx36, Cx43, Cx45), glutamate receptors and aquaporin-4 in rodent olfactory mucosa, olfactory nerve and olfactory bulb. J Neurocytol. 2005;34:307–341. doi: 10.1007/s11068-005-8360-2. [DOI] [PMC free article] [PubMed] [Google Scholar]
- Rash JE, Davidson KGV, Yasumura T, Furman CS. Freeze-fracture and immunogold analysis of aquaporin-4 (AQP4) square arrays, with models of AQP4 lattice assembly. Neurosci. 2004a;129:915–934. doi: 10.1016/j.neuroscience.2004.06.076. [DOI] [PMC free article] [PubMed] [Google Scholar]
- Rash JE, Dillman RK, Bilhartz BL, Duffy HS, Whalen LR, Yasumura T. Mixed synapses discovered and mapped throughout mammalian spinal cord. Proc Natl Acad Sci (USA) 1996;93:4235–4239. doi: 10.1073/pnas.93.9.4235. [DOI] [PMC free article] [PubMed] [Google Scholar]
- Rash JE, Dillman RK, Morita M, Whalen LR, Guthrie PB, Fay-Guthrie D, Wheeler DW. Grid-mapped freeze fracture: Correlative confocal laser scanning microscopy and freeze-fracture electron microscopy of preselected cells in tissue slices. In: Severs NJ, Shotton DM, editors. Rapid Freezing, Freeze Fracture, and Deep Etching. New York, NY: Wiley-Liss, Inc; 1995. pp. 127–150. [Google Scholar]
- Rash JE, Duffy HS, Dudek FE, Bilhartz BL, Whalen LR, Yasumura T. Grid-mapped freeze-fracture analysis of gap junctions in gray and white matter of adult rat central nervous system, with evidence for a “panglial syncytium” that is not coupled to neurons. J Comp Neurol. 1997;388:265–292. doi: 10.1002/(sici)1096-9861(19971117)388:2<265::aid-cne6>3.0.co;2-#. [DOI] [PubMed] [Google Scholar]
- Rash JE, Johnson TJA, Dinchuk JE, Duch DS, Levinson SR. Labeling intramembrane particles in freeze-fracture replicas. In: Hui SW, editor. Freeze-Fracture Studies of Membranes. Boca Raton: CRC Press; 1989. pp. 41–59. [Google Scholar]
- Rash JE, Olson C, Davidson KGV, Yasumura T, Kamasawa N, Nagy JI. Identification of connexin36 in gap junctions between neurons in rodent locus coeruleus. Neuroscience. 2007;147:938–956. doi: 10.1016/j.neuroscience.2007.04.061. [DOI] [PMC free article] [PubMed] [Google Scholar]
- Rash JE, Pereda A, Kamasawa N, Furman CS, Yasumura T, Davidson KGV, Dudek FE, Olson C, Nagy JI. High-resolution proteomic mapping in the vertebrate central nervous system: Close proximity of connexin35 to NMDA glutamate receptor clusters and co-localization of connexin36 with immunoreactivity for zonula occludens protein-1 (ZO-1) J Neurocytol. 2004;33:131–152. doi: 10.1023/B:NEUR.0000029653.34094.0b. [DOI] [PMC free article] [PubMed] [Google Scholar]
- Rash JE, Staines WA, Yasumura T, Patel D, Hudson CS, Stelmack GL, Nagy JI. Immunogold evidence that neuronal gap junctions in adult rat brain and spinal cord contain connexin36 (Cx36) but not Cx32 or Cx43. Proc Natl Acad Sci (USA) 2000;97:7573–7578. doi: 10.1073/pnas.97.13.7573. [DOI] [PMC free article] [PubMed] [Google Scholar]
- Rash JE, Yasumura T. Direct immunogold labeling of connexins and aquaporin4 in freeze-fracture replicas of liver, brain and spinal cord: factors limiting quantitative analysis. Cell Tissue Res. 1999;296:307–321. doi: 10.1007/s004410051291. [DOI] [PubMed] [Google Scholar]
- Rash JE, Yasumura T, Davidson K, Furman CS, Dudek FE, Nagy JI. Identification of cells expressing Cx43, Cx30, Cx26, Cx32 and Cx36 in gap junctions of rat brain and spinal cord. Cell Commun Adhes. 2001a;8:315–320. doi: 10.3109/15419060109080745. [DOI] [PMC free article] [PubMed] [Google Scholar]
- Rash JE, Yasumura T, Dudek FE. Ultrastructure, histological distribution, and freeze-fracture immunocytochemistry of gap junctions in rat brain and spinal cord. Cell Biol Internat. 1998a;22:731–749. doi: 10.1006/cbir.1998.0392. [DOI] [PubMed] [Google Scholar]
- Rash JE, Yasumura T, Dudek FE, Nagy JI. Cell-specific expression of connexins, and evidence for restricted gap junctional coupling between glial cells and between neurons. J Neurosci. 2001b;21:1983–2001. doi: 10.1523/JNEUROSCI.21-06-01983.2001. [DOI] [PMC free article] [PubMed] [Google Scholar]
- Rash JE, Yasumura T, Hudson CS, Agre P, Nielsen S. Direct immunogold labeling of aquaporin-4 in “square arrays” of astrocyte and ependymocyte plasma membranes in rat brain and spinal cord. Pro Natl Acad Sci. 1998b;95:11981–11986. doi: 10.1073/pnas.95.20.11981. [DOI] [PMC free article] [PubMed] [Google Scholar]
- Raviola E, Gilula NB. Intramembrane organization of specialized contacts in the outer plexiform layer of the retina. J Cell Biol. 1975;65:192–222. doi: 10.1083/jcb.65.1.192. [DOI] [PMC free article] [PubMed] [Google Scholar]
- Raviola E, Goodenough DA, Raviola G. Structure of rapidly frozen gap junctions. J Cell Biol. 1980;87:273–279. doi: 10.1083/jcb.87.1.273. [DOI] [PMC free article] [PubMed] [Google Scholar]
- Saper CB, Lu J, Chou TC, Gooley J. The hypothalamic integrator for circadian rhythms. Trends Neuorsci (TINS) 2005;28:152–157. doi: 10.1016/j.tins.2004.12.009. [DOI] [PubMed] [Google Scholar]
- Schwartz WJ, Gross RA, Morton MT. The suprachiasmatic nuclei contain a tetrodotoxin-resistant circadian pacemaker. Proc Natl Acad Sci (USA) 1987;84:1694–1698. doi: 10.1073/pnas.84.6.1694. [DOI] [PMC free article] [PubMed] [Google Scholar]
- Sloper JJ. Gap junctions between dendrites in the primate cortex. Brain Research. 1972;44:641–646. doi: 10.1016/0006-8993(72)90327-7. [DOI] [PubMed] [Google Scholar]
- Söhl G, Willecke K. An update on connexin genes and their nomenclature in mouse and man. Cell Adhes Comm. 2003;10:173–180. doi: 10.1080/cac.10.4-6.173.180. [DOI] [PubMed] [Google Scholar]
- Sotelo C, Korn H. Morphological correlates of electrical and other interactions through low-resistance pathways between neurons of the vertebrate central nervous system. Internat Rev Cytol. 1978;55:67–107. doi: 10.1016/s0074-7696(08)61887-2. [DOI] [PubMed] [Google Scholar]
- Spencer WA, Kandel ER. Electrophysiology of hippocampal neurons: IV. Fast prepotentials. J Neurophysiol. 1961;24:272–285. doi: 10.1152/jn.1961.24.3.272. [DOI] [PubMed] [Google Scholar]
- Steere RL, Moseley M. New dimensions in freeze-etching. Proc Elec Micros Soc Am. 1969;27:202–203. [Google Scholar]
- Strecker GJ, Wuarin JP, Dudek FE. GABAA-mediated local synaptic pathways connect neurons in the rat suprachiasmatic nucleus. J Neurophysiol. 1997;78:2217–2220. doi: 10.1152/jn.1997.78.4.2217. [DOI] [PubMed] [Google Scholar]
- Stuart GJ, Sakmann B. Active propagation of somatic action potentials into neocortical pyramidal cell dendrites. Nature. 1994;367:69–72. doi: 10.1038/367069a0. [DOI] [PubMed] [Google Scholar]
- van den Pol AN. The hypothalamic suprachiasmatic nucleus of the rat: intrinsic anatomy. J Comp Neurol. 1980;91:661–702. doi: 10.1002/cne.901910410. [DOI] [PubMed] [Google Scholar]
- van den Pol AN, Dudek FE. Cellular communication in the circadian clock, the suprachiasmatic nucleus. Neuroscience. 1993;56:793–811. doi: 10.1016/0306-4522(93)90128-3. [DOI] [PubMed] [Google Scholar]
- Wagner S, Castel M, Gainer H, Yarom Y. GABA in the mammalian suprachiasmatic nucleus and its role in diurnal rhythmicity. Nature. 2006;387:598–603. doi: 10.1038/42468. [DOI] [PubMed] [Google Scholar]
- Walton KD, Navarette R. Postnatal changes in motoneurone electronic coupling studied in the in vitro rat lumbar spinal cord. J Physiol (London) 1991;433:283–305. doi: 10.1113/jphysiol.1991.sp018426. [DOI] [PMC free article] [PubMed] [Google Scholar]
- Welsh DK, Logothetis DE, Meister M, Reppert SM. Individual neurons dissociated from rat suprachiasmatic nucleus express independently phased circadian firing rhythms. Neuron. 1995;14:697–706. doi: 10.1016/0896-6273(95)90214-7. [DOI] [PubMed] [Google Scholar]
- Welsh DK, Reppert SM. Gap junctions couple astrocytes but not neurons in dissociated cultures of rat suprachiasmatic nucleus. Brain Research. 1996;706:30–36. doi: 10.1016/0006-8993(95)01172-2. [DOI] [PubMed] [Google Scholar]
- Wheal HV, Thomson AM. The electrical properties of neurones of the rat suprachiasmatic nucleus recorded intracellularly in vitro. Neurosci. 1984;13:97–104. doi: 10.1016/0306-4522(84)90262-8. [DOI] [PubMed] [Google Scholar]
- Willecke K, Eiberger J, Degen J, Eckardt D, Romualdi A, Gueldenagel M, Deutsch U, Soehl G. Structural and functional diversity of connexin genes in the mouse and human genome. Biol Chem. 2002;383:725–737. doi: 10.1515/BC.2002.076. [DOI] [PubMed] [Google Scholar]