Abstract
Exposure to arsenic via drinking water is a serious health concern in the US. Whereas studies have identified arsenic alone as an independent risk factor for liver disease, concentrations of arsenic required to damage this organ are generally higher than found in the US water supply. The purpose of the current study was to test the hypothesis that arsenic (at subhepatotoxic doses) may also sensitize the liver to a second hepatotoxin. To test this hypothesis, the effect of chronic exposure to arsenic on liver damage caused by acute lipopolysaccharide (LPS) was determined in mice. Male C57Bl/6J mice (4-6 weeks) were exposed to arsenic (49 ppm as sodium arsenite in drinking water). After 7 months of exposure, animals were injected with LPS (10 mg/kg i.p.) and sacrificed 24 h later. Arsenic alone caused no overt hepatotoxicity, as determined by plasma enzymes and histology. In contrast, arsenic exposure dramatically enhanced liver damage caused by LPS, increasing the number and size of necroinflammatory foci. This effect of arsenic was coupled with increases in indices of oxidative stress (4-HNE adducts, depletion of GSH and methionine pools). The number of apoptotic (TUNEL) hepatocytes was similar in the LPS and arsenic/LPS groups. In contrast, arsenic pre-exposure blunted the increase in proliferating (PCNA) hepatocytes caused by LPS; this change in the balance between cell death and proliferation was coupled with a robust loss of liver weight in the arsenic/LPS compared to the LPS alone group. The impairment of proliferation after LPS caused by arsenic was also coupled with alterations in the expression of key mediators of cell cycle progression (p27, p21, CDK6 and Cyclin D1). Taken together, these results suggest that arsenic, at doses that are not overtly hepatotoxic per se, significantly enhances LPS-induced liver injury. These results further suggest that arsenic levels in the drinking water may be a risk modifier for the development of chronic liver diseases.
Introduction
Inorganic arsenic is a ubiquitous element and a natural drinking water contaminant (National Research Council, 1999; National Research Council, 2001). Owing to its toxic potential to humans, it is a high priority hazardous substance in the United States. Chronic exposure to arsenic has been linked with a myriad of possible health effects, including skin lesions, hypertension, cardiovascular disease, respiratory disease, and malignancies of the skin and internal organs (Waalkes et al., 2004).
The liver has long been identified as a target organ of arsenic exposure. Non-malignant hepatic abnormalities include hepatomegaly, non-cirrhotic portal fibrosis and portal hypertension (Santra et al., 1999; 2000; Mazumder, 2005). Furthermore, arsenic exposure has been linked to hepatic malignancies, namely hepatic angiosarcoma and hepatocellular carcinoma in both humans and in animal models (Smith et al., 1992; Waalkes et al., 2006). Straub et al. (2007) recently demonstrated that mouse liver is also sensitive to more subtle hepatic changes (e.g., SEC capillarization and vessel remodeling) at lower arsenic exposure levels (250 ppb) without any gross pathologic effects. However, with the exception of these endothelial changes (Straub et al., 2007) and hepatomegaly (Mazumder, 2005), the concentrations/doses of arsenic required to cause overt liver damage and/or cancer in experimental models or increase the risk of these diseases in humans have been generally higher than levels of arsenic present in the US water supply. It is therefore unclear at this time if liver disease is a primary risk of environmental arsenic exposure in the US.
It is now clear that the risk for developing a human disease derived from environmental exposure is not based solely on that environmental exposure, but is rather modified by other mitigating conditions, such as other environmental or genetic factors. Indeed, it has been suggested that diet may contribute to the risk of developing arsenic toxicity (Smith et al., 1992). However, whether arsenic modifies the risk of developing liver damage owing to other insults has not been determined. Numerous studies have now established that physiological/biochemical changes to liver that are pathologically inert can enhance the hepatotoxic response caused by a second agent. This ‘2-hit’ paradigm has been best exemplified in fatty liver diseases (Day et al., 1998). For example, Yang et al. (1997) demonstrated that livers from genetically obese (fa/fa) rats are exquisitely sensitive to hepatotoxicity caused by the injection of bacterial lipopolysaccharide (LPS) compared to their lean littermates; this exacerbation of liver damage was characterized by a more robust inflammatory response and enhanced cell death.
The purpose of the current study was to test the hypothesis that arsenic may also sensitize the liver to hepatotoxicity caused by a second hit. To test this hypothesis, the effect of chronic exposure to subhepatotoxic doses of arsenic on experimental liver damage caused by acute lipopolysaccharide (LPS) was determined in mice.
Methods
Animals and treatments
Four to six week old male C57BL/6J mice were purchased from Jackson Laboratory (Bar Harbor, ME). Mice were housed in a pathogen-free barrier facility accredited by the Association for Assessment and Accreditation of Laboratory Animal Care and procedures were approved by the local Institutional Animal Care and Use Committee. Food and tap water were allowed ad libitum. Some animals received arsenic (49 ppm as sodium arsenite) in the drinking water. Animals were weighed on a weekly basis during the linear phase of growth and at the end of end of the exposure period. Careful monitoring of general health was performed on a weekly basis. 7 months after the initiation of arsenic exposure, the animals were given a bolus injection of LPS (10 mg/kg i.p.). This dose of LPS (serotype 055:B5, batch 075K4038; Sigma, St. Louis, MO) was determined by preliminary range-finding experiments to cause moderate liver damage. With this dose, animals are ataxic and show signs of stress (e.g., raised hair), but remain conscious and show no signs of toxicity to other target organs (e.g., plasma CK-MB activity was not significantly increased). Twenty-four h after LPS injection, mice were anesthetized by with ketamine/xylazine HCl solution (80/12 mg/kg i.m.). Blood was collected from the vena cava just prior to sacrifice by exsanguination and citrated plasma was stored at -80°C for further analysis. Portions of liver tissue were frozen immediately in liquid nitrogen, while others were fixed in 10% neutral buffered formalin or frozen-fixed for subsequent sectioning and mounting on microscope slides.
Clinical analyses and histology
Plasma levels of alanine aminotransferase (ALT), aspartate aminotransferase (AST) and alkaline phosphatase (ALP), were determined using commercially available kits (Thermotrace, Melbourne, Australia). Formalin fixed, paraffin embedded sections were cut at 5 μm and mounted on glass slides. Sections were deparaffinized and stained with hematoxylin and eosin. Pathologic changes were assessed in blinded manner. Neutrophil accumulation in the livers was assessed by staining tissue sections for chloroacetate esterase, using a napthol AS-D chloroacetate esterase kit [Sigma, St. Louis, MO; (Gujral et al., 2004; Guo et al., 2004)]. Frozen sections of liver (10 μm) were stained with oil Red O (Sigma Chemical Co., St. Louis, MO) for 10 min, washed, and counter stained with hematoxylin for 45 s [DAKO, Carpentaria, CA; (van Goor et al., 1986)]. Adducts of 4-hydroxynonenal (lipid peroxidation) were detected by immunohistochemistry as described previously (McKim et al., 2002). Indices of proliferation (PCNA) and apoptosis (TUNEL) were determined immunohistochemically using commercially available kits (Sigma, St. Louis Mo).
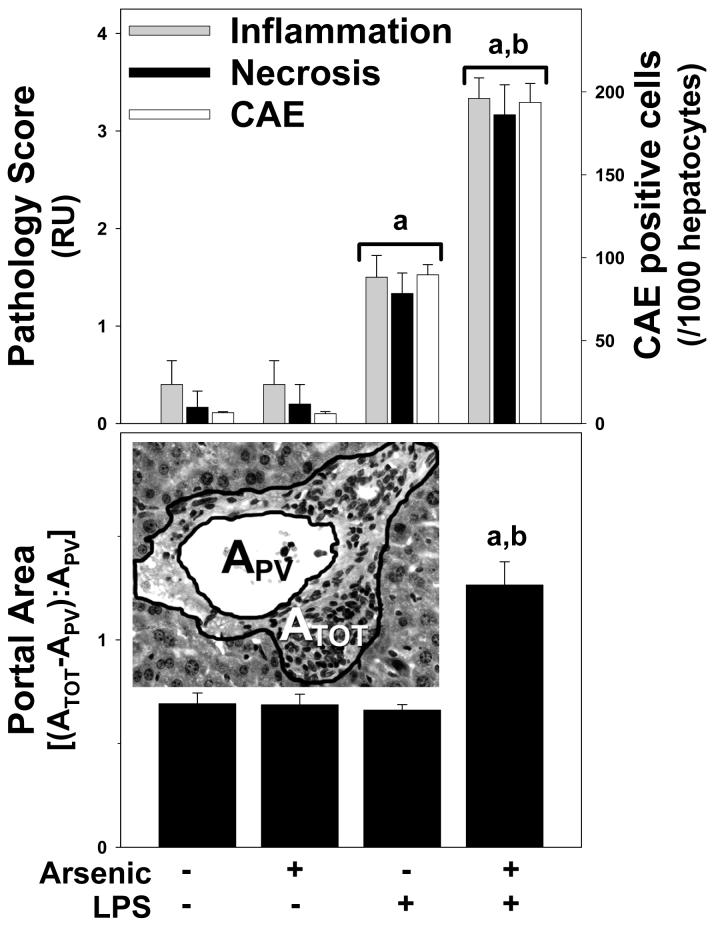
Pathology was scored in a blinded manner by a trained pathologist by counting the number of necrotic or inflammatory foci in a low power (40×) field; the maximal score was 4. The total (ATOT) and vessel (APV) area of 10 randomly selected portal regions (see Figure 3, lower panel, inset) was determined at 40× using Metamorph image-analysis software (Chester, PA) incorporating a Nikon microscope (Nikon, Melville, NY). For consistency of analysis, portal areas with large (≥10×10-3 mm2), or longitudinally cut, portal venules were avoided. The ratio of cellular to vessel area was calculated using the following equation [(ATOT-APV)/APV]. Colorimetric staining for Oil red O and portal 4OH-nonenal was quantitated using a Metamorph image acquisition and analysis system (Chester, PA) incorporating a Nikon microscope (Nikon, Melville, NY) as has been described previously (Arteel et al., 1995; Bergheim et al., 2006). The extent of labeling was defined as the percent of the field area within the default color range determined by the software. Data from each tissue section (10 fields per section) were pooled to determine treatment group means. Staining for CAE was quantitated by counting the number of positive cells (per 1000 hepatocytes) in each tissue section. TUNEL- and PCNA-positive hepatocytes were quantitated by counting the number of cells (per 1000 hepatocytes) from each tissue section.
Figure 3. Quantitation of histological changes caused by arsenic and LPS.
Upper panel: Inflammation scores (grey bars), necrosis scores (black bars), and CAE positive cells (black bars) were quantitated as described in Methods. Panel B: Portal expansion was quantitated as described in Methods (see inset). The average size of the portal venules (APV) analyzed was ∼5×10⁻³ mm2 and did not significantly differ between the groups. Data represent means ± SEM (n = 4-6). a, p < 0.05 compared to the saline injection; b, p < 0.05 compared to animals exposed to tap water. Key: RU, relative units; ATOT, total area; APV, portal vessel area.
Triglyceride determinations
Mouse livers were homogenized in 2× phosphate buffered saline (PBS). Tissue lipids were extracted with methanol:chloroform (1:2), dried in an evaporating centrifuge and resuspended in 5% fat free bovine serum albumin. Colorimetric assessment of hepatic and plasma triglyceride levels was carried out using Sigma Diagnostics Triglyceride Reagent (Sigma Chemical Co., St. Louis, MO). Values were normalized to protein in homogenate prior to extraction determined by the Bradford assay (Bio-Rad Laboratories, Hercules, CA).
HPLC analysis of glutathione and methionine pools
A 10% solution of tissue homogenate (w/v) was prepared in 4% metaphosphoric acid using an all-glass Tenbroeck homogenizer, and kept on ice. After standing for 20-40 min, the homogenate was centrifuged for 1 min (10,000×G), and the supernatant collected. Reduced GSH, GSH disulfide (GSSG), cysteine, cystine, and other thiols and disulfides content were quantified by HPLC with dual electrochemical detection (Richie et al., 1987; Chen et al., 1990). In brief, 20-μl samples were injected onto a C-18 column, eluted isocratically with a mobile phase consisting of 0.1 M monochloroacetic acid, 2 mM heptane sulfonic acid, and 2% acetonitrile (pH 2.8) at a flow rate of 1 ml/min. The compounds were detected in the eluant with a Bioanalytical Systems model LC4B dual electrochemical detector using two Au-Hg electrodes in series with potentials of -1.00 V and 0.15 V for the upstream and downstream electrodes, respectively. Analytes were quantified from peak area measurements using authentic external standards.
The tissue concentrations of SAMe and SAH were assayed using reverse-phase HPLC with deproteinized extracts by a modified method of Merali et al. (2000). The mobile phase was 40 mM ammonium phosphate, 8 mM heptane sulfonic acid and 6% acetonitrile (pH 5.0) at a flow rate of 1.0 mL/min. SAMe and SAH were detected using a Waters 740 detector at 254 nm. Authentic and internal (S-adenosylethionine) were used to calibrate the results. Tissue homocysteine (and cysteine) concentrations were determined via HPLC with fluorometric detection, as described by Fortin et al. (1995). Briefly, samples were reduced by 10% tri-n-butylphopine in dimethylformamide, then deproteinized by perchloric acid (10 %) and centrifuged. Thiols in the supernatant were then derivatized with ammonium-7-fluorobenzo-2-oxa-1,3-diazole-4-sulfonate (SBD-F). The mobile phase consisted of 100 mM sodium acetate, 100 mM acetic acid and 2% methanol (pH 4.0). Authentic and internal (N-acetylcysteine) were used to calibrate results.
Immunoblots
Frozen liver samples were homogenized in RIPA buffer [20 mM MOPS ph 7.0, 150 mM NaCl, 1 mM EDTA, 1 % (v/v) Nonidet P-40, 1 % (w/v) Sodium deoxycholate, 0.1 % (w/v) SDS] containing protease, tyrosine phosphatase and serine/threonine phosphatase inhibitor cocktails (Sigma, St Louis, MO). Lysates were sonicated and then subsequently centrifuged for 15 min at 12,000×G. Protein concentration of the supernatants was determined with the Bio-Rad DC Protein Assay (Bio-Rad, Hercules, CA, USA; 40 μg of total protein were mixed with 2×SDS sample loading buffer [125 mM Tris, 4% (w/v) glycine, 0.2% (w/v) bromophenol blue, 10 mM DTT] and incubated at 95°C for 5 min. Samples were loaded onto SDS-polyacrylamide gels containing 10% (w/v) acrylamide, followed by electrophoresis and Western blotting onto PVDF membranes (Hybond P, Amersham Biosciences, Piscataway, NJ, USA). For detection of cyclin D1, rabbit polyclonal antibodies (Cell Signaling, Danvers, MA, USA) were used at the dilutions recommended by the suppliers. Horseradish peroxidase-coupled secondary antibodies were from Pierce (Rockford, IL, USA), chemiluminescence detection reagents from Pierce. The signals were detected employing Hyperfilm™ ECL (Amersham, Buckinghamshire, UK). Quantification was performed with Image Quant analysis.
RNA isolation and real-time RT-PCR
Total RNA was extracted from liver tissue samples by a guanidium thiocyanate-based method (RNA STAT 60 Tel-Test, Ambion, Austin, TX). RNA concentrations were determined spectrophotometrically, and 1 μg total RNA was reverse transcribed using an AMV reverse transcriptase kit (Promega, Madison, WI) and random primers. Primers and probes were purchased as kits (Applied Biosystems, Foster City, CA) and were designed to cross introns to ensure that only cDNA and not genomic DNA was amplified. The fluorogenic MGB probe was labeled with the reporter dye FAM (6-carboxyfluorescein). TaqMan Universal PCR Master Mix (Applied Biosystems, Foster City, CA) was used to prepare the PCR mix. The mixture was optimized for TaqMan reactions and contained AmpliTaq gold DNA polymerase, AmpErase, dNTPs with UTP and a passive reference. Primers and probe were added to a final concentration of 300 nM and 100 nM, respectively. The amplification reactions were carried out in the ABI Prism 7700 sequence detection system (Applied Biosystems) with initial hold steps (50°C for 2 min, followed by 95°C for 10 min) and 50 cycles of a two-step PCR (92°C for 15 sec, 60°C for 1 min). The fluorescence intensity of each sample was measured at each temperature change to monitor amplification of the target gene. The comparative CT method was used to determine fold differences between samples. The comparative CT method determines the amount of target, normalized to an endogenous reference (β-actin) and relative to a calibrator (2-ΔΔCt). The purity of PCR products were verified by gel electrophoresis.
Statistical analyses
Results are reported as means ± SEM (n = 4-6). ANOVA with Bonferroni’s post-hoc test or the Mann-Whitney rank sum test was used for the determination of statistical significance among treatment groups, as appropriate. A p value less than 0.05 was selected before the study as the level of significance.
Results
Arsenic pre-exposure enhances liver damage after LPS
Table I summarizes the effect of arsenic and LPS on growth and liver weights in mice. Arsenic exposure (49 ppm) for 7 months caused a slight, but significant, decrease in growth rates in the mice, resulting in a ∼13% decrease in final body weight at the time of sacrifice (Table I). Despite this decrease in growth rates, arsenic caused no detectable increase in other indices of systemic toxicity (e.g., behavioral changes and hair loss). LPS injection (± arsenic) had no significant effect on final body weights. Liver weights in tap exposed animals (± LPS) were within normal expected ranges. Whereas absolute liver weights were not different between arsenic and tap groups, arsenic exposure caused a ∼15% increase in liver mass when normalized to body weight (Table I). The increase in relative liver weight caused by arsenic was lost in animals also injected with LPS, with organ weights now similar to control values (Table I).
Table I.
Effect of arsenic and LPS
| Tap water | Arsenic | |||
|---|---|---|---|---|
| Saline | LPS | Saline | LPS | |
| Growth Rate* | ||||
| (g/wk) | 2.5 ± 0.1 | 2.4 ± 0.3 | 1.9 ± 0.2b | 2.0 ± 0.2b |
| Body Wt | ||||
| (g) | 30.8 ± 0.9 | 29.3 ± 0.7 | 25.3 ± 0.5b | 26.9 ± 0.9b |
| Liver Wt | ||||
| (g) | 1.3 ± 0.1 | 1.4 ± 0.1 | 1.3 ± 0.1 | 1.2 ± 0.1 |
| (% of BW) | 4.3 ± 0.2 | 4.7 ± 0.2 | 5.0 ± 0.3b | 4.5 ± 0.2a |
growth rates were determined during the linear phase of body weight gain in normal mice (months 1-2 of arsenic exposure).
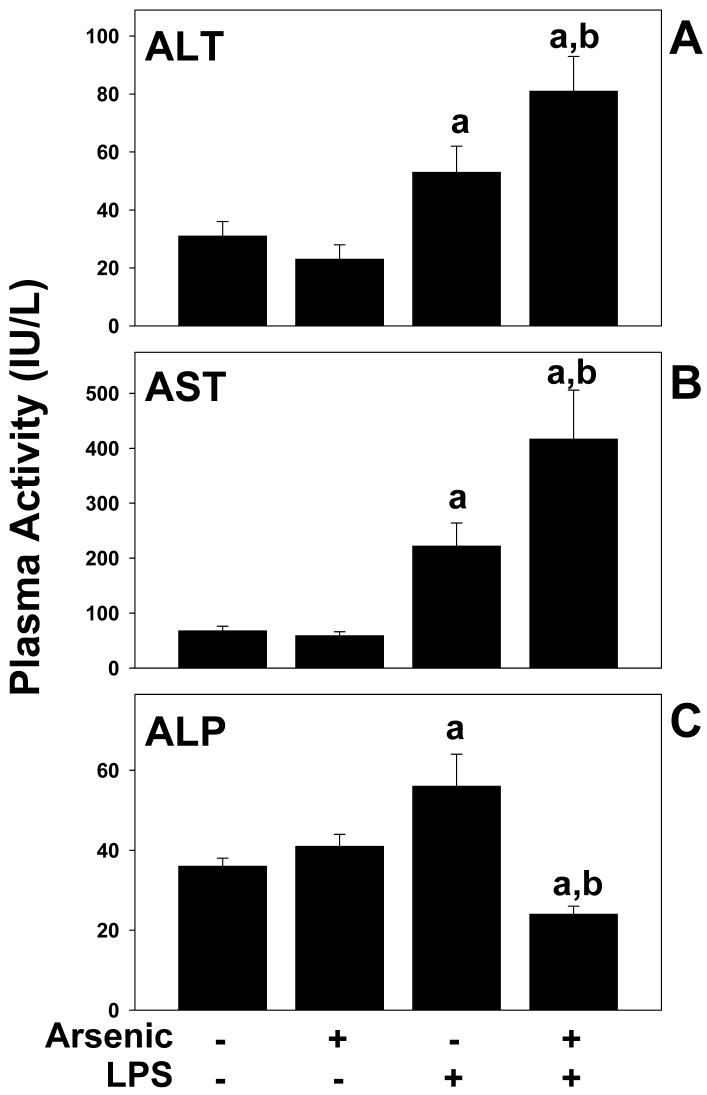
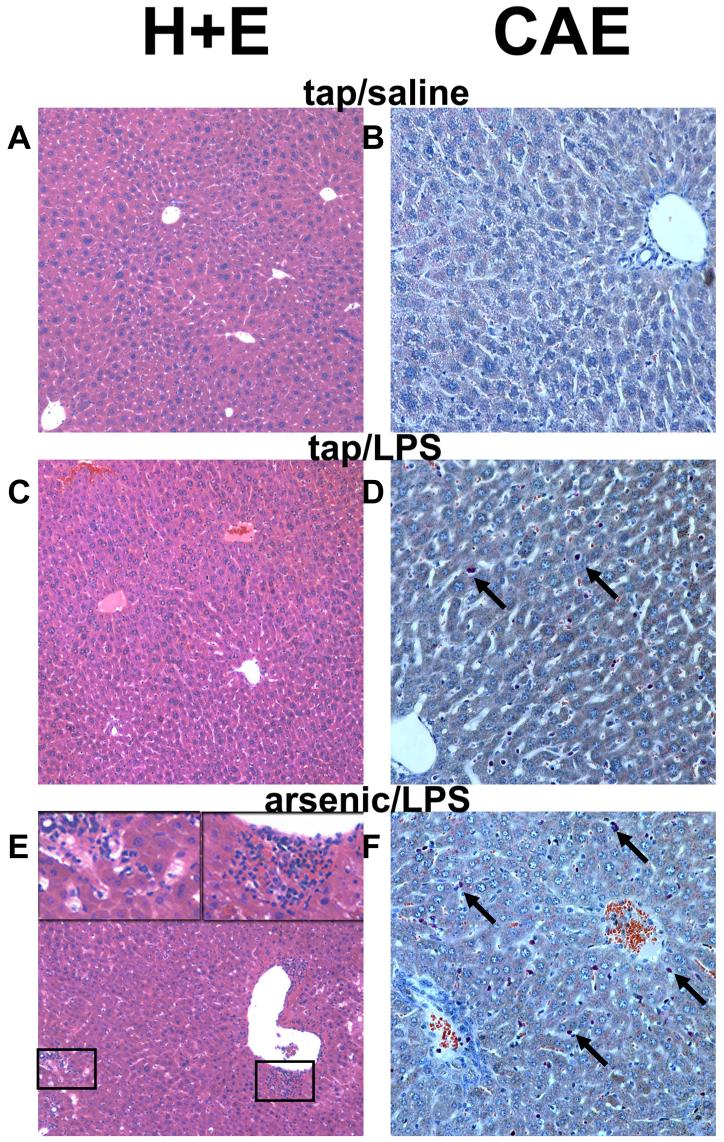
The effect of arsenic on basal and LPS-induced hepatic damage was determined by analysis of serum enzymes (ALT, AST, and ALP; Figure 1) and by histologic assessment (Figures 2 and 3). As expected, injection of LPS into mice consuming normal tap water moderately damaged the liver, as indicated by a significant increase in plasma ALT and AST, by a factor of ∼2 and 3, respectively (Figure 1A and B). LPS also significantly increased plasma ALP by a factor of ∼2 (Figure 1C). No major histologic differences were observed between tap/saline and arsenic/saline groups (Figures 2 and 3); plasma enzyme values were not different between these 2 groups (Figure 1). No major macroscopic changes in hepatic histology were observed after LPS injection (Figure 2C); microscopic changes included some hepatocyte dropout and an increase in inflammatory and necrotic foci (Figure 3, upper panel), and infiltrating neutrophils (Figures 2D and 3, upper panel). Arsenic pre-exposure significantly increased liver damage owing to LPS, as evidenced by increases in ALT and AST (Figure 1A and B). Histologic assessment revealed macroscopic changes, including more necroinflammatory foci (Figure 2E, left inset and Figure 3, upper panel) and a more robust infiltration of neutrophils (Figure 2F and 3, upper panel). Furthermore, arsenic exposure prior to LPS also expanded the portal areas (Figure 2E, right inset and Figure 3, lower panel) in these livers. Interestingly, there was a significant decrease in ALP levels in the plasma (Figure 1C).
Figure 1. Effect of arsenic and LPS on plasma parameters.
Male C57BL/6J mice were exposed to arsenic or tap water and injected with LPS (or saline vehicle) as described in Methods. 24 h after LPS injection the mice were harvested and the plasma ALT, AST and ALP levels were analyzed. Data represent means ± SEM (n = 4-6). a, p < 0.05 compared to the saline injection; b, p < 0.05 compared to animals exposed to tap water.
Figure 2. Photomicrographs of livers following LPS injection.
Representative photomicrographs of hematoxylin and eosin (H+E; 100×, left column) and chloroacetate esterase (CAE; 200×, right column) stains are shown. Arsenic exposure alone caused no detectable histologic changes compared to tap/saline controls (not shown). Insets in the lower left-hand panel depict necroinflammatory areas and portal expansion in the arsenic/LPS group. Arrows in the chloroacetate esterase-stained fields depict individual neutrophils.
Effect of arsenic and LPS on hepatic lipid accumulation
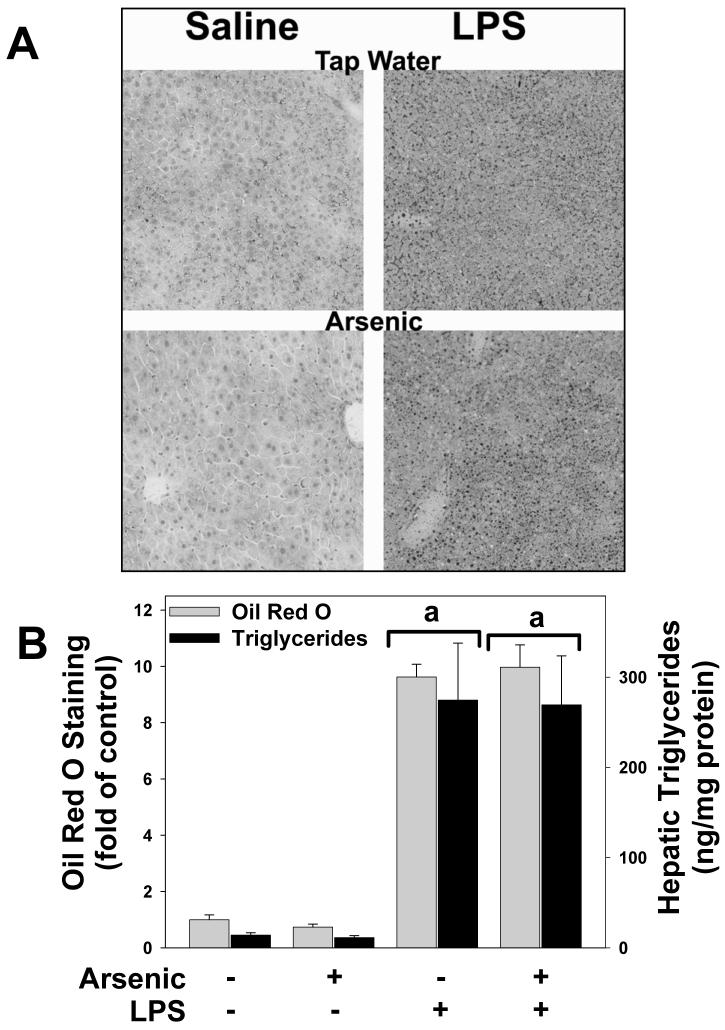
Previous studies have shown that prolonged (>9 months) exposure to arsenic in mice causes hepatic steatosis [e.g.,(Santra et al., 2000)]. The effect of arsenic exposure and LPS on lipid accumulation in liver was therefore determined by histological staining (Oil Red O; Figure 4A and B) and triglyceride measurements (Figure 4B). The results of both analyses showed that whereas LPS injection caused steatosis and triglyceride accumulation, arsenic had no effect on lipid levels in liver, either in the presence or absence of LPS (Figure 4A, left panels; Figure 4B).
Figure 4. Effect of arsenic and LPS on lipid accumulation in liver.
Panel A shows representative photomicrographs depicting Oil Red O staining (red; 200×) in tap/saline (upper left panel), tap/LPS (upper right panel), arsenic/saline (lower left panel) and arsenic/LPS (lower right panel) treatment groups are shown. Panel B shows quantitation of Oil Red O staining (grey bars) and triglyceride levels (black bars) in liver tissue. a, p < 0.05 compared to the saline injection; b, p < 0.05 compared to animals exposed to tap water.
Effect of arsenic and LPS on indices of oxidative stress
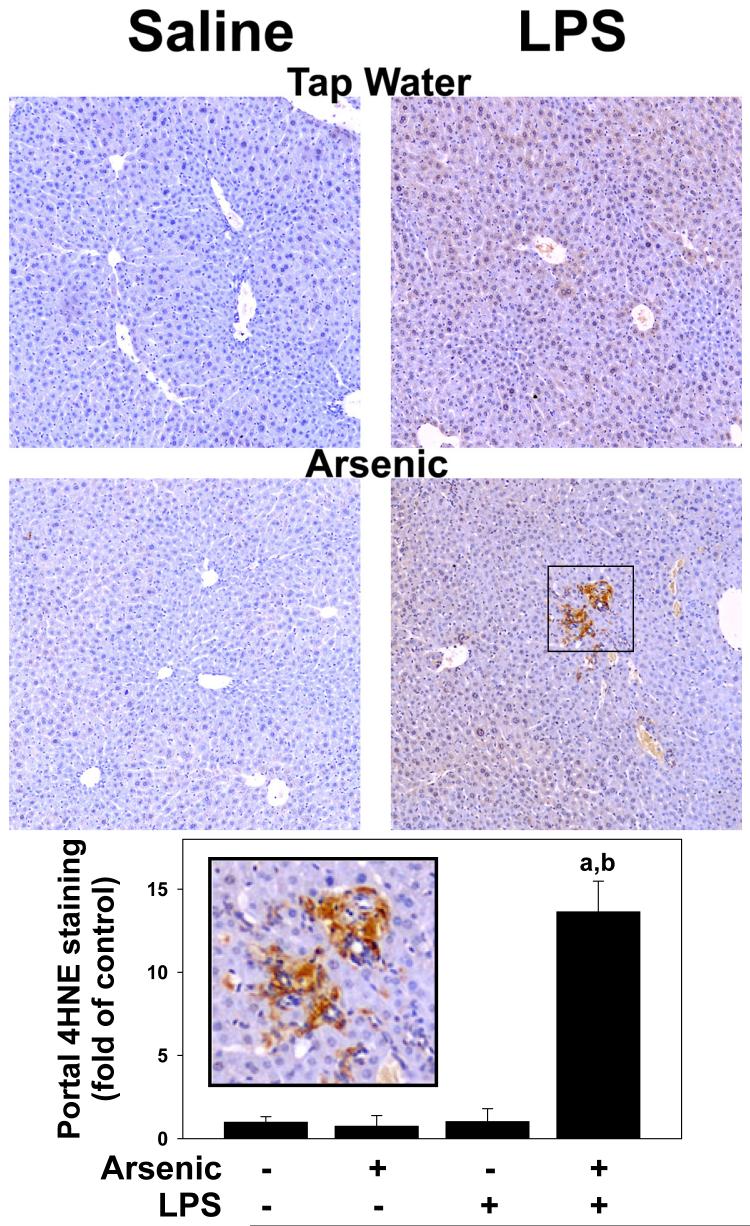
Another mechanism by which arsenic has been proposed to damage the liver is oxidative stress (Kitchin, 2001; Patrick, 2003; Das et al., 2005). Indices of oxidative stress (GSH pools, and 4OH-nonenal adduct formation) were therefore measured in these treatment groups. Chronic arsenic exposure (-LPS) did not detectably increase oxidative stress in liver, with 4OH-nonenal adduct levels (Figure 5A, lower left panel) and GSH levels (Figure 6A and B) similar to animals given tap water. Injection of LPS significantly increased oxidative stress in liver, as evidenced by diffuse 4OH-nonenal adduct formation with staining in practically all hepatocytes (Figure 5, upper right panel). LPS injection also decreased GSH content (Figure 6A).
Figure 5. Arsenic enhances oxidative stress caused by LPS.
Representative photomicrographs (100×) depicted immunohistochemical detection of 4OH-nonenal adduct accumulation (brown) in liver are shown in Panel A. Summary of quantitative image-analysis of 4OH-nonenal adduct accumulation in portal regions is shown in panel B. The inset shows a blow-up of intense 4OH-noneal adduct accumulation in areas of portal expansion. Data represent means ± SEM (n = 4-6). a, p < 0.05 compared to the saline injection; b, p < 0.05 compared to animals exposed to tap water.
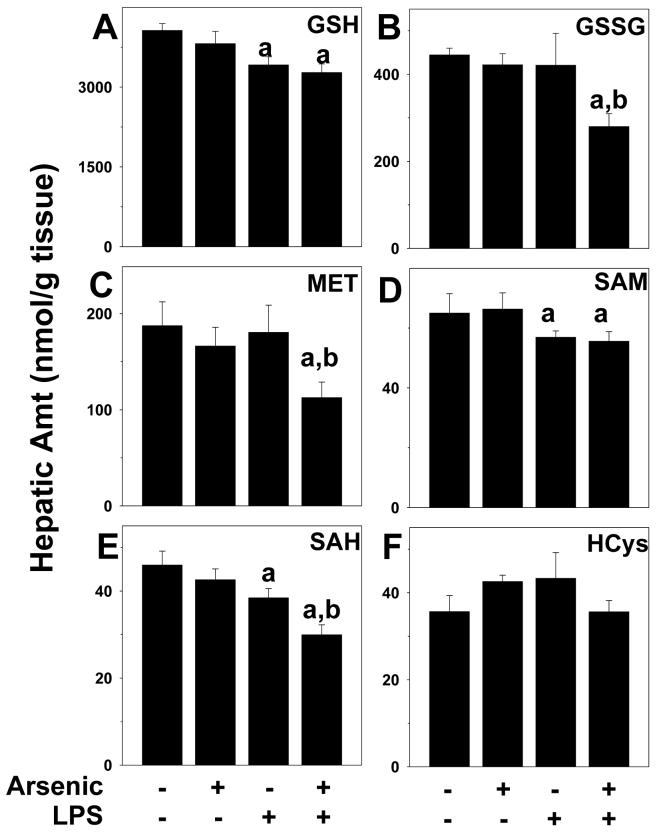
Figure 6. Effect of arsenic and LPS on indices of sulfur and methionine metabolism.
Animals and treatment are as described under Methods. Hepatic levels of reduced (GSH; panel A) and oxidized (GSSG; panel B) glutathione, methionine (MET; panel C), S-adenosylmethionine (SAM; panel D), S-adenosylhomocysteine (SAH; panel E) and homocysteine (HCys; panel F) were determined by HPLC (see Methods). a, p < 0.05 compared to the saline injection; b, p < 0.05 compared to animals exposed to tap water.
Arsenic pre-exposure did not alter the increase in intensity or extent of 4OH-nonenal adducts in hepatocytes caused by LPS (Figure 5, lower right panel). However, there was intense 4OH-nonenal adduct accumulation in areas of portal expansion in livers from arsenic/LPS animals (Figure 5). Arsenic pre-exposure also did not enhance the decrease in reduced GSH caused by LPS (Figure 6A). However, there was a significant ∼40% decrease in GSSG content in arsenic/LPS animals (Figure 6B); the combined effect of LPS and arsenic therefore caused a ∼25% depletion of total GSH pools.
Arsenic enhances depletion of methionine pools caused by LPS
Arsenic has been shown to deplete methyl donors and to inhibit methyl transferases, which can impair cellular defenses against stress (Kitchin, 2001; Patrick, 2003). The effect of arsenic ±LPS on indices of the transmethylation pathway (MET, SAM, SAH and HCys) was determined (Figure 6C-F). Injection of LPS significantly depleted SAM and SAH in liver by ∼10% each (Figure 6D and E), but had no significant effect on other members of the transmethylation pathway. Arsenic exposure alone under these conditions did not significantly affect these indices. In arsenic/LPS animals, there was a significant interaction, with levels of methionine also depleted and a more robust depletion of SAH (Figure 6C and E), leading to a ∼30% depletion of the transmethylation pools.
Alterations in proliferation and/or apoptosis
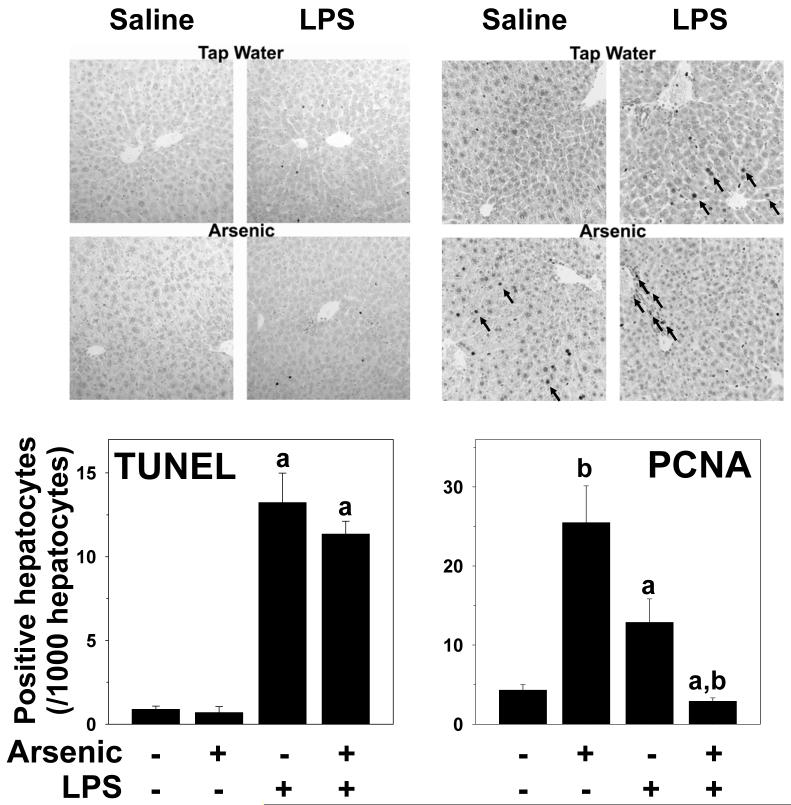
As previously mentioned in this section, arsenic alone caused a ∼15% increase in the relative liver weight (Table I); however, this effect of arsenic was reversed by injection of LPS. To determine the mechanisms by which these opposing effects of arsenic vs. arsenic/LPS occurred, the balance between hepatocyte proliferation (PCNA) and apoptosis (TUNEL) were determined immunohistochemically (Figure 7A and B) and quantitated (Figure 7C and D). LPS increased TUNEL staining in hepatocytes (Figure 7A and C); arsenic had no significant effect on TUNEL staining, either in the presence or absence of LPS (Figure 7A and C). In contrast to TUNEL staining, arsenic (-LPS) increased nuclear staining for PCNA in hepatocytes (Figure 7B, lower left panel) by a factor of ∼5 (Figure 7D). In tap/LPS animals, there was also an increase hepatocyte PCNA staining (Figure 7B, upper right panel) by a factor of ∼2 (Figure 7D). Interestingly, although both arsenic and LPS alone increased hepatocyte PCNA staining, combining the 2 exposures dramatically decreased staining in hepatocytes (Figure 7B, lower right panel) with values lower than control mice (Figure 7D). Interestingly, there was a large increase in the number of PCNA-positive nonparenchymal cells in the portal region in this group (Figure 7B, lower right panel, arrows).
Figure 7. Effect of arsenic and LPS on indices of hepatic apoptosis and proliferation.
Immunohistochemical detection of indices of apoptosis (TUNEL; panel A) and proliferation (PCNA; panel B) were performed as described in methods. Representative photomicrographs (200×) are shown. Panels C and D show summary of quantitation of staining. a, p < 0.05 compared to the saline injection; b, p < 0.05 compared to animals exposed to tap water.
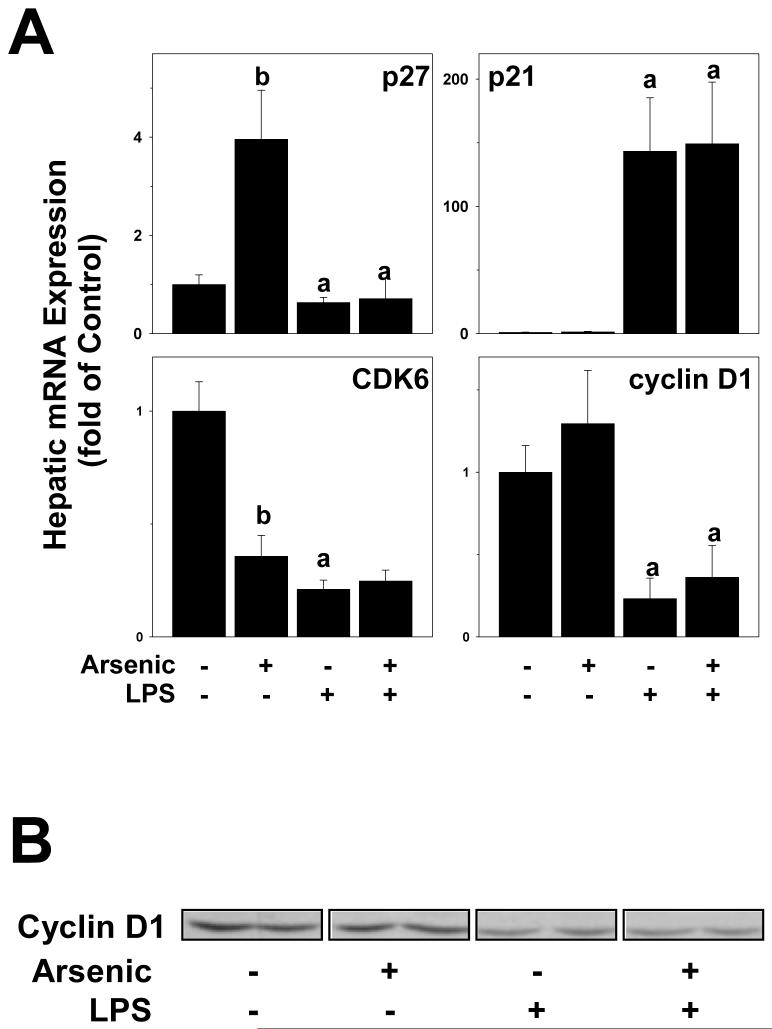
In addition to PCNA staining, hepatic mRNA levels of key mediators of cell cycle progression (p21, p27, cyclin D1 and CDK6) were determined (Figure 8A). Protein levels of cyclin D1 were also determined by Western analysis (Figure 8B). Arsenic exposure significantly increased the p27 mRNA expression and decreased the expression of CDK6 mRNA, while having no effect on the expression of p21 and cyclin D1. Injection of LPS alone caused significant changes in the expression of all of these genes, increasing the expression of p21 and decreasing the expression of p27, CDK6 and cyclin D1 (Figure 8A). There was no additive effect of arsenic and LPS on the mRNA expression of these genes. The protein levels of cyclin D1 were also determined by Western analysis (Figure 8B). LPS decreased cyclin D1 in liver (77 ± 3% of tap/saline values). Whereas arsenic alone did not significantly affect cyclin D1 protein levels, it caused a small but significant enhancement of the decrease caused by LPS (62 ± 6% of control values).
Figure 8. Effect of arsenic and LPS on the expression of Cyclin D1.
Protein levels of cyclin D1 were determined by Western blot. Representative blots (panel A) and summary densitometric quantitation (panel B) are shown. a, p < 0.05 compared to the saline injection; b, p < 0.05 compared to animals exposed to tap water.
Discussion
Subhepatotoxic doses of arsenic enhance liver damage caused by a 2nd hit of LPS
The role that arsenic in drinking water plays in disease is a major concern in the US, because large areas of the country have elevated arsenic in the ground water. Consequently, nearly 4,000 wells providing community water in the U.S. have arsenic levels greater than the current WHO recommended MCL of 10 μg/L (Engel et al., 1994; Frost et al., 2003). Furthermore, even higher arsenic concentrations may be found in private artesian water supplies not regulated by the Safe Drinking Water Act. As mentioned in the Introduction, whereas the liver is a known target organ of chronic arsenic exposure, such effects are observed primarily in regions of the world with high arsenic concentrations in the drinking water [e.g., Bangladesh (Santra et al., 1999)]. Therefore, whether or not the concentrations/doses required to achieve significant hepatotoxicity are relevant to US exposure levels is unclear.
The hypothesis tested in this study was whether arsenic enhances hepatotoxicity owing to a secondary insult, instead of direct liver damage of this metalloid. This hypothesis was tested in mice exposed to lipopolysaccharide (LPS), a Gram-negative bacterial wall product that is often elevated in systemic blood during liver disease (Li et al., 2003), and is employed in basic research as a model hepatotoxicant. Liver damage caused by LPS at this dose is characterized by early inflammation, followed by hepatocyte death (see Figures 1-3). The results summarized in this study demonstrate that chronic arsenic exposure to mice at doses that are not overtly hepatotoxic, per se, enhanced liver damage caused by LPS. However, not all indices of liver damage were enhanced by arsenic exposure. Specifically, serum activity of ALP actually decreased in the arsenic/LPS compared to the LPS alone group (see Figure 1C). Whereas reasons for this effect are unclear, it may be caused by displacement of the brush border cells (which produce ALP) by the portal expansion (Figures 2E and 3, lower panel). These results therefore support the hypothesis that arsenic exposure can enhance liver damage caused by LPS as “2nd hit.” It should be noted that LPS-induced organ damage is not specific to the liver. These results may therefore represent a preferential shift of toxicity of LPS to the liver rather than specifically increasing hepatotoxicity, per se.
Potential mechanisms by which arsenic enhances liver damage caused by LPS
The proposed mechanisms by which arsenic directly damages the liver include dysregulated lipid metabolism causing steatosis (Santra et al., 2000), oxidative stress (Kitchin, 2001; Patrick, 2003; Das et al., 2005), enhanced inflammation (Chen et al., 2004), and alterations in cellular methylation status (Chen et al., 2004). Importantly, these are shared mechanisms by which LPS is proposed to damage the liver. The effect of arsenic and LPS on indices of these potential mechanisms was therefore determined. Arsenic did not enhance hepatic lipid accumulation, neither in the absence nor in the presence of LPS (Figure 4), indicating that the enhanced sensitivity to LPS caused by arsenic is not owing to increased steatosis. Arsenic did enhance 4OH-nonenal adduct accumulation in liver, but only in portal areas (Figures 5), and did deplete antioxidant pools (e.g., GSH pools; Figure 6) and recruitment of prooxidant inflammatory cells (Figures 2 and 3) caused by LPS. Furthermore, the depletion of the transmethylation pools caused by LPS was enhanced by arsenic pre-exposure (Figure 6). Taken together, these data suggest that inflammation, potentially leading to enhanced oxidative stress, is involved at least in part in the mechanism by which arsenic enhances liver damage caused by LPS. Interestingly, arsenic enhanced hepatocyte necrosis (Figures 2 and 3) without a concomitant increase in TUNEL staining (an index of apoptosis; Figure 7). Apoptosis and necrosis often increase in tandem in models of liver damage, and suggests that necrosis is secondary to proapoptotic signaling (i.e., “apopnecrosis”). However, such a parallel increase in these indices of cell death does not always occur in hepatotoxicity. For example, in another 2-hit model (alcohol + LPS), Koteish et al. (2002) observed an increase in necrosis absent an increase in apoptosis. Such an effect often the hallmark of frank (or oncotic) necrosis [see (Malhi et al., 2006) for review].
The effect of arsenic and LPS on indices of hepatocyte division
An interesting finding in this study is that whereas chronic arsenic alone increased liver weight, this increase was rapidly lost after exposure to LPS (Table I). Because arsenic did not increase lipid accumulation either in the presence or absence of LPS (Figure 4), these observed changes in liver weight cannot be explained by differences in hepatocyte hypertrophy caused by steatosis. The difference in liver weights also could not be explained by an increase in hepatocyte loss mediated by apoptosis, because arsenic did not significantly affect this parameter (Figure 7A and B). However, arsenic exposure without LPS robustly increased the number of PCNA positive hepatocytes in the liver, which is indicative of proliferation (Figure 7B and D). Whereas LPS without arsenic exposure also increased PCNA-positive hepatocytes (albeit to a lesser extent than arsenic alone), the combined effect of arsenic plus LPS led to a nearly complete inhibition of hepatocyte proliferation. Taken together, these results suggest the hepatomegaly caused by arsenic alone is a consequence of hepatocyte hyperplasia. Furthermore, the impaired proliferation in the arsenic/LPS group, coupled with hepatocyte loss caused by cell death likely explains the rapid loss of liver weight in arsenic exposed animals subsequently injected with LPS.
Previous studies have indicated that arsenic may impair normal cell cycle progression. For example, arsenic delays progression through each cell cycle phase, and also causes an arrest at the G1/S and G2/M transitions (McCabe, Jr. et al., 2000; McCollum et al., 2005; McNeely et al., 2006; Taylor et al., 2006). Furthermore, Suzuki and Tsukamoto (2006) demonstrated that acute arsenic exposure impaired the normal proliferative response in rat liver after partial hepatectomy. One of the variables associated with this impaired response was an upregulation of p21c1p1/waf1 (Suzuki and Tsukamoto, 2006). Work by others [e.g., (Torbenson et al., 2002)] have shown that impaired regeneration of fatty livers is associated with decreased cyclin D1 expression and PCNA incorporation coupled with upregulated p21c1p1/waf1, suggesting a G1/S transition block. The effect of arsenic on key mediators of G1/S and G2/M transitions (p27, p21, CDK6 and cyclin D1) were therefore determined (Figure 7). Arsenic alone increased the expression levels of p27, as well as decreased the expression of CDK6 (Figure 8A). Although the effect of LPS on these indices of cell cycle progression was not altered by arsenic (Figure 8), these results need to be taken into context of the PCNA data (Figure 7). For example, the loss of cyclin D1 in tap/LPS animals may represent the rapid degradation of this protein during S-phase (Caldon et al., 2006), as indicated by PCNA staining in this group. In contrast, the lack of PCNA staining, coupled with the cyclin D1 depletion in the arsenic/LPS group (Table I) suggests that arsenic may impair the G1/S transition, analogous to previous mechanisms observed with fatty livers (Torbenson et al., 2002).
Although hepatocytes are considered ‘terminally differentiated,’ they do have the ability to divide to repopulate the liver in response to injury. However, under some conditions, hepatic progenitor cells may also contribute to repair and repopulation of damaged liver [see (Sell, 2001) for review]. The classic example is partial hepatectomy in animals pretreated with 2-acetylaminofluorene (AAF), an inhibitor of hepatocyte proliferation (Trautwein et al., 1999); under these conditions, there is a significant proliferation of hepatic progenitor cells (Golding et al., 1995). Hepatocyte regeneration after partial hepatectomy is also impaired in fatty livers (Yang et al., 2001), and leads to the accumulation of hepatic progenitor cells (Yang et al., 2004). These progenitor cells tend to localize in the portal regions of the liver. Here, under conditions where hepatocyte proliferation was impaired, there was an increase in dividing cells in the portal region (Figure 7C, lower right panel), which likely explains the portal expansion (Figures 2-3) observed under these conditions.
Summary and Conclusions
There are many gaps in our understanding of the relative safety of arsenic to the human population. Importantly, most studies to date have focused on the effect of arsenic alone and not taken into consideration risk-modifying factors. Furthermore, even fewer studies have tested the possibility that arsenic may be a risk modifying factor for other diseases. It was shown here that arsenic enhances experimental LPS-induced liver injury in mice. Elevated LPS, with or without accompanying sepsis, is a common event in infection or stress. Furthermore, whereas high bolus concentrations of endotoxin are well-known to be directly hepatotoxic, numerous liver diseases (e.g., fatty liver diseases) are also suspected to involved chronic low-dose endotoxemia (Arteel et al., 2003; Solga et al., 2003). These results therefore suggest that the relative risk of hepatic damage caused by arsenic exposure may have to be modified to take into account other mitigating factors, such as underlying fatty liver disease.
There are significant differences between the absorption and elimination of arsenic between rodents and humans, making direct comparison of exposure levels difficult between the species; for example, exposure of rodents to 50 ppm arsenic resulted in plasma levels that were only ∼10-fold higher than humans consuming 50-100 ppb (Hall et al., 2006). Nevertheless, the exposure level (49 ppm) of arsenic used in this study, while in the range of published rodent studies [e.g., (Santra et al., 2000; Chen et al., 2004)], is still high relative to human exposure in the US (ppb). Therefore, whereas these results serve as proof-of-concept of the potential interaction between arsenic and other hepatoxicants, future studies are required to validate these findings with lower exposures of arsenic in more chronic models of liver diseases.
Acknowledgments
This work was supported, in part, by a grant from the National Institute of Alcohol Abuse and Alcoholism (NIAAA) and the National Institute of Environmental Health Sciences (NIEHS).
Abbreviations
- ALP
alkaline phosphatase
- ALT
alanine aminotransferase
- AST
aspartate aminotransferase
- CAE
chloroacetate esterase
- CDK
cyclin-dependent kinase
- GSH
glutathione (reduced form)
- GSSG
glutathione disulfide
- HCys
homocysteine
- LPS
lipopolysaccharide
- MET
methionine
- PCNA
proliferating cell nuclear antigen
- SAH
S-adenosyl homocysteine
- SAM
S-adenosyl methionine
- TUNEL
terminal dUTP nick-end labeling
Footnotes
Publisher's Disclaimer: This is a PDF file of an unedited manuscript that has been accepted for publication. As a service to our customers we are providing this early version of the manuscript. The manuscript will undergo copyediting, typesetting, and review of the resulting proof before it is published in its final citable form. Please note that during the production process errors may be discovered which could affect the content, and all legal disclaimers that apply to the journal pertain.
References
- Arteel G, Marsano L, Mendez C, Bentley F, McClain CJ. Advances in alcoholic liver disease. Best. Pract. Res. Clin. Gastroenterol. 2003;17:625–647. doi: 10.1016/s1521-6918(03)00053-2. [DOI] [PubMed] [Google Scholar]
- Arteel GE, Thurman RG, Yates JA, Raleigh JA. Evidence that hypoxia markers detect oxygen gradients in liver: Pimonidazole and retrograde perfusion of rat liver. Br. J. Cancer. 1995;72:889–895. doi: 10.1038/bjc.1995.429. [DOI] [PMC free article] [PubMed] [Google Scholar]
- Bergheim I, Guo L, Davis MA, Lambert JC, Beier JI, Duveau I, Luyendyk JP, Roth RA, Arteel GE. Metformin prevents alcohol-induced liver injury in the mouse: Critical role of plasminogen activator inhibitor-1. Gastroenterology. 2006;130:2099–2112. doi: 10.1053/j.gastro.2006.03.020. [DOI] [PMC free article] [PubMed] [Google Scholar]
- Caldon CE, Daly RJ, Sutherland RL, Musgrove EA. Cell cycle control in breast cancer cells. J. Cell Biochem. 2006;97:261–274. doi: 10.1002/jcb.20690. [DOI] [PubMed] [Google Scholar]
- Chen H, Li S, Liu J, Diwan BA, Barrett JC, Waalkes MP. Chronic inorganic arsenic exposure induces hepatic global and individual gene hypomethylation: implications for arsenic hepatocarcinogenesis. Carcinogenesis. 2004;25:1779–1786. doi: 10.1093/carcin/bgh161. [DOI] [PubMed] [Google Scholar]
- Chen TS, Richie JP, Jr., Lang CA. Life span profiles of glutathione and acetaminophen detoxification. Drug Metab. Dispos. 1990;18:882–887. [PubMed] [Google Scholar]
- Das S, Santra A, Lahiri S, Guha Mazumder DN. Implications of oxidative stress and hepatic cytokine (TNF-alpha and IL-6) response in the pathogenesis of hepatic collagenesis in chronic arsenic toxicity. Toxicol. Appl. Pharmacol. 2005;204:18–26. doi: 10.1016/j.taap.2004.08.010. [DOI] [PubMed] [Google Scholar]
- Day CP, James OF. Steatohepatitis: a tale of two “hits”? Gastroenterology. 1998;114:842–845. doi: 10.1016/s0016-5085(98)70599-2. [DOI] [PubMed] [Google Scholar]
- Engel RR, Smith AH. Arsenic in drinking water and mortality from vascular disease: an ecologic analysis in 30 counties in the United States. Arch. Environ. Health. 1994;49:418–427. doi: 10.1080/00039896.1994.9954996. [DOI] [PubMed] [Google Scholar]
- Fortin LJ, Genest J. Measurement of homocyst(e)ine in the prediction of arteriosclerosis. Clin. Biochem. 1995;28:155–162. doi: 10.1016/0009-9120(94)00073-5. [DOI] [PubMed] [Google Scholar]
- Frost FJ, Muller T, Petersen HV, Thomson B, Tollestrup K. Identifying US populations for the study of health effects related to drinking water arsenic. J. Expo. Anal. Environ. Epidemiol. 2003;13:231–239. doi: 10.1038/sj.jea.7500275. [DOI] [PubMed] [Google Scholar]
- Golding M, Sarraf CE, Lalani EN, Anilkumar TV, Edwards RJ, Nagy P, Thorgeirsson SS, Alison MR. Oval cell differentiation into hepatocytes in the acetylaminofluorene-treated regenerating rat liver. Hepatology. 1995;22:1243–1253. doi: 10.1016/0270-9139(95)90635-5. [DOI] [PubMed] [Google Scholar]
- Gujral JS, Liu J, Farhood A, Hinson JA, Jaeschke H. Functional importance of ICAM-1 in the mechanism of neutrophil-induced liver injury in bile duct-ligated mice. Am. J. Physiol. Gastrointest. Liver Physiol. 2004;286:G499–G507. doi: 10.1152/ajpgi.00318.2003. [DOI] [PubMed] [Google Scholar]
- Guo L, Richardson KS, Tucker LM, Doll MA, Hein DW, Arteel GE. Role of the renin-angiotensin system in hepatic ischemia reperfusion injury in rats. Hepatology. 2004;40:583–589. doi: 10.1002/hep.20369. [DOI] [PubMed] [Google Scholar]
- Hall M, Chen Y, Ahsan H, Slavkovich V, van Geen A, Parvez F, Graziano J. Blood arsenic as a biomarker of arsenic exposure: results from a prospective study. Toxicology. 2006;225:225–233. doi: 10.1016/j.tox.2006.06.010. [DOI] [PubMed] [Google Scholar]
- Kitchin KT. Recent advances in arsenic carcinogenesis: modes of action, animal model systems, and methylated arsenic metabolites. Toxicol. Appl. Pharmacol. 2001;172:249–261. doi: 10.1006/taap.2001.9157. [DOI] [PubMed] [Google Scholar]
- Koteish A, Yang S, Lin H, Huang X, Diehl AM. Chronic ethanol exposure potentiates lipopolysaccharide liver injury despite inhibiting Jun N-terminal kinase and caspase 3 activation. J. Biol. Chem. 2002;277:13037–13044. doi: 10.1074/jbc.M101632200. [DOI] [PubMed] [Google Scholar]
- Li Z, Diehl AM. Innate immunity in the liver. Curr. Opin. Gastroenterology. 2003;19:565–571. doi: 10.1097/00001574-200311000-00009. [DOI] [PubMed] [Google Scholar]
- Malhi H, Gores GJ, Lemasters JJ. Apoptosis and necrosis in the liver: a tale of two deaths? Hepatology. 2006;43:S31–S44. doi: 10.1002/hep.21062. [DOI] [PubMed] [Google Scholar]
- Mazumder DN. Effect of chronic intake of arsenic-contaminated water on liver. Toxicol. Appl. Pharmacol. 2005;206:169–175. doi: 10.1016/j.taap.2004.08.025. [DOI] [PubMed] [Google Scholar]
- McCabe MJ, Jr., Singh KP, Reddy SA, Chelladurai B, Pounds JG, Reiners JJ, Jr., States JC. Sensitivity of myelomonocytic leukemia cells to arsenite-induced cell cycle disruption, apoptosis, and enhanced differentiation is dependent on the inter-relationship between arsenic concentration, duration of treatment, and cell cycle phase. J. Pharmacol. Exp. Ther. 2000;295:724–733. [PubMed] [Google Scholar]
- McCollum G, Keng PC, States JC, McCabe MJ., Jr. Arsenite delays progression through each cell cycle phase and induces apoptosis following G2/M arrest in U937 myeloid leukemia cells. J. Pharmacol. Exp. Ther. 2005;313:877–887. doi: 10.1124/jpet.104.080713. [DOI] [PubMed] [Google Scholar]
- McKim SE, Konno A, Gabele E, Uesugi T, Froh M, Sies H, Thurman RG, Arteel GE. Cocoa extract protects against early alcohol-induced liver injury in the rat. Arch. Biochem. Biophys. 2002;406:40–46. doi: 10.1016/s0003-9861(02)00425-3. [DOI] [PubMed] [Google Scholar]
- McNeely SC, Xu X, Taylor BF, Zacharias W, McCabe MJ, Jr., States JC. Exit from arsenite-induced mitotic arrest is p53 dependent. Environ. Health Perspect. 2006;114:1401–1406. doi: 10.1289/ehp.8969. [DOI] [PMC free article] [PubMed] [Google Scholar]
- Merali S, Vargas D, Franklin M, Clarkson AB. S-adenosylmethionine and Pneumocystis carinii. J. Biol. Chem. 2000;275:14958–14963. doi: 10.1074/jbc.275.20.14958. [DOI] [PubMed] [Google Scholar]
- National Research Council . Arsenic in drinking water. National academy press; Washington, DC: 1999. [Google Scholar]
- National Research Council . Arsenic in drinking water: 2001 update. National Academy Press; Washington, DC: 2001. [PubMed] [Google Scholar]
- Patrick L. Toxic metals and antioxidants: Part II. The role of antioxidants in arsenic and cadmium toxicity. Altern. Med. Rev. 2003;8:106–128. [PubMed] [Google Scholar]
- Richie JP, Lang CA. The determination of glutathione, cyst(e)ine, and other thiols and disulfides in biological samples using high-performance liquid chromatography with dual electrochemical detection. Anal. Biochem. 1987;163:9–15. doi: 10.1016/0003-2697(87)90085-6. [DOI] [PubMed] [Google Scholar]
- Santra A, Das GJ, De BK, Roy B, Guha Mazumder DN. Hepatic manifestations in chronic arsenic toxicity. Indian J. Gastroenterol. 1999;18:152–155. [PubMed] [Google Scholar]
- Santra A, Maiti A, Das S, Lahiri S, Charkaborty SK, Mazumder DN. Hepatic damage caused by chronic arsenic toxicity in experimental animals. J. Toxicol. Clin. Toxicol. 2000;38:395–405. doi: 10.1081/clt-100100949. [DOI] [PubMed] [Google Scholar]
- Sell S. Heterogeneity and plasticity of hepatocyte lineage cells. Hepatology. 2001;33:738–750. doi: 10.1053/jhep.2001.21900. [DOI] [PubMed] [Google Scholar]
- Smith AH, Hopenhayn-Rich C, Bates MN, Goeden HM, Hertz-Picciotto I, Duggan HM, Wood R, Kosnett MJ, Smith MT. Cancer risks from arsenic in drinking water. Environ. Health Perspect. 1992;97:259–67. 259–267. doi: 10.1289/ehp.9297259. [DOI] [PMC free article] [PubMed] [Google Scholar]
- Solga SF, Diehl AM. Non-alcoholic fatty liver disease: lumen-liver interactions and possible role for probiotics. J. Hepatol. 2003;38:681–687. doi: 10.1016/s0168-8278(03)00097-7. [DOI] [PubMed] [Google Scholar]
- Straub AC, Stolz DB, Ross MA, Hernandez-Zavala A, Soucy NV, Klei LR, Barchowsky A. Arsenic stimulates sinusoidal endothelial cell capillarization and vessel remodeling in mouse liver. Hepatology. 2007;45:205–212. doi: 10.1002/hep.21444. [DOI] [PMC free article] [PubMed] [Google Scholar]
- Suzuki T, Tsukamoto I. Arsenite induces apoptosis in hepatocytes through an enhancement of the activation of Jun N-terminal kinase and p38 mitogen-activated protein kinase caused by partial hepatectomy. Toxicol. Lett. 2006;165:257–264. doi: 10.1016/j.toxlet.2006.05.004. [DOI] [PubMed] [Google Scholar]
- Taylor BF, McNeely SC, Miller HL, Lehmann GM, McCabe MJ, Jr., States JC. p53 suppression of arsenite-induced mitotic catastrophe is mediated by p21CIP1/WAF1. J. Pharmacol. Exp. Ther. 2006;318:142–151. doi: 10.1124/jpet.106.103077. [DOI] [PubMed] [Google Scholar]
- Torbenson M, Yang SQ, Liu HZ, Huang J, Gage W, Diehl AM. STAT-3 overexpression and p21 up-regulation accompany impaired regeneration of fatty livers. Am. J. Pathol. 2002;161:155–161. doi: 10.1016/S0002-9440(10)64167-3. [DOI] [PMC free article] [PubMed] [Google Scholar]
- Trautwein C, Will M, Kubicka S, Rakemann T, Flemming P, Manns MP. 2-acetaminofluorene blocks cell cycle progression after hepatectomy by p21 induction and lack of cyclin E expression. Oncogene. 1999;18:6443–6453. doi: 10.1038/sj.onc.1203045. [DOI] [PubMed] [Google Scholar]
- van Goor H, Gerrits PO, Grond J. The application of lipid-soluble stains in plastic-embedded sections. Histochemistry. 1986;85:251–253. doi: 10.1007/BF00494811. [DOI] [PubMed] [Google Scholar]
- Waalkes MP, Liu J, Chen H, Xie Y, Achanzar WE, Zhou YS, Cheng ML, Diwan BA. Estrogen signaling in livers of male mice with hepatocellular carcinoma induced by exposure to arsenic in utero. J. Natl. Cancer Inst. 2004;96:466–474. doi: 10.1093/jnci/djh070. [DOI] [PubMed] [Google Scholar]
- Waalkes MP, Liu J, Ward JM, Diwan BA. Enhanced urinary bladder and liver carcinogenesis in male CD1 mice exposed to transplacental inorganic arsenic and postnatal diethylstilbestrol or tamoxifen. Toxicol. Appl. Pharmacol. 2006;215:295–305. doi: 10.1016/j.taap.2006.03.010. [DOI] [PubMed] [Google Scholar]
- Yang S, Koteish A, Lin H, Huang J, Roskams T, Dawson V, Diehl AM. Oval cells compensate for damage and replicative senescence of mature hepatocytes in mice with fatty liver disease. Hepatology. 2004;39:403–411. doi: 10.1002/hep.20082. [DOI] [PubMed] [Google Scholar]
- Yang SQ, Lin HZ, Lane MD, Clemens M, Diehl AM. Obesity increases sensitivity to endotoxin liver injury: implications for the pathogenesis of steatohepatitis. Proc. Natl. Acad. Sci. U.S.A. 1997;94:2557–2562. doi: 10.1073/pnas.94.6.2557. [DOI] [PMC free article] [PubMed] [Google Scholar]
- Yang SQ, Lin HZ, Mandal AK, Huang J, Diehl AM. Disrupted signaling and inhibited regeneration in obese mice with fatty livers: implications for nonalcoholic fatty liver disease pathophysiology. Hepatology. 2001;34:694–706. doi: 10.1053/jhep.2001.28054. [DOI] [PubMed] [Google Scholar]


