Abstract
Cryo-electron microscopy single particle analysis shows limited resolution due to poor alignment precision of noisy images taken under low electron exposure. Certain advantages can be obtained by assembling proteins into two-dimensional (2D) arrays since protein particles are locked into repetitive orientations, thus improving alignment precision. We present a labeling method to prepare protein 2D arrays using gold nanoparticles (NPs) interconnecting genetic tag sites on proteins. As an example, Mycobacterium tuberculosis 20S proteasomes tagged with 6x-histidine were assembled into 2D arrays using 3.9-nm Au NPs functionalized with nickel-nitrilotriacetic acid. The averaged top-view images from the array particles showed higher resolution (by 6–8 Å) compared to analysis of single particles. The correct 7-fold symmetry was also evident by using array particles whereas it was not clear by analysis of a comparable number of single particles. The applicability of this labeling method for three-dimensional reconstruction of biological macromolecules is discussed.
Keywords: proteasome, gold nanoparticle, self-assembly, cryo-electron microscopy, single particle reconstruction
1. Introduction
Cryo-electron microscopy (cryo-EM) single particle analysis, two-dimensional (2D) crystallography, and tomography are emerging techniques to solve three-dimensional (3D) structures of biological macromolecules and understand their dynamic function. The structural resolution of single particle reconstruction depends on protein size, number, and symmetry due to low signal-to-noise (S/N) ratio of cryo-EM images under low electron exposure (Frank, 2002; van Heel et al., 2000; Wang and Sigworth, 2006). Gold nanoparticle (NP) labeling techniques have proven to be an important complementary tool for protein structural analysis because Au NPs provide strong contrast in noisy protein images (Hainfeld and Powell, 2000). Functionalized Au NPs can specifically bind to naturally occurring or genetically engineered amino acid residues exposed on protein surfaces (Hainfeld and Furuya, 1992; Hainfeld et al., 1999; Safer, 1999). This site-specific single-cluster labeling of a protein is convenient to identify and localize the positions of specific chemical species or binding sites, subunits, and domains of the protein (Al-Bassam et al., 2002; Asturias et al., 2005; Boisset et al., 1992; Buchel et al., 2001; Datta et al., 2005; Kikkawa et al., 2000; Montesano-Roditis et al., 2001; Rappas et al., 2005; Wagenknecht et al., 1994). It has been proposed that site-specific multiple-cluster labeling of a protein could enable the precise determination of protein orientations, therefore improving resolution of single particle reconstruction (Jensen and Kornberg, 1998). Recent experimental progress to test this hypothesis has been made in labeling influenza neuraminidase using four single chain variable fragment (scFv)-Au NP conjugates (Ackerson et al., 2006).
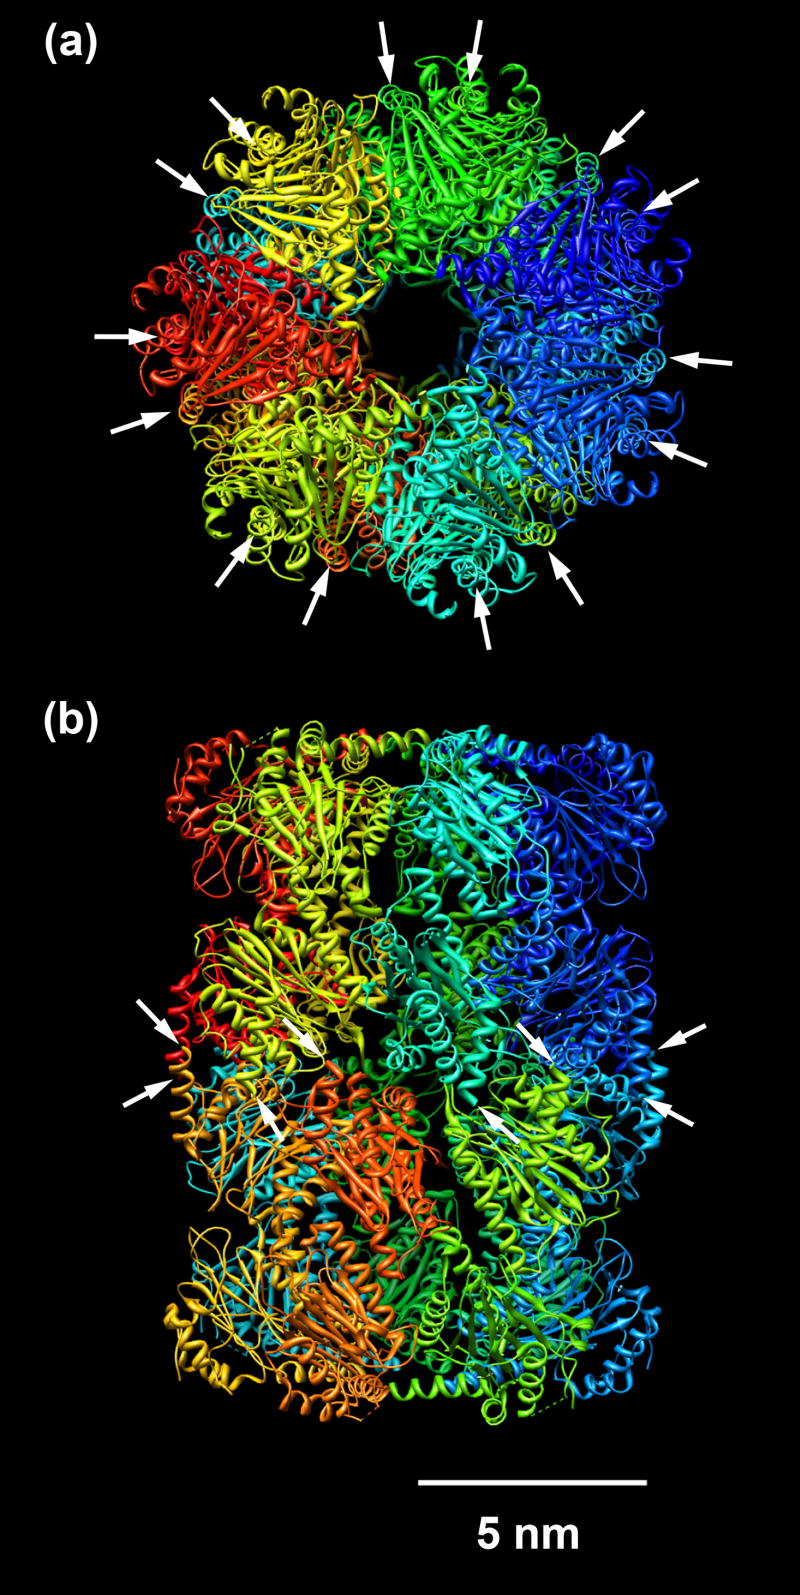
Electron crystallography of highly-ordered protein 2D crystals can reach a quasi-atomic resolution even along the direction normal to crystal membranes regardless of the missing cone effect (Henderson and Unwin, 1975; Murata et al., 2000). Functionalized Au NPs have shown to be excellent scaffolds for assembling proteins into ordered icosahedral shells (Sun et al., 2007). Herein, we report a labeling technique of using Au NPs to assemble proteins into 2D arrays by site-specific binding to genetic tag sites on proteins, and discuss its application for cryo-EM image analysis and structural reconstruction of proteins. As an example, we used 6x-histidine (His) tagged mycobacterium tuberculosis (Mtb) 20S proteasome (a 750-kDa complex) and 3.9-nm Au NPs functionalized with nickel-nitrilotriacetic acid (Ni-NTA). This D7-symmetric cylindrical protein has a stack of four rings, αββα, and each layer has seven identical subunits (Hu et al., 2006). A 6x-His tag was placed in the C-terminus of each β subunit, thus creating seven pairs of binding motifs that are uniformly dispersed around the periphery of the two central layers (Fig. 1). Our previous results showed that the proteasomes were assembled into 2D arrays with a 1:1 stoichiometry between Au NP and proteasome when incubated with Ni-NTA Au NPs (Hu et al., 2007). In this study, image analysis showed that averaged top-view images from the proteasome arrays gave more accurate structural information at a higher resolution using fewer protein particles than those from the single particles without Au NPs. This distinctive labeling method locks protein orientation, produces high visibility for cryo-EM, and enables collection of close-to-focus data, therefore facilitating protein structural analysis.
Fig. 1.
Structure of the Mtb 20S proteasome (PDB ID: 2FHG) (Hu et al., 2006). (a) Top-view image showing 7-fold symmetry. Arrows indicate the distribution of fourteen 6x-His tags around the protein periphery. (b) Side-view image showing four layers. Arrows indicate the positions of eight 6x-His tags at the C-terminus of β subunits located at the two center layers. The remaining six 6x-His tags hidden in the background are not shown here.
2. Materials and methods
2.1. Materials
All chemicals, except where noted, were purchased from Sigma-Aldrich Inc., and used without further purification.
2.2. Synthesis of Ni-NTA Au NPs and assembly of Mtb 20S proteasomes
Ni-NTA functionalized Au NPs were synthesized following our published method (Hu et al., 2007). In brief, hydrogen tetrachloroaurate (HAuCl4) was reduced using sodium borohydride (NaBH4) in the presence of L-glutathione (γ-glu-cys-gly, GSH) and (1S)-N-[5-[(4-Mercaptobutanoyl)amino]-1-carboxypentyl]iminodiacetic (Lys-NTA-SH) at pH 7.0, followed by treatment with a solution of NiCl2 to convert Au NPs into Ni-NTA Au NPs. Transmission electron microscopy (TEM) analysis from 400 NPs indicated that the Au NPs have an average size of 3.9 nm with a standard deviation of 0.7 nm (Supplementary Fig. 1).
NP-proteasome binding complexes were prepared by mixing them in a 2:1 (NP:proteasome) molar ratio in buffer solutions. A 5-μL (4.3 mg/mL, 0.028 nmol) proteasome solution in 10 mM phosphate buffered saline (PBS, containing 150 mM NaCl) at pH 7.5 was added to a 30-μL (0.17 mg/mL, 0.014 nmol) aqueous solution of 3.9-nm Ni-NTA Au NPs, followed by incubation at 4 °C for 2–3 days (Hu et al., 2007). This solution was used for TEM analysis.
2.3. Synchrotron radiation circular dichroism (SRCD) spectroscopy
A 40-μL (0.5 mg/mL) NP-proteasome solution was placed in a quartz cuvette with a 100-μm pathlength. SRCD spectra were recorded at 4 °C within a vacuum ultraviolet wavelength range of 170–300 nm using a synchrotron source and averaged over four scans. The baseline was subtracted using an Au NP solution as the reference. The absorption unit was converted into mean-residue molar differential extinction coefficient, Δε, in M−1 cm−1 using the following equation:
where ΔA is the experimentally observed difference in adsorption, MW is the molecular weight, c is the protein concentration in mg/mL, d is the cuvette pathlength in cm, and N is the number of peptide bonds in the protein. The spectra of protein solutions (0.5 mg/mL) without using Au NPs were also recorded and processed following the above procedure.
2.4. Electron microscopy and image analysis
A 5-μl (1.0 mg/mL) NP-proteasome solution was pipetted onto a glow-discharged Quantifoil grid (Quantifoil Micro Tools GmbH), and blotted with filter paper for 3–5 s under a humidity of 70–90%. The grid was plunged into liquid ethane cooled by liquid nitrogen in a Vitrobot (FEI), transferred into a cryo-specimen holder (Gatan) cooled by liquid nitrogen, and inserted into a JEM-2010F microscope (JEOL) operating at 200 kV. Cryo-EM images were recorded on a SO-163 negative film (Kodak) using an electron dose < 10 e/Å2 at a tobacco mosaic virus calibrated magnification of 50k, and digitized in a film scanner (Nikon Coolscan 8000) with a step size of 2000 dots/inch (2.54 Å/pixel). The images of proteins without using Au NPs were also obtained following the above procedure. Negative stain (nano-W, Nanoprobes Inc.) images were used to screen samples using JEM-1200EX (JEOL) microscope operating at 120 kV at a low electron dose (< 10 e/Å2) with either an 1k×1k CCD camera (Gatan) or a SO-163 negative film (Kodak).
Structural analysis was done using SPIDER (Frank et al., 1996) and EMAN (Ludtke et al., 1999), which included micrograph screening, defocus value estimation, particle selection, phase contrast correction, shift and rotational alignment, and averaging. Here, proteasome particles without and with Au NPs were referred to as single and array particles, respectively. For single particles, a 3D proteasome structure (Supplementary Fig. 2) at 11-Å resolution (Supplementary Fig. 3) was obtained from 7000 randomly oriented proteasome particles following a procedure of image classification, initial model reconstruction using common-line, and final model refinement using projection matching and back projection under D7 symmetry (Hu et al., 2006). Its low-pass filtered (filter radius = 15 Å) top-view projection was used as a reference to automatically detect and select top-view proteasome particles from randomly oriented single particles. For array particles, the top-view particles were manually selected because the top view was the only view in Au NP-proteasome arrays. A procedure of shift and rotational alignment for both single and array particles was performed using the same parameters (mask radius, low-pass filter radius, and reiteration steps). The resolution of averaged images from 50–1000 particles was estimated using the Fourier shell correlation (FSC = 0.5) criterion (Bottcher et al., 1997; Conway et al., 1997).
3. Results
3.1. Assembly of proteasomes into arrays using Au NPs
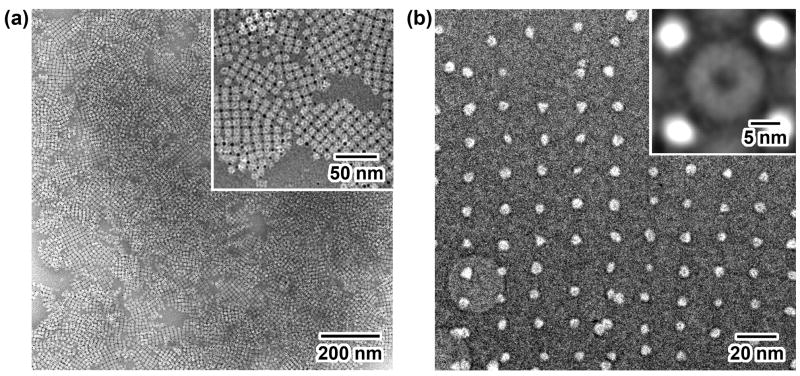
As predicted from the positions of 6x-His tags, Ni-NTA Au NPs bound to the periphery of two center layers in the cylindrical Mtb 20S proteasome. The dispersed distribution of 6x-His tags resulted in the formation of submicron-sized 2D arrays with a 1:1 (NP:protein) stoichiometry (Fig. 2a). Almost all of the proteins and Au NPs are bound to each other, showing a high labeling efficiency (Fig. 2a inset). Although the contrast of protein particles from the NP-proteasome array in vitreous ice was poor at a defocus value of as low as 1.4 μm (Fig. 2b), averaging over 50 array particles without any rotational alignment gave a distinctive top-view image of the cylindrical 20S proteasome (Fig. 2b inset). The distance between the edge of proteasome particles and Au NPs was large enough to avoid the reciprocal interference in subsequent image processing.
Fig. 2.
EM images of Au NP-proteasome 2D arrays. (a) Negative-stain image at low magnification where dark dots are Au NPs and white rings are proteasomes. Inset is a close-up view image at medium magnification showing binding geometry and efficiency. (b) Cryo-EM image at a defocus value of 1.4 μm where white dots are Au NPs. Inset is an averaged image using 50 array particles without rotational alignment.
A low defocus value is preferred in retrieving high-resolution (high spatial frequency) information in cryo-EM images to alleviate information loss at zero crossover points in the contrast transfer function (CTF). The formation of 2D protein arrays enabled us to use close-to-focus values, whereas high defocus values had to be used for single particles in order to visualize the protein particles in vitreous ice (Supplementary Fig. 4). Thus, we used a series of defocus values ranging 0.5–3 μm and 3–6 μm for array and single particles, respectively (Supplementary Fig. 5). A series of defocus values were used during data acquisition to compensate for the information loss in the CTF.
3.2. Effect of Au NP binding on proteasome structure
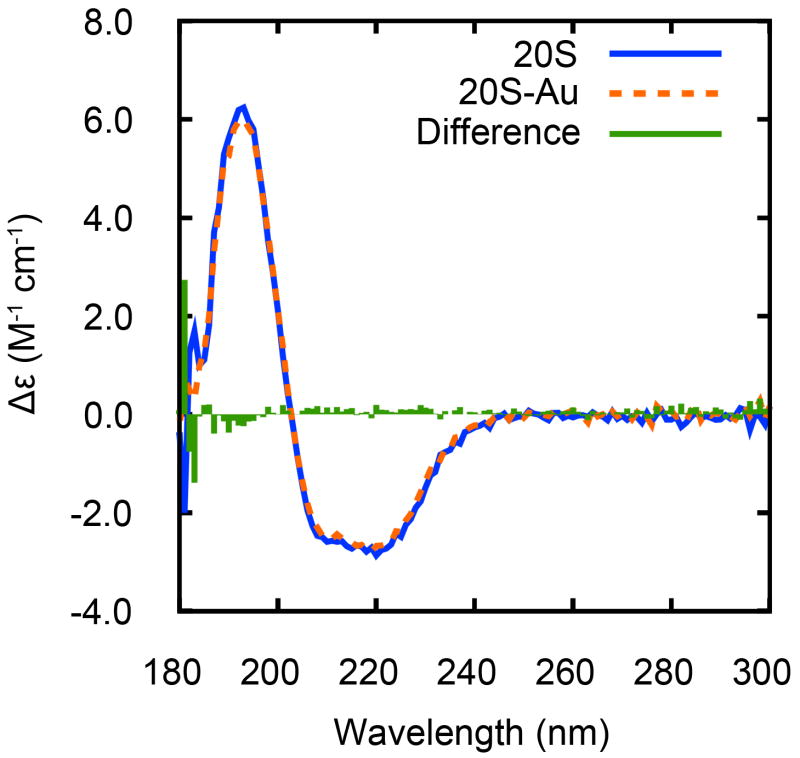
It is known that the binding of NPs might affect the structure and function of proteins depending on the size of contact area and distribution of surface charge (Aubin-Tam and Hamad-Schifferli, 2005; Shang et al., 2007; You et al., 2006). Whether the NP binding affects the proteasome structure was investigated using SRCD spectroscopy (Fig. 3). There was little difference in the mean-residue molar differential extinction coefficient over the range of 180–300 nm for proteasomes before and after binding to Au NPs. This indicates that the binding of Au NPs and the formation of NP-proteasome arrays appear to have little effect on the protein secondary structure, which gives confidence that the NPs are not significantly altering the protein structure.
Fig. 3.
SRCD spectra of proteasome proteins before and after binding to Au NPs, and their difference spectrum. The mean-residue molar differential extinction coefficient (Δε) is represented in the unit of M−1 cm−1.
3.3. Comparison of image analysis using single and array particles
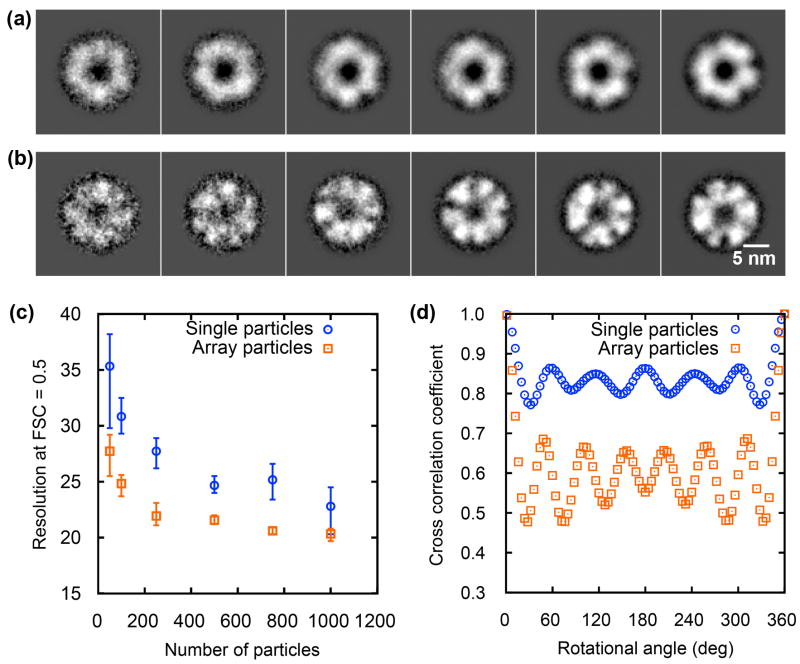
Single and array protein particles were selected from corresponding cryo-EM micrographs, respectively (Supplementary Fig. 6 and 7). Image analysis was performed on various data sets with randomly selected 50–1000 particles. The 4-fold symmetry of NP-proteasome arrays did not match the intrinsic 7-fold symmetry of proteasomes. The protein particles in 2D arrays, although axially aligned into top-views, did not appear to be rotationally aligned. Therefore, rotational alignment on individual protein particles from arrays was performed (Supplementary Fig. 8), followed by averaging over multiple protein particles. Similarly, 2D image processing was performed on top-view single particle images without NPs. After increasing the S/N ratio using this procedure, the structural features of top-view images were more evident (Fig. 4a and b). Both isolated top-view single particles and array particles showed multiple subunits around a low density center. More detailed structural information was present in averaged images from array particles (Fig. 4b) than single particles (Fig. 4a), such as well-defined subunits and internal density distribution, which was further quantitatively analyzed as follows.
Fig. 4.
Comparison of image analysis results from single and array particles. (a) Averaged top-view images of proteasomes after alignment using single particle images containing 50, 100, 250, 500, 750, and 1000 protein particles. (b) Averaged top-view images of proteasomes after alignment using array particle images containing the same number of protein particles. (c) Resolution of top-view images averaged over 50–1000 single and array particles. Error bars were obtained by randomly running three different data sets. (d) Cross-correlation coefficient vs. rotational angle for symmetry analysis of averaged top-view images over 1000 single and array particles.
The resolutions of top-view images from single and array protein particles were analyzed using the FSC = 0.5 criterion for 50, 100, 250, 500, 750, and 1000 protein particles (Fig. 4c). The resolution from single particles increased from 35 to 23 Å when the number of protein particles was increased from 50 to 1000. However, the resolution from array particles exhibited a higher resolution ranging from 27 to 20 Å with the same number of protein particles. Array particles showed a higher resolution improvement by as large as 6–8 Å even when a small number (50–250) of protein particles was used. For instance, using 100 array particles gave a resolution of 25 Å that could only be achieved by using 500 single particles.
Symmetry determination was evaluated using the cross correlation by rotating the averaged image from 1000 single or array protein particles (Fig. 4d). The averaged image of single particles exhibited an incorrect 6-fold symmetry. In contrast, that of array particles exhibited a consistent 7-fold symmetry, which agrees with the known structure of the 20S proteasome (Fig. 1). In addition, the values of cross correlation coefficient from array particles had a larger difference between peaks and valleys, which gives high certainty in assessing the symmetry. Even with 500 particles, the averaged image using array particles began to show the 7-fold symmetry (Fig. 4b), whereas single particles did not (Fig. 4a). Using more array particles (750 and 1000) in alignment and averaging further improved the contrast of subunits while retaining the correct symmetry information (Fig. 4b).
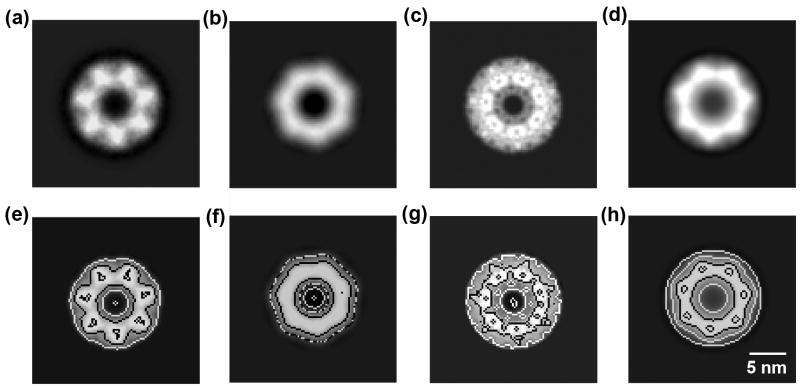
Because averaged images from array particles showed the 7-fold symmetry, we enforced this symmetry on the original 1000 array particles, and calculated their averaged image. The same process was also preformed on the original 1000 single particles even though their averaged image did not show the 7-fold symmetry. These structures were compared with a low-pass filtered exact top-view projection and an averaged image over low-pass filtered tilted top-view projections of the known X-ray crystallographic 3D structure (Supplementary Fig. 9). The images from array (Fig. 5a) and single (Fig. 5b) particles were different from the exact top-view projection (Fig. 5c), but were more similar to the averaged image over tilted top-view projections (Fig. 5d). There must be fewer tilted particles in array particles than in single particles in the image analysis. Therefore, the averaged image generated from array particles showed a triangle-shaped density distribution, indicative of more details and higher resolution than from single particles. These results are more evident in their contoured images (Fig. 5e–h).
Fig. 5.
Comparison of proteasome top-view images generated by various methods. (a) Averaged image from 1000 array particles after 7-fold symmetry implementation. (b) Averaged image from 1000 single particles after 7-fold symmetry implementation. (c) Top-view image projected from X-ray crystallographic 3D structure (PDB ID: 2FHG) (Hu et al., 2006). (d) Averaged image from tilted top-view projections simulated from 15-Å low-pass filtered X-ray crystallographic 3D structure (Supplementary Fig. 9). (e)–(h) are their corresponding contoured images, respectively.
4. Discussion
4.1. Formation mechanism of Au NP-proteasome arrays
We have demonstrated that Au NP-proteasome 2D arrays were formed through the interactions between Ni-NTA ligands on Au NPs and 6x-His tags on 20S proteasomes. The binding of one proteasome particle to four Au NPs is due to steric hindrance although there are fourteen binding sites available on proteasome surfaces. Based on the Pauling’s rules (Pauling, 1929), the geometry of binary particle systems is determined by the size ratio of the two particles. Therefore, the size of Au NPs might be varied to match particular binding geometries of the target protein (Supplementary Table 1). Here, the 6x-His tags on proteasomes and/or the Ni-NTA ligands on Au NPs are flexible enough to relax the symmetry mismatch between them in order to form tetragonal arrays.
4.2. Advantages of the method in image processing
The study shows evidence that the binding of Au NPs and the formation of NP-proteasome arrays appear to have little effect on the protein structure. The well preserved SRCD spectrum (Fig. 3) supports that the binding of Au NPs did not affect the secondary structure of the proteasomes. The NP-proteasome distance is large enough to ensure that Au NPs do not interfere with the proteasomes in 2D image processing (Fig. 2a inset). Finally, image analysis of protein array particles showed the correct symmetry information (Fig. 4d) and corresponded well to the X-ray data (Fig. 5), which suggests the proteasomes in arrays retain their native structures, at least at the level of resolution in this study.
Owing to the high visibility of Au NPs, the protein particles in an array can be easily detected and selected from low defocus (< 3 μm) or even close-to-focus (< 0.5 μm) cryo-EM images. The easy recognition of Au NP arrays due to their high contrast might be used to analyze small proteins that would otherwise be difficult or impossible to recognize as single particles in noisy cryo-EM images. Such low defocus values have fewer zero crossover points in the CTF, which then gives less signal loss at given spatial frequencies. Envelope function attenuation is also less serious at higher spatial frequencies compared to more defocused images (Saad et al., 2001; Zhu, 1997). In addition, proteasome particles in the array are locked in a fixed axial orientation, which is advantageous for image alignment. Because the Au NPs give such a high contrast, a protein array that is deformed or tilted in the vitreous ice can be easily identified as a change in lattice spacing of the NP spots. As shown in the proteasome example, higher resolution structures could be determined with fewer particles.
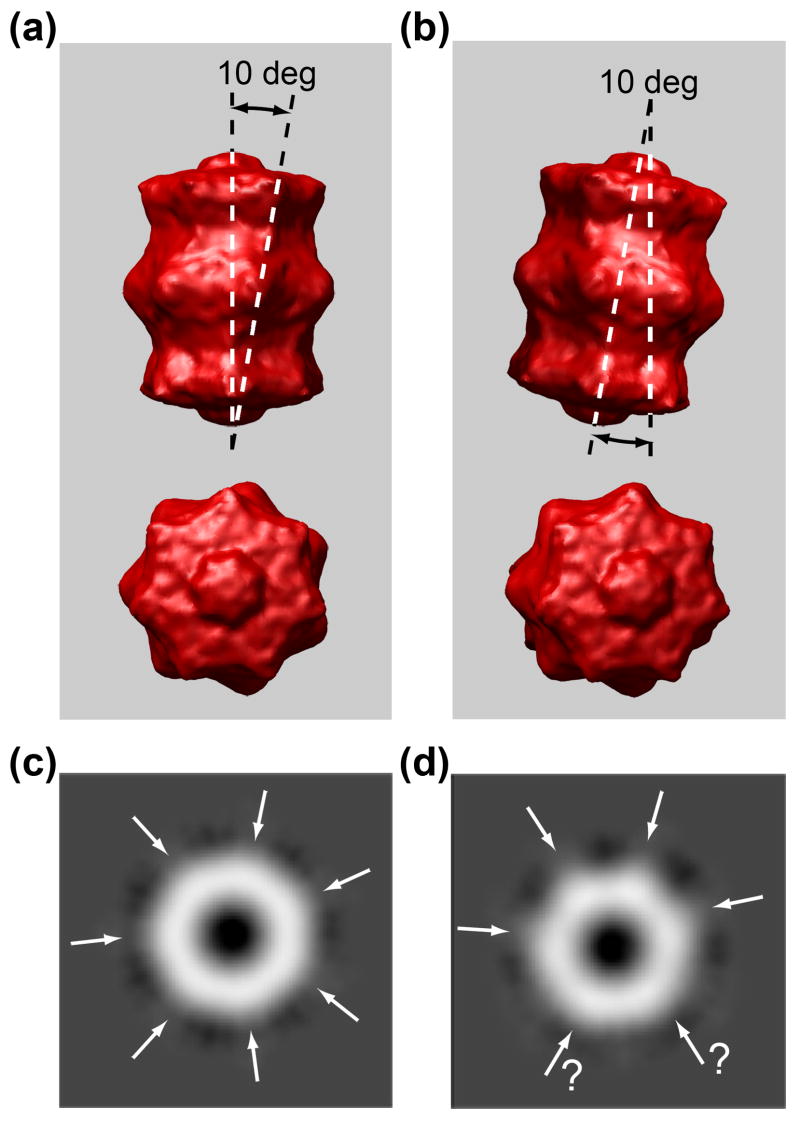
The higher resolution afforded by Au NP-proteasome arrays is useful in assessing protein molecular symmetry. The aligned and averaged images using array particles correctly showed the 7-fold symmetry, whereas those using single particles did not, no matter how many particles (50–1000) were used in alignment and averaging. This can be explained by the intrinsic structural characteristic of the 20S proteasome protein (Fig. 6). The surface protrusions in the four-layered subunits have a 10-degree deviation from the cylindrical axis (Fig. 6a and b). In contrast to the 7-fold symmetry shown in the top-view projection from the 3D density map at 0 degree (Fig. 6c), tilting 10 degrees off its cylindrical c-axis produces a view that could mistakenly be assigned to 6-fold symmetry (Fig. 6d). There is less angular deviation from the cylindrical axis in NP-proteasome arrays due to the orientation restriction imposed by Au NPs, thus avoiding this ambiguity. The top-view projection of the reconstructed 3D density map was used to select top-view particles from randomly oriented single particles in cryo-EM micrographs. However, due to the low S/N ratio, not all of the particles can always be correctly selected. Some slightly tilted top-views could be placed in the data set with exact top-views, which then leads to an error in symmetry interpretation.
Fig. 6.
Side- and top-view of surface representation of the cryo-EM reconstructed 3D structure of 20S proteasome with (a) 0- and (b) 10-degree tilt off the cylindrical axis, and their corresponding top-view images projected from the 3D density map, showing (c) a distinctive 7-fold and (d) an ambiguous 6-fold symmetry, respectively.
4.3. Applicability of the method for 3D reconstruction
Although results demonstrating certain advantages have been obtained in the specific case of 3.9-nm Au NPs and 20S proteasomes, there are several challenges and limitations that need to be considered to assess its use for solving the 3D structure of proteasomes and its general usefulness for other biological macromolecules.
One approach to obtain a protein 3D structure from Au NP-protein 2D arrays is to use tilt pairs (Radermacher et al., 1987). A limitation for Au NP-protein 2D arrays seems to be the missing cone from tilt data, which is also a problem shared by electron crystallography of protein 2D crystals (Henderson and Unwin, 1975). Highly ordered protein crystals, however, may alleviate the missing cone effect, and can yield a quasi-atomic resolution even along the direction normal to the crystal membrane (Murata et al., 2000). Because the tilt method has proven to be successful for obtaining 3D structures from protein 2D crystals, similar results might be possible for Au NP-protein arrays. To solve the missing cone problem, another solution is to engineer genetic tags at different sites on proteins to assemble arrays with orthogonal or rotated views. Although we used the central β subunits of the proteasome in this study, it would be possible to place a 6x-His tag into the N-terminus of the outer α subunits that are located at the top and bottom surfaces of the cylinder-shape proteasome. In this way, formation of 2D arrays presenting side-views might be possible (Supplementary Fig. 10 and Supplementary Table 1). Combining top-views and side-views may eliminate the missing cone problem.
Another approach to obtain a protein 3D structure from Au NP-protein arrays is to use tilt series, i.e., tomography. A disadvantage of current cryo-EM tomography is that a higher total dose must be given to maintain adequate S/N ratio in each image of the tilt series. This higher dose then degrades protein structures and limits the obtainable resolution. Tomography of NP-protein arrays may overcome the dose restriction because each image of an array in the tilt series could be taken with a much lower dose. Tomography is typically used for irregular samples, such as whole cells, where tomograms from different specimens can not be combined. In the Au NP-protein arrays, all arrays are identical and so they can be combined to overcome the destructive dose limitation and achieve high resolution. Another advantage is that the Au NPs are easily visible at lower doses so that tilt angles and alignment can be accurately assigned.
In acquisition of 3D data by tilt pairs or series of NP-protein arrays, large Au NPs upon tilting could create such a high overlapped density that image analysis of proteins is hindered. This problem may be overcome by using smaller Au NPs, such as 0.8-nm undecagold clusters (Al-Bassam et al., 2002; Datta et al., 2005) or 1.4-nm Nanogold particles (Asturias et al., 2005; Montesano-Roditis et al., 2001).
The requirement of protein symmetry seems to be one limitation of this method to other biological macromolecules. Here, the 7-fold symmetry of the 20S proteasome was used to create multiple 6x-His tag sites that favor the formation of 2D arrays. If the protein binding-site symmetry matches the geometry of NP-protein arrays, ideal 2D crystals will be formed. Although the protein symmetry is preferred and may expedite the formation of NP-protein arrays, an asymmetric protein might also form 2D arrays under appropriate conditions. For instance, genetic tags can be placed at two positions on an asymmetric protein, such as at the C-terminus and the N-terminus. These two binding sites could lead to the formation of linear or 2D NP-protein arrays by using multifunctional Au NPs of an appropriate size (Supplementary Fig. 11). The Au NPs that are site-specific for cysteines or other chemical attachment sites could also be employed.
The method of using functionalized Au NPs to assemble genetically tagged proteins into arrays might be useful for structural analysis of small (< 300 kDa) proteins whose structure determination is currently difficult for cryo-EM due to the low contrast and the ambiguity in detecting and aligning single randomly oriented protein particles. If these proteins can be formed into 2D arrays using Au NPs, identifying them just by the Au NPs would be easily possible. Therefore, high quality and close-to-focus data could be collected. In addition, the fixed or ordered orientation would assist the alignment and classification, and could achieve higher resolution using fewer images.
It is not clear whether Au NPs in protein arrays would have some effect on sample charging, a known problem with vitreous ice samples. Conductivity between metal NPs dispersed in an insulating matrix is through electron tunneling whose rate decreases exponentially with the NP distance (Lewis et al., 2002). This tunneling process is only significant if metal NPs come in intimate vicinity (< 2 nm) (Xiao et al., 2003). Due to the large distance between Au NPs in arrays shown here (> 10 nm), an effect on reducing sample charging does not seem likely, although further tests would be needed to explore this possibility.
5. Conclusions
The cryo-EM resolution of averaged top-view images of proteasomes was improved by assembling 6x-His tagged Mtb 20S proteasomes into 2D arrays with Ni-NTA functionalized Au NPs. The SRCD spectroscopic study suggested that the Au NP labeling did not generate denaturation of the protein structure. The labeling method of using Au NPs to assemble proteins into 2D arrays by site-specific binding to genetic tag sites locks protein orientation, produces high visibility for cryo-EM, and enables collection of close-to-focus data. Therefore, higher resolution with fewer images and correct symmetry information of proteasomes were achieved compared to single particle analysis. Some challenges remain in implementation of 3D reconstruction and general usefulness for other proteins. Nevertheless, the possibility of using Au NPs to assemble proteins into 2D arrays or crystals for 3D structural reconstruction is intriguing.
Supplementary Material
Appendix A. Supplementary data
Supplementary data associated with this article can be found, in the online version, at doi:
Acknowledgments
We thank Michael Radermacher (University of Vermont) and Tanvir Shaikh (Wadsworth Center) for helpful discussion in image processing, John C. Sutherland, John G. Trunk and Denise Monteleone for sincere assistance in SRCD spectroscopy analysis, and Huilin Li for kindly providing protein samples. This work was supported by BNL LDRD Grant 04-055 and DOE Grant 06742 and NIH Grants P41EB002181 and R01RR017545.
Footnotes
Publisher's Disclaimer: This is a PDF file of an unedited manuscript that has been accepted for publication. As a service to our customers we are providing this early version of the manuscript. The manuscript will undergo copyediting, typesetting, and review of the resulting proof before it is published in its final citable form. Please note that during the production process errors may be discovered which could affect the content, and all legal disclaimers that apply to the journal pertain.
References
- Ackerson CJ, Jadzinsky PD, Jensen GJ, Kornberg RD. Rigid, specific, and discrete gold nanoparticle/antibody conjugates. J Am Chem Soc. 2006;128:2635–2640. doi: 10.1021/ja0555668. [DOI] [PubMed] [Google Scholar]
- Al-Bassam J, Ozer RS, Safer D, Halpain S, Milligan RA. MAP2 and tau bind longitudinally along the outer ridges of microtubule protofilaments. J Cell Biol. 2002 doi: 10.1083/jcb.200201048. [DOI] [PMC free article] [PubMed] [Google Scholar]
- Asturias FJ, Chadick JZ, Cheung IK, Stark H, Witkowski A, Joshi AK, Smith S. Structure and molecular organization of mammalian fatty acid synthase. Nat Struct Mol Biol. 2005;12:225–232. doi: 10.1038/nsmb899. [DOI] [PubMed] [Google Scholar]
- Aubin-Tam M, Hamad-Schifferli K. Gold nanoparticles-cytochrome c complexes: The effect of nanoparticles ligand charge on protein structure. Langmuir. 2005;21:12080–12084. doi: 10.1021/la052102e. [DOI] [PubMed] [Google Scholar]
- Boisset N, Grassucci R, Penczek P, Delain E, Pochon F, Frank J, Lamy JN. Three-dimensional reconstruction of a complex of human α2-macroglobulin with monomaleimido nanogold (Au1.4nm) embedded in ice. J Struct Biol. 1992;109:39–45. doi: 10.1016/1047-8477(92)90065-i. [DOI] [PubMed] [Google Scholar]
- Bottcher B, Wynne SA, Crowther RA. Determination of the fold of the core protein of hepatitis B virus by electron cryomicroscopy. Nature. 1997;386:88–91. doi: 10.1038/386088a0. [DOI] [PubMed] [Google Scholar]
- Buchel C, Morris E, Orlova E, Barber J. Localisation of the PsbH subunit in Photosystem II: A new approach using labeling of His-tags with a Ni2+-NTA gold cluster and single particle analysis. J Mol Biol. 2001;312:371–379. doi: 10.1006/jmbi.2001.4951. [DOI] [PubMed] [Google Scholar]
- Conway JF, Cheng N, Zlotnick A, Wingfeld PT, Stahl SJ, Steven AC. Visualization of a 4-helix bundle in the hepatitis B virus capsid by cryo-electron microscopy. Nature. 1997;386:91–94. doi: 10.1038/386091a0. [DOI] [PubMed] [Google Scholar]
- Datta PP, Sharma MR, Qi L, Frank J, Agrawal RK. Interaction of the G0 domain of elongation factor G and the C-terminal domain of ribosomal protein L7/L12 during translocation as revealed by cryo-EM. Mol Cell. 2005;20:723–731. doi: 10.1016/j.molcel.2005.10.028. [DOI] [PubMed] [Google Scholar]
- Frank J, Radermacher M, Penczek P, Zhu J, Li Y, Ladjadj M, Leith A. Spider and web: Processing and visualization of images in 3D electron microscopy and related fields. J Struct Biol. 1996;116:190–199. doi: 10.1006/jsbi.1996.0030. [DOI] [PubMed] [Google Scholar]
- Frank J. Single-particle imaging of macromolecules by cryo-electron microscopy. Annu Rev Biophys Biomol Struct. 2002;31:303–319. doi: 10.1146/annurev.biophys.31.082901.134202. [DOI] [PubMed] [Google Scholar]
- Hainfeld JF, Furuya FR. A 1.4-nm gold cluster covalently attached to antibodies improves immunolabeling. J Histochem Cytochem. 1992;40:177–184. doi: 10.1177/40.2.1552162. [DOI] [PubMed] [Google Scholar]
- Hainfeld JF, Liu W, Halsey CMR, Freimuth P, Powell RD. Ni-NTA-gold clusters target His-tagged proteins. J Struct Biol. 1999;127:185–198. doi: 10.1006/jsbi.1999.4149. [DOI] [PubMed] [Google Scholar]
- Hainfeld JF, Powell RD. New frontiers in gold labeling. J Histochem Cytochem. 2000;48:471–480. doi: 10.1177/002215540004800404. [DOI] [PubMed] [Google Scholar]
- Henderson R, Unwin PNT. Three-dimensional model of purple membrane obtained by electron microscopy. Nature. 1975;257:28–32. doi: 10.1038/257028a0. [DOI] [PubMed] [Google Scholar]
- Hu GQ, Lin G, Wang M, Dick L, Xu R, Nathan C, Li HL. Structure of the mycobacterium tuberculosis proteasome and mechanism of inhibition by a peptidyl boronate. Mol Microbiol. 2006;59:1417–1428. doi: 10.1111/j.1365-2958.2005.05036.x. [DOI] [PubMed] [Google Scholar]
- Hu M, Qian L, Briñas RP, Lymar ES, Hainfeld JF. Assembly of nanoparticle-protein binding complexes: From monomers to ordered arrays. Angew Chem Int Ed. 2007;46:5111–5114. doi: 10.1002/anie.200701180. [DOI] [PubMed] [Google Scholar]
- Jensen GJ, Kornberg RD. Single-particle selection and alignment with heavy atom cluster-antibody conjugates. Proc Natl Acad Sci U S A. 1998;1998:9262–9267. doi: 10.1073/pnas.95.16.9262. [DOI] [PMC free article] [PubMed] [Google Scholar]
- Kikkawa M, Okada Y, Hirokawa N. 15 Å Resolution model of the monomeric kinesin motor, KIF1A. Cell. 2000;100:241–252. doi: 10.1016/s0092-8674(00)81562-7. [DOI] [PubMed] [Google Scholar]
- Lewis FD, Liu J, Weigel W, Rettig W, Kurnikov IV, Beratan DN. Donor-bridge-acceptor energetics determine the distance dependence of electron tunneling in DNA. Proc Natl Acad Sci U S A. 2002;99:12536–12541. doi: 10.1073/pnas.192432899. [DOI] [PMC free article] [PubMed] [Google Scholar]
- Ludtke SJ, Baldwin PR, Chiu W. EMAN: Semi-automated software for high resolution single particle reconstructions. J Struct Biol. 1999;128:82–97. doi: 10.1006/jsbi.1999.4174. [DOI] [PubMed] [Google Scholar]
- Montesano-Roditis L, Glitz DG, Traut RR, Stewart PL. Cryo-electron microscopic localization of protein L7/L12 within the Escherichia coli 70 S ribosome by difference mapping and nanogold labeling. J Biol Chem. 2001;276:14117–14123. doi: 10.1074/jbc.M008430200. [DOI] [PubMed] [Google Scholar]
- Murata K, Mitsuoka K, Hirai T, Walz T, Agre P, Heymann JB, Engel A, Fujiyoshi Y. Structural determinants of water permeation through aquaporin-1. Nature. 2000;407:599–605. doi: 10.1038/35036519. [DOI] [PubMed] [Google Scholar]
- Pauling L. The principles determining the structure of complex ionic crystals. J Am Chem Soc. 1929;51:1010–1026. [Google Scholar]
- Radermacher M, Wagenknecht T, Verschoor A, Frank J. Three-dimensional reconstruction from a single-exposure, random conical tilt series applied to the 50S ribosomal subunit of Escherichia coli. J Microsc. 1987;146:113–136. doi: 10.1111/j.1365-2818.1987.tb01333.x. [DOI] [PubMed] [Google Scholar]
- Rappas M, et al. Structural insights into the activity of enhancer-binding proteins. Science. 2005;307:1972–1975. doi: 10.1126/science.1105932. [DOI] [PMC free article] [PubMed] [Google Scholar]
- Saad A, Ludtke SJ, Kakana J, Rixon FJ, Tsuruta H, Chiu W. Fourier amplitude decay of electron cryomicroscopic images of single particles and effects on structure determination. J Struct Biol. 2001;133:32–42. doi: 10.1006/jsbi.2001.4330. [DOI] [PubMed] [Google Scholar]
- Safer D. Undecagold cluster labeling of proteins at reactive cysteine residues. J Struct Biol. 1999;127:101–105. doi: 10.1006/jsbi.1999.4110. [DOI] [PubMed] [Google Scholar]
- Shang W, Nuffer JH, Dordick JS, Siegel RW. Unfolding of Ribonuclease A on silica nanoparticle surfaces. Nano Lett. 2007;7:1991–1995. doi: 10.1021/nl070777r. [DOI] [PubMed] [Google Scholar]
- Sun J, et al. Core-controlled polymorphism in virus-like particles. Proc Natl Acad Sci U S A. 2007;104:1354–1359. doi: 10.1073/pnas.0610542104. [DOI] [PMC free article] [PubMed] [Google Scholar]
- van Heel M, et al. Single-particle electron cryo-microscopy: Towards atomic resolution Q. Rev Biophys. 2000;33:307–369. doi: 10.1017/s0033583500003644. [DOI] [PubMed] [Google Scholar]
- Wagenknecht T, Berkowitz J, Grassucci R, Timerman AP, Fleischer S. Localization of calmodulin-binding sites on the ryanodine receptor from skeletal-muscle by electron-microscopy. Biophys J. 1994;67:2286–2295. doi: 10.1016/S0006-3495(94)80714-3. [DOI] [PMC free article] [PubMed] [Google Scholar]
- Wang L, Sigworth FJ. Cryo-EM and single particles. Physiology. 2006;21:13–18. doi: 10.1152/physiol.00045.2005. [DOI] [PubMed] [Google Scholar]
- Xiao Y, Patolsky F, Katz E, Hainfeld JF, Willner I. “Plugging into enzymes”: Nanowiring of redox enzymes by a gold nanoparticle. Science. 2003;299:1877–1881. doi: 10.1126/science.1080664. [DOI] [PubMed] [Google Scholar]
- You CC, Agasti SS, De M, Knapp MJ, Rotello VM. Modulation of the catalytic behavior of alpha-chymotrypsin at monolayer-protected nanoparticle surfaces. J Am Chem Soc. 2006;128:14612–14618. doi: 10.1021/ja064433z. [DOI] [PubMed] [Google Scholar]
- Zhu J. Three-dimensional reconstruction with contrast transfer function correction from energy-filtered cryoelectron micrographs: Procedure and application to the 70S Escherichia coli ribosome. J Struct Biol. 1997;118:197–219. doi: 10.1006/jsbi.1997.3845. [DOI] [PubMed] [Google Scholar]
Associated Data
This section collects any data citations, data availability statements, or supplementary materials included in this article.
Supplementary Materials
Appendix A. Supplementary data
Supplementary data associated with this article can be found, in the online version, at doi:


