Abstract
Brain glucose uptake/metabolism is impaired in Alzheimer disease (AD). Here, we report that levels of the two major brain glucose transporters (GLUT1 and GLUT3) responsible for glucose uptake into neurons were decreased in AD brain. This decrease correlated to the decrease in O-GlcNAcylation, to the hyperphosphorylation of tau, and to the density of neurofibrillary tangles in human brains. We also found down-regulation of hypoxia-inducible factor 1, a major regulator of GLUT1 and GLUT3, in AD brain. These studies provide a possible mechanism by which GLUT1 and GLUT3 deficiency could cause impaired brain glucose uptake/metabolism and contribute to neurodegeneration via down-regulation of O-GlcNAcylation and hyperphosphorylation of tau in AD.
Keywords: Glucose transporters, tau, hyperphosphorylation, Alzheimer disease, O-GlcNAcylation, hypoxia-inducible factor
1. Introduction
Alzheimer disease (AD) is characterized histopathologically by extracellular amyloid plaques and intracellular neurofibrillary tangles (NFTs). The number of tangles in the brain correlates to dementia symptoms [1–3], suggesting that neurofibrillary degeneration may contribute to the pathogenesis of AD. NFTs are mainly composed of abnormally hyperphosphorylated tau that aggregates into paired helical filaments and straight filaments [4]. Many studies have demonstrated that abnormal hyperphosphorylation of tau is crucial to neurodegeneration [5,6]. Although extensive studies have been carried out on protein kinases and phosphatases that regulate tau phosphorylation, the mechanisms leading to the abnormal hyperphosphorylation of tau in AD brain are not well understood.
Glucose uptake and metabolism are impaired in AD brain, and this impairment appears to be a cause, rather than a consequence, of neurodegeneration [7]. We recently demonstrated that impaired glucose uptake/metabolism leads to hyperphosphorylation of tau via down-regulation of tau O-GlcNAcylation [8,9], which is a unique type of O-glycosylation by which β-N-acetylglucosamine (GlcNAc) attaches to the hydroxyl group of serine or threonine residues and serves as a sensor of intraneuronal glucose metabolism and regulates protein phosphorylation inversely. These findings provide a possible mechanism by which the impaired glucose uptake/metabolism could contribute to neurodegeneration in AD [5].
The causes of the impairment of glucose uptake/metabolism in AD brain are not well understood. Because brain neurons are unable to synthesize or store glucose, they are fully dependent on glucose transport across the blood-brain barrier, which is facilitated by glucose transporters (GLUTs). To date, 14 GLUTs have been reported in the human tissue [10]. In mammalian brain, GLUT1 and GLUT3 are the predominant GLUTs responsible for glucose transport [11]. GLUT1 is highly expressed in the endothelial cells of blood-brain barrier and is responsible for transporting glucose from blood into the extracellular space of the brain [12,13]. GLUT3 is the major neuronal GLUT and helps transport glucose from the extracellular space into the neurons [14]. In addition, GLUT2 is expressed in astrocytes of the brain. GLUT4, which is expressed mainly in peripheral tissue such as muscle, adipose tissue and heart, is also found in some neurons in the brain [14] and, unlike GLUT1–3, is insulin-sensitive. Decreased GLUT1 and GLUT3 have been observed in AD brain [15–17], suggesting that this decrease might contribute to the impairment of brain glucose uptake/metabolism. However, no evidence of such a possibility has been reported.
In this study, we compared the four major brain GLUTs, GLUT1–4, between 7 AD and 7 control brains and found that the decrease in GLUT1 and GLUT3 levels correlates to the decrease in O-GlcNAcylation and to the hyperphosphorylation of tau. We also found that the decrease in GLUT1 and GLUT3 might result from down-regulation of the transcription factor hypoxia-inducible factor 1 (HIF-1) in AD brain. These findings reveal a possible mechanism by which GLUT deficiency leads to neurodegeneration in AD.
2. Materials and Methods
2.1. Human brain tissue
Frozen human brain tissue was obtained from the Sun Health Research Institute Donation Program (Sun City, AZ). The use of the tissue was in accordance with the National Institutes of Health guidelines and was approved by our institute's institutional review committee. The frontal cortices of 7 control (86.6 ± 2.9 years old, 2 males and 5 females, 3.0 ± 0.3 h postmortem delays, Braak stages II–III) and 7 AD (86.3 ± 6.0 years old, 1 male and 6 females, 2.5 ± 0.6 h postmortem delays, Braak stages V–VI) subjects were used in this study. All brain samples were confirmed pathologically and stored at -70 °C until use.
2.2. Antibodies
The primary antibodies used in this study include polyclonal anti-GLUT1, anti-GLUT3 and anti–HIF-1α from Santa Cruz Biotechnology (Santa Cruz, CA); polyclonal anti-GLUT2 and anti-calbindin from Chemicon (Temecula, CA); polyclonal anti-GLUT4 and monoclonal anti–HIF-1β from Abcam (Cambridge, MA); monoclonal anti-actin from Sigma-Aldrich (St. Louis, MO); monoclonal antibody (RL2) against O-GlcNAcylated proteins from Affinity Bioreagents (Golden, CO); phosphorylation-dependent and site-specific tau antibodies from BioSource International (Camarillo, CA); and monoclonal anti-GFAP from Sternberger Monoclonals (Lutherville, MD). The secondary antibodies were peroxidase-conjugated goat anti-rabbit or goat anti-mouse IgG from Jackson ImmunoResearch Laboratories (West Grove, PA).
2.3. Western blots and immuno-dot-blots
The frozen frontal cortices were homogenized in cold buffer containing 50 mM Tris-HCl (pH 7.4), 2.0 mM EDTA, 10 mM β-mercaptoethanol and 8.5% sucrose. The homogenates were centrifuged at 15,000 × g for 10 min, and the resulting supernatants (crude extracts) were used for Western blot analyses after protein assay by modified Lowry methods [18]. Western blots were carried out by using 10% SDS-PAGE and standard procedure and developed by using enhanced chemiluminescence kit (Pierce Biotechnology, Rockford, IL). Levels of O-GlcNAcylation and tau phosphorylation at individual phosphorylation sites were determined by immuno-dot-blot assay of the brain extracts, as described previously [19].
2.4. Correlation and statistic analysis
Linear correlations between GLUT levels and levels of O-GlcNAcylation or tau phosphorylation or tangle density in human brains were analyzed by using MS Excel. Comparisons of means between groups were analyzed by Student's t-test.
3. Results
3.1. Levels of various GLUTs are differentially altered in AD brain
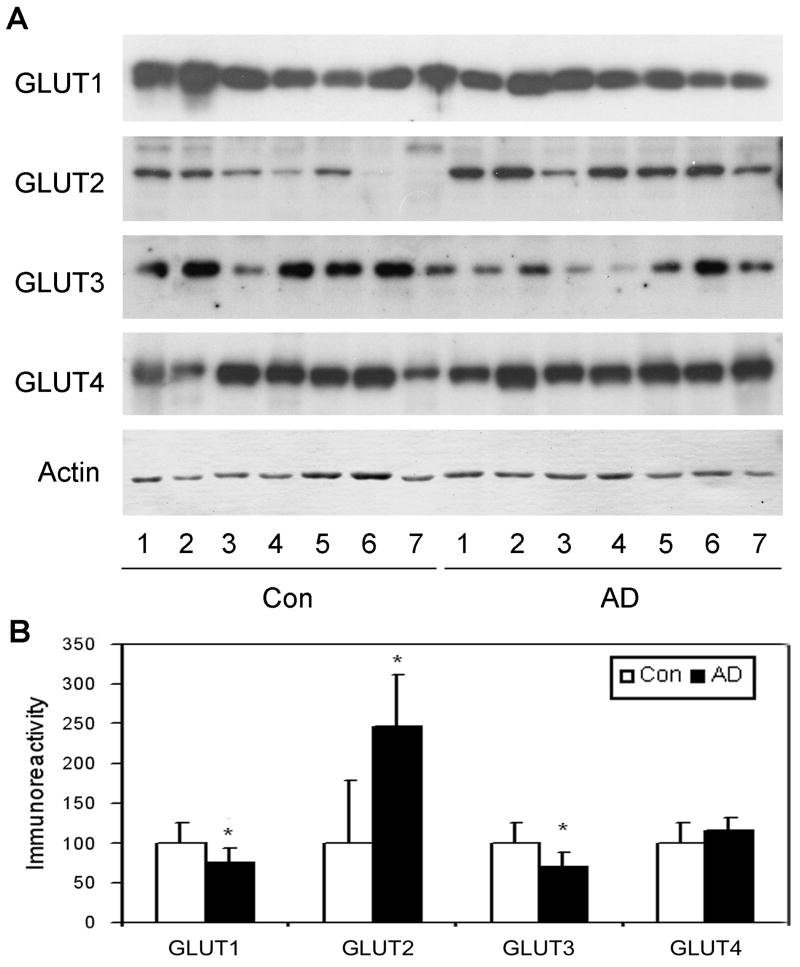
We first determined the levels of four major brain GLUTs (GLUT1–4) in 7 AD and 7 age-matched control brains by quantitative Western blots. We found that the levels of GLUT1 and GLUT3 were significantly decreased (25–30%) in AD brain as compared with controls (Fig. 1), whereas there was no significant difference in GLUT4 level between the two groups. In contrast and surprisingly, the GLUT2 level was found to be markedly increased (∼1.5-fold) in AD brain.
Fig. 1.
Levels of GLUT1–4 in AD and control brains. (A) Crude extracts of the frontal cerebral cortices from 7 AD and 7 control cases were analyzed by Western blots developed with antibodies to GLUT1, GLUT2, GLUT3 or GLUT4. Actin blot was included as a loading control. (B) The blots were quantified densitometrically and normalized by the actin blot. Data are presented as percentage of controls (mean ± SD; *, p < 0.05).
3.2. Decrease in GLUT1 and GLUT3 levels correlates to decrease in protein O-GlcNAcylation level
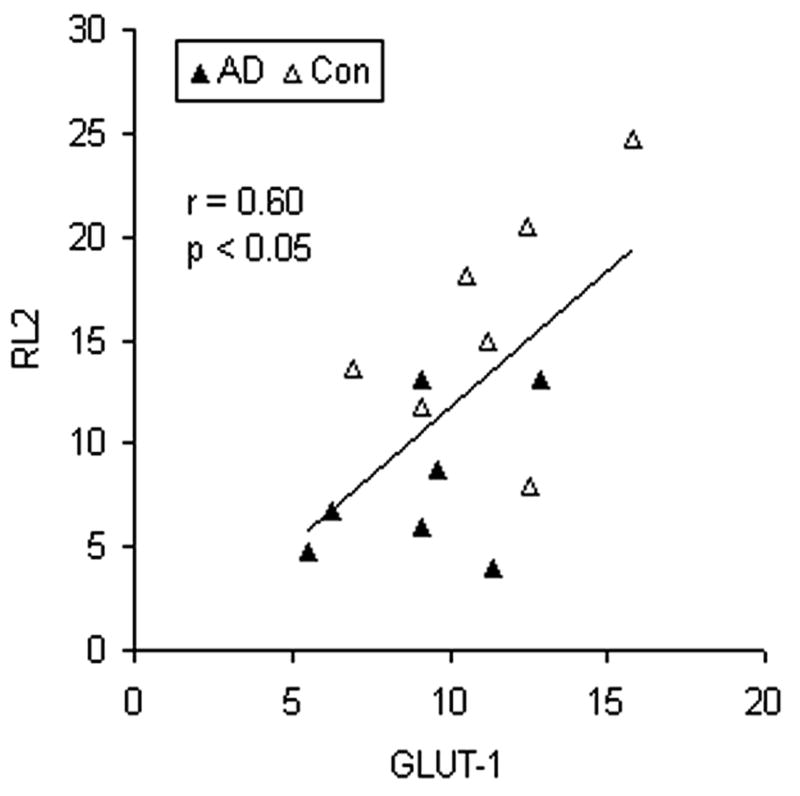
To study whether decrease in GLUT1 and GLUT3 levels contributes to decreased intracellular glucose metabolism and, thus, decreased protein O-GlcNAcylation, we determined protein O-GlcNAcylation levels in the crude brain extracts of AD and control cases. Linear correlation analysis between O-GlcNAcylation level and levels of GLUT1 or GLUT3 indicated that the O-GlcNAcylation level correlated positively to both GLUT1 level (Fig. 2, r = 0.60, p < 0.05) and GLUT 3 level (r = 0.52, p < 0.05) in human brain. These observations support the contribution of the decrease in GLUT1 and GLUT3 to decreased glucose uptake/metabolism and O-GlcNAcylation in AD brain.
Fig. 2.
Correlation between levels of protein O-GlcNAcylation and GLUT1. Levels of protein O-GlcNAcylation and GLUT1 in the crude extracts of the frontal cortex from 7 AD and 7 control cases were determined by immuno-dot-blots developed with monoclonal antibody RL2 and quantitative Western blots developed with anti-GLUT1, respectively. The levels of O-GlcNAcylation (RL2) were then plotted against the levels of GLUT1. A linear regression line is shown in the graph.
3.3. Decrease in GLUT1 and GLUT3 levels correlates to increase in tau phosphorylation and in numbers of NFTs
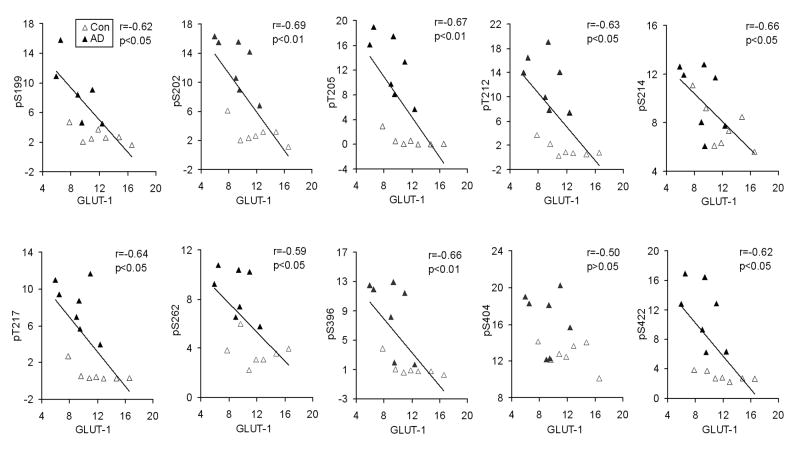
O-GlcNAcylation and phosphorylation of tau regulate each other reciprocally [8,9], and impaired brain glucose uptake/metabolism is thought to contribute to neurodegeneration. Therefore, we investigated whether the decrease in GLUT1 and GLUT3 levels contributes to hyperphosphorylation of tau, which is crucial to neurofibrillary degeneration [5,6]. Towards this goal, we measured tau phosphorylation levels at multiple individual phosphorylation sites that are abnormally hyperphosphorylated in AD brain, and then carried out correlation analysis between tau phosphorylation and the GLUT1 and GLUT3 levels in AD and control brains. We found that the GLUT1 level strongly correlated negatively to the level of tau phosphorylation at the phosphorylation sites studied (Fig. 3). The negative correlations were statistically significant at all the phosphorylation sites except Ser404. Similar negative correlations between GLUT3 level and tau phosphorylation were also observed, but the correlations reached statistical significance only for phosphorylation of tau at Ser214 and Ser262 (Table 1). In addition, we also analyzed correlations between the GLUT1 and GLUT3 levels and the densities of NFTs in the frontal cortex, where the levels of GLUT1 and GLUT3 were determined, and in the whole brains. We found that the GLUT1 and GLUT3 levels were also correlated inversely to the densities of NFTs (Table 1). These results provide evidence that the decrease in GLUT1 and GLUT3 may contribute to abnormal hyperphosphorylation of tau and neurofibrillary degeneration.
Fig. 3.
Correlation between GLUT1 levels and tau phosphorylation at individual phosphorylation sites. Levels of GLUT1 and of tau phosphorylation in crude extracts of the frontal cortex from 7 AD and 7 control cases were determined by quantitative Western blots and immuno-dot-blots, respectively. The levels of tau phosphorylation at individual phosphorylation sites were then plotted against GLUT1 levels. A linear regression line is shown when the correlation reached statistical significance.
Table 1.
Correlation between the levels of GLUT1 or GLUT3 and the levels of tau phosphorylation at individual phosphorylation sites and the density of NFTs
| Phosphorylation sites of tau | NFTs density | ||||||||||||
|---|---|---|---|---|---|---|---|---|---|---|---|---|---|
| S199 | S202 | T205 | T212 | S214 | S217 | S262 | S396 | S404 | S422 | Frontal | Total | ||
| GLUT1 | r value | -0.616 | -0.692 | -0.673 | -0.627 | -0.657 | -0.640 | -0.588 | -0.662 | -0.500 | -0.623 | -0.67 | -0.61 |
| p value | 0.018 | 0.006 | 0.008 | 0.016 | 0.010 | 0.013 | 0.026 | 0.009 | 0.068 | 0.017 | 0.008 | 0.022 | |
|
| |||||||||||||
| GLUT3 | r value | -0.412 | -0.510 | -0.495 | -0.520 | -0.583 | -0.483 | -0.597 | -0.453 | -0.359 | -0.471 | -0.54 | -0.45 |
| p value | 0.142 | 0.062 | 0.071 | 0.056 | 0.028 | 0.079 | 0.024 | 0.103 | 0.206 | 0.089 | 0.045 | 0.109 | |
The GLUT levels and the levels of tau phosphorylation at individual phosphorylation sites in the frontal cortices were determined by quantitative Western blots and immuno-dot-blots, respectively. The density of NFTs was scored by 0 (none), 1 (sparse), 2 (moderate) and 3 (frequent) in each of the five areas (frontal, temporal, parietal, hippocampal and entorhinal), as defined according to CERAD AD criteria [30]. The total tangle density was calculated by adding up the scores from all the five areas. The p values that reach statistic significance (p < 0.05) are highlighted.
3.4. HIF-1 is decreased in AD brain
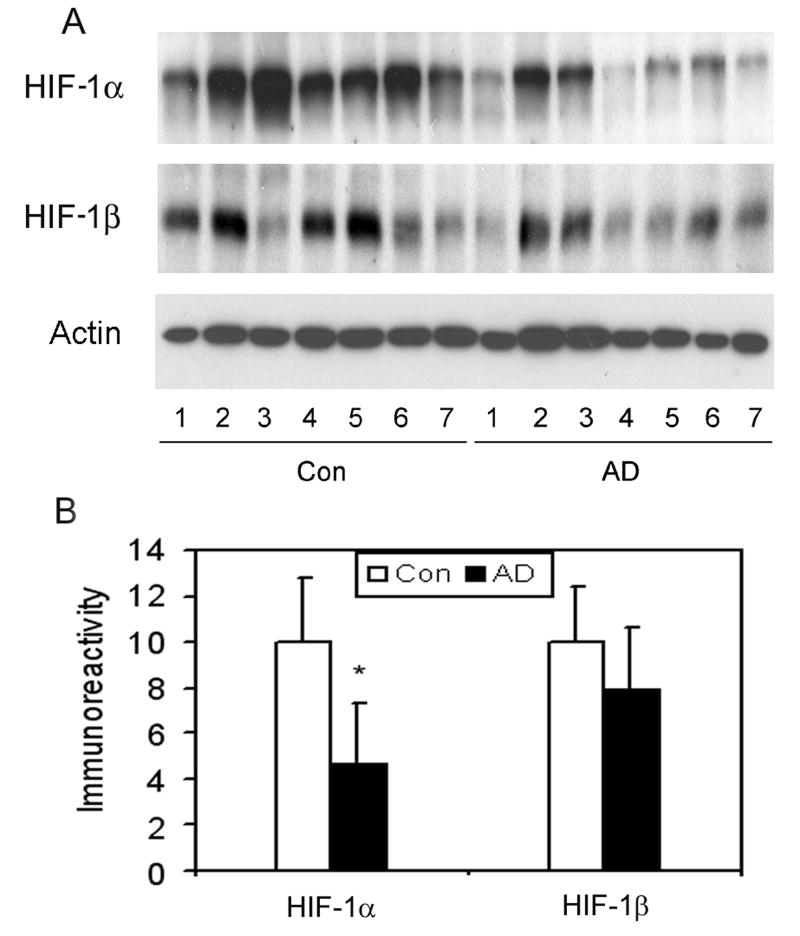
We further studied the potential cause of the reduction of GLUT1 and GLUT3 levels in AD brain. Because the expression of GLUT1 and GLUT3 in the brain is mainly regulated by HIF-1 [20–23], a heterodimer transcription factor consisting of HIF-1α and HIF-1β, we compared the levels of HIF-1α and HIF-1β between AD and control brains. We found that HIF-1α level is markedly reduced (to ∼40% of controls) in AD brain (Fig. 4). A 20% decrease in HIF-1β was also observed in AD brain, but the reduction did not reach statistical significance. These results suggest that the decrease in GLUT1 and GLUT3 might result from down-regulation of HIF-1 in AD brain.
Fig. 4.
Levels of HIF-1α and HIF-1β in AD and control brains. (A) Homogenates of frontal cerebral cortices from 7 AD and 7 control cases were analyzed by Western blots developed by anti-HIF-1α or anti-HIF-1β. Actin blot was included as a loading control. (B) The blots were quantified densitometrically and normalized by the actin blot. Data are presented as percentage of the controls (mean ± SD; #, p < 0.05).
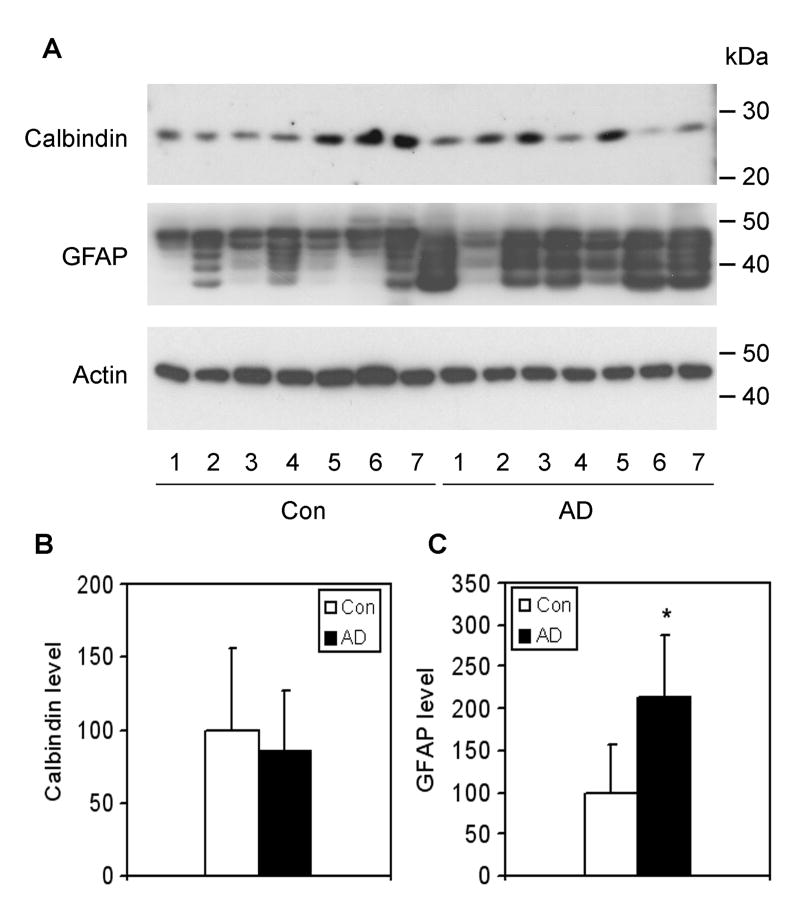
GLUT3 is the major neuronal GLUT [14]. To reveal whether a potential neuronal loss may also underlie the decrease in GLUT3 in AD brain, we determined the level of calbindin, a commonly used neuronal marker [24]. We found no difference in calbindin level between AD and control brains (Fig. 5), thus excluding the possibility that the decrease in GLUT3 we observed in the frontal cortices of AD brain were the consequence of neuronal loss.
Fig. 5.
Levels of calbindin and GFAP in AD and control brains. (A) Crude extracts of frontal cerebral cortices from 7 AD and 7 control cases were analyzed by Western blots developed with anti-calbindin or anti-GFAP. Actin blot was included as a loading control. (B) The blots were quantified densitometrically and normalized by the actin blot. Data are presented as percentage of the controls (mean ± SD; *, p < 0.05).
3.5. Increase in GLUT2 level in AD brain might result from astrocyte activation
In contrast to the decrease in GLUT1 and GLUT3 levels, we were surprised to observe a dramatic elevation of GLUT2 level in AD brain (Fig. 1). Because GLUT2 is only expressed in astrocytes in the mammalian brain [14], we tested whether the elevation of GLUT2 in AD brain was due to astrocyte activation. To quantify astrocytes in the brain samples, we determined the level of glial fibrillary acid protein (GFAP), an astrocyte marker, by Western blots and found that the GFAP level in the AD group was ∼2.2 fold of that in the control group (Fig. 5). When the GLUT2 level was normalized by the GFAP level, the elevation of GLUT2 in AD brain disappeared (data not shown). These results suggest that the higher level of GLUT2 we observed in AD might result from astrocyte activation.
4. Discussion
Glucose is the primary source of the energy required for brain activity, although it cannot enter the brain freely. The transport of glucose from the bloodstream into the brain is mediated by GLUTs. In this study, we used a cohort of autopsied brains with short postmortem (<3 h average postmortem delay) and matched ages and compared the levels of four major brain GLUTs between AD and controls. We found that GLUT1 and GLUT3 were significantly decreased in AD brain. These findings are consistent with a previous observation made by using different brain samples, in which the ages (76 ± 5 years in AD vs. 56 ± 22 years in controls) and postmortem delays (8.7 ± 4 h in AD vs. 12.5 ± 6 h in controls) between the two groups were not matched [16]. Although it is generally assumed that glucose transport across blood-brain barrier and uptake into neurons and glial cells is not the rate-limiting step in glucose utilization in normal brains, under pathological conditions such as AD, the decreased GLUT1 and GLUT3 levels may impair the glucose-transporting ability to a threshold that leads to impaired glucose uptake/metabolism. Our findings that the levels of GLUT1 and GLUT3 correlate positively to O-GlcNAcylation and negatively to tau phosphorylation and the density of NFTs in human brain strongly support this possibility.
To investigate whether the reduction of GLUT3 in AD brain is caused by a possible neuronal loss that had been reported previously, we examined neuronal loss of the same tissue samples (frontal cortex) as used for GLUT3 study by measuring the level of calbindin, a commonly used neuronal marker. We did not find any significant decrease in calbindin in AD, which is consistent with the recent studies showing significant neuronal loss mainly in the hippocampus and entorhinal cortex of AD brain [25]. These results suggest that the decrease in neuronal GLUT3 is most likely specific to AD rather than being simply caused by neuronal loss. The specificity of GLUT3 reduction is also supported by the observation of no significant difference in GLUT4 between AD and controls.
Expression of GLUT1 and GLUT3 is mainly regulated by HIF-1 [20–23]. HIF-1 has two subunits, HIF-1α and HIF-1β [26]. The latter is constitutively expressed in the nucleus, and the transcription activity is mainly regulated by HIF-1α, which translocates from cytosol into the nucleus and forms a heterodimer with HIF-1β to activate the related gene expression [27]. Our finding that HIF-1, especially HIF-1α, was decreased in AD brain suggests that this decrease might be a cause of the reduction of GLUT1 and GLUT3. We currently do not know how HIF-1 is down-regulated in AD brain. Because oxidative stress, which is increased in AD brain [28], can destabilize HIF-1 [29], it is possible that the decreased HIF-1 in AD brain is due to increased oxidative stress.
In contrast to GLUT1 and GLUT3 levels, we observed that GLUT2 level was more than two times higher in AD brain than in control. To understand this surprising observation, we determined the degree of astrocyte activation in AD brain. We found that the astrocytes are activated to a similar extent as the GLUT2 elevation in AD. Because GLUT2 is only expressed in astrocytes in the brain [14], it is likely that the elevated GLUT2 level we observed results from astrocyte activation in AD.
The most important and novel findings of this study are the positive correlation between protein O-GlcNAcylation and levels of GLUT1 and GLUT3 as well as the negative correlation between tau phosphorylation/tangle density and levels of GLUT1 and GLUT3. These findings provide, for the first time, a linkage between deficient brain GLUTs and tau pathology in AD brain. These findings are consistent with the hypothesis that impaired brain glucose uptake/metabolism contributes to AD neurofibrillary degeneration via down-regulation of O-GlcNAcylation and upregulation of tau phosphorylation [5].
In conclusion, we studied the levels of major GLUTs, protein O-GlcNAcylation and tau phosphorylation in AD brain as compared with controls. We found that GLUT1 and GLUT3 levels were significantly decreased, whereas GLUT2 was dramatically increased in AD brain. The decrease in GLUT1 and GLUT3 levels may result from down-regulation of HIF-1, which was also observed in AD brain. On the other hand, elevation of GLUT2 appears to be caused by the astrocyte activation seen in AD brain. More importantly, we found that the decrease in GLUT1 and GLUT3 levels correlated to the decrease in O-GlcNAcylation and to the hyperphosphorylation of tau at multiple abnormal phosphorylation sites seen in AD brain. These studies provide important evidence that deficiency of GLUTs contributes to abnormal hyperphosphorylation of tau and Alzheimer neurofibrillary degeneration. Improving brain glucose transport could be a potential therapeutic target for treating AD.
Acknowledgments
This work was supported in part by funds from the New York State Office of Mental Retardation and Developmental Disabilities; NIH grant AG027429; and a U.S. Alzheimer's Association grant (IIRG-05-13095). We thank Dr. Yanqiu Deng for technical assistance, Ms. Janet Murphy for secretarial assistance, and Ms. Maureen Marlow for editorial suggestions. We are also grateful to the Sun Health Research Institute Brain Donation Program of Sun City, Arizona, USA, for the provision of postmortem human brain tissue. The Brain Donation Program is partially supported by a National Institute on Aging grant (P30 AG19610, Arizona Alzheimer's Disease Core Center).
Footnotes
Abbreviations used. AD, Alzheimer disease; GFAP, glial fibrillary acid protein; GlcNAc, β-N-acetylglucosamine; GLUTs, glucose transporters; HIF-1, hypoxia-inducible factor 1; NFTs, neurofibrillary tangles.
Publisher's Disclaimer: This is a PDF file of an unedited manuscript that has been accepted for publication. As a service to our customers we are providing this early version of the manuscript. The manuscript will undergo copyediting, typesetting, and review of the resulting proof before it is published in its final citable form. Please note that during the production process errors may be discovered which could affect the content, and all legal disclaimers that apply to the journal pertain.
References
- 1.Arriagada PV, Growdon JH, Hedley-Whyte ET, Hyman BT. Neurofibrillary tangles but not senile plaques parallel duration and severity of Alzheimer's disease. Neurology. 1992;42:631–639. doi: 10.1212/wnl.42.3.631. [DOI] [PubMed] [Google Scholar]
- 2.Riley KP, Snowdon DA, Markesbery WR. Alzheimer's neurofibrillary pathology and the spectrum of cognitive function: findings from the Nun Study. Ann Neurol. 2002;51:567–577. doi: 10.1002/ana.10161. [DOI] [PubMed] [Google Scholar]
- 3.Alafuzoff I, Iqbal K, Friden H, Adolfsson R, Winblad B. Histopathological criteria for progressive dementia disorders: clinical-pathological correlation and classification by multivariate data analysis. Acta Neuropathol (Berl) 1987;74:209–225. doi: 10.1007/BF00688184. [DOI] [PubMed] [Google Scholar]
- 4.Grundke-Iqbal I, Iqbal K, Tung YC, Quinlan M, Wisniewski HM, Binder LI. Abnormal phosphorylation of the microtubule-associated protein tau (tau) in Alzheimer cytoskeletal pathology. Proc Natl Acad Sci U S A. 1986;83:4913–4917. doi: 10.1073/pnas.83.13.4913. [DOI] [PMC free article] [PubMed] [Google Scholar]
- 5.Gong CX, Liu F, Grundke-Iqbal I, Iqbal K. Impaired brain glucose metabolism leads to Alzheimer neurofibrillary degeneration through a decrease in tau O-GlcNAcylation. J Alzheimers Dis. 2006;9:1–12. doi: 10.3233/jad-2006-9101. [DOI] [PubMed] [Google Scholar]
- 6.Avila J. Tau phosphorylation and aggregation in Alzheimer's disease pathology. FEBS Lett. 2006;580:2922–2927. doi: 10.1016/j.febslet.2006.02.067. [DOI] [PubMed] [Google Scholar]
- 7.Hoyer S. Causes and consequences of disturbances of cerebral glucose metabolism in sporadic Alzheimer disease: therapeutic implications. Adv Exp Med Biol. 2004;541:135–152. doi: 10.1007/978-1-4419-8969-7_8. [DOI] [PubMed] [Google Scholar]
- 8.Liu F, Iqbal K, Grundke-Iqbal I, Hart GW, Gong CX. O-GlcNAcylation regulates phosphorylation of tau: a mechanism involved in Alzheimer's disease. Proc Natl Acad Sci U S A. 2004;101:10804–10809. doi: 10.1073/pnas.0400348101. [DOI] [PMC free article] [PubMed] [Google Scholar]
- 9.Li X, Lu F, Wang JZ, Gong CX. Concurrent alterations of O-GlcNAcylation and phosphorylation of tau in mouse brains during fasting. Eur J Neurosci. 2006;23:2078–2086. doi: 10.1111/j.1460-9568.2006.04735.x. [DOI] [PubMed] [Google Scholar]
- 10.Scheepers A, Joost HG, Schurmann A. The glucose transporter families SGLT and GLUT: molecular basis of normal and aberrant function. JPEN J Parenter Enteral Nutr. 2004;28:364–371. doi: 10.1177/0148607104028005364. [DOI] [PubMed] [Google Scholar]
- 11.McEwen BS, Reagan LP. Glucose transporter expression in the central nervous system: relationship to synaptic function. Eur J Pharmacol. 2004;490:13–24. doi: 10.1016/j.ejphar.2004.02.041. [DOI] [PubMed] [Google Scholar]
- 12.Schubert D. Glucose metabolism and Alzheimer's disease. Ageing Res Rev. 2005;4:240–257. doi: 10.1016/j.arr.2005.02.003. [DOI] [PubMed] [Google Scholar]
- 13.Qutub AA, Hunt CA. Glucose transport to the brain: a systems model. Brain Res Brain Res Rev. 2005;49:595–617. doi: 10.1016/j.brainresrev.2005.03.002. [DOI] [PubMed] [Google Scholar]
- 14.Dwyer DS, Vannucci SJ, Simpson IA. Expression, regulation, and functional role of glucose transporters (GLUTs) in brain. Int Rev Neurobiol. 2002;51:159–188. doi: 10.1016/s0074-7742(02)51005-9. [DOI] [PubMed] [Google Scholar]
- 15.Harr SD, Simonian NA, Hyman BT. Functional alterations in Alzheimer's disease: decreased glucose transporter 3 immunoreactivity in the perforant pathway terminal zone. J Neuropathol Exp Neurol. 1995;54:38–41. [PubMed] [Google Scholar]
- 16.Simpson IA, Chundu KR, Davies-Hill T, Honer WG, Davies P. Decreased concentrations of GLUT1 and GLUT3 glucose transporters in the brains of patients with Alzheimer's disease. Ann Neurol. 1994;35:546–551. doi: 10.1002/ana.410350507. [DOI] [PubMed] [Google Scholar]
- 17.Mooradian AD, Chung HC, Shah GN. GLUT-1 expression in the cerebra of patients with Alzheimer's disease. Neurobiol Aging. 1997;18:469–474. doi: 10.1016/s0197-4580(97)00111-5. [DOI] [PubMed] [Google Scholar]
- 18.Bensadoun A, Weinstein D. Assay of proteins in the presence of interfering materials. Anal Biochem. 1976;70:241–250. doi: 10.1016/s0003-2697(76)80064-4. [DOI] [PubMed] [Google Scholar]
- 19.Liu F, Zaidi T, Iqbal K, Grundke-Iqbal I, Gong CX. Aberrant glycosylation modulates phosphorylation of tau by protein kinase A and dephosphorylation of tau by protein phosphatase 2A and 5. Neuroscience. 2002;115:829–837. doi: 10.1016/s0306-4522(02)00510-9. [DOI] [PubMed] [Google Scholar]
- 20.Chen C, Pore N, Behrooz A, Ismail-Beigi F, Maity A. Regulation of glut1 mRNA by hypoxia-inducible factor-1. Interaction between H-ras and hypoxia. J Biol Chem. 2001;276:9519–9525. doi: 10.1074/jbc.M010144200. [DOI] [PubMed] [Google Scholar]
- 21.Hayashi M, Sakata M, Takeda T, Yamamoto T, Okamoto Y, Sawada K, Kimura A, Minekawa R, Tahara M, Tasaka K, Murata Y. Induction of glucose transporter 1 expression through hypoxia-inducible factor 1alpha under hypoxic conditions in trophoblast-derived cells. J Endocrinol. 2004;183:145–154. doi: 10.1677/joe.1.05599. [DOI] [PubMed] [Google Scholar]
- 22.Maxwell PH, Dachs GU, Gleadle JM, Nicholls LG, Harris AL, Stratford IJ, Hankinson O, Pugh CW, Ratcliffe PJ. Hypoxia-inducible factor-1 modulates gene expression in solid tumors and influences both angiogenesis and tumor growth. Proc Natl Acad Sci U S A. 1997;94:8104–8109. doi: 10.1073/pnas.94.15.8104. [DOI] [PMC free article] [PubMed] [Google Scholar]
- 23.Zelzer E, Levy Y, Kahana C, Shilo BZ, Rubinstein M, Cohen B. Insulin induces transcription of target genes through the hypoxia-inducible factor HIF-1alpha/ARNT. EMBO J. 1998;17:5085–5094. doi: 10.1093/emboj/17.17.5085. [DOI] [PMC free article] [PubMed] [Google Scholar]
- 24.Grateron L, Cebada-Sanchez S, Marcos P, Mohedano-Moriano A, Insausti AM, Munoz M, Arroyo-Jimenez MM, Martinez-Marcos A, Artacho-Perula E, Blaizot X, Insausti R. Postnatal development of calcium-binding proteins immunoreactivity (parvalbumin, calbindin, calretinin) in the human entorhinal cortex. J Chem Neuroanat. 2003;26:311–316. doi: 10.1016/j.jchemneu.2003.09.005. [DOI] [PubMed] [Google Scholar]
- 25.Rossler M, Zarski R, Bohl J, Ohm TG. Stage-dependent and sector-specific neuronal loss in hippocampus during Alzheimer's disease. Acta Neuropathol (Berl) 2002;103:363–369. doi: 10.1007/s00401-001-0475-7. [DOI] [PubMed] [Google Scholar]
- 26.Wang GL, Jiang BH, Rue EA, Semenza GL. Hypoxia-inducible factor 1 is a basic-helix-loop-helix-PAS heterodimer regulated by cellular O2 tension. Proc Natl Acad Sci U S A. 1995;92:5510–5514. doi: 10.1073/pnas.92.12.5510. [DOI] [PMC free article] [PubMed] [Google Scholar]
- 27.Semenza G. Signal transduction to hypoxia-inducible factor 1. Biochem Pharmacol. 2002;64:993–998. doi: 10.1016/s0006-2952(02)01168-1. [DOI] [PubMed] [Google Scholar]
- 28.Petersen RB, Nunomura A, Lee HG, Casadesus G, Perry G, Smith MA, Zhu X. Signal transduction cascades associated with oxidative stress in Alzheimer's disease. J Alzheimers Dis. 2007;11:143–152. doi: 10.3233/jad-2007-11202. [DOI] [PubMed] [Google Scholar]
- 29.Nikinmaa M, Pursiheimo S, Soitamo AJ. Redox state regulates HIF-1alpha and its DNA binding and phosphorylation in salmonid cells. J Cell Sci. 2004;117:3201–3206. doi: 10.1242/jcs.01192. [DOI] [PubMed] [Google Scholar]
- 30.Mirra SS, Heyman A, McKeel D, Sumi SM, Crain BJ, Brownlee LM, Vogel FS, Hughes JP, van Belle G, Berg L. The Consortium to Establish a Registry for Alzheimer's Disease (CERAD). Part II. Standardization of the neuropathologic assessment of Alzheimer's disease. Neurology. 1991;41:479–486. doi: 10.1212/wnl.41.4.479. [DOI] [PubMed] [Google Scholar]


