

Abstract
A blood-brain barrier (BBB) model composed of porcine brain capillary endothelial cells (BCEC) was exposed to a moderately excessive zinc environment (50 µmol Zn/L) in cell culture and longitudinal measurements were made of zinc transport kinetics, ZnT-1 (SLC30A1) expression, and changes in the protein concentration of metallothionein (MT), ZnT-1, ZnT-2 (SLC30A2), and Zip1 (SLC39A1). Zinc release by cells of the BBB model was significantly increased after 12–24 h of exposure, but decreased back to control levels after 48–96 h, as indicated by transport across the BBB from both the ablumenal (brain) and lumenal (blood) directions. Expression of ZnT-1, the zinc export protein, increased 169% within 12 h, but was no longer different from controls after 24 h. Likewise, ZnT-1 protein content increased transiently after 12 h of exposure but returned to control levels by 24 h. Capacity for zinc uptake and retention increased from both the lumenal and ablumenal directions within 12–24 h of exposure and remained elevated. MT and ZnT-2 were elevated within 12 h and remained elevated throughout the study. Zip1 was unchanged by the treatment. The BBB’s response to a moderately high zinc environment was dynamic and involved multiple mechanisms. The initial response was to increase the cell’s capacity to sequester zinc with additional MT and increase zinc export with the ZnT-1 protein. But, the longer term strategy involved increasing ZnT-2 transporters, presumably to sequester zinc into intracellular vesicles as a mechanism to protect the brain and maintain brain zinc homeostasis.
Keywords: zinc homeostasis, zinc toxicity, blood-brain barrier, zinc transporters, metallothionein
1. Introduction
Zinc has many critical functions in the brain that require its presence in precise concentrations (1). Adequate zinc nutriture is essential for optimal neurological development and function (1, 2). Zinc excess has a profound negative effect on neurological cells, which are highly susceptible to extremes in extracellular zinc concentrations (3). For instance, brief exposure to high levels of zinc by cortical cells in culture led to widespread neuronal degeneration (4) and oxidative stress-related neuronal death (5). An elevated concentration of zinc induced aggregation of the amyloid-beta protein in senile plaques of Alzheimer's disease (6) and senile plaques contain elevated concentrations of zinc (7). It seems that zinc may protect against amyloid-beta toxicity at low concentrations, but excess zinc may enhance amyloid-beta toxicity (8, 9). Extracellular zinc in the brain has also been implicated in the development of cerebral amyloid angiopathy (10) and advanced Alzheimer's disease (11). There are several potential mechanisms by which an impairment in brain-zinc homeostasis might influence the progression of Alzheimer's disease and other neuropathologies (3, 12).
The blood-brain barrier (BBB) is the specialized system of capillary endothelial cells that protects the brain from harmful substances in the bloodstream, while supplying the brain with the required nutrients for proper function (13). Zinc enters the brain through the BBB (14), even though the BBB is relatively impermeable to zinc (15). The prevailing evidence indicates that there are specific zinc transport sites on the luminal surface of the brain capillary endothelial cells (BCEC) (16). Therefore, it is reasonable to anticipate that the BBB has a role in maintaining brain zinc homeostasis. The limited evidence of this includes enhanced uptake by the brains of zinc-deficient rats (17, 18) and enhanced transport of zinc across an in vitro model of the BBB that was exposed to zinc-deficient conditions (19). Less is understood about brain zinc homeostasis during zinc excess.
Cells rely upon a complex and dynamic set of molecular mechanisms to maintain zinc homeostasis through the regulated expression of proteins for zinc import, zinc export, and zinc sequestration (20, 21). Additionally, zinc homeostatic mechanisms appear to be tissue specific, as cells from various tissues rely upon differential strategies such that specific transporters are used in certain tissues (22, 23) and the expression of these transporters may vary with zinc status and time (23, 24). Since the brain’s neurons are highly vulnerable to zinc excess, we hypothesized that the BBB would be a first line of defense against neurological injury during periods of excessive zinc intake. We found that the BBB could adjust zinc transport rates to the prevailing zinc status, thereby protecting the brain cells from zinc toxicity. We also measured a variety a putative mediators of zinc homeostasis that we thought were most likely to be involved in the maintenance of brain zinc homeostasis: metallothionein (MT), ZnT-1 (SLC30A1), ZnT-2 (SLC30A2), and Zip1 (SLC39A1). This is the first report of longitudinal changes in any zinc transporters of the BBB.
2. Materials and methods
2.1. Cell Isolation
Brain capillary endothelial cells (BCEC) were isolated from Yucatan miniature swine (Sus scrofa) as previously described (19, 25). BBB models were constructed as previously described (19) by subculturing 4–5 d old primary cultures of BCEC at 85,000 cells/cm² onto permeable 12 mm Transwell cell culture inserts with 0.4 µm pore size (No. 3401, Corning Costar, Park Ridge, IL). The inserts were suspended between two chambers of culturing medium and the BCEC formed an endothelial barrier analogous to the BBB. For mRNA expression studies, BCEC were seeded at 12,000 cells/cm² into T-25 tissue culture flasks (Corning Costar, Park Ridge, IL). All culturing surfaces were fibronectin-coated (2 µg/cm²).
2.2. BBB model validation
BCEC isolations were monitored daily for endothelial characteristics, including density-inhibited growth and recognizable endothelial cell morphology: slightly ellipsoid nucleus surrounded by a cigar-like plasma membrane (26). BCEC tested positive for acetylated-low density lipoprotein uptake (27) and Factor VIII-related antigen (28), classic endothelial cell characterization assays. Transendothelial electrical resistance (TEER) of the BBB models was recorded daily as a physiological measure of monolayer integrity and barrier function (29). TEER reflects impedance of the passage of small ions through the physiological barrier, and is widely recognized as one of the most accurate and sensitive measures of BBB integrity (29, 30). A decrease in TEER reflects an increase in permeability and a loss of barrier function. TEER of the BBB model was recorded by an Endohm chamber connected to an EVOM resistance meter (World Precision Inst., Inc., Sarasota, FL). TEER of each BBB model was calculated by subtracting the TEER of a permeable Transwell membrane without BCEC, and is reported as Ω*cm².
2.3. Induction of altered zinc status
Growth medium was composed of 2% fetal bovine serum and 13% platelet-poor horse serum in minimum essential medium (MEM) with Earl’s salts, L-glutamine, and bicarbonate; plus 100 mg heparin, 50 mg endothelial cell growth supplement (ECGS), 5 mg amphotericin B, and 50 mg gentamicin/L. Zinc concentration of the growth medium was determined by flame atomic absorption spectrophotometry to be 3 µmol/L. The in vitro induction of moderately excessive zinc environments was achieved by adding ZnCl2 to raise the zinc concentrations to 50 µmol/L in the growth medium. Longitudinal measurements were made at six time points (0, 12, 24, 48, 72 and 96 h). The experiments ended with the simultaneous measurements being made in all treatment groups, so the treatment beginnings were staggered. For example, the 96 h group was switched from the growth medium to the high zinc medium two days after seeding; 24 h later, the medium was switched for the 72 h group. The 0 h treatment group was never switched to the high zinc medium, and was considered the control group. Fresh medium was applied every 48 h in all groups.
2.4. Analysis of metallothionein
Assessment of metallothionein (MT) content was conducted using the cadmium-hemoglobin affinity assay (31) as previously described (32). Protein concentration was measured with bicinchoninic acid (33). MT is reported as pmoles/mg cellular protein.
2.5. Analysis of zinc uptake and transport
Zinc uptake and retention by, as well as transport across, the BBB models were measured as described (19). The medium used to measure the kinetics of zinc transport in all treatments of all experiments was the growth medium. Since this test medium was the same for all treatments, all differences in the rates of zinc transport were due to differences in the cells because of their culturing environments. Briefly, lumenal and ablumenal growth media were removed. Cell monolayers on Transwell inserts were briefly rinsed four times in 37°C HEPES buffer, followed by the application of 65Zn-labeled (3.7 × 10⁴ Bq/mL) growth medium on one side and non-labeled control medium on the other side. For measurement of uptake and transport from the “blood” side of the cells, the labeled medium was applied to the lumenal chamber; for measurement of uptake and transport from the “brain” side of the cells, the labeled medium was applied to the ablumenal chamber. Cells were incubated for 60 min on an orbital shaker at 30 rpm inside a 37°C incubator. Media were collected for analysis of radioactivity, and the results converted to pmoles Zn based on the specific activity of the labeled transport medium. Zinc transport across the BBB was expressed as pmoles Zn/(h × cm² of cell monolayer). Zinc uptake and retention by the BCEC during the 60 min incubation was estimated by briefly rinsing the Transwell insert twice in HEPES/EDTA buffer and then rinsing 6 times in HEPES buffer and removing the membrane with cells for analysis of radioactivity. The results were converted to pmoles Zn/(h × cm² of cell monolayer) based on the specific activity of the radiolabeled incubation medium. TEER was measured immediately before and after all zinc transport measurements to insure that our measurements did not impair the BBB model’s integrity.
2.6. Identification of the porcine ZnT-1 gene
The BCEC in our BBB model were derived from miniature swine (Sus scrofa). Although miniature swine are commonly used in biomedical research, the genome remains relatively unknown. Therefore, we first identified the gene for ZnT-1 (SLC30A1) in the porcine genome that is orthologous to the human gene. The moderately excessive zinc medium was applied to primary cultures of BCEC for 18 h to induce transcription of the zinc efflux transporter. The BCEC were lysed and total RNA was isolated with TRIzol Reagent (Invitrogen Life Technologies) and its quality established by agarose gel electrophoresis. The concentration was determined through spectrophotometry. Double-stranded cDNA was generated using the Creator SMART cDNA Library Construction Kit (Clontech, Palo Alto, CA). At that point, PCR with degenerate primers was used to isolate the zinc transporter transcripts. ZnT-1 specific degenerate primers were designed by comparing translated sequences of mRNA from available species (human, rat, mouse and frog) for ZnT-1. These sequences were obtained from Genbank and aligned using DNA Star software (DNASTAR, Inc., Madison, WI) such that conserved domains between species could be identified. A 626bp PCR product representing a partial coding sequence of ZnT-1 was identified and sequenced. This partial coding sequence was then used as a query in a BLAST search of the NCBI trace file archives of shotgun genomic clones of S. scrofa. The matching clones were assembled using Sequencer 4.6 (Gene Code Corporation, Ann Arbor, MI).
2.7. Analysis of ZnT-1 expression
Once the mRNA transcript of the porcine ZnT-1 had been sequenced, highly-specific primers and probes were designed for real-time PCR expression studies. The BBB models were maintained in the moderately excessive zinc environment for the six durations (0, 12, 24, 48, 72 175 and 96 h). Total RNA was isolated using the GenElute Mammalian Total RNA Kit (Sigma, St. Louis, MO), treated with DNAse 1 and quantified with the RiboGreen RNA Quantitation Reagent and Kit (Molecular Probes, Inc., Eugene, OR). SuperScript III First-Strand Synthesis System for RT-PCR (Invitrogen Life Technologies) was used for making cDNA. The primers and probe for Real-time PCR were designed using Primer Express software (Applied Biosystems) based upon the sequence of the porcine ZnT-1 gene (GenBank accession #AY918800), specifically for use with TaqMan polymerase. The polymerase, primers and probe were ordered from Applied Biosystems. Forward Primer: AGACCATTAAGGACGTTTTCCATAA. Reverse Primer: GACTTAGAGCCTACGCTAGCAAACTC. Probe: CACGGAATTCACGCTACCACCATTCA.
The samples were run in the GenAmp 5700 thermal cycler (Applied Biosystems) for 40 cycles of the following program: 95°C for 15 sec, 55°C for 30 sec, and 65°C for 1 min. The probe was affixed with a fluorescent dye, 6-FAM (6-carboxyfluorescein) at the 5’ end and a quenching molecule, TAMRA (6-carboxy tetramethyl rhodamine), at the 3’ end. Data were adjusted for PCR efficiency with the equation lnT = k − Ct ln(1+E), where T is template concentration, Ct is the critical cycle, k is a constant specific to the GenAmp 5700 and E is efficiency.
2.8. Relative concentrations of ZnT-1, ZnT-2, and Zip1 transporters
Cell lysates were collected from the BBB models following treatment and denatured in Laemmli buffer containing β-mercaptoethanol (50 g/L) and boiled for 4 min. Western blot analysis was performed on equal amounts of protein (10 µg) diluted 1:1 in Laemmli sample buffer and resolved by SDS-PAGE (10% Tris-glycine, 0.2% SDS). Proteins were transferred to a nitrocellulose membrane for 90 min at 100 V. The membrane was then blocked overnight at 4°C in 5% nonfat dry milk in PBS-T (0.1% Tween-20 in PBS). After washing three times in PBS-T, the membranes were incubated in 1:1000 dilution of primary antibody for 45 min. Primary antibodies against ZnT-1 (GTRPOVHSGKE), ZnT-2 (GKFNFHTMTIQIESYSEDMKSCQECQGPSE), and Zip1 (SGPSPLEETRALLGTVNGGPQHWHDGPGVPQASGAPATPSA) were generously provided by Kelleher and Lonnerdal (34). The ZnT-1 and ZnT-2 antibodies were generated in rabbit by Zymed Laboratories (San Francisco, CA) and the Zip1 in chickens by Jackson Immuno-Research (West Grove, PA). After again washing three times in PBS-T, the membranes were incubated in secondary antibodies: for ZnT-1 and ZnT-2, alkaline phosphatase goat anti-rabbit IgG (1:2000 in PBST); for Zip1, alkaline phosphatase goat anti-chicken IgY (1:2000 in PBST). After four washes in PBST, the membranes were incubated in chemiluminescent substrate (Biomolecular Probes, Eugene, OR) for 5 min, then exposed to Kodak BioMax MR photographic film for 3–7 min for visualization, and the film was then developed using a Konica SRX-101. Densitometric analysis was performed using UN-SCAN-IT gel software (ver. 6.1, Silk Scientific, Orem, UT). Controls for non-specific binding of the antibodies were performed with normal serum; none was detected. Membranes were stripped and reprobed for β-actin as a loading control. Preliminary studies demonstrated no significant effect of our high zinc treatment on β-actin content of BCEC.
2.9. Statistical Analysis
Studies were analyzed as a randomized complete block, with each experiment as a block, with replicates over time as the block (35). Analysis of variance and non-linear fitting of the experimental data were performed with Systat (Version 9, Chicago, IL). Data from replications of the same experimental design were pooled when they passed the test of homogeneity. Fishers Protected LSD (Least Significant Difference) test was used for pair-wise comparisons of multiple groups. Dunnett’s test was used for comparison of multiple groups with a control group. Differences were considered significant if P < 0.05.
Data from real-time PCR allowed the comparison of relative difference between two samples. Each of the five treatments was compared to the control sample for that experiment. In each experiment, the amount of ZnT-1 transcripts in the control sample was set as a constant, 1. The amount of ZnT-1 transcripts in each of the treated samples was calculated as a ratio of the control, or rather as a ratio of 1. PCR results are presented as the means of four distinct experiments ± SD. The amount of zinc transporter protein measured by Western blot analysis was similarly calculated as a ratio of 1. A modified Dunnett’s Test for multiple comparisons to a constant was performed to assess statistical significance.
2.10. Reagents
Reagents were obtained though Sigma Chemical Co. (St. Louis, MO USA), unless otherwise stated in the text.
3. Results
The moderately excessive zinc environment had no significant effect on the growth or morphology of the brain capillary endothelial cells (BCEC). We conducted several iterations of preliminary experiments in order to establish culturing conditions that would significantly alter zinc status without discernable alterations in cell health, which we henceforth refer to as 'moderate zinc excess'. We selected cellular MT concentration as a sensitive indicator of high cellular zinc status (36). The lowest zinc concentration that would consistently induce an elevation of MT after 12 h exposure was 50 µmol Zn/L (Fig. 1). This was in agreement with previous studies from our laboratory (32). Thus, 50 µmol/L was chosen as the zinc concentration for use in subsequent studies of moderate zinc excess. TEER was selected as the most sensitive indicator of BCEC function, and it was not affected by the 50 µmol/L zinc treatment.
Fig. 1.
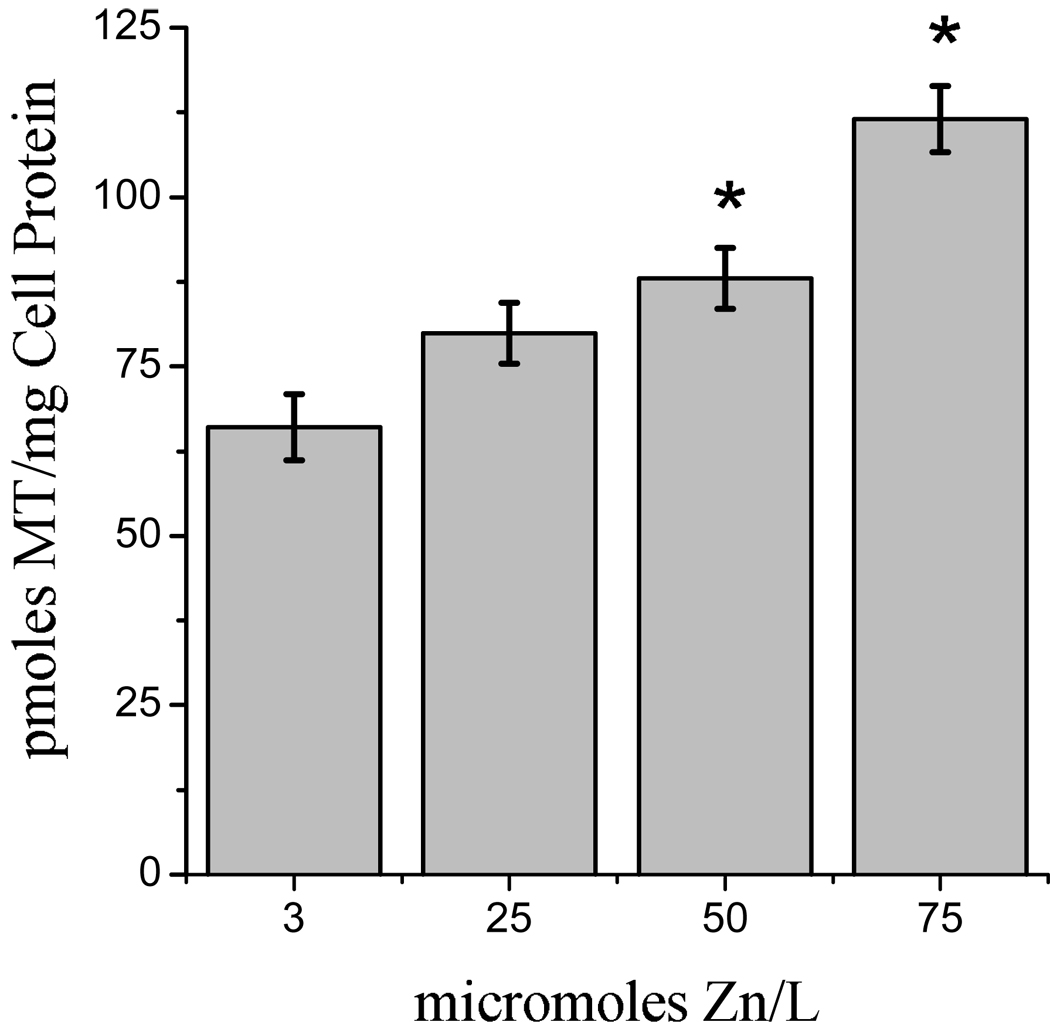
Influence of zinc status on the metallothionein (MT) content of BCEC. Cells were supported in treatment media with different zinc concentrations for 12 hours prior to the measurement of MT. Columns represent means ± SEM, n = 7. Columns with asterisks are significantly different from controls at P < 0.01.
Based on our previous work (19), we hypothesized that the zinc homeostatic response would be multifaceted and dynamic, varying over time. Therefore, we conducted longitudinal experiments that measured the kinetics of zinc transport in both directions across the BBB model after different times of exposure to the moderately high zinc environment. Zinc transport was measured simultaneously in all treatments with radiolabeled incubation media that had a similar zinc concentration (3 µmol/L Zn) across all treatments, independent of the media in which cells were cultivated. Therefore, differences in zinc transport by the cells reflect molecular changes within the cells in response to the treatments. In cells treated with the moderately high zinc medium for 12 and 24 h, the rate of zinc transport across the BBB from the ablumenal (brain) side to the lumenal (blood) side was increased by 20% (Fig. 2). However, zinc transport was no longer elevated after 48 – 96 h. In fact, the zinc transport rate at 96 h appeared to be trending downward toward a rate slower than controls. Zinc transport across the BBB from the lumenal (blood) to ablumenal (brain) chambers increased by 25% at 12 h and by 30% at 24 h of moderately high zinc exposure (Fig. 2). However, zinc transport was no longer elevated after 48 – 96 h. The cells of the BBB responded to the excess zinc environment by transiently increasing their ability to export zinc in both directions, presumably as a means of survival. They subsequently resumed a control level of zinc export capacity. Thus, adjusting zinc export was not a principal long term homeostatic mechanism.
Fig. 2.

Longitudinal changes in the rate of zinc transport across the BBB model when exposed to a moderately excessive zinc environment. The rate from the lumenal (blood) side to the ablumenal (brain) side is represented by the solid line and square symbols. The rate from the ablumenal (brain) side to the lumenal (blood) side is represented by the dashed line and triangle symbols. Release from the BBB cells is presumed to be the rate limiting step. BBB models were supported in the control medium (3 µmol Zn/L) and then switched to the treatment medium (50 µmol Zn/L) for the designated durations; the zinc transport rate was measured during a 60 min incubation using radiolabeled control medium. Data are expressed as mean ± SEM of combined data from 3 experiments, n = 18. The rates in both directions were significantly greater (P < 0.05) at 12 and 24 h of exposure to the moderately high zinc environment than the control group (0 h exposure).
Zinc uptake and retention within the BBB models were examined from both directions. The capacity for zinc uptake and retention from the lumenal (blood) side of the BBB was significantly higher than controls after only 12 h of exposure to the moderately high zinc environment (Fig. 3), and was increased by 60% after 96 h. The capacity for zinc uptake and retention by the cells from the ablumenal (brain) side of the cells was not different after 12 h of excess zinc exposure (Fig. 3); but was significantly increased after 24 h, and was increased by 70% after 96 h. The ability to take zinc from the brain side was consistently about four (3.5 – 4.6) times greater than from the blood side. This could facilitate ‘mopping up’ of any excess zinc from the brain.
Fig. 3.
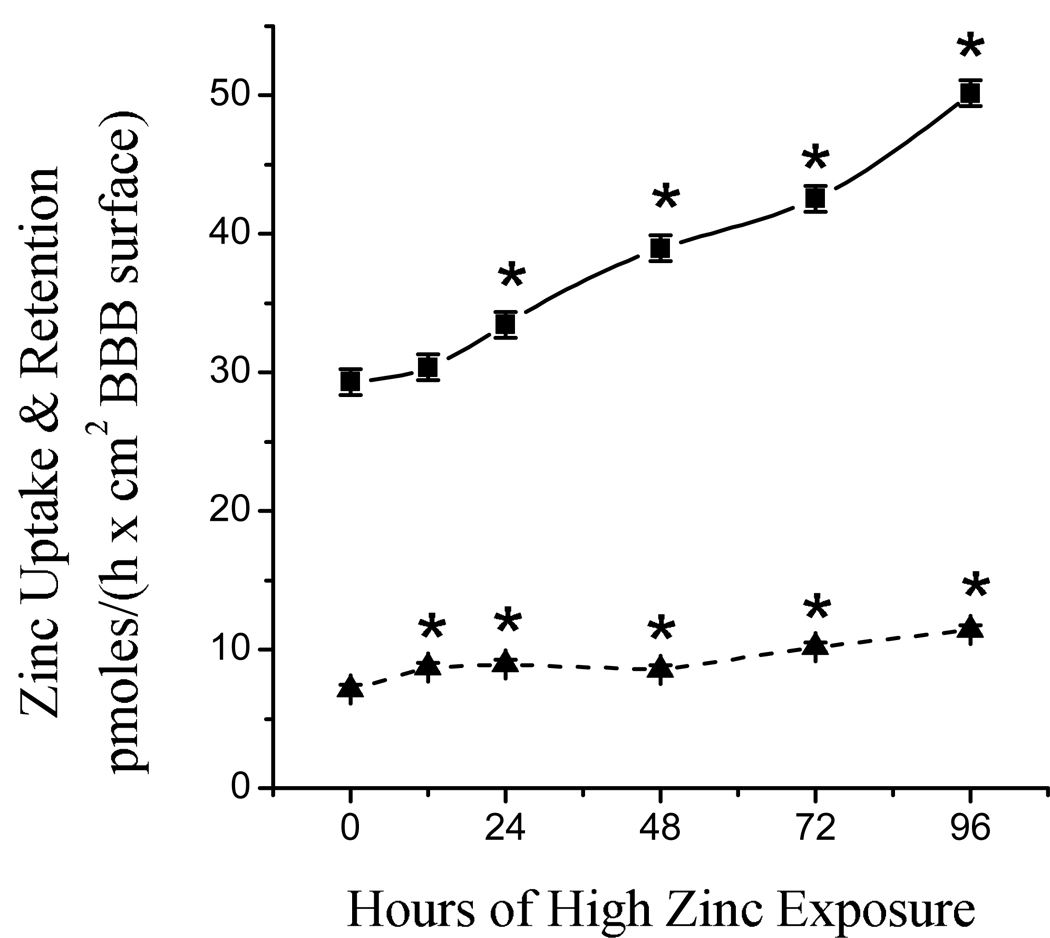
Longitudinal changes in the rate of zinc uptake and retention by BBB models when exposed to a moderately excessive zinc environment. The rate from the ablumenal (brain) side is represented by the solid line and square symbols. The rate from the lumenal (blood) side is represented by the dashed line and triangle symbols. Cells were supported in the control medium (3 µmol Zn/L) and then switched to the treatment medium (50 µmol Zn/L) for the designated durations; zinc uptake was measured during a 60 min incubation using radiolabeled control medium. Data are expressed as mean ± SEM from 3 experiments, n = 18. Symbols with an asterisk are significantly different from controls at P < 0.05.
We hypothesized that the cells of the BBB were retaining the zinc in complex with MT. We observed that the MT content was increased by 36% within 12 h of exposure to the moderately high zinc environment (Fig. 4). MT remained elevated throughout the study, but was trending back downward toward control levels as the duration of exposure lengthened.
Fig. 4.
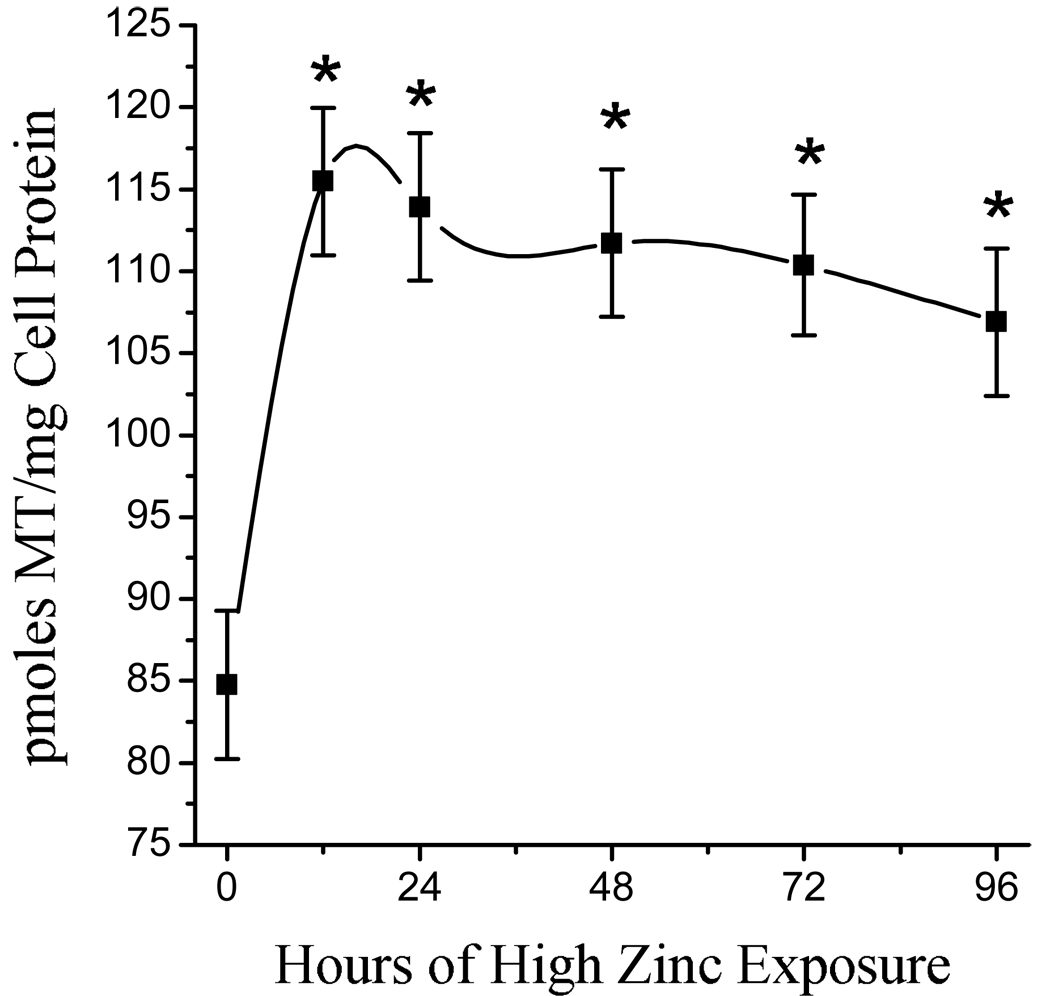
Longitudinal changes in the MT content of a BBB model when exposed to a moderately excessive zinc environment. MT was measured after cells were supported in the control medium (3 µmol Zn/L) and then switched to the treatment medium (50 µmol Zn/L) for the designated durations. Data are expressed as mean ± SEM from two experiments, n = 9–10. Symbols with asterisks are significantly different from controls at P < 0.05.
We next wanted to investigate whether the zinc efflux transporter, ZnT-1, was involved in the cellular response to excess zinc. Since no porcine zinc transporters had been identified to date, it was first necessary to isolate and sequence the porcine ZnT-1 gene. Degenerate primers were used to amplify a 626bp product from mRNA (GenBank Accession # AY918800). Subsequent comparison to genomic sequences identified the ZnT-1 coding region matching this partial cDNA. The sequence has 92% homology to human ZnT-1 mRNA and 82% homology to rat ZnT-1 mRNA. Real-time PCR was used to measure the influence of a moderately excessive zinc environment on the ZnT-1 mRNA content of BCEC (Fig. 5). ZnT-1 mRNA expression was 169% greater (P < 0.05) than controls after 12 h, but declined back to control levels by 24 h, and trended lower after that.
Fig. 5.

Longitudinal changes in the relative amounts of ZnT-1 mRNA in a BBB model exposed to a moderately excessive zinc environment. Cells were supported in the control medium (3 µmol Zn/L) and then switched to the treatment medium (50 µmol Zn/L) for the designated durations; porcine ZnT-1 mRNA was measured using real-time PCR. Data points represent the mean ratio ± SD of ZnT-1 transcripts in the 12, 24, 48, 72, and 96 h samples as compared to the control in each of four experiments. Only the 12 h sample exhibited a statistically significant difference from control at a confidence level of P < 0.05.
We identified two partial gene sequences that corresponded to two exons of the human ZnT-1 gene. Fig. 6 displays an alignment of the amino acid sequences of the two porcine exons with their corresponding human sequences. They share 94% amino acid identity. Thus, we had confidence in the antibody against ZnT-1 generously provided by Kelleher and Lonnerdal, even though we were unable to extend the sequence through the region of the peptide used to generate the antibody. When we exposed the BBB models to the moderately high zinc environment, there was a similarly transient increase in ZnT-1 protein after 12 h (Fig. 7). The relative amount of ZnT-2 was increased after 12 h and remained elevated throughout 96 h of exposure, while the amount of Zip1 transporter protein was not different at any time point studied (Fig. 7).
Fig. 6.
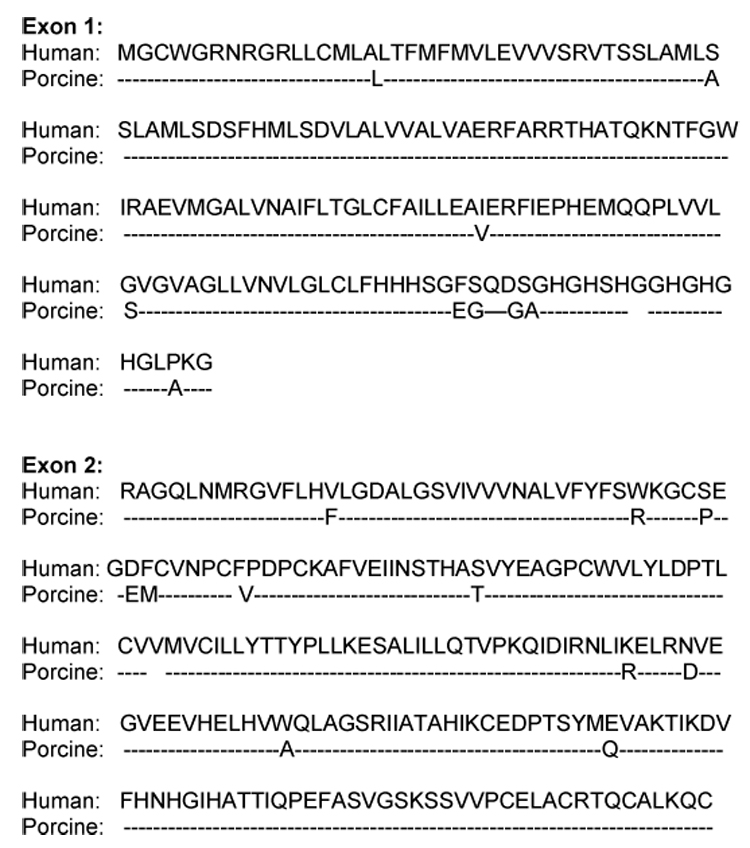
Two partial fragments of the porcine ZnT-1 gene were translated into their corresponding amino acid sequences and aligned with their counterparts from the human ZnT-1 gene. The porcine and human sequences shared 94% amino acid identity. Regions of similarity are indicated by dashes on the porcine sequence; discrepancies are indicated in the porcine translation.
Fig. 7.


Fig. 7a. Representative Western blots of ZnT-1, ZnT-2, and Zip1 protein levels in BBB models exposed to a moderately excessive zinc environment quantity in response to high zinc at different times throughout a 96 h period.
Fig. 7b. Longitudinal changes in the relative amounts of ZnT-1, ZnT-2, and Zip1 in a BBB model when exposed to a moderately excessive zinc environment. Cells were supported in the control medium (3 µmol Zn/L) and then switched to the treatment medium (50 µmol Zn/L) for the designated durations. The relative protein concentrations were determined by Western Blot analysis. Data points represent the mean ratio ± SD of each protein in the 12, 24, 48, 72, and 96 h samples as compared to the control in each of three experiments. Asterisks indicate when a mean exhibited a statistically significant difference from control at a confidence level of P < 0.05.
4. Discussion
There is a concern that elevated concentrations of zinc in the brain contribute to the progression of Alzheimer's disease and other neuropathologies (3, 12). Zinc supplements are being consumed in amounts that exceed the RDA (37). Yet, there is very little known about whether the brain can withstand these excesses. The current study investigated whether the BBB protects the brain from excess zinc in the blood. The BBB model responded dynamically to the moderately high zinc environment in a manner consistent with a strategy to avoid excessive zinc accumulation in the brain. The cells of the BBB initially increased their ability to export zinc with a transient increase in a zinc export protein (ZnT-1), which might be interpreted as self-protective. This transient response was followed by a more altruistic strategy that enhanced the BBB’s ability to sequester zinc; an ability that was four times greater from the BBB surface facing the brain than from the surface facing the blood. This coincided with an increase in MT and ZnT-2 proteins in the BBB; which bind zinc intracellularly and pump zinc into intracellular vesicles, respectively. This enhanced ability to uptake and sequester zinc from the brain is presumably to enhance the BBB’s ability to maintain brain zinc homeostasis.
An in vitro model of the BBB enabled us to exquisitely manipulate the environment and precisely measure molecular changes in brain zinc homeostasis. The longitudinal nature of this project required a moderately excessive zinc environment that would induce cellular responses while being tolerated by the cells for four days. We adopted 50 µmol/L because this amount consistently induced a significant increase in cellular MT without any discernable injury to the cells, including having no impact on BBB permeability as determined by TEER. The BBB model included capillary endothelial cells derived from pig brains. Plasma zinc is 12 µmol/L in pigs, but can rise to 28 µmol/L after chronic zinc supplementation (38). Human plasma zinc is typically 15 µmol/L, but can rise up to 183 µmol/L during acute zinc toxicity (39).
Endothelial cells that form the walls of blood vessels are analogous to epithelial cells, possessing lumenal and ablumenal surfaces that are functionally distinct. Since the tight intercellular junctions between the endothelial cells are relatively impermeable to zinc, passage across the BBB would necessitate transport through both lumenal and ablumenal cellular membranes. Transport across could be regulated at either location or at some intracellular location. Our evidence indicates that zinc transport across the BBB was initially increased in both the lumenal and ablumenal directions, but declined back toward control values within 48 h of high zinc exposure. This initial increase in transport is counter-productive to maintenance of brain zinc homeostasis, but may be explained as the cells’ efforts for self-preservation. This increase coincided with a transient increase in the zinc export protein, ZnT-1, at 12 h of exposure to the moderately excessive zinc environment. This protein also increased in response to zinc toxicity in cultured neurons (40). Conversely, ZnT-1 decreased in the brain tissue of rat pups on a zinc deficient diet (18). ZnT-1 may be responsible for release of zinc from epithelial cells of the small intestine, where its expression was correlated with changes in metallothionein (41, 42) during high zinc exposure. However, the subsequent decline in ZnT-1 expression and ZnT-1 protein content observed in our longitudinal study indicates that its enhanced role in the BBB is transient.
The capacity for zinc uptake was significantly increased from both directions within 12 – 24 h, and continued to increase with continued exposure. While the capacity to release zinc was remarkably similar in each direction, the capacity to take up and retain zinc from the brain side was consistently four times greater than from the blood side. Since zinc transport was measured with the same (control) growth medium for all treatments, no matter how long the exposure to the high zinc environment, differences in transport were due to changes in the cells resulting from their treatments. It is difficult to discern which particular step in the transport process through the cell is most affected, based solely on kinetic evidence. Since uptake was measured during a 60 min incubation (simultaneously with transport through the BBB), we were not measuring the initial velocity of uptake. Initial velocity is best measured during a 10 min incubation (43), since a significant amount of the zinc taken up from one side is already exiting the other side within 20 min (19). Thus, ‘uptake’ in our experimental design also includes retention.
After 48 h (48 – 96 h) of exposure to the moderately high zinc environment, the capacity for zinc transport across the BBB in either direction was no longer different from controls and was trending lower, while zinc uptake and retention continued to increase from both directions. This is in agreement with our previous study (19) that found an increase in zinc uptake into the cells of the BBB while transport across the BBB declined when exposed to high zinc for five days (120 h, as compared to the 96 h in the present studies). The prevailing evidence indicates that zinc ‘retention’ was the component that was increasing, rather than the capacity for ‘uptake’. A high zinc environment also did not influence the rate of zinc uptake (measured as initial velocity) of bovine arterial endothelial cells (44). In agreement with this observation, Zip1 was not significantly changed in the BBB models throughout this study. Zip1 was critical in responding to a zinc deficiency in pregnant mice, but was dispensable when zinc was replete (45). The overall conclusion is that the cellular response to zinc deficiency was to increase zinc importers, without affecting exporters. The response to zinc excess was to increase zinc sequestration and zinc exporters; it does not appear to alter the number of zinc importers (at least not Zip1).
MT and ZnT-2 were the zinc proteins that remained elevated after their initial increase within 12 h of the moderately high zinc exposure. However, the MT concentration was trending downward toward control levels during the four days of chronic exposure. MT is widely recognized as an intracellular protein that binds zinc and other divalent cations to protect cells when their concentrations become elevated (20). Our procedure for measuring MT was the Cd-binding assay of Eaton and Cherian (31); so, it is possible that some other Cd-binding proteins other than MT were elevated, though we are unaware of other Cd-binding proteins that are induced by chronic zinc exposure. ZnT-2 has been localized to the membranes of intracellular vesicles in BHK cells (46) and pancreatic acinar cells (47), where ZnT-2 is presumed to function by transporting zinc from the cytosol into the vesicle (zincosome) for sequestration (21). MT and ZnT-2 are presumably performing a similar function in the cells of the BBB, sequestering zinc that has been withdrawn from the brain.
Thus, after an initial period of self-preservative enhanced zinc extrusion, the cells of the BBB attempted to maintain brain zinc homeostasis by increasing their ability to take zinc up from the brain (and the blood) and sequester the zinc into intracellular vesicles and/or bind it with MT.
Acknowledgements
The authors wish to thank Tom Oxford of the UNH Miniature Swine Research Facility for his expert animal handling, Christopher Neefus of the UNH Office of Biometrics for his statistical support, and the UNH Hubbard Center for Genomic Studies for technical support. This is scientific contribution 2276 from the New Hampshire Agricultural Experiment Station.
Footnotes
Supported by National Institute of Neurological Disorders and Stroke grant R15 NS35285.
Publisher's Disclaimer: This is a PDF file of an unedited manuscript that has been accepted for publication. As a service to our customers we are providing this early version of the manuscript. The manuscript will undergo copyediting, typesetting, and review of the resulting proof before it is published in its final citable form. Please note that during the production process errors may be discovered which could affect the content, and all legal disclaimers that apply to the journal pertain.
References
- 1.Takeda A. Zinc homeostasis and functions of zinc in the brain. BioMetals. 2001;14:343–351. doi: 10.1023/a:1012982123386. [DOI] [PubMed] [Google Scholar]
- 2.Prasad AS. The role of zinc in brain and nerve functions. In: Connor, editor. Metals and Oxidative Damage in Neurological Disorders. New York: Plenum Press; 1997. pp. 95–111. [Google Scholar]
- 3.Colvin R, Fontaine C, Laskowski M, Thomas D. Zn2+ transporters and Zn2+ homeostasis in neurons. Eur J Pharmacol. 2003;479:171–185. doi: 10.1016/j.ejphar.2003.08.067. [DOI] [PubMed] [Google Scholar]
- 4.Kim EY, Koh JY, Kim YH, Sohn S, Joe E, Gwag BJ. Zn2+ entry produces oxidative neuronal necrosis in cortical cell cultures. Eur J Neurosci. 1999;11:327–334. doi: 10.1046/j.1460-9568.1999.00437.x. [DOI] [PubMed] [Google Scholar]
- 5.Kim YH, Park JH, Hong SH, Koh JY. Nonproteolytic neuroprotection by human recombinant tissue plasminogen activator. Science. 1999;284:647–650. doi: 10.1126/science.284.5414.647. [DOI] [PubMed] [Google Scholar]
- 6.Bush AI, Pettingell WH, Multhaup G, Paradis MD, Vonsattel JP, Gusella JF, Beyreuther K, Masters CL, Tanzi RE. Rapid induction of Alzheimer AB amyloid formation by zinc. Science. 1994;265:1464–1467. doi: 10.1126/science.8073293. [DOI] [PubMed] [Google Scholar]
- 7.Lovell MA, Robertson JD, Teesdale WJ, Campbell JL, Markesbery WR. Copper, iron and zinc in Alzheimer's disease senile plaques. J Neuro Sci. 1998;158:47–52. doi: 10.1016/s0022-510x(98)00092-6. [DOI] [PubMed] [Google Scholar]
- 8.Lovell MA, Xie C, Markesbery WR. Protection against amyloid beta peptide toxicity by zinc. Brain Res. 1999;823:88–95. doi: 10.1016/s0006-8993(99)01114-2. [DOI] [PubMed] [Google Scholar]
- 9.Brown AM, Tummolo DM, Rhodes KJ, Hofmann JR, Jacobsen JS, Sonnenberg-Reines J. Selective aggregation of endogenous B-amyloid peptide and soluble amyloid precursor protein in cerebrospinal fluid by zinc. J Neurochem. 1997;69:1204–1212. doi: 10.1046/j.1471-4159.1997.69031204.x. [DOI] [PubMed] [Google Scholar]
- 10.Friedlich A, Lee J, van Groen T, Cherny R, Volitakis I, Cole T, Palmiter R, Koh J, Bush A. Neuronal zinc exchange with the blood vessel wall promotes cerebral amyloid angiopathy in an animal model of Alzheimer's disease. J Neurosci. 2004;24:3453–3459. doi: 10.1523/JNEUROSCI.0297-04.2004. [DOI] [PMC free article] [PubMed] [Google Scholar]
- 11.Religa D, Strozyk D, Cherny RA, Volitakis I, Haroutunian V, Winblad B, Naslund J, AI. B. Elevated cortical zinc in Alzheimer disease. Neurology. 2006;67:69–75. doi: 10.1212/01.wnl.0000223644.08653.b5. [DOI] [PubMed] [Google Scholar]
- 12.Blair-West JR, Denton DA, Gibson AP, McKinley MJ. Opening the blood-brain barrier to zinc. Brain Res. 1990;507:6–10. doi: 10.1016/0006-8993(90)90513-b. [DOI] [PubMed] [Google Scholar]
- 13.Kahn E. An examination of the blood-brain barrier in health and disease. Br J Nurs. 2005;14:509–513. doi: 10.12968/bjon.2005.14.9.18076. [DOI] [PubMed] [Google Scholar]
- 14.Pullen RGL, Franklin PA, Hall GH. 65Zn uptake from blood into brain in the rat. J Neurochem. 1991;56:485–489. doi: 10.1111/j.1471-4159.1991.tb08176.x. [DOI] [PubMed] [Google Scholar]
- 15.Franklin PA, Pullen RGL, Hall GH. Blood-brain exchange routes and distribution of 65Zn in rat brain. Neurochem Res. 1992;17:767–771. doi: 10.1007/BF00969010. [DOI] [PubMed] [Google Scholar]
- 16.Buxani-Rice S, Ueda F, Bradbury MWB. Transport of zinc-65 at the blood-brain barrier during short cerebrovascular perfusion in the rat: its enhancement by histidine. J Neurochem. 1994;62:665–672. doi: 10.1046/j.1471-4159.1994.62020665.x. [DOI] [PubMed] [Google Scholar]
- 17.Kasarskis EJ. Zinc metabolism in normal and zinc-deficient rat brain. Exp Neurol. 1984;85:114–127. doi: 10.1016/0014-4886(84)90166-3. [DOI] [PubMed] [Google Scholar]
- 18.Chowanadisai W, Kelleher S, Lonnerdal B. Zinc deficiency is associated with increased brain zinc import and LIV-1 expression and decreased ZnT-1 expression in neonatal rats. J Nutr. 2005;135:1002–1007. doi: 10.1093/jn/135.5.1002. [DOI] [PubMed] [Google Scholar]
- 19.Lehmann H, Brothwell B, Volak L, Bobilya D. Zinc status influences zinc transport by porcine brain capillary endothelial cells. J Nutr. 2002;132:2763–2768. doi: 10.1093/jn/132.9.2763. [DOI] [PubMed] [Google Scholar]
- 20.Cousins R, Liuzzi J, Lichten L. Mammalian zinc transport, trafficking, and signals. J Biol Chem. 2006;281:24085–24089. doi: 10.1074/jbc.R600011200. [DOI] [PubMed] [Google Scholar]
- 21.Eide D. Zinc transporters and the cellular trafficing of zinc. Biochim Biophys Acta. 2006;1763:711–722. doi: 10.1016/j.bbamcr.2006.03.005. [DOI] [PubMed] [Google Scholar]
- 22.Liuzzi J, Bobo J, McMahon R, Cousins R. Zinc transporters 1, 2 and 4 are differentially expressed and localized in rats during pregnancy and lactation. J Nutr. 2003;133:342–351. doi: 10.1093/jn/133.2.342. [DOI] [PubMed] [Google Scholar]
- 23.Dufner-Beattie J, Wang F, Kuo Y, Gitschier J, Eide D, Andrews G. The acrodermatitis enteropathica gene ZIP4 encodes a tissue-specific, zinc-regulated zinc transporter in mice. J Biol Chem. 2003;278:33474–33481. doi: 10.1074/jbc.M305000200. [DOI] [PubMed] [Google Scholar]
- 24.Kelleher S, Lonnerdal B. Zn transporter levels and localization change throughout lactation in rat mammary gland and are regulated by Zn in mammary cells. J Nutr. 2003;133:3378–3385. doi: 10.1093/jn/133.11.3378. [DOI] [PubMed] [Google Scholar]
- 25.Bobilya DJ, D'Amour K, Palmer A, Skeffington C, Therrien N, Tibaduiza EC. Isolation and cultivation of porcine brain capillary endothelial cells as an in vitro model of the blood-brain barrier. Methods Cell Sci. 1995;17:25–32. [Google Scholar]
- 26.Haudenschild CC. Morphology of vascular endothelial cells in culture. In: Jaffe EA, editor. Biology of Endothelial Cells. Boston, MA: Martinus Nijhoff; 1984. pp. 129–140. [Google Scholar]
- 27.Voyta JC, Via DP, Butterfield CE, Zetter BR. Identification and isolation of endothelial cells based on their increased uptake of acetylated-low density lipoprotein. J Cell Biol. 1984;99:2034–2040. doi: 10.1083/jcb.99.6.2034. [DOI] [PMC free article] [PubMed] [Google Scholar]
- 28.Hoyer LW, de Los Santos RP, Hoyer JR. Antihemophilic factor antigen: localization in endothelial cells by immunofluorescent microscopy. J Clin Invest. 1973;52:2737–2744. doi: 10.1172/JCI107469. [DOI] [PMC free article] [PubMed] [Google Scholar]
- 29.Sill HW, Butler C, Hollis TM, Tarbell JM. Albumin permeability and electrical resistance as means of assessing endothelial monolayer integrity in vitro. J Tissue Cult Methods. 1992;14:253–258. [Google Scholar]
- 30.Rutten MJ, Hoover RL, Karnovsky MJ. Electrical resistance and macromolecular permeability of brain endothelial monolayer cultures. Brain Res. 1987;425:301–310. doi: 10.1016/0006-8993(87)90513-0. [DOI] [PubMed] [Google Scholar]
- 31.Eaton DL, Cherian MG. Determination of metallothionein in tissues by cadmium-hemoglobin affinity assay. Methods Enzym. 1991;205:83–88. doi: 10.1016/0076-6879(91)05089-e. [DOI] [PubMed] [Google Scholar]
- 32.Bobilya DJ, Reynolds JT, Faia KL, Briske-Anderson M, Reeves PG. Zinc-related metallothionein metabolism in bovine pulmonary artery endothelial cells. J Nutr Biochem. 1999;10:139–145. doi: 10.1016/s0955-2863(98)00099-0. [DOI] [PubMed] [Google Scholar]
- 33.Smith PK, Krohn RI, Hermanson GT, Mallia AK, Gartner FH, Provenzano MD, Fujimoto EK, Goeke NM, Klenk DC. Measurement of protein using bicinchoninic acid. Anal Biochem. 1985;150:76–85. doi: 10.1016/0003-2697(85)90442-7. [DOI] [PubMed] [Google Scholar]
- 34.Kelleher L, Lonnerdal B. Zinc transporters in the rat mammary gland respond to marginal zinc and vitamin A intakes during lactation. J Nutr. 2002;132:3280–3285. doi: 10.1093/jn/132.11.3280. [DOI] [PubMed] [Google Scholar]
- 35.Gill JL. Design and Analysis of Experiments in the Animal and Medical Sciences. Ames, IA: Iowa State University Press; 1978. [Google Scholar]
- 36.Sullivan VK, Burnett FR, Cousins RJ. Metallothionein expression is increased in monocytes and erythrocytes of young men during zinc supllementation. J Nutr. 1998;128:707–713. doi: 10.1093/jn/128.4.707. [DOI] [PubMed] [Google Scholar]
- 37.Howard N, Tsourounis C, Kapusnik-Uner J. Dietary supplement survey of pharmacists: personal and professional practices. J Altern Complement Med. 2001;7:667–680. doi: 10.1089/10755530152755225. [DOI] [PubMed] [Google Scholar]
- 38.Hill GM, Cromwell GL, Crenshaw TD, Dove CR, Ewan RC, Knabe DA, Lewis AJ, Libal GW, Mahan DC, et al. Growth promotion effects and plasma changes from feeding high dietary concentrations of zinc and copper to weanling pigs (regional study) J Anim Sci. 2000;78:1010–1016. doi: 10.2527/2000.7841010x. [DOI] [PubMed] [Google Scholar]
- 39.McKinney P, Brent J, Kulig k. Acute zinc chloride ingestion in a child: local and systemic effects. Ann Emerg Med. 1995;23:1383–1387. doi: 10.1016/s0196-0644(94)70367-1. [DOI] [PubMed] [Google Scholar]
- 40.Nolte C, Gore A, Sekler I, Kresse W, Hershfinkel M, Hoffmann A, Kettenmann H, Moran A. ZnT-1 expression in astroglial cells protects against zinc toxicity and slows the accumulation of intracellular zinc. Glia. 2004;48:145–155. doi: 10.1002/glia.20065. [DOI] [PubMed] [Google Scholar]
- 41.Liuzzi J, Blanchard R, Cousins R. Differential expression of zinc transporter 1, 2, and 4 mRNA expression by dietary zinc in rats. J Nutr. 2001;131:46–52. doi: 10.1093/jn/131.1.46. [DOI] [PubMed] [Google Scholar]
- 42.Cragg R, Phillips S, Piper J, Varma J, Campbell F, Mathers J, Ford D. Homeostatic regulation of zinc transporters in the human small intestine by dietary zinc supplementation. Gut. 2005;54:469–478. doi: 10.1136/gut.2004.041962. [DOI] [PMC free article] [PubMed] [Google Scholar]
- 43.Bobilya DJ, Briske-Anderson M, Reeves PG. Zinc transport into endothelial cells is a facilitated process. J Cell Physiol. 1992;151:1–7. doi: 10.1002/jcp.1041510102. [DOI] [PubMed] [Google Scholar]
- 44.McClung JP, Bobilya DJ. The influence of zinc status on the kinetics of zinc uptake into cultured endothelial cells. J Nutr Biochem. 1999;10:484–489. doi: 10.1016/s0955-2863(99)00032-7. [DOI] [PubMed] [Google Scholar]
- 45.Dufner-Beattie J, Huang Z, Geiser J, Xu W, Andrews G. Mouse ZIP1 and ZIP3 genes together are essential for adaptation to dietary zinc deficiency during preganancy. Genesis. 2006;44:239–251. doi: 10.1002/dvg.20211. [DOI] [PubMed] [Google Scholar]
- 46.Palmiter RD, Cole TB, Findley SD. ZnT-2, a mammalian protein that confers resistance to zinc by facilitating vesicular sequestration. EMBO J. 1996;15:1784–1791. [PMC free article] [PubMed] [Google Scholar]
- 47.Liuzzi J, Bobo J, Lichten L, Samuelson D, Cousins R. Responsive transporter genes within the murine intestinal-pancreatic axis form a basis of zinc homeostasis. Proc Natl Acad Sci U S A. 2004;101:14355–14360. doi: 10.1073/pnas.0406216101. [DOI] [PMC free article] [PubMed] [Google Scholar]