

Abstract
GABAA receptors (GABARs) are heteromultimeric proteins composed of five subunits. The specific subunit composition determines critical properties of a GABAR such as pharmacological sensitivities and whether the receptor contributes to synaptic or extrasynaptic forms of inhibition. Classically, synaptic but not extrasynaptic GABARs are thought to respond to benzodiazepines, whereas the reverse has been suggested for ethanol. To examine the effects of subunit composition on GABAR function in situ, we took advantage of two naturally occurring alleles of the rat gene for GABAR subunit α6 (Gabra6100R and Gabra6100Q). Depending on their subunit partners, these two variants of α6 can lead to differential sensitivities to benzodiazepines and ethanol. An examination of synaptic and extrasynaptic GABA-mediated currents in cerebellar granule cells from Gabra6100R/100R and Gabra6100Q/100Q rats uncovered marked allele-dependent differences in benzodiazepine sensitivity. Unexpectedly, we found that the benzodiazepines flunitrazepam and diazepam enhanced extrasynaptic inhibition mediated by δ subunit-containing GABARs in Gabra6100Q/100Q rats. Complementary experiments on recombinant GABARs confirmed that, at subsaturating [GABA], flunitrazepam potentiates α6/δ subunit-containing GABARs. Based on data and a simple theoretical analysis, we estimate that the average extrasynaptic [GABA] is ∼160 nm in perfused slices. These results (1) demonstrate contributions of α6 subunits to both synaptic and extrasynaptic GABA responses, (2) establish that δ subunit-containing GABARs are benzodiazepine sensitive at subsaturating [GABA] and, (3) provide an empirical estimate of extrasynaptic [GABA] in slices.
Keywords: granule cell, cerebellum, benzodiazepine, flunitrazepam, flumazenil, extrasynaptic inhibition
Introduction
The multiple ways in which GABAergic neurotransmission shapes neural activity can be attributed to two spatially and temporally unique modes of inhibition (Brickley et al., 1996; Wall and Usowicz, 1997; Mody, 2001; Farrant and Nusser, 2005). Phasic or synaptic inhibition is believed to result from high GABA concentration transients acting on synaptic GABA receptors (GABARs) composed of two α subunits (usually α1–α3 or α5), two β subunits, and a γ subunit (Farrant and Nusser, 2005). In contrast, tonic inhibition is thought to arise primarily from ambient GABA acting on extrasynaptic GABARs containing two α4 or α6 subunits with two β subunits and a δ subunit (Mody, 2001; Farrant and Nusser, 2005). These distinct subunit compositions predict that synaptic and extrasynaptic GABARs will show different sensitivities to benzodiazepines. This is because benzodiazepine sensitivity is believed to arise only in GABARs containing one of the “synaptic” α subunits (Wieland et al., 1992; Mohler et al., 2001) and a γ2 subunit (Barnard et al., 1998; Hevers and Luddens, 1998). In contrast, GABARs composed of “extrasynaptic” α subunits in combination with δ are thought to be insensitive to benzodiazepines (Saxena and Macdonald, 1996).
Many of the details of synaptic and extrasynaptic GABAergic inhibition have been uncovered by studying cerebellar granule cells (CGCs). These neurons express several GABAR subunits (α1, α6, β2, β3, δ, and γ2) that, with the exception of the exclusively extrasynaptic δ subunits (Nusser et al., 1998), are found in both synaptic and extrasynaptic membranes. Immunoprecipitation experiments show that δ subunits partner principally with α6 subunits (Jechlinger et al., 1998; Poltl et al., 2003). Furthermore, knock-out mice confirm that δ and α6 subunits coassemble (Jones et al., 1997) and are necessary for tonic inhibition (Brickley et al., 2001b; Stell et al., 2003). Interestingly, despite the localization of α6 subunits within synaptic membranes (Nusser et al., 1998), deletion of the α6 gene has little effect on phasic inhibition (Brickley et al., 2001b).
Recently, we described a naturally occurring single nucleotide polymorphism in the rat GABAR α6 subunit gene (Hanchar et al., 2005). Previous work had shown that the resulting amino acid change [α6(R100Q)] converts recombinant α6β2γ2 GABARs from benzodiazepine insensitive to benzodiazepine sensitive (Korpi et al., 1993). However, the effect of this change in α6 on the benzodiazepine sensitivity of synaptic and extrasynaptic currents in CGCs has not been tested. In the present study, we examine the benzodiazepine sensitivities of recombinant GABARs of various subunit composition and of phasic and tonic inhibitory currents in Gabra6100R/100R and Gabra6100Q/100Q rats. Our findings demonstrate that the substitution does affect native GABARs. The data indicate that α6 subunit-containing GABARs participate in synaptic and extrasynaptic inhibition in CGCs. Moreover, we unexpectedly find that both native and recombinant δ subunit-containing GABARs can show benzodiazepine sensitivity at subsaturating concentrations of GABA.
Materials and Methods
Electrophysiology.
Parasagittal slices of the cerebellum (300 μm) from 21- to 40-d-old Sprague Dawley rats homozygous for either α6100R or α6100Q subunits were prepared using standard techniques (Brickley et al., 2001b; Hanchar et al., 2005). The slicing solution consisted of the following (in mm): 85 NaCl, 75 sucrose, 24 NaHCO3, 25 glucose, 4 MgCl2, 2.5 KCl, 1.25 NaH2PO4, and 0.5 CaCl2. Slice storage and recording solutions were saturated with 95% O2/5% CO2 and consisted of the following (in mm): 119 NaCl, 26 NaHCO3, 11 glucose, 2.5 KCl, 2.5 CaCl2, 1.3 MgCl2, and 1 NaH2PO4. All procedures were in accordance with a protocol approved by the University of California at Los Angeles Chancellor's Animal Research Committee. For voltage-clamp recordings (holding potential of −70 mV, 20–23°C), whole-cell pipettes contained the following (in mm): 140 CsCl, 10 HEPES, 1 EGTA, 4 Mg-ATP, and 0.4 GTP, titrated to pH 7.3 with CsOH. Recording pipettes had a bath resistance of 5–10 MΩ.
Standard methods were used for isolation, injection, and recordings from Xenopus laevis oocytes (Wallner et al., 2003). Briefly, oocytes were injected with 0.4 ng of α and β2 subunit cRNA and 2 ng of δ or γ2 subunit cRNA. GABAR currents were recorded using an Axoclamp 1D amplifier (Molecular Devices, Palo Alto, CA) in two-electrode voltage-clamp configuration at a holding potential of −80 mV. Recordings were obtained 3–4 d after oocyte injection for γ2 subunit-containing receptors and 14–15 d after injection for δ subunit-containing receptors. Recording electrodes contained 3 m KCl and had resistances between 0.5 and 1.5 MΩ. The recording solution consisted of the following (in mm): 96 NaCl, 2 KCl, 1.8 CaCl2, 1 MgCl2, and 5 HEPES titrated to a pH of 7.5. Solution exchanges were triggered with a programmable valve bank switching a three-way solenoid valve, and bath volume exchange occurred in 1–3 s.
Analysis and statistics.
Whole-cell data were filtered at 5 kHz and acquired at a sampling rate of 20 kHz. Analysis was conducted using customized routines written in Igor Pro 4.0 (WaveMetrics, Lake Oswego, OR). Because glutamate receptor antagonists have been shown to alter spontaneous IPSC (sIPSC) frequency (Brickley et al., 2001a), glutamate receptor antagonists were not included in the recording solution. Occasional EPSCs were identified by their characteristic rapid decay kinetics and excluded from the analysis of spontaneous events (Rossi and Hamann, 1998; Hanchar et al., 2005). Unless stated otherwise, IPSC τdecay is reported as a weighted decay of biexponential decay fits to the average traces of over 10 events in each cell. Tonic GABAR-mediated current was defined as the steady-state current blocked by 10 μm SR95531 [6-imino-3-(4-methoxyphenyl)-1(6H)-pyridazinebutanoic acid hydrobromide] its magnitude was calculated by plotting all-point histograms of relevant 30 s segments of data. These data were fit to Gaussian equations, constraining fits to values two bins more negative than the peak. This ensured that the tail of higher-amplitude values (representing sIPSCs) did not influence the fit.
As confirmation of the accuracy of this approach, we applied an additional analysis method in which baseline and tonic GABA current measurements were not contaminated by sIPSC decays (Nusser and Mody, 2002). Briefly, using the same 30 s segments mentioned above, the mean and SD of 5 ms epochs of data taken every 100 ms were calculated. Mean values were accepted for additional analysis if the corresponding SD for that 5 ms segment was <4 pA. For experiments in 200 nm SR95331, which decreased tonic currents by ∼80% (data not shown), only cells with >2 pA tonic current in low SR95331 were included in the analysis. In all cases, the effects of benzodiazepines on tonic current were compared with changes in tonic current observed over otherwise identical sham perfusion periods.
SigmaStat for Windows version 3.1 (Systat Software, Port Richmond, CA) was used to perform statistical comparisons. Normal distribution of the datasets was assessed using the Kolmogorov–Smirnov test. Normally distributed data were analyzed using paired and unpaired Student's t tests as appropriate. Nonparametric Wilcoxon's signed rank test (WSRT for paired data) or Mann–Whitney rank sum test (MWRST for unpaired groups) was used to assess the statistical significance of data deviating from normality. p values <0.05 were accepted as significant. Unless otherwise stated, values are reported as mean ± SEM.
Theoretical prediction of [GABA] based on tonic current amplitude.
The curve in Figure 6C was generated by applying the following Hill equation: Itonic = Itonic, max/[1 + (Kd/[GABA])n], where Kd was 700 nm, the EC50 was measured for recombinant α6β3δ GABARs (Hanchar et al., 2005), and n, the Hill exponent, was 2. Itonic, max was estimated by using the average amplitude of tonic current in 300 nm GABA (35 pA); solving the Hill equation predicted a maximal tonic current of 225 pA. Using this value for Itonic, max we constructed predicted fold increases in response to 300 nm GABA given the amplitudes of the tonic currents in control. This simple analysis assumes the following: (1) the level of Itonic in control is determined solely by the [GABA], (2) the GABARs generating tonic current have properties similar to recombinant α6β3δ GABARs, (3) all CGCs have the same Itonic, max, and (4) GABA uptake does not significantly reduce the effective [GABA] achievable by bath application at extrasynaptic receptors. Although these assumptions are clearly oversimplifications, if anything they are expected to decrease the accuracy of the fit. Goodness of fit (R2 = 0.787) of the theoretical curve was calculated using nonlinear regression analysis. Considering that the theoretical curve in Figure 6C describes the data so well, we conclude that variations in extrasynaptic [GABA] must be a major factor in determining the size of Itonic.
Figure 6.
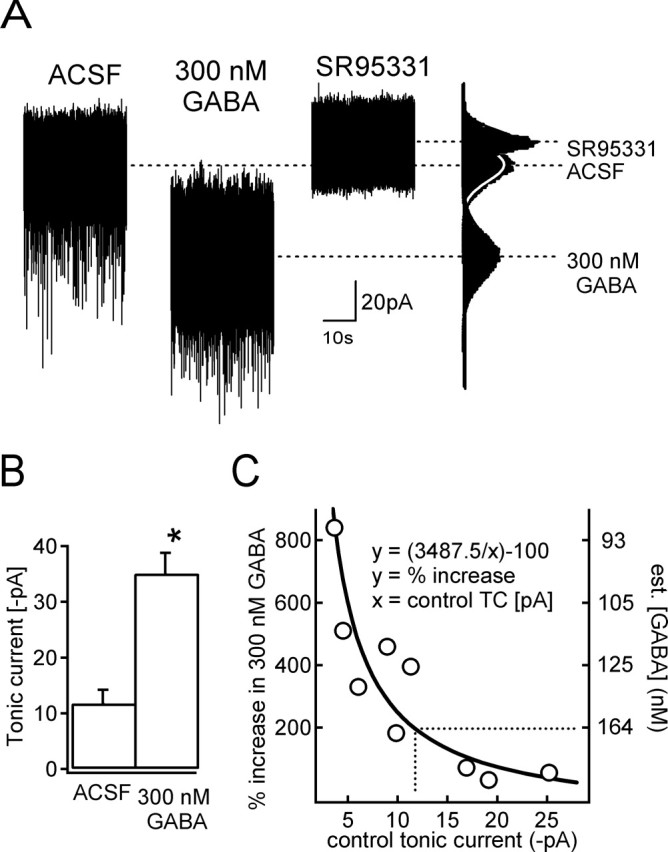
An experimental estimate of the GABA concentration underlying the tonic current. A, An example of tonic currents recorded from a CGC from Gabra6100R/100R rat in ACSF or after perfusion of 300 nm GABA. All-points histograms of the displayed current traces are shown to the right along with Gaussian fits. B, Mean current amplitudes in ACSF and in 300 nm GABA for nine CGCs. *p < 0.05, t test. C, The fold increase caused by 300 nm GABA is plotted against the tonic current amplitude in ACSF for these nine cells. The solid line indicates the theoretical effect of 300 nm GABA based on the Hill equation assuming an EC50 of 700 nm and a Hill coefficient of 2 for the GABARs underlying the tonic current. Based on the average tonic current in ACSF of 11.75 pA, the theoretical curve predicts that an average GABA concentration of 164 nm is responsible for the tonic current in these cells.
Results
The α6(R100Q) subunit polymorphism prolongs synaptic currents
Phasic, sIPSCs were recorded from CGCs of rats homozygous for either the wild-type (Gabra6100R) or the Gabra6100Q allele. Consistent with previous reports (Hanchar et al., 2005), there was no difference in either sIPSC amplitudes (Gabra6100R/100R, 33.38 ± 3.0 pA; Gabra6100Q/100Q, 34.6 ± 1.91 pA; t test) or frequencies (Gabra6100R/100R, 1.16 ± 0.25 Hz, n = 16; Gabra6100Q/100Q, 1.40 ± 0.28 Hz, n = 16; t test) between the two groups (Fig. 1A–C). However, in contrast to the lack of effect on sIPSC amplitude/frequency, weighted decay rates of sIPCSs were significantly prolonged in rats expressing the Gabra6100Q allele (Fig. 1D,E). Analysis of the fits to the sIPSC decays discussed in the next section argue that α6(100Q) subunit-containing GABARs are present in synaptic rather than perisynaptic locations because genotype-dependent differences are observed in the early phases of sIPSC decays. Together, these data suggest that α6 contributes to synaptic GABARs and are consistent with previous reports that the Gabra6100Q allele does not alter the levels of other GABAR subunits (Korpi et al., 1993).
Figure 1.
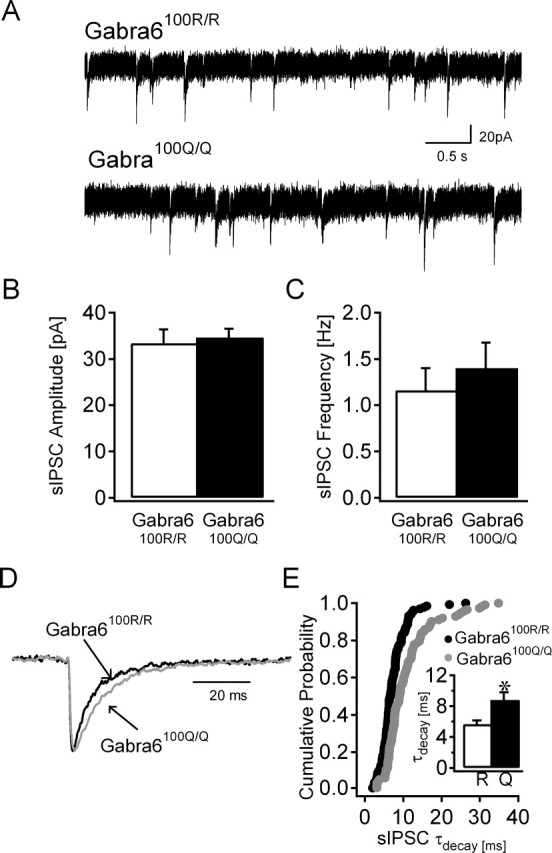
sIPSC decay is prolonged in Gabra6100Q/100Q rats. A, Representative current traces in CGCs recorded from Gabra6100R/100R (top trace) and Gabra6100Q/100Q (bottom trace) slices in ACSF. B, C, Summary histograms show that the amplitude (B) and frequency (C) of sIPSCs in Gabra6100Q/100Q rats are not different (t test) from Gabra6100R/100R rats. D, Overlay of representative averaged sIPSC traces from CGCs expressing the wild-type α6 subunit (black) and the α6(100Q) allele (gray), each normalized to its peak amplitude, illustrate the slower rate of decay (weighted τdecay, 5.18 ms in Gabra6100R/100R and 9.33 ms in Gabra6100Q/100Q) in the cell from a Gabra6100Q/100Q rat. E, Cumulative probability plot of the weighted sIPSC τdecay of individual events in CGCs from both genotypes (n = 15 cells each; p < 0.001 by MWRST). Inset, Summary plot of sIPSC weighted τdecay in Gabra6100R/100R (R) and Gabra6100Q/100Q (Q) rats. *p < 0.01 by MWRST.
Slower sIPSC decays could reflect intrinsic differences in gating kinetics of GABARs composed of α6(100R) versus α6(100Q) subunits. Alternatively, the increased benzodiazepine sensitivity of GABARs containing α6(100Q) and γ subunits might render such GABARs sensitive to an endogenous benzodiazepine-like modulator. We tested the latter possibility by looking for genotype-dependent differences in the effects of the benzodiazepine site antagonist flumazenil (Fz) (Otis and Mody, 1992). As illustrated in Figure 2, the drug had no effect on the sIPSC decay rate in either genotype [Gabra6100R/100R, 4.84 ± 0.28 ms in artificial CSF (ACSF) to 4.58 ± 0.61 ms in flumazenil, n = 9; Gabra6100Q/100Q, 7.24 ± 1.37 ms in ACSF to 7.07 ± 0.91 ms in flumazenil, n = 9; t test], indicating that endogenous benzodiazepine site ligands are not responsible for slowing of the sIPSCs in Gabra6100Q/100Q rats. These findings provide additional support for the idea that GABARs with α6 subunits participate in phasic inhibition.
Figure 2.

sIPSC decay is unaffected by a benzodiazepine site antagonist in Gabra6100Q/100Q rats. A, Representative current traces in CGCs recorded from Gabra6100R/100R (left traces) and Gabra6100Q/100Q (right traces) slices in ACSF or in flumazenil. B, Summary histograms show that the weighted decay time constants of sIPSCs are not changed by Fz in either Gabra6100R/100R or Gabra6100Q/100Q rats (p > 0.05, t test). A, ACSF.
The α6(R100Q) polymorphism enhances benzodiazepine sensitivity of synaptic currents
Because the α6(R100Q) polymorphism occurs at a site critical to benzodiazepine modulation (Wieland et al., 1992; Korpi et al., 1993), we examined whether the classical benzodiazepine flunitrazepam (Flu) had a differential effect on sIPSCs in Gabra6100R/100R and Gabra6100Q/100Q rats. Flunitrazepam (1 μm) had no effect on sIPSC amplitude (Fig. 3B), frequency (Gabra6100R/100R, 1.41 ± 0.39 Hz in ACSF, 1.92 ± 0.49 Hz in Flu, n = 7, t test; Gabra6100Q/100Q, 0.81 ± 0.26 Hz in ACSF, 1.32 ± 0.49 Hz in Flu, n = 6; p > 0.05 WSRT) or 20–80% rise time (Gabra6100R/100R, 0.53 ± 0.09 ms in ACSF, 0.61 ± 0.08 ms in Flu, n = 7, t test; Gabra6100Q/100Q, 0.63 ± 0.0.06 ms in ACSF, 1.15 ± 0.36 ms in Flu, n = 6; WSRT), but it did significantly slow sIPSC decays in both genotypes (Gabra6100R/100R, 6.29 ± 0.81 ms in ACSF, 10.38 ± 1.39 ms in Flu; Gabra6100Q/100Q, 10.33 ± 1.38 ms in ACSF, 25.42 ± 4.23 ms in Flu; p < 0.05, t test). Normalized data also showed clear genotype-dependent effects on sIPSC kinetics (Fig. 3C,D). For both genotypes, the effects of benzodiazepines were prevented by the benzodiazepine site antagonist. Flunitrazepam failed to prolong the sIPSC decay when applied in the presence of flumazenil (Gabra6100R/100R, 5.85 ± 0.99 ms in ACSF, 5.23 ± 0.4 ms in Flu, n = 3; Gabra6100Q/100Q, 7.34 ± 0.1.54 ms in ACSF, 6.56 ± 1.01 ms in Flu, n = 8; t test). The slower decay observed in Gabra6100Q/100Q rats led to a considerably larger flunitrazepam enhancement of charge transfer in the Gabra6100Q/100Q rats (Fig. 3E). Together, these data imply that the α6(R100Q) polymorphism increases the benzodiazepine sensitivity of synaptic GABARs.
Figure 3.

Enhanced flunitrazepam modulation of synaptic currents in Gabra6100Q/100Q rats. A, Overlay of averaged and normalized sIPSCs (gray traces) in ACSF and after perfusion of 1 μm flunitrazepam from Gabra6100R/100R (left) and Gabra6100Q/100Q (right) rats. Biexponential fits to the sIPSC decay (in black) are shown superposed on the representative traces. B, Summary plot showing that lack of change in the sIPSC amplitude recorded in ACSF (A) and flunitrazepam (F) in both genotypes (p > 0.05; Gabra6100R/100R by WSRT, Gabra6100Q/100Q by t test). C, D, Histogram of the weighted τdecay of sIPSCs recorded in flunitrazepam (C) and the percentage increase in weighted τdecay compared with ACSF (D). E, Plot summarizing the greater synaptic charge transfers in cells from Gabra6100Q/100Q compared with Gabra6100R/100R in flunitrazepam. *p < 0.05, t test.
The above analysis was conducted on weighted decay time constants that simplify biexponential decay parameters to a single value. Yet by examining all parameters of double-exponential fits, it might be possible to see whether a genotype-dependent difference could be detected in the earliest phases of sIPSC decays. In Gabra6100R/100R rats, although no statistically significant effect of flunitrazepam was observed on the fast (τfast) (5.09 ± 0.22 ms in ACSF, 7.87 ± 1.43 ms in Flu; t test) or slow (τslow) (23.03 ± 3.87 ms in ACSF, 20.19 ± 2.67 ms in Flu; t test) time constants, the weight of the fast component was decreased (96.65 ± 1.64 ms in ACSF, 80.12 ± 9.02 ms in Flu; p < 0.05, WSRT). In Gabra6100Q/100Q rats, the effects were more complicated. Biexponentials were required to fit the sIPSC decay in ACSF (τfast, 8.02 ± 1.88 ms contributing to 70.75 ± 13.79% and τslow, 16.22 ± 1.94 ms), but, in flunitrazepam, biexponential fits gave very similar fast and slow time constants (τfast, 24.81 ± 2.41 ms contributing to 48.64 ± 5.64% and τslow, 25.9 ± 14.39 ms). Indeed, a single exponential of 22.21 ± 2.41 ms was sufficient to describe the decay under these conditions. Nonetheless, analysis of the effects of flunitrazepam on τfast in Gabra6100Q/100Q rats showed a significant difference on this earliest phase of decay (τfast, 8.02 ± 1.88 ms in ACSF, 24.81 ± 2.41 ms in Flu; p < 0.05, t test). Such genotype-dependent differences in the effect of flunitrazepam on the early phases of sIPSC decays indicate that α6 subunit-containing GABARs are located within the synaptic cleft.
Tonic inhibition is sensitive to benzodiazepines in animals expressing the α6(R100Q) polymorphism
Tonic inhibition of CGCs in slice preparations is primarily mediated by GABARs composed of α6, β2/3, and δ subunits (Brickley et al., 2001b; Stell et al., 2003; Hanchar et al., 2005), a composition thought to be benzodiazepine insensitive. A study of cultured CGCs seems to challenge this view by reporting that flunitrazepam enhances tonic inhibition (Leao et al., 2000). This discrepancy could be explained in two ways: (1) in culture preparations, tonic inhibition may arise from α1/γ2 subunit-containing as well as α6/δ subunit-containing GABARs, or (2) GABARs composed of α6, β2/3, and δ subunits may be benzodiazepine sensitive under certain conditions. Considering the prevalence of the Gabra6100Q allele in Sprague Dawley rats (Hanchar et al., 2005) that were the animals used to prepare cultures in the study by Leao et al. (2000), we examined whether tonic currents in CGCs of Gabra6100Q/100Q rats are benzodiazepine sensitive.
In the absence of benzodiazepines, the magnitude of tonic GABA current, measured as the steady-state current at −70 mV blocked by 10 μm SR95331, was the same in both genotypes (Fig. 4A,B). Flunitrazepam (1 μm) caused either a small increase (five of seven cells) or no change (two of seven cells) in tonic current in CGCs from Gabra6100R/100R rats but significantly increased the steady-state current in all 11 CGCs from Gabra6100Q/100Q rats (Fig. 4). Similarly, diazepam (1 μm) also enhanced tonic GABA currents in Gabra6100Q/100Q rats (14.30 ± 4.48 pA in ACSF to 17.77 ± 5.22 pA in diazepam; n = 5; 37.19 ± 21.32% increase; p < 0.05 t test). However, in the presence of the benzodiazepine antagonist flumazenil (1 μm), flunitrazepam failed to enhance tonic currents (10.74 ± 2.74 pA in ACSF to 9.18 ± 2.85 pA in Flu and Fz; n = 5; 94.31 ± 16.86% of control; p = 0.75, t test).
Figure 4.
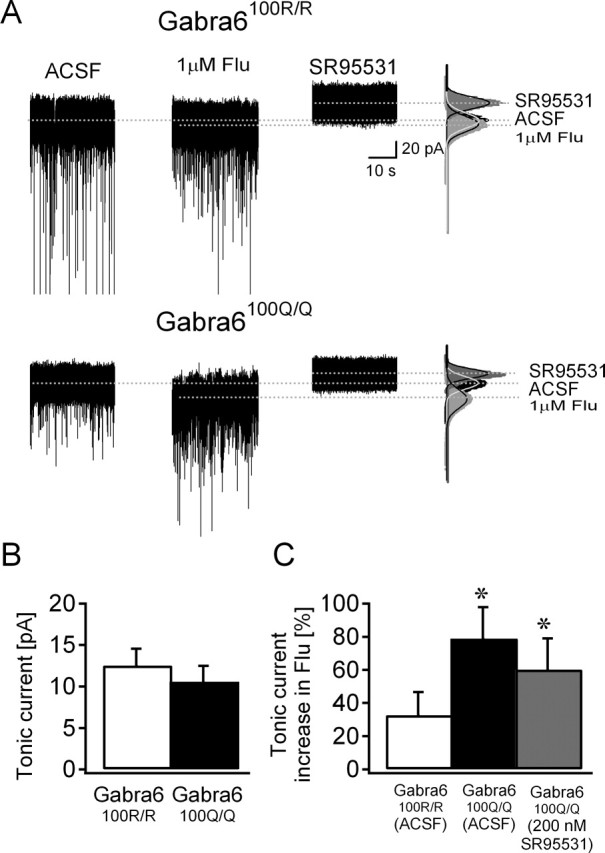
Genotype-dependent difference in flunitrazepam augmentation of tonic GABA current. A, Tonic GABA currents in CGCs recorded from Gabra6100R/100R (top) or Gabra6100Q/100Q (bottom) slices in the presence of 1 μm Flu or in the GABAR antagonist SR95531 (10 μm). To the right are histograms of all points in each segment. Gaussian fits to each condition are superimposed. The dashed lines indicate the mean current from these fits. B, Plot of the mean ± SEM tonic GABA current in CGCs shows no genotype-dependent differences. C, Summary of the percentage change in tonic current amplitude caused by 1 μm flunitrazepam in the two genotypes in ACSF and in 200 nm SR95531 in Gabra6100Q/100Q rats. *p < 0.05; WSRT in ACSF, t test in 200 nm SR95531.
There is concern that prolonged sIPSC decays might mask as tonic current in Gabra6100Q/100Q rats, an effect that would allow synaptic GABARs to contribute to steady-state current. To address this, we performed two additional analyses and an additional experiment. First, we calculated the changes in the amplitude and variance of baseline current caused by flunitrazepam using an alternative method to minimize the contribution of IPSC decay (see Materials and Methods). This analysis also showed a significant enhancement of tonic GABA currents (10.37 ± 2.4 pA in ACSF to 17.28 ± 2.90 pA in Flu, n = 11; 58.07 ± 26.77% increase; p < 0.005, WSRT) and baseline SD (2.37 ± 0.16 pA in ACSF to 2.7 ± 0.13 pA in Flu; p < 0.001, WSRT) in Gabra6100Q/100Q rats. In contrast, the small increase in tonic GABA currents in Gabra6100R/100R rats (15.84 ± 3.14 pA in ACSF to 18.67 ± 3.410 pA in Flu; n = 9; 26.13 ± 13.33% increase; p > 0.05, t test) and baseline SD (2.55 ± 0.21 pA in ACSF to 2.7 ± 0.18 pA in Flu; p > 0.05, t test) was not statistically significant. Second, we found no correlation between the degree of flunitrazepam enhancement of tonic current and the sIPSC frequency in either genotype (data not shown). Finally, we measured tonic current under conditions in which sIPSCs were selectively inhibited by 200 nm SR95331 (Stell and Mody, 2002). This treatment decreased the sIPSC frequency by 92 ± 2% without altering the flunitrazepam potentiation of tonic inhibition (Fig. 4C).
Flunitrazepam modulates recombinant α6/δ subunit-containing GABARs
Benzodiazepine sensitivity of tonic current might be increased in animals with the α6(R100Q) polymorphism not because α6/δ subunit-containing GABARs become benzodiazepine-sensitive but because the polymorphism makes α6/γ2 subunit-containing GABARs become more sensitive to GABA. To address this issue, we tested flunitrazepam sensitivity of GABARs composed of various subunits in X. laevis oocytes. We measured GABA dose–response curves with and without 1 μm flunitrazepam (Fig. 5A,B) for four combinations of GABAR subunits [α6β3γ2, red; α6(R100Q)β3γ2, pink; α6β3δ, green; and α6(R100Q)β3δ, blue]. Consistent with previous studies on γ2 subunit-containing GABARs (Korpi et al., 1993), the α6(R100Q) polymorphism conferred benzodiazepine sensitivity on α6β3γ2 GABARs as indicated by the leftward shift in GABA dose–response curves (Fig. 5B,C, compare solid vs dotted pink and red curves in B and pink vs red curves in C). Surprisingly, both α6β3δ and α6(100Q)β3δ GABARs also exhibited significant flunitrazepam sensitivity (Fig. 5B,C, blue and green curves). However, flunitrazepam modulation of δ subunit-containing GABARs was distinguished from the modulation of γ2 subunit-containing GABARs in that it was seen in a much lower range of [GABA], with the peak flunitrazepam enhancement occurring at 10 μm GABA in α6(R100Q)β3γ2 and at 100 nm GABA in both α6β3δ and α6(100Q)β3δ receptors (Fig. 5C).
Figure 5.
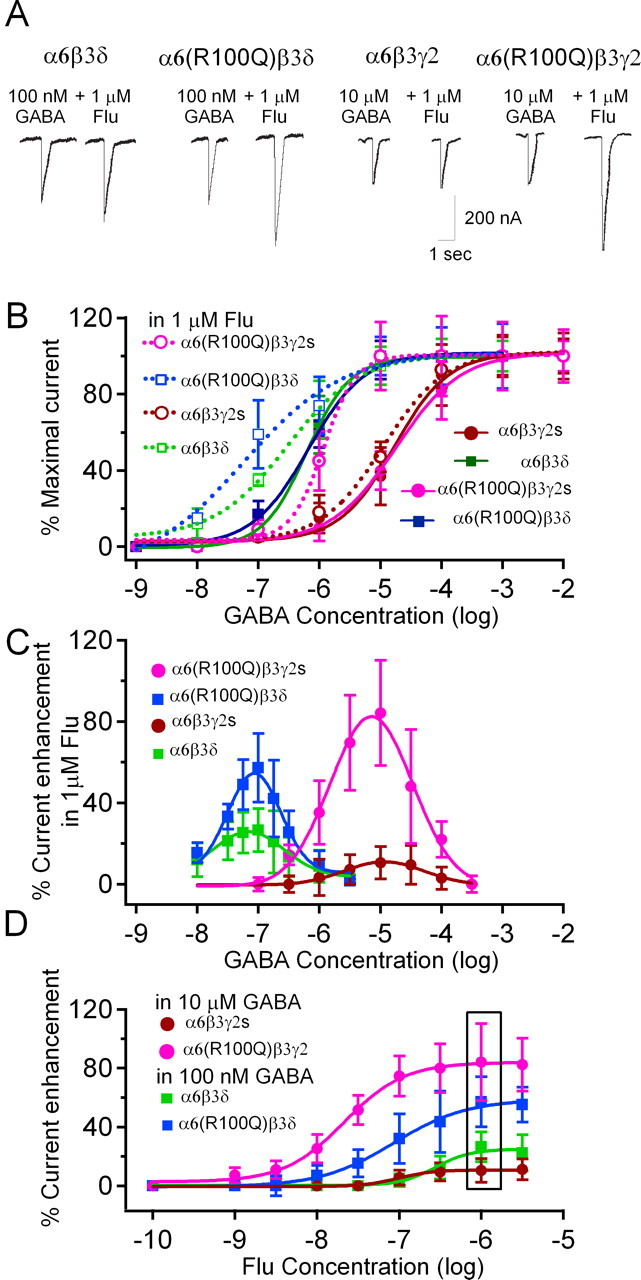
The α6(R100Q) polymorphism causes an increase in flunitrazepam sensitivity when coexpressed with either γ2 or δ subunits. A, Representative current traces from oocytes demonstrate the effect of flunitrazepam on δ and γ2 subunit-containing GABARs. B, Data and sigmoid fits show percentage of maximal current versus [GABA] for GABARs of the indicated subunit compositions with and without of 1 μm flunitrazepam [α6β3γ2, n = 4 in control, n = 3 in Flu; α6(R100Q)β3γ2, n = 3 in control, n = 4 in Flu; α6β3δ, n = 9 in control, n = 7 in Flu; and α6(R100Q)β3δ, n = 6 in control, n = 5 in Flu]. C, Plots show peak enhancement of GABA current by 1 mm flunitrazepam calculated from the data in B and corresponding Gaussian fits for γ2 and δ subunit-containing GABARs (n=4 for each subunit combination tested). D, Flunitrazepam dose–response curves of recombinant GABARs in the presence of GABA concentrations at which maximum benzodiazepine potentiation was observed in the γ2 and δ subunit-containing receptors in B [i.e., 10 μm GABA for α6β3γ2 and α6(R100Q)β3γ2; 100 nm GABA for α6β3δ and α6(R100Q)β3δ; n=3 each]. Box in C indicates the flunitrazepam concentration (1 μm) used in A and B. In B–D, data are normalized to the saturating GABA response in each oocyte in control, averaged across oocytes and presented as percentage ± SD.
Such subunit-specific and [GABA]-dependent benzodiazepine effects place constraints on which GABAR subtypes contribute to tonic currents in our slice experiments. Previous estimates of ambient [GABA] range from tens of nanomolar to a few micromolar (Farrant and Nusser, 2005). Comparison of Figures 4 and 5 illustrates that, at <1 μm GABA, only flunitrazepam enhancement of δ subunit-containing but not γ2 subunit-containing GABARs can explain the >70% increase of tonic currents in Gabra6100Q/100Q rats.
To rule out confounding influences that might occur if the polymorphism caused large changes in flunitrazepam dose dependency, we measured flunitrazepam dose–response relationships using the [GABA] that yielded maximal enhancement by 1 μm flunitrazepam (i.e., 10 μm GABA for γ2 subunit-containing and 100 nm GABA for δ subunit-containing receptors). These experiments show that, for all of the tested subunit combinations, the flunitrazepam effect saturates at 1 μm. Although inclusion of α6(100Q) enhanced γ2 subunit-containing receptors more markedly, the data confirm that δ subunit-containing GABARs are also modulated by flunitrazepam at subsaturating [GABA] (Fig. 5D).
Measurements of tonic GABA current suggest that [GABA] is ∼160 nm
The brain slice data and tight concentration range over which δ subunit-containing GABARs show flunitrazepam sensitivity imply a resting [GABA] of ∼100 nm. We directly probed the range of resting [GABA] responsible for tonic currents in slices from Gabra6100Q/100Q rats by bath application of 300 nm GABA, a concentration well below the 700 nm EC50 for α6(100Q)β2/3δ receptors (Hanchar et al., 2005). In every CGC tested (n = 9) (Fig. 6A), 300 nm GABA increased tonic current, indicating that the resting [GABA] surrounding these cells is below 300 nm. Mean tonic GABA current increased approximately threefold from 11.75 ± 2.4 to 35.08 ± 3.7 pA (p < 0.001, t test) (Fig. 6B). However, considerable variability in the amount of increase was evident between cells. Plotting the fold increase against the size of the tonic current before application of 300 nm GABA showed a clear decrease in the degree of enhancement in CGCs with larger tonic currents (Fig. 6C). This is consistent with the idea that variability in resting [GABA] accounts for the different levels of tonic currents. We tested this idea in a model with two simple assumptions: all CGCs have the same maximal tonic current, and this current has an EC50 of 700 nm and a Hill coefficient of 2 (for details, see Materials and Methods). Using the Hill equation, the model calculated the simple theoretical relationship (Fig. 6C, solid line) between the control tonic current amplitude and the fold increase expected during application of 300 nm GABA. Nonlinear regression analysis showed that the simulated curve fit the experimental data with R2 = 0.787. Based on the range of tonic currents in slices under control conditions (∼3–25 pA), the theoretical relationship predicts that the resting [GABA] is in the 90–250 nm range. The predicted range and the average resting [GABA] of 164 nm (Fig. 6C, dotted lines) corresponding to the mean current level of 11.75 pA are in agreement with the estimate derived from flunitrazepam experiments described above.
Discussion
Contributions of α6 subunits to synaptic inhibition
Immunocytochemistry and biochemistry have provided complementary evidence that α6 subunits partner with β2/3 and γ2 subunits to form GABARs at inhibitory synapses on CGCs (Jechlinger et al., 1998; Nusser et al., 1998). Moreover, functional properties of α6 and γ2 subunit-containing GABARs seem ideally suited to detect the high concentration GABA transients that occur within the synaptic cleft (Saxena and Macdonald, 1996). Several studies have attempted to test whether α6 subunits contribute to sIPSCs using furosemide, an antagonist of α6 subunit-containing receptors (Korpi et al., 1995). However, these studies have reached different conclusions regarding the contribution of α6 subunits to fast inhibition (Tia et al., 1996; Rossi and Hamann, 1998; Wall, 2003). In principle, genetic deletion of α6 offers another way to examine its contributions to synaptic GABARs. Although α6−/− animals exist, the expression of other synaptic subunits (α1 and γ2) is altered (Jones et al., 1997; Nusser et al., 1999), making it difficult to interpret changes in synaptic currents. Our approach takes advantage of a more subtle tool, a single nucleotide polymorphism that alters GABAR pharmacology in a subunit-specific way without changing expression (Korpi et al., 1993) or GABA affinity (Hanchar et al., 2005). We recognize that a potential limitation of this approach is that our results do not distinguish between α6β2/3γ2 and α1α6β2/3γ2 combinations detected by Poltl et al. (2003) in immunoprecipitation studies. Additionally, it is also possible that an increase in perisynaptic localization of α6(100Q) subunit-containing receptors or an increase in the proportion of α1α6(100Q)β2/3γ2 receptors might contribute to the prolonged sIPSC decay in CGCs from Gabra100Q/100Q rats. However, the effects of flunitrazepam on the earliest phases of the sIPSC decay demonstrate unambiguously that a large proportion of GABARs within the synaptic cleft must contain α6 subunits.
Benzodiazepine modulation of α6 and δ subunit-containing GABARs
This study provides direct evidence that recombinant GABARs composed of α6(100Q) and δ subunits can be modulated by benzodiazepines in a narrow range of GABA concentrations that are physiologically relevant for extrasynaptic inhibition. The GABA concentration dependence of benzodiazepine modulation might account for the discrepancy between the present results and previous studies, which did not find benzodiazepine effects on δ subunit-containing GABARs (Saxena and Macdonald, 1996). Our findings challenge the generally accepted views that a γ subunit is required for, and that α6 prevents, benzodiazepine modulation of GABA receptors (Hevers and Luddens, 1998). Our data suggest that in situ modulation of α6 and δ subunit-containing GABARs could occur under conditions in which [GABA] is low. Because these are tonic currents, such modulation would be expected to result in large increases in charge transfer and profound effects on the excitability of CGCs. The effects would be most pronounced in animals carrying the benzodiazepine-sensitive allele of the α6 subunit. The abundance of this allele in rats (Hanchar et al., 2005) could explain variability in previous reports regarding the sensitivity of tonic inhibition in CGCs to benzodiazepines (Leao et al., 2000; Hamann et al., 2002; Wall, 2005).
An empirical estimate of the free GABA in brain slices
In our examination of recombinant GABARs, we observed a marked GABA concentration dependence for benzodiazepine modulation, and the concentration ranges yielding maximal enhancement were dependent on subunit composition. The GABA concentration dependence correlated with the relative affinities of γ2 and δ subunit-containing GABARs for GABA: EC50 values for α6/δ subunit-containing GABARs are ∼500–700 nm, whereas for α6/γ2 subunit-containing GABARs, they are 2–20 μm (Hanchar et al., 2005). This correlation between GABA affinity and benzodiazepine modulation is consistent with proposed mechanisms of benzodiazepine action in which the modulators increase the effective affinity of GABA (Perrais and Ropert, 1999). At higher steady-state GABA concentrations, benzodiazepines become less effective because the binding sites are fully occupied by GABA.
This behavior proved to be a useful indicator of the ambient GABA concentration underlying the tonic current. Flunitrazepam enhanced responses at 100 nm GABA mediated by recombinant α6(100R)β3δ and α6(100Q)β3δ receptors to the same extent as the tonic current was enhanced in CGCs of Gabra6100R/100R and Gabra6100Q/100Q rats. To see comparable increases for recombinant α6β3γ2 receptors, it was necessary to have GABA concentration >1 μm. A separate line of experiments on slices from Gabra6100Q/100Q rats showed that the [GABA] generating tonic currents are much lower than 300 nm. Moreover, the degree to which 300 nm GABA was able to enhance tonic current in each cell could be predicted with surprising accuracy based on the level of tonic current in control. The simplest interpretation of the recombinant and native data are that tonic currents in perfused brain slices are generated by GABA concentrations of ∼150 nm acting on GABARs composed of the subunits α6(100R) or α6(100Q) and δ. Because of the continual perfusion of the slice during experiments, we consider it likely that this is an underestimate of the resting [GABA] in vivo; indeed, recent recordings of CGCs in anesthetized rats indicate considerably larger tonic currents (Chadderton et al., 2004). Our interpretation that δ subunit-containing GABARs are responsible for tonic current is also consistent with recently reported findings that CGCs in δ subunit knock-out mice lack tonic current (Stell et al., 2003).
In summary, enhanced benzodiazepine modulation of both phasic and tonic inhibition in the cerebellum likely accounts for the greater motor impairment in response to benzodiazepines seen in rat lines expressing the α6(R100Q) subunit mutation (Korpi et al., 1993). Small changes in tonic current are known to have profound effects on the excitability of granule cells (Hamann et al., 2002; Mitchell and Silver, 2003; Chadderton et al., 2004). The hypersensitivity of the Gabra6100Q/100Q rats to benzodiazepines highlights the marked behavioral effects that can result when both synaptic and extrasynaptic GABARs are modulated under physiological conditions.
Footnotes
This work was supported by National Institutes of Health Grants PO1 NS35985 (T.S.O. and R.W.O.) and AA07680 (R.W.O.), National Institutes of Health Fellowship AA015460 (H.J.H.), and an Alcoholic Beverage Medical Research Foundation grant (M.W.).
References
- Barnard EA, Skolnick P, Olsen RW, Mohler H, Sieghart W, Biggio G, Braestrup C, Bateson AN, Langer SZ (1998). International Union of Pharmacology. XV. Subtypes of GABAA receptors: classification on the basis of subunit structure and receptor function. Pharmacol Rev 50:291–313. [PubMed] [Google Scholar]
- Brickley SG, Cull-Candy SG, Farrant M (1996). Development of a tonic form of synaptic inhibition in rat cerebellar granule cells resulting from persistent activation of GABAA receptors. J Physiol (Lond) 497:753–759. [DOI] [PMC free article] [PubMed] [Google Scholar]
- Brickley SG, Farrant M, Swanson GT, Cull-Candy SG (2001a). CNQX increases GABA-mediated synaptic transmission in the cerebellum by an AMPA/kainate receptor-independent mechanism. Neuropharmacology 41:730–736. [DOI] [PubMed] [Google Scholar]
- Brickley SG, Revilla V, Cull-Candy SG, Wisden W, Farrant M (2001b). Adaptive regulation of neuronal excitability by a voltage-independent potassium conductance. Nature 409:88–92. [DOI] [PubMed] [Google Scholar]
- Chadderton P, Margrie TW, Hausser M (2004). Integration of quanta in cerebellar granule cells during sensory processing. Nature 428:856–860. [DOI] [PubMed] [Google Scholar]
- Farrant M, Nusser Z (2005). Variations on an inhibitory theme: phasic and tonic activation of GABAA receptors. Nat Rev Neurosci 6:215–229. [DOI] [PubMed] [Google Scholar]
- Hamann M, Rossi DJ, Attwell D (2002). Tonic and spillover inhibition of granule cells control information flow through cerebellar cortex. Neuron 33:625–633. [DOI] [PubMed] [Google Scholar]
- Hanchar HJ, Dodson PD, Olsen RW, Otis TS, Wallner M (2005). Alcohol-induced motor impairment caused by increased extrasynaptic GABAA receptor activity. Nat Neurosci 8:339–345. [DOI] [PMC free article] [PubMed] [Google Scholar]
- Hevers W, Luddens H (1998). The diversity of GABAA receptors. Pharmacological and electrophysiological properties of GABAA channel subtypes. Mol Neurobiol 18:35–86. [DOI] [PubMed] [Google Scholar]
- Jechlinger M, Pelz R, Tretter V, Klausberger T, Sieghart W (1998). Subunit composition and quantitative importance of hetero-oligomeric receptors: GABAA receptors containing α6 subunits. J Neurosci 18:2449–2457. [DOI] [PMC free article] [PubMed] [Google Scholar]
- Jones A, Korpi ER, McKernan RM, Pelz R, Nusser Z, Makela R, Mellor JR, Pollard S, Bahn S, Stephenson FA, Randall AD, Sieghart W, Somogyi P, Smith AJ, Wisden W (1997). Ligand-gated ion channel subunit partnerships: GABAA receptor α6 subunit gene inactivation inhibits δ subunit expression. J Neurosci 17:1350–1362. [DOI] [PMC free article] [PubMed] [Google Scholar]
- Korpi ER, Kleingoor C, Kettenmann H, Seeburg PH (1993). Benzodiazepine-induced motor impairment linked to point mutation in cerebellar GABAA receptor. Nature 361:356–359. [DOI] [PubMed] [Google Scholar]
- Korpi ER, Kuner T, Seeburg PH, Luddens H (1995). Selective antagonist for the cerebellar granule cell-specific GABAA receptor. Mol Pharmacol 47:283–289. [PubMed] [Google Scholar]
- Leao RM, Mellor JR, Randall AD (2000). Tonic benzodiazepine-sensitive GABAergic inhibition in cultured rodent cerebellar granule cells. Neuropharmacology 39:990–1003. [DOI] [PubMed] [Google Scholar]
- Mitchell SJ, Silver RA (2003). Shunting inhibition modulates neuronal gain during synaptic excitation. Neuron 38:433–445. [DOI] [PubMed] [Google Scholar]
- Mody I (2001). Distinguishing between GABAA receptors responsible for tonic and phasic conductances. Neurochem Res 26:907–913. [DOI] [PubMed] [Google Scholar]
- Mohler H, Crestani F, Rudolph U (2001). GABAA-receptor subtypes: a new pharmacology. Curr Opin Pharmacol 1:22–25. [DOI] [PubMed] [Google Scholar]
- Nusser Z, Mody I (2002). Selective modulation of tonic and phasic inhibitions in dentate gyrus granule cells. J Neurophysiol 87:2624–2628. [DOI] [PubMed] [Google Scholar]
- Nusser Z, Sieghart W, Somogyi P (1998). Segregation of different GABAA receptors to synaptic and extrasynaptic membranes of cerebellar granule cells. J Neurosci 18:1693–1703. [DOI] [PMC free article] [PubMed] [Google Scholar]
- Nusser Z, Ahmad Z, Tretter V, Fuchs K, Wisden W, Sieghart W, Somogyi P (1999). Alterations in the expression of GABAA receptor subunits in cerebellar granule cells after the disruption of the α6 subunit gene. Eur J Neurosci 11:1685–1697. [DOI] [PubMed] [Google Scholar]
- Otis TS, Mody I (1992). Modulation of decay kinetics and frequency of GABAA receptor-mediated spontaneous inhibitory postsynaptic currents in hippocampal neurons. Neuroscience 49:13–32. [DOI] [PubMed] [Google Scholar]
- Perrais D, Ropert N (1999). Effect of zolpidem on miniature IPSCs and occupancy of postsynaptic GABAA receptors in central synapses. J Neurosci 19:578–588. [DOI] [PMC free article] [PubMed] [Google Scholar]
- Poltl A, Hauer B, Fuchs K, Tretter V, Sieghart W (2003). Subunit composition and quantitative importance of GABAA receptor subtypes in the cerebellum of mouse and rat. J Neurochem 87:1444–1455. [DOI] [PubMed] [Google Scholar]
- Rossi DJ, Hamann M (1998). Spillover-mediated transmission at inhibitory synapses promoted by high affinity α6 subunit GABAA receptors and glomerular geometry. Neuron 20:783–795. [DOI] [PubMed] [Google Scholar]
- Saxena NC, Macdonald RL (1996). Properties of putative cerebellar GABAA receptor isoforms. Mol Pharmacol 49:567–579. [PubMed] [Google Scholar]
- Stell BM, Mody I (2002). Receptors with different affinities mediate phasic and tonic GABAA conductances in hippocampal neurons. J Neurosci 22:RC223 (1–5). [DOI] [PMC free article] [PubMed] [Google Scholar]
- Stell BM, Brickley SG, Tang CY, Farrant M, Mody I (2003). Neuroactive steroids reduce neuronal excitability by selectively enhancing tonic inhibition mediated by delta subunit-containing GABAA receptors. Proc Natl Acad Sci USA 100:14439–14444. [DOI] [PMC free article] [PubMed] [Google Scholar]
- Tia S, Wang JF, Kotchabhakdi N, Vicini S (1996). Developmental changes of inhibitory synaptic currents in cerebellar granule neurons: role of GABAA receptor α6 subunit. J Neurosci 16:3630–3640. [DOI] [PMC free article] [PubMed] [Google Scholar]
- Wall MJ (2003). Competitive GABAA receptor antagonists increase the proportion of functional high-affinity α6 subunit-containing receptors in granule cells of adult rat cerebellum. Neuropharmacology 44:56–69. [DOI] [PubMed] [Google Scholar]
- Wall MJ (2005). Alterations in GABAA receptor occupancy occur during the postnatal development of rat Purkinje cell but not granule cell synapses. Neuropharmacology 49:596–609. [DOI] [PubMed] [Google Scholar]
- Wall MJ, Usowicz MM (1997). Development of action potential-dependent and independent spontaneous GABAA receptor-mediated currents in granule cells of postnatal rat cerebellum. Eur J Neurosci 9:533–548. [DOI] [PubMed] [Google Scholar]
- Wallner M, Hanchar HJ, Olsen RW (2003). Ethanol enhances α4β3δ and α6β3δ GABAA receptors at low concentrations known to affect humans. Proc Natl Acad Sci USA 100:15218–15223. [DOI] [PMC free article] [PubMed] [Google Scholar]
- Wieland HA, Luddens H, Seeburg PH (1992). A single histidine in GABAA receptors is essential for benzodiazepine agonist binding. J Biol Chem 267:1426–1429. [PubMed] [Google Scholar]