

Abstract
Mammals express two parvalbumins—an α isoform and a β isoform. In rat, the α-parvalbumin (α-PV) exhibits superior divalent ion affinity. For example, the standard free energies for Ca2+ binding differ by 5.5 kcal/mol in 0.15 M KCl (pH 7.4). High-resolution structures of the Ca2+-bound proteins provide little insight into this disparity, prompting a structural analysis of the apo-proteins. A recent analysis of rat β-PV suggested that Ca2+ removal provokes substantial conformational changes—reorientation of the C, D, and E helices; reorganization of the hydrophobic core; reduced interdomain contact; and remodeling of the AB domain. The energetic penalty attendant to reversing these changes, it was suggested, could contribute to the attenuated divalent ion-binding signature of that protein. That hypothesis is supported by data presented herein, describing the solution structure and peptide backbone dynamics of Ca2+-free rat α-PV. In marked contrast to rat β-PV, the apo- and Ca2+-loaded forms of the rat α isoform are quite similar. Significant structural differences appear to be confined to the loop regions of the molecule. This finding implies that the α-PV isoform enjoys elevated divalent ion affinity because the metal ion-binding events do not require major structural rearrangement and the concomitant sacrifice of binding energy.
Keywords: calcium-binding protein, EF-hand protein, parvalbumin, NMR, structure, dynamics
Parvalbumins are small, vertebrate-specific EF-hand proteins (Heizmann and Kagi 1989; Pauls et al. 1996). In fact, the crystal structure of carp parvalbumin (PV) established the EF-hand paradigm (Kretsinger and Nockolds 1973). The PV family includes α- and β sublineages (Goodman and Pechere 1977; Moncrief et al. 1990), and mammals express one isoform from each (Fohr et al. 1993). Although parvalbumins are believed to function primarily as cytosolic Ca2+-buffers, certain isoforms evidently play additional roles. For example, the mammalian β-PV, a.k.a. oncomodulin, is secreted by activated macrophages and functions as a potent nerve growth factor for retinal ganglion cells (Yin et al. 2006).
The PV tertiary structure includes six α-helical segments (A–F) organized into two domains—the N-terminal AB domain (residues 1–38) and the CD-EF domain. The two metal ion-binding sites, the CD and EF sites, are related by an approximate twofold symmetry axis and are physically linked by a short fragment of antiparallel β structure.
Despite 49% sequence identity (Berchtold and Means 1985; Gillen et al. 1987), the rat α- and β-PVs exhibit distinct divalent ion-binding affinities. (Hapak et al. 1989; Cox et al. 1990). In Hepes-buffered saline (pH 7.4), the ΔG°′ for Ca2+ binding is 3.6 kcal/mol more favorable for the α isoform. This difference increases to 5.5 kcal/mol when K+ replaces Na+ as the major solvent cation (Henzl et al. 2004).
High-resolution structures are available for the Ca2+-bound α- and β-parvalbumins from rat (Ahmed et al. 1993; McPhalen et al. 1994; Bottoms et al. 2004). However, they provide little insight into the disparate ion-binding properties of the proteins, suggesting that the unliganded state may influence the divalent ion-binding signature. We recently described the solution structure of Ca2+-free rat β-PV (Henzl and Tanner 2007). This article presents corresponding data for the Ca2+-free α isoform.
Results
Resonance assignments
At 25°C, Ca2+-free rat α-PV exhibits a well-resolved 1H-15N HSQC spectrum (Fig. 1), which differs perceptibly from that of the Ca2+-loaded protein under comparable solution conditions (Supplemental Fig. S1). Except for M2 and D25, all of the expected amide signals are present. The following resonances are substantially overlapped: I5/E62, L6/K12, A14/V43, A20/L63, S36/E108, L67/M86, E81/V99, K83/E100, and E101/A107.
Figure 1.

1H-15N HSQC spectrum of Ca2+-free rat α-PV in 0.15 M NaCl, 0.01 M Mes, and 0.005 M EDTA (pH 6.0) at 25°C.
Assignments were made using a suite of three-dimensional (3D), triple-resonance experiments. Aliphatic side-chain carbon assignments were complete, excluding the 24 carboxylates (Asp, Glu, and C terminus), the Q31 carboxamide, the R75 guanidinino group, and the methionine methyl groups. Aromatic side-chain assignments were lacking for Cγ and Cζ in the eight phenylalanine residues. Proton assignments (side-chain and backbone) were 95% complete.
The tabulated chemical shifts served as input for CSI and TALOS. The former returned φ and ψ estimates for 71 residues. The latter provided φ,ψ predictions for 77 residues.
Solution structure of Ca2+-free rat α-PV
The tertiary structure of Ca2+-free rat α-PV was calculated with distance and dihedral angle restraints (Table 1), using ARIA/CNS (Brunger et al. 1998; Linge et al. 2001). Figure 2 displays an ensemble of 20 low-energy conformers. Relative to the ensemble average, the RMSD is 0.81 Å for the backbone atoms (Cβ, Cα, C′, O, and N) and 1.26 Å for all heavy atoms. Table 1 presents additional structural quality statistics for the ensemble. According to PROCHECK, all but 0.3% of the φ,ψ combinations reside in allowed regions of the Ramachandran plot. Additionally, the structures exhibit few distance violations exceeding 0.5 Å or dihedral violations exceeding 5°.
Table 1.
List of restraints and statistical analysis for the apo-rat α-PV solution structure

Figure 2.
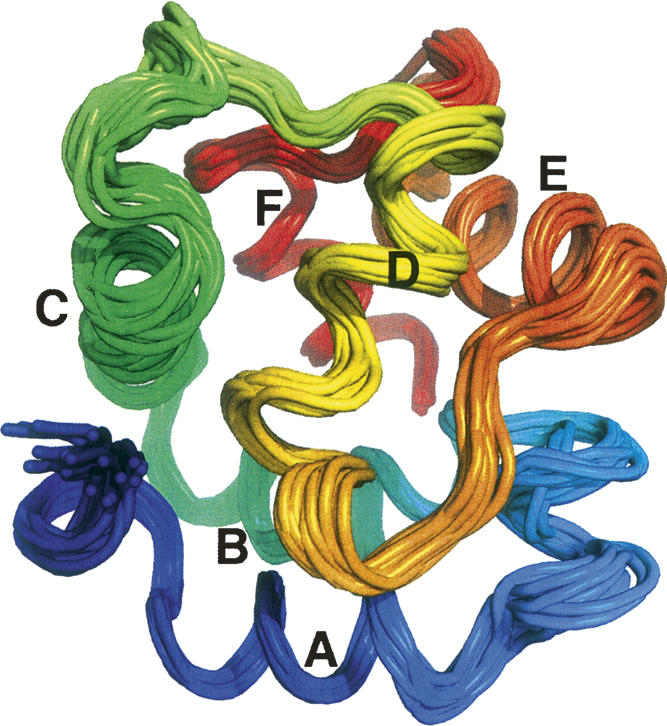
Solution structure of Ca2+-free rat α-PV. An ensemble of the 20 lowest energy structures determined with ARIA-CNS. This figure and Figures 3, 5, and 6 were produced with PyMOL (DeLano Scientific).
Comparison of the Ca2+-bound and Ca2+-free α-PV structures
The ensemble-averaged Ca2+-free structure (silver) has been superimposed on the crystal structure (blue) of Ca2+-bound rat α-PV (Protein Data Bank [PDB] 1RWY) in Figure 3. Although the protein fold is very similar in the presence and absence of Ca2+, several local conformational differences are observed. The Cα RMSD values for the apo- and Ca2+-loaded forms are plotted in Figure 4A. The largest discrepancies between the two structures occur in the loop between the A and B helices, the CD binding loop, the extended loop joining the D and E helices, and the EF binding loop. The average Cα RMSD is 2.4 Å.
Figure 3.

Stereoview of the superimposed structures of Ca2+-free (silver) and Ca2+-bound (blue) rat α-PV. The two structures were superimposed so as to minimize the overall RMSD. Coordinates for the Ca2+-bound structure were obtained from PDB 1RWY (Bottoms et al. 2004).
Figure 4.

(A) Cα RMSD values, as a function of residue number, for apo- and Ca2+-bound rat α-PV. Values represent the average for the 20 conformers in the ensemble. (B) Cα RMSD values, as a function of residue number, for the Ca2+-free α- and β-PV isoforms. Coordinates for the Ca2+-free β isoform were obtained from PDB 2NLN (Henzl and Tanner 2007). The values represent double-ensemble averages.
Figure 5 displays the CD and EF binding pockets in the Ca2+-loaded (panel A) and unliganded (panel B) forms of rat α-PV. The short fragment of antiparallel β structure that links the CD and EF sites is evidently preserved in the apo-protein.
Figure 5.

View of the metal ion-binding loops in Ca2+-bound (A) and Ca2+-free (B) rat α-PV.
Comparison of Ca2+-free rat α- and β-PVs
The representative solution structures of the Ca2+-free rat α-PV (silver) and β-PV (magenta) isoforms are compared in Figure 6. The Cα RMSD values are plotted in Figure 4B. In this superposition, the B and F helices are largely coincident, and good agreement is also observed for the E helix. However, the orientations of the remaining three helices differ substantially. The deviation in helix D is particularly noteworthy. In the α isoform, the side chain of F70 remains associated with the hydrophobic core in the absence of Ca2+, requiring distortion of the D helix. In the β isoform, however, F70 has withdrawn from protein interior, permitting the D helix to straighten. Smaller, but significant, deviations are also observed in the C and A helices. The ensemble-averaged Cα RMSD is 3.1 Å.
Figure 6.

Stereoview of the superimposed structures of Ca2+-free rat α-PV (silver) and Ca2+-free rat β-PV (magenta). The coordinates for the latter structure were obtained from PDB 2NLN (Henzl and Tanner 2007). The view in panel B represents an approximate 90° rotation about the vertical axis of the view in panel A.
PV CD- and EF-binding loops are related by an approximate twofold symmetry axis. In the Ca2+-bound form, they are physically joined by a segment of antiparallel β structure formed by I58 and I97. Whereas the α-PV retains this motif in the Ca2+-free form, as noted above, the β isoform does not.
15N relaxation data analysis
Relaxation data were collected on Ca2+-free rat α-PV at 25°C. The T 1 and T 2 data are well accommodated by a two-parameter exponential decay model. Representative decays are displayed in Supplemental Figure S2. R 1 and R 2 values were extracted for 88 of 108 amide vectors and are plotted in Figure 7, A and B, respectively. The numerical values are listed in Supplemental Table S1.
Figure 7.

Summary of 15N relaxation data and internal mobility analysis. (A) Experimental R 1 values. (B) Experimental R 2 values. (C) R2/R1 ratios. Filled circles (●) denote amide vectors included in the calculation of the mean value. (D) Experimental {1H}15N NOE values. (E) Generalized order parameter (S 2) determined by model-free analysis, as described in the text. A subset of the residues required inclusion of a second order parameter (●), corresponding to motion on a slower timescale, to satisfactorily model their relaxation behavior. (F) τ e (○) and R ex (●) values for those residues displaying motion on a timescale exceeding 20 psec. The locations of the six helical elements are indicated at the top of the figure.
The overall rotational correlation time (τ c) was estimated from a subset of amide vectors (Fig. 7C, ●) exhibiting an R 2/R 1 ratio within 1 SD of the mean. These data are well accommodated by a spherically symmetric rotational diffusion model, yielding a τ c value of 6.49 ± 0.03 nsec. Axially symmetric and fully symmetric models yielded insignificant reductions in χ2.
The {1H}15N NOE values (Fig. 7D) exhibit a high degree of uniformity. Significant reductions in the NOE are restricted to A21, D22, K37, K52, D61, K91, and S109. Excluding these residues, the average NOE value is 0.80.
Internal mobility and model-free analysis
The Lipari-Szabo model-free treatment was used to assess main-chain flexibility in Ca2+-free rat α-PV. Relaxation data for 88 amide vectors were analyzed, using a spherically symmetric diffusion model. The results are displayed in Figure 7, E and F, and the model-free parameters are listed in Supplemental Table S2.
The majority of signals (67/88) can be modeled with the overall rotational correlation time (τ c) and a generalized order parameter (S 2). Five amide vectors require a τ e term to describe internal motion on the 20-psec to 10-nsec timescale. An additional three require an R ex term to describe internal motion on the microsecond to millisecond timescale. Three amides (residues 19, 52, and 92) can be accommodated only by inclusion of both τ e and R ex terms. Finally, 10 NH vectors (7, 10, 23, 26, 40, 42, 74, 85, 105, 109) exhibit behavior consistent with motion on two timescales shorter than the overall rotational correlation time.
The average order parameter for the apo-protein is 0.92. This value is significantly higher than the value of 0.85 reported for the Ca2+-bound protein (Baldellon et al. 1998). However, the latter analysis was performed at 32°C, rather than 25°C, and the order parameter is expected to decrease somewhat with elevated temperature (Bracken et al. 1999). Nevertheless, the implication is that removal of Ca2+ does not produce a major increase in backbone motion, at least on the picosecond timescale. Similar behavior was noted previously for the rat β-PV isoform (Henzl et al. 2002; Henzl and Tanner 2007).
Discussion
Although the α- and β-PV isoforms from rat exhibit distinct divalent ion-binding properties, the Ca2+-bound structures of rat α- and β-PV are very similar (Ahmed et al. 1993; McPhalen et al. 1994; Bottoms et al. 2004). The average main-chain RMSD value is just 0.8 Å. Thus, inspection of the Ca2+-loaded molecules offers few clues as to the source of the apparent 5.5 kcal/mol difference in standard binding free energy observed in 0.15 M KCl (pH 7.4). Because divalent ion affinity reflects the difference in the stabilities of the bound and unliganded forms, the disparate divalent ion-binding behaviors could conceivably be dictated at the level of the apo-proteins. To explore this possibility, we have obtained solution structures for the Ca2+-free forms of rat α- and β-PV. The structure of the β isoform (Henzl and Tanner 2007) departs significantly from that of the Ca2+-bound form. Ca2+ removal provokes substantial reorientation of the C, D, and E helices and reorganization of the hydrophobic core. F70 and F66 have evidently withdrawn from the protein interior, permitting the D helix to straighten. By contrast, F49 and L85 have assumed more interior positions. These changes in the CD-EF domain reduce the area of apolar contact with the AB domain by nearly 10%. In consequence, perhaps, the apolar side chains in the AB region exhibit increased intradomain interactions. It was suggested that the energetic penalty associated with reversing these changes could significantly reduce the net binding free energy, providing a potential explanation for the attenuated divalent ion affinity.
The structural alterations accompanying Ca2+ removal are evidently less extensive in the rat α isoform. The largest differences are observed in the CD binding loop and in the extended loop joining the A and B helices. Significant differences are also observed in the loop between the D and E helices and in the EF ion-binding loops. However, the six helical segments display good agreement with the Ca2+-loaded form, and the hydrophobic core is largely undisturbed.
These findings are consistent with one-dimensional NMR studies of rat α-PV conducted by Sykes and coworkers two decades ago (Williams et al. 1986). At 37°C, in 0.5 M KCl, they observed evidence for two forms of the apo-protein—an unfolded form and a form having a spectroscopic signature very similar to that of the Ca2+-bound protein. No evidence of unfolded protein is observed in the present study, presumably because the NMR data were collected at lower temperature (25°C) and in the presence of 0.15 M NaCl. Whereas Ca2+-free α-PV exhibits negligible affinity for K+, it binds 1.0 equivalent of Na+ with an association constant estimated at 630 M−1 (Henzl et al. 2000, 2004). Binding of the monovalent cation exerts a pronounced stabilizing influence on the protein. For example, whereas Ca2+-free rat α-PV denatures at 46 ± 0.2°C in 0.20 M NaCl, it denatures at 35.5 ± 0.3°C in 0.20 M KCl. Even at 25°C, the appearance of the 1H,15N HSQC spectrum of rat α-PV is strongly dependent on the identity of the major solvent cation (data not shown).
Although the average S 2 values obtained from model-free analysis are essentially identical for the two apo-PVs—0.916 for α, 0.924 for β—their backbone dynamics offer several interesting contrasts. The β isoform displays markedly elevated R 2 values in the CD binding loop and in the F helix, indicative of motion on the microsecond to millisecond timescale. Consistent with that observation, the majority of those amide vectors require an R ex term to adequately model their relaxation behavior. By contrast, the R 2 values measured for rat α-PV in these regions are comparatively uniform, and the relaxation of the amide vectors in question can be satisfactorily modeled without an R ex contribution. The R 2 values for the two proteins are compared in Supplemental Figure S3.
Additionally, Ca2+-free rat β-PV displays systematically lower NOE values near the C terminus of the CD binding loop and in the EF binding loop, indicative of motion on the nanosecond timescale. Consistent with that observation, the amide vectors in these regions require a τ e term for satisfactory model-free treatment. Once again, the corresponding NOE values determined for the α isoform are remarkably constant over these regions, and there is no requirement for τ e in the model-free analysis. The {1H} 15N NOE values for the two proteins are compared in Supplemental Figure S3B. The contrast in the R 2 and NOE profiles suggests that the metal ion-binding loops in the rat β isoform, but not in the α isoform, experience nanosecond to millisecond motion. Recall that the antiparallel β segment linking the CD and EF loops in the Ca2+-loaded proteins is evidently retained in the Ca2+-free α-PV and may serve to dampen longer timescale motions in the ion-binding loops.
When subjected to model-free analysis, nearly all of the N-H vectors in rat β-PV can be modeled with a single order parameter. The two vectors requiring a second order parameter, corresponding to motion on a slower timescale, reside in the EF-site binding loop (D94, G95). By contrast, there are 10 amide vectors in the Ca2+-free α isoform that require the second order parameter. The residues in question are scattered throughout the sequence but are absent from the metal ion-binding loops. Thus, although the average order parameters for the two apo-proteins do not differ appreciably, the model-free analysis suggests that, relative to the β isoform, the peptide backbone of Ca2+-free rat α-PV experiences more complex motions on timescales shorter than the overall rotational correlation time.
Under resting-state conditions in vivo, the α-PV resides almost exclusively in the Mg2+-loaded form, and the apo-form described here is negligibly populated. However, because the divalent ion affinity depends on the free energies of both the bound and unliganded forms, the apo-protein contributes to the divalent ion-binding signature of the protein. The previous structural analysis of Ca2+-free rat β-PV suggested that the atypically low divalent ion affinity displayed by that protein might reflect the requirement for an energetically costly interconversion of the apo- and Ca2+-bound conformations. The structural data presented here for the Ca2+-free rat α isoform are compatible with that argument. Specifically, the apo- and Ca2+-loaded proteins exhibit very similar tertiary structures. Because energy need not be expended to isomerize the protein, the net free energy change that accompanies divalent ion binding is more favorable.
This hypothesis clearly requires additional confirmation. If ultimately shown to be valid, it provides an interesting correlation between structure and energetics. It does not, however, speak to the underlying physical basis for the structural, and functional, differences. The solution of that problem, still tantalizingly out of reach, will require identification of specific amino acid sequence assignments associated with the low- and high-affinity phenotypes.
Materials and Methods
Protein expression and purification
Recombinant rat α-PV was expressed and purified as described previously (Henzl and Graham 1999). Besides 13C6-d-glucose and/or 15NH4Cl, the medium consisted of M9 salts supplemented with 2.5% (v/v) Celtone (Spectra Stable Isotopes), 100 μM FeCl3, trace elements, and ampicillin (300 μg/mL). Each L yielded 20–25 mg of protein, with purity exceeding 98%.
NMR sample preparation
Sufficient protein to yield a 3 mM sample was concentrated to 5 mL by ultrafiltration and then dialyzed at 4°C for 48 h, against 4 L of 0.15 M NaCl, 0.025 M Hepes, and 5.0 mM EDTA (pH 7.4). Dialysis was continued for 48 h against 0.15 M NaCl, 0.01 M Mes, and 5.0 mM EDTA (pH 6.0). After adding 0.1 volume of buffer prepared in D2O and sodium azide (final concentration 0.1%), the solution was concentrated to 0.35 mL and loaded into a 5-mm Shigemi microcell (Shigemi, Inc.).
NMR spectroscopy
All data were acquired at 25°C with BioPack pulse sequences on a Varian INOVA 600-MHz spectrometer, employing a triple-resonance cryoprobe equipped with pulsed-field z gradient. 1H chemical shifts were referenced relative to DSS; 13C and 15N shifts were referenced indirectly, employing the 1H/X frequency ratios. Data were processed with NMRPipe and analyzed with Sparky (T.D. Goddard and D.G. Kneller, University of California, San Francisco).
Resonance assignments
Backbone resonance assignments were made using the following pairs of 3D experiments: HNCA (Ikura et al. 1990) and HN(CO)CA (Bax and Ikura 1991), HNCACB (Kay et al. 1994; Muhandiram and Kay 1994) and CBCA(CO)NH (Grzesiek and Bax 1992), and HNCO (Ikura et al. 1990) and HCACOCANH (Lohr and Ruterjans 2005). Aliphatic 13C assignments beyond Cβ were collected using the CCONH (Grzesiek et al. 1993) spectrum. Aliphatic side-chain 1H assignments were made with HCCONH (Grzesiek et al. 1993), 15N-edited TOCSY-HSQC (Marion et al. 1989a), and HCCH-TOCSY (Kay et al. 1993) experiments. Aromatic side-chain resonances were assigned using the HBCBCGCDHD (Yamazaki et al. 1993) and HBCBCGCDCEHE (Yamazaki et al. 1993) experiments. Stereospecific assignments of the methyl protons in valine and leucine were made by analysis of a fractionally 13C-labeled sample (Neri et al. 1989).
Structural restraints
For collection of NOE-based distance restraints, a 3D 15N-edited NOESY-HSQC (Marion et al. 1989b) data set was collected on 15N-labeled protein, employing a mixing time of 125 msec. A corresponding 13C-edited experiment was performed on 13C,15N-labeled material, using a mixing time of 100 msec. Cross peaks were picked manually and integrated in Sparky. φ,ψ dihedral angle restraints were obtained from TALOS (Cornilescu et al. 1999) and CSI (Wishart and Sykes 1994).
15N relaxation data were collected on 15N-labeled protein, employing the T 1, T 2, and {1H}15N NOE pulse sequences supplied in BioPack. R 1 data were acquired with relaxation delays of 50, 100, 150, 250, 350, 450, 600, 800, 1000, and 1200 msec. R 2 data were acquired with delays of 10, 30, 50, 70, 90, 110, 130, 150, 170, and 190 msec. Replicate data were obtained at three delay values for evaluation of experimental uncertainty. For the measurement of steady-state heteronuclear {1H}15N-NOEs, HSQC spectra were collected, with or without proton saturation (3.0 sec), employing a total recycle delay period of 5.0 sec. Duplicate experiments were performed to obtain an estimate of the experimental uncertainty.
Structure calculations were performed with ARIA2.0a (Habeck et al. 2004). ARIA (Ambiguous Restraints for Iterative Assignment) integrates automated NOE assignments with CNS-based structure calculations (Linge et al. 2001). In addition to the 15N- and 13C-edited NOESY cross-peak lists, the initial input to ARIA also included dihedral angle restraints (TALOS and CSI). The quality of the final structures was analyzed using PROCHECK (Laskowski et al. 1993).
15N relaxation analysis
Peak intensities in the T 1, T 2, and {1H}15N NOE data sets were measured automatically in Sparky. R 1 and R 2 values were extracted for each peak by fitting signal intensities to a two-parameter single-exponential decay, in Origin, version 7.5 (OriginLab). The NOE values represent the ratio of the signal intensities in the presence and absence of proton saturation. These relaxation data were analyzed with Tensor2 (Dosset et al. 2000).
The overall rotational correlation time (τ c) was estimated from the subset of amide vectors having R 2/R 1 values within 1 SD of the mean value (Tjandra et al. 1995). The isotropic rotational diffusion model yielded a τ c value of 6.49 ± 0.03 nsec, corresponding to a rotational diffusion coefficient of 2.56 × 10⁷ sec−1. Axially symmetric and fully anisotropic models did not afford significant improvements in χ2.
Internal mobilities were examined with the Lipari-Szabo model-free formalism (Lipari and Szabo 1982a,b). Tensor2 employs the five models suggested by Clore et al. (1990a,b) and the model selection strategy described by Mandel et al. (1995).
Coordinate and data deposition
The atomic coordinates and structural restraints have been deposited in the Protein Data Bank (PDB 2JWW). 1H, 15N, and 13C assignments have been deposited in BioMagResBank (BMRB 15,517).
Acknowledgments
We thank Dr. Wei Wycoff, staff NMR Spectroscopist for the MU NMR Facility, for assistance with NMR data acquisition. This work was supported by NSF awards MCB0131166 and MCB0543476 (to M.T.H. and J.J.T.).
Footnotes
Supplemental material: see www.proteinscience.org
Reprint requests to: Michael T. Henzl, Department of Biochemistry, 117 Schweitzer Hall, University of Missouri-Columbia, Columbia, MO 65211, USA; e-mail: henzlm@missouri.edu; fax: (573) 884-4812.
Abbreviations: CD site, parvalbumin metal ion-binding site flanked by the C and D helices; CSI, chemical shift index; DSS, sodium 2,2-dimethyl-2-silapentane-5-sulfonate; EDTA, ethylenediaminetetraacetic acid; EF site, parvalbumin metal ion-binding site flanked by the E and F helices; Hepes, 4-(2-hydroxyethyl)-1-piperazineethanesulfonic acid; HSQC, heteronuclear single-quantum coherence; Mes, 2-(N-morpholino)ethanesulfonic acid; NMR, nuclear magnetic resonance; NOE, nuclear Overhauser effect; NOESY, NOE spectroscopy; PV, parvalbumin; R 1, longitudinal relaxation rate (1/T 1); R 2, transverse relaxation rate (1/T 2); RMSD, root-mean-square-difference; S 2, generalized Lipari-Szabo order parameter; TALOS, torsion angle likelihood obtained from shifts and sequence similarity; τ c, overall rotational correlation time; τ e, internal correlation time; R ex, rate constant for μs/ms motion resulting from chemical or conformational exchange.
Article published online ahead of print. Article and publication date are at http://www.proteinscience.org/cgi/doi/10.1110/ps.073318308.
References
- Ahmed, F.R., Rose, D.R., Evans, S.V., Pippy, M.E., To, R. Refinement of recombinant oncomodulin at 1.30 Å resolution. J. Mol. Biol. 1993;230:1216–1224. doi: 10.1006/jmbi.1993.1237. [DOI] [PubMed] [Google Scholar]
- Baldellon, C., Alattia, J.R., Strub, M.P., Pauls, T., Berchtold, M.W., Cave, A., Padilla, A. 15N NMR relaxation studies of calcium-loaded parvalbumin show tight dynamics compared to those of other EF-hand proteins. Biochemistry. 1998;37:9964–9975. doi: 10.1021/bi980334p. [DOI] [PubMed] [Google Scholar]
- Bax, A., Ikura, M. An efficient 3D NMR technique for correlating the proton and 15N backbone amide resonances with the α-carbon of the preceding residue in uniformly 15N/13C enriched proteins. J. Biomol. NMR. 1991;1:99–104. doi: 10.1007/BF01874573. [DOI] [PubMed] [Google Scholar]
- Berchtold, M.W., Means, A.R. The Ca2+-binding protein parvalbumin: Molecular cloning and developmental regulation of mRNA abundance. Proc. Natl. Acad. Sci. 1985;82:1414–1418. doi: 10.1073/pnas.82.5.1414. [DOI] [PMC free article] [PubMed] [Google Scholar]
- Bottoms, C.A., Schuermann, J.P., Agah, S., Henzl, M.T., Tanner, J.J. Crystal structure of rat α-parvalbumin at 1.05 Å resolution. Protein Sci. 2004;13:1724–1734. doi: 10.1110/ps.03571004. [DOI] [PMC free article] [PubMed] [Google Scholar]
- Bracken, C., Carr, P.A., Cavanagh, J., Palmer A.G., III Temperature dependence of intramolecular dynamics of the basic leucine zipper of GCN4: Implications for the entropy of association with DNA. J. Mol. Biol. 1999;285:2133–2146. doi: 10.1006/jmbi.1998.2429. [DOI] [PubMed] [Google Scholar]
- Brunger, A.T., Adams, P.D., Clore, G.M., DeLano, W.L., Gros, P., Grosse-Kunstleve, R.W., Jiang, J.S., Kuszewski, J., Nilges, M., Pannu, N.S., et al. Crystallography & NMR system: A New software suite for macromolecular structure determination. Acta Crystallogr. D Biol. Crystallogr. 1998;54:905–921. doi: 10.1107/s0907444998003254. [DOI] [PubMed] [Google Scholar]
- Clore, G.M., Driscoll, P.C., Wingfield, P.T., Gronenborn, A.M. Analysis of the backbone dynamics of interleukin-1β using two-dimensional inverse detected heteronuclear 15N-1H NMR spectroscopy. Biochemistry. 1990a;29:7387–7401. doi: 10.1021/bi00484a006. [DOI] [PubMed] [Google Scholar]
- Clore, G.M., Szabo, A., Bax, A., Kay, L.E., Driscoll, P.C., Gronenborn, A.M. Deviations from the simple two-parameter model-free approach to the interpretation of nitrogen-15 nuclear magnetic relaxation of proteins. J. Am. Chem. Soc. 1990b;112:4989–4991. [Google Scholar]
- Cornilescu, G., Delaglio, F., Bax, A. Protein backbone angle restraints from searching a database for chemical shift and sequence homology. J. Biomol. NMR. 1999;13:289–302. doi: 10.1023/a:1008392405740. [DOI] [PubMed] [Google Scholar]
- Cox, J.A., Milos, M., MacManus, J.P. Calcium- and magnesium-binding properties of oncomodulin. Direct binding studies and microcalorimetry. J. Biol. Chem. 1990;265:6633–6637. [PubMed] [Google Scholar]
- Dosset, P., Hus, J.-C., Blackledge, M., Marion, D. Efficient analysis of macromolecular rotational diffusion from heteronuclear relaxation data. J. Biomol. NMR. 2000;16:23–28. doi: 10.1023/a:1008305808620. [DOI] [PubMed] [Google Scholar]
- Fohr, U.G., Weber, B.R., Muntener, M., Staudenmann, W., Hughes, G.J., Frutiger, S., Banville, D., Schafer, B.W., Heizmann, C.W. Human α and β parvalbumins. Structure and tissue-specific expression. Eur. J. Biochem. 1993;215:719–727. doi: 10.1111/j.1432-1033.1993.tb18084.x. [DOI] [PubMed] [Google Scholar]
- Gillen, M.F., Banville, D., Rutledge, R.G., Narang, S., Seligy, V.L., Whitfield, J.F., MacManus, J.P. A complete complementary DNA for the oncodevelopmental calcium-binding protein, oncomodulin. J. Biol. Chem. 1987;262:5308–5312. [PubMed] [Google Scholar]
- Goodman, M., Pechere, J.F. The evolution of muscular parvalbumins investigated by the maximum parsimony method. J. Mol. Evol. 1977;9:131–158. doi: 10.1007/BF01732745. [DOI] [PubMed] [Google Scholar]
- Grzesiek, S., Bax, A. Correlating backbone amide and side chain resonances in larger proteins by multiple relayed triple resonance NMR. J. Am. Chem. Soc. 1992;114:6291–6293. [Google Scholar]
- Grzesiek, S., Anglister, J., Bax, A. Correlation of backbone amide and aliphatic side-chain resonances in 13C/15N-enriched proteins by isotropic mixing of carbon-13 magnetization. J. Magn. Reson. 1993;101:114–119. [Google Scholar]
- Habeck, M., Rieping, W., Linge, J.P., Nilges, M. NOE assignment with ARIA 2.0: The nuts and bolts. Methods Mol. B. 2004;278:379–402. doi: 10.1385/1-59259-809-9:379. [DOI] [PubMed] [Google Scholar]
- Hapak, R.C., Lammers, P.J., Palmisano, W.A., Birnbaum, E.R., Henzl, M.T. Site-specific substitution of glutamate for aspartate at position 59 of rat oncomodulin. J. Biol. Chem. 1989;264:18751–18760. [PubMed] [Google Scholar]
- Heizmann, C.W., Kagi, U. Structure and function of parvalbumin. Adv. Exp. Med. Biol. 1989;255:215–222. doi: 10.1007/978-1-4684-5679-0_23. [DOI] [PubMed] [Google Scholar]
- Henzl, M.T., Graham, J.S. Conformational stabilities of the rat α- and β-parvalbumins. FEBS. Lett. 1999;442:241–245. doi: 10.1016/s0014-5793(98)01666-4. [DOI] [PubMed] [Google Scholar]
- Henzl, M.T., Tanner, J.J. Solution structure of Ca2+-free rat β-parvalbumin (oncomodulin) Protein Sci. 2007;16:1914–1926. doi: 10.1110/ps.072837307. [DOI] [PMC free article] [PubMed] [Google Scholar]
- Henzl, M.T., Larson, J.D., Agah, S. Influence of monovalent cations on rat α- and β-parvalbumin stabilities. Biochemistry. 2000;39:5859–5867. doi: 10.1021/bi992762g. [DOI] [PubMed] [Google Scholar]
- Henzl, M.T., Wycoff, W.G., Larson, J.D., Likos, J.J. 15N nuclear magnetic resonance relaxation studies on rat β-parvalbumin and the pentacarboxylate variants, S55D and G98D. Protein Sci. 2002;11:158–173. doi: 10.1110/ps.18102. [DOI] [PMC free article] [PubMed] [Google Scholar]
- Henzl, M.T., Larson, J.D., Agah, S. Influence of monovalent cation identity on parvalbumin divalent ion-binding properties. Biochemistry. 2004;43:2747–2763. doi: 10.1021/bi035890k. [DOI] [PubMed] [Google Scholar]
- Ikura, M., Kay, L.E., Bax, A. A novel approach for sequential assignment of 1H, 13C, and 15N spectra of larger proteins: Heteronuclear triple-resonance three-dimensional NMR spectroscopy. Application to calmodulin. Biochemistry. 1990;29:4659–4667. doi: 10.1021/bi00471a022. [DOI] [PubMed] [Google Scholar]
- Kay, L.E., Xu, G.Y., Singer, A.U., Muhandiram, D.R., Forman-Kay, J.D. A gradient-enhanced HCCH-TOCSY experiment for recording side-chain proton and carbon-13 correlations in water samples of proteins. J. Magn. Reson. 1993;B101:333–337. [Google Scholar]
- Kay, L.E., Xu, G.Y., Yamazaki, T. Enhanced-sensitivity triple-resonance spectroscopy with minimal H2O saturation. J. Magn. Reson. 1994;109:129–133. [Google Scholar]
- Kretsinger, R.H., Nockolds, C.E. Carp muscle calcium-binding protein. II. Structure determination and general description. J. Biol. Chem. 1973;248:3313–3326. [PubMed] [Google Scholar]
- Laskowski, R.A., MacArthur, M.W., Moss, D.S., Thornton, J.M. PROCHECK: A program to check the stereochemical quality of protein structures. J. Appl. Crystallogr. 1993;26:283–291. [Google Scholar]
- Linge, J.P., O'Donoghue, S.I., Nilges, M. Automated assignment of ambiguous nuclear overhauser effects with ARIA. Methods Enzymol. 2001;339:71–90. doi: 10.1016/s0076-6879(01)39310-2. [DOI] [PubMed] [Google Scholar]
- Lipari, G., Szabo, A. Model-free approach to the interpretation of nuclear magnetic resonance relaxation in macromolecules. 1. Theory and range of validity. J. Am. Chem. Soc. 1982a;104:4546–4559. [Google Scholar]
- Lipari, G., Szabo, A. Model-free approach to the interpretation of nuclear magnetic resonance relaxation in macromolecules. 2. Analysis of experimental results. J. Am. Chem. Soc. 1982b;104:4559–4570. [Google Scholar]
- Lohr, F., Ruterjans, H. A new triple-resonance experiment for the sequential assignment of backbone resonances in proteins. J. Biomol. NMR. 2005;6:189–197. doi: 10.1007/BF00211783. [DOI] [PubMed] [Google Scholar]
- Mandel, A.M., Akke, M., Palmer A.G., III Backbone dynamics of Escherichia coli ribonuclease HI: Correlations with structure and function in an active enzyme. J. Mol. Biol. 1995;246:144–163. doi: 10.1006/jmbi.1994.0073. [DOI] [PubMed] [Google Scholar]
- Marion, D., Driscoll, P.C., Kay, L.E., Wingfield, P.T., Bax, A., Gronenborn, A.M., Clore, G.M. Overcoming the overlap problem in the assignment of 1H NMR spectra of larger proteins by use of three-dimensional heteronuclear 1H-15N Hartmann-Hahn-multiple quantum coherence and nuclear Overhauser-multiple quantum coherence spectroscopy: Application to interleukin 1β. Biochemistry. 1989a;28:6150–6156. doi: 10.1021/bi00441a004. [DOI] [PubMed] [Google Scholar]
- Marion, D., Kay, L.E., Sparks, S.W., Torchia, D., Bax, A. Three-dimensional heteronuclear NMR of nitrogen-15 labeled proteins. J. Am. Chem. Soc. 1989b;111:1515–1517. [Google Scholar]
- McPhalen, C.A., Sielecki, A.R., Santarsiero, B.D., James, M.N.G. Refined crystal structure of rat parvalbumin, a mammalian α-lineage parvalbumin, at 2.0 Å resolution. J. Mol. Biol. 1994;235:718–732. doi: 10.1006/jmbi.1994.1023. [DOI] [PubMed] [Google Scholar]
- Moncrief, N.D., Kretsinger, R.H., Goodman, M. Evolution of EF-hand calcium-modulated proteins. I. Relationships based on amino acid sequences. J. Mol. Evol. 1990;30:522–562. doi: 10.1007/BF02101108. [DOI] [PubMed] [Google Scholar]
- Muhandiram, D.R., Kay, L.E. Gradient-enhanced triple-resonance three-dimensional NMR experiments with improved sensitivity. J. Magn. Reson. 1994;103:203–216. [Google Scholar]
- Neri, D., Szyperski, T., Otting, G., Senn, H., Wuytack, F. Stereospecific nuclear magnetic resonance assignments of the methyl groups of valine and leucine in the DNA-binding domain of the 434 repressor by biosynthetically directed fractional 13C labeling. Biochemistry. 1989;28:7510–7516. doi: 10.1021/bi00445a003. [DOI] [PubMed] [Google Scholar]
- Pauls, T.L., Cox, J.A., Berchtold, M.W. The Ca2+-binding proteins parvalbumin and oncomodulin and their genes: New structural and functional findings. Biochim. Biophys. Acta. 1996;1306:39–54. doi: 10.1016/0167-4781(95)00221-9. [DOI] [PubMed] [Google Scholar]
- Tjandra, N., Feller, S.E., Pastor, R.W., Bax, A. Rotational diffusion anisotropy of human ubiquitin from 15N NMR relaxation. J. Am. Chem. Soc. 1995;117:12562–12566. [Google Scholar]
- Williams, T.C., Corson, D.C., Oikawa, K., McCubbin, W.D., Kay, C.M., Sykes, B.D. Proton NMR spectroscopic studies of calcium-binding proteins. 3. Solution conformations of rat apo-α-parvalbumin and metal-bound rat α-parvalbumin. Biochemistry. 1986;25:1835–1846. doi: 10.1021/bi00355a057. [DOI] [PubMed] [Google Scholar]
- Wishart, D.S., Sykes, B.D. The 13C chemical-shift index: A simple method for the identification of protein secondary structure using 13C chemical-shift data. J. Biomol. NMR. 1994;4:171–180. doi: 10.1007/BF00175245. [DOI] [PubMed] [Google Scholar]
- Yamazaki, T., Forman-Kay, J.D., Kay, L.E. Two-dimensional NMR experiments for correlating 13Cβ and 1Hδ/ε chemical shifts of aromatic residues in 13C-labeled proteins via scalar couplings. J. Am. Chem. Soc. 1993;115:11054–11055. [Google Scholar]
- Yin, Y., Henzl, M.T., Lorber, B., Nakazawa, T., Thomas, T.T., Jiang, F., Langer, R., Benowitz, L.I. Oncomodulin is a macrophage-derived signal for axon regeneration in retinal ganglion cells. Nat. Neurosci. 2006;9:843–852. doi: 10.1038/nn1701. [DOI] [PubMed] [Google Scholar]