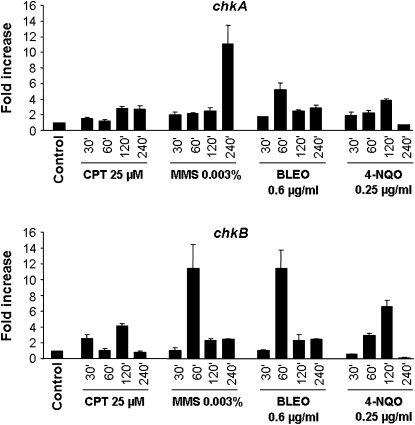
Figure 4.—
Fold increase in chkA/chkB RNA levels in response to DNA-damaging agents. Mycelia were grown either in the absence of any drug or in the presence of 25 μm CPT, 0.003% MMS, 0.6 μg/ml BLEO, or 0.25 μg/ml 4-NQO for 30, 60, 120, and 240 min. Real-time RT–PCR was the method used to quantify the mRNA. The measured quantity of the chkA/chkB mRNA in each of the treated samples was normalized using the CT values obtained for the tubC RNA amplifications run in the same plate. The relative quantitation of chkA/chkB and tubulin gene expression was determined by a standard curve (i.e., CT values plotted against the logarithm of the DNA copy number). Results of four sets of experiments were combined for each determination; means ± standard deviations are shown. The values represent the number of times the genes are expressed compared to the wild-type control grown without any drug (represented absolutely as 1.00).

