

Abstract
Children with one of two genetic disorders (chromosome 22q11.2 deletion syndrome and Turner syndrome) as well typically developing controls, participated in three cognitive processing experiments. Two experiments were designed to test cognitive processes involved in basic aspects numerical cognition. The third was a test of simple manual motor reaction time. Despite significant differences in global intellectual abilities, as measured by IQ tests, performance on the two numerical cognition tasks differed little between the two groups of children with genetic disorders. However, both performed significantly more poorly than did controls. The pattern of results are consistent with the hypothesis that impairments were not due to global intellectual ability but arose in specific cognitive functions required by different conditions within the tasks. The fact that no group differences were found in the reaction time task, despite significant differences in the standardized processing speed measure, further supports the interpretation that specific cognitive processing impairments and not global intellectual or processing speed impairments explain the pattern of results. The similarity in performance on these tasks of children with unrelated genetic disorders counters the view that numerical cognition is under any direct genetic control. Instead, our findings are consistent with the view that disturbances in foundational spatiotemporal cognitive functions contribute to the development of atypical representations and processes in the domains of basic magnitude comparison and simple numerical enumeration.
Keywords: children, genetics, enumeration, magnitude, processing speed
Difficulty with numerical competence, most typically noticed in the form of math disability, is characteristic of several distinct neurogenetic syndromes whose cognitive phenotypes share some characteristics. Numerical and mathematical impairments have been consistently reported in individuals with chromosome 22q11.2 (DS22q11.2) or Velocardiofacial syndrome (VCFS) (e.g. Campbell & Swillen, 2005; Eliez, Blasey, Menon, White, Schmitt, & Reiss, 2001; Simon, Bearden, McDonald-McGinn, & Zackai, 2005), Fragile X syndrome (FXS) (e.g. Mazzocco, Singh Bhatia, & Lesniak-Karpiak, 2006; Rivera, Menon, White, Glaser, & Reiss, 2002), Turner syndrome (45,X TS) (e.g. Bruandet, Molko, Cohen, & Dehaene, 2004; Rovet, Szekely, & Hockenberry, 1994; Temple CM, 1996) and Williams (WS) syndrome (e.g. Paterson, Brown, Gsodl, Johnson, & Karmiloff-Smith, 1999; Paterson, Girelli, Butterworth, & Karmiloff-Smith, 2006). Although not exclusively the case, recent research has focused on explicitly computational aspects of the numerical domain, namely arithmetic and simple mathematics. Such tasks have been employed in order to understand the neural and, to some extent, the genetic basis of the problems (Eliez et al., 2001; Kesler, Menon, & Reiss, 2006; Molko, Cachia, Riviere, Mangin, Bruandet, LeBihan, Cohen, & Dehaene, 2004; Rivera, Menon, White, Glaser, & Reiss, 2002).
On the surface, this would seem to be an appropriate approach, since basic arithmetic is typically the first domain in which most children’s difficulties with this sort of processing becomes evident and problematical. However, the focus on computational impairments may not be the most fruitful or comprehensive one to adopt if the goal is to understand how and why these difficulties occur. This is because even the relatively basic abilities required to carry out simple addition and subtraction are dependent upon several coordinated underlying cognitive processes and a significant amount of acquired knowledge (e.g. Fuson, 1988). Impairments in even the most basic mathematical tasks are developmentally closer to an “end state” rather than the “start state.” The “start state” is a specification of the foundational components of an ability described in terms of a distinct and simpler set of typical and atypical processes (for similar neuroconstructivist perspective see Karmiloff-Smith, 1998). Thus, it is our view that in order to understand the causes of the impairment, studies of more basic cognitive processes should be targeted instead of investigations of the “end state.”
Here we propose that the “start state” for typical, and thus also atypical, development of basic numerical and later arithmetical and other computational abilities is defined in terms of a set of cognitive competencies relating to spatial and object cognition (Ansari & Karmiloff-Smith, 2002; Simon, 1997, 1999). These have been shown, in many studies of typically developed adults, to largely depend on cognitive functions that implemented by the frontoparietal attention network. Such functions include object detection and individuation, orienting of attention to objects in response to spatial cues or internally generated search paths, engaging and disengaging from those objects and, at a slightly later point in development, orienting attention within internal representational structures such as mental number lines (e.g. Corbetta & Shulman, 2002; Dehaene, Piazza, Pinel, & Cohen, 2003). Thus, it has been proposed (e.g. Simon, Bearden, McDonald-McGinn, & Zackai, 2005; Simon, Bish, Bearden, Ding, Ferrante, Nguyen, Gee, McDonald-McGinn, Zackai, & Emannuel, 2005) that an important precursor to arithmetical and mathematical disability in children with one of the above listed disorders (DS22q11.2) is dysfunctional cognitive processing in the spatiotemporal domain. There is also evidence of a similar relationship in Williams syndrome (e.g. Ansari, Donlan, Thomas, Ewing, Peen, & Karmiloff-Smith, 2003). The premise underlying this view is that the processing of objects and the spatial relationships between them is a required component of early numerical ability such as counting and comparative magnitude reasoning. These and other tasks appear to depend to a considerable degree on spatial attention processes. The link becomes particularly clear when examining impairments that are evident in visuospatial tasks that engage aspects of the frontoparietal attention system. This is a network involving posterior parietal and frontal cortical areas, among others, that has been well established as the neural basis for a range of spatial and executive attentional functions in typical adults (e.g. Corbetta & Shulman, 2002; Posner & Petersen, 1990), and which has also been shown to be involved when children engage in such tasks (e.g. Booth, Burman, Meyer, Lei, Trommer, Davenport, Li, Parrish, Gitelman, & Mesulam, 2003; Rueda, Fan, McCandliss, Halparin, Gruber, Lercari, & Posner, 2004). In the case of children, however, the structure and function of the network appears to show developmental changes (e.g. Bunge, Dudukovic, Thomason, Vaidya, & Gabrieli, 2002; Johnson, 2000)
To investigate this linkage, Simon and colleagues (Simon, Bearden, McDonald-McGinn, & Zackai, 2005) used a hierarchical set of tasks to test the hypothesis that visuospatial impairments in children with DS22q11.2 would be related to performance decrements in tasks that depended heavily on foundational competencies in spatial and object cognition. In a standard spatial orienting task (e.g. Posner, Walker, Friedrich, & Rafal, 1984) children were required to press a button to identify the location of a target stimulus that was either validly, neutrally or invalidly cued with a central arrow-like stimulus that pointed to one or both (in the case of the neutral condition) of the possible target locations. As predicted, children with DS22q11.2 performed much more poorly on the invalid trials than did controls, suggesting some degree of dysfunction in, what in typically developed adult and children is, the more parietally controlled component of the visual attention system. An “Enumeration” task was used to test the effect of impaired visual search on determining the number of items in a display. Counting has been shown, again primarily in adults, to depend heavily on visual search processes that activate the frontoparietal network, but subitizing, or enumeration of very small sets of items, does not (Piazza, Mechelli, Butterworth, & Price, 2002; Sathian, Simon, Peterson, Patel, Hoffman, & Grafton, 1999). As predicted, subitizing performance did not differ between the groups, while counting produced significantly poorer performance in children with DS22q11.2 than in controls. Also, a numerical “distance effect” task, in which children were required to judge whether a set of dots or an Arabic numerical had a value “greater than” or “less than” 5, was used. The stimuli consisted of the values “one”, “four”, “six” and “nine”. The distance effect is one where speed and accuracy decrease as the “numerical distance” between two comparison values is reduced. This phenomenon is thought to be a by-product of reduced discriminability of neighboring values arranged along a mental number line. In adults (e.g. Dehaene, Spelke, Pinel, Stanescu, & Tsivkin, 1999; Göbel, Walsh, & Rushworth, 2001; Pinel, Le Clec’H, van de Moortele, Naccache, Le Bihan, & Dehaene, 1999) and children (Temple & Posner, 1998), such tasks appear to be primarily dependent on posterior parietal regions with performance deteriorating as numerical distance decreases (e.g. comparing four to five rather than one to five). Again, as predicted, results indicated that children with DS22q11.2 did not perform as efficiently or as accurately as control children when making relative magnitude judgments.
Using a similar magnitude comparison task, Bachot and colleagues (Bachot, Gevers, Fias, & Roeyers, 2005) report converging evidence from children aged 7–12 years who met criteria for visuospatial disability (VSD) and showed a reduced “distance effect” than did typically developing controls. Also, the stimulus-response compatibility effect of faster “greater than” responses made with the right hand (in Western participants) and slower “greater than” responses when made with the left hand was only found in the control group. This result suggested that a different spatial format existed in the mental representation of numbers in the VSD group, an inference supported by the fact that results on this aspect of the test were most strongly related to the VSD group’s scores on standardized tests of visuospatial processing. The authors concluded that it was the children’s impairment in the spatial domain that best explained the lack of the typical numerical responses in the VSD group. Further evidence for relationships between visuospatial dysfunction and performance in the arithmetical domain comes from Mazzocco’s (Mazzocco, Singh Bhatia, & Lesniak-Karpiak, 2006) finding that girls with FXS and TS showed significant impairments in memory tasks that focus on spatial location (where) rather than object form (what) aspects of a grid-like display. While performance was high for all groups (at around 90% accuracy), girls with TS performed significantly more poorly than controls. For girls with FXS, the number of locations correctly recalled also correlated positively and significantly on scores from the Test of Early Math Ability (TEMA-2) while no similar correlations were found for any group for performance on the object form memory task.
In the current study, we compared the performance of children from two genetic disorder populations (DS22q11.2 and 45,X TS) to a similar group of typically developing (TD) controls. Both clinical groups scored significantly lower than did controls on standardized measures of visuospatial function; the Perceptual Organization (PO) subscale from the WISC III and the Perceptual Reasoning Index (PRI) of the WISC IV. Both clinical populations are known to exhibit numerical and mathematical impairments as well as those in the visuospatial domain. Yet, in many ways, these two disorders are significantly different from one another. They have different genetic etiologies, there is not a great deal of overlap in physical manifestations, and the global intellectual outcomes show significant differences. Specifically, most children with DS22q11.2 have Full Scale IQ (FSIQ) in the mid seventies, almost two standard deviations below the “normal” score of 100 and mild to moderate mental retardation is not uncommon (Campbell & Swillen, 2005; Moss, Batshaw, Solot, Gerdes, McDonald-McGinn, Driscoll, Emmanuel, Zackai, & Wang, 1999; Sobin, Kiley-Brabeck, Daniels, Khuri, Taylor, Blundell, Anyane-Yeboa, & Karayiorgou, 2005; Swillen, Devriendt, Legius, Prinzie, Vogels, Ghesquiere, & Fryns, 1999; Swillen, Vogels, Devriendt, & Fryns, 2000; Woodin, Wang, Aleman, McDonald-McGinn, Zackai, & Moss, 2001). In contrast, girls with TS, most of whom have 45,X TS, typically have FSIQ and Verbal IQ (VIQ) levels that are essentially “normal” (Ratcliffe, Butler, & Jones, 1991; Robinson, Bender, Linden, & Salbenblatt, 1990; Rovet, 1991; Stewart, Bailey, Netley, & Park, 1990) with mental retardation being rare. However, the two groups are similar in terms of the differential between their Verbal and Performance IQ (PIQ) scores. As in DS22q11.2, the PIQ scores of girls with 45,X TS tend to be significantly lower (Rovet, 1993; Temple CM, 1996), leading to the cognitive phenotype of both syndromes being labeled as consistent with Nonverbal Learning Disorders. Thus, although girls with 45,X TS function at a much higher level in general than children with DS22q11.2, both groups manifest particular weaknesses in visuospatial, visuomotor and numerical competencies.
We reasoned that, in the experiments that follow, a finding of different performance, in line with the between-group discrepancies in IQ subscores, would suggest that global intellectual competence determines the outcome observed in numerical cognition. However, if the two genetic disorders groups appear to be impaired to a similar extent on these tasks then it would seem reasonable to conclude that the basic cognitive processes required for the development of numerical competence are the source of the problem and that these may be considered a form of endophenotype of numerical disability. As such, these “foundational” abilities would make a better target for investigation into biological and cognitive basis for the impairment. However, such an investigation is not part of the research reported here. Therefore, the current study was designed to investigate whether children with DS22q11.2 and 45,X TS share a common cognitive phenotype in terms of performance on two tasks considered to be developmental precursors to formal arithmetical ability: enumeration and magnitude comparison. We also explored the possibility that a global difference in a performance characteristic, such as psychomotor speed, rather than intellectual level could account for performance differences between the control and clinical groups. This is especially true given that our major dependent variable is based partly on reaction times. Thus a third experiment to address this was carried out.
Method
Participants
Data from one hundred and one 7- to 14-year-old children were included in the present investigation after excluding participants who performed at chance in at least one condition1: 28 TD (10 female, 18 male), 58 DS22q11.2 (37 female, 21 male), 15 45,X TS (15 female). Mean age in the TD group was 10 years, 5 months (SD = 2 years, 4 months), DS22q11.2 group 10 years, 6 months (SD = 2 years, 4 months), TS group 10 years, 5 months (SD = 2 years, 4 months). There were no significant differences in age between the three groups (p>.73). All children with DS22q11.2 were included based on positive findings on the standard Fluorescence in situ Hybridization (FISH) test and Full Scale IQ above 55. All girls with Turner syndrome were confirmed to have 45,X status by karyotype analysis, i.e. only those with one missing X chromosome were enrolled and those with mosaic expression were not. To match these girls to those from another population (full mutation Fragile X) in the larger study in which they were enrolled, they were included if their VCI score on WSIC IV was ≥ 75 and their arithmetic score on the Wide Range Achievement Test was below the 25th percentile. For the analyses presented here, two girls (scores of FSIQ 58, PRI 59 and FSIQ 59, PRI 67) were included because of overlap with the range of children with DS22q11.2. All were prepubertal and none was receiving any estrogen treatment. Children with DS22q11.2 were recruited from outpatient visits to the Children’s Hospital of Philadelphia “22q & You” center who were willing to participate, and subsequently run at the M.I.N.D. Institute at the University of California, Davis. Girls with 45,X TS were recruited in a similar fashion to the initial DS22q11.2 group, from the Endocrinology Clinic run by JLR at Thomas Jefferson University in Philadelphia. For all participants, parental consent and child assent was given in accord with the requirements of the Institutional Review Board of the Children’s Hospital of Philadelphia or of the University of California, Davis.
The Distance Effect task included data from 63 children (17 TD, 31 DS22q11.2, and 15 45,X TS. The Enumeration task included data from 64 participants (19 TD, 34 DS22q11.2, and 11 45,X TS). Out of the children included: 8 TD, 7 DS22q11.2, and 11 TS contributed data to analyses of both Enumeration and Distance Effect. A subset of 30 children also completed a Reaction Time Task (6 TD, 17 DS22q11.2 and 7 TS). The number of children who completed all three tasks was 5 DS22q11.2 and 5 45,X TS and 0 TD. Sample sizes were small or uneven because data included in these analyses were combined from children recruited into two independently funded studies that were initiated and carried out separate 5-year periods with only some overlap. Not all children participated in every task because some tasks were introduced into the different studies’ research protocols at different times as required by the aims of the research, i.e. after the testing of earlier participants had been completed. By the same token, each study required different inclusion criteria to ensure enrollment of children who were typical of the different disorder populations. Therefore, matching could not be done on anything other than average age. Data on IQ (from WASI, or WISC III/IV) were available for 15 TD participants, 43 DS22q11.2, and 14 45,X TS. Range of Full Scale IQ (FSIQ) for TDs was 94–132, for DS22q11.2 it was 52–103, and for 45,X TS the range was 58–101.
These results show that the three samples of children that we recruited were, in general, typical of the larger populations from which they were drawn. The lowest performing, in terms of global measures of intellectual functioning, was the DS22q11.2 group, with mean (SD) FSIQ, PRI/PO and VCI/VC respectively of 76.63 (11.56), 77.74 (13.00), 81.44 (11.67). Girls with 45, X TS showed significantly higher function on two of the three scores (PRI = 88.43 (13.66) and VCI = 95.14 (10.71) ps<.05, while FSIQ was marginally higher at 84.07 (13.33). In fact, this sample was slightly skewed by two rather low-functioning girls with 45,X TS who did not meet any exclusion criteria. Without the scores of these two participants, FSIQ (M=88.33, SD=8.45), PRI (M=92.67, SD=8.99) and VCI (M=97.67, SD=8.05) are all significantly higher for 45,X TS than for DS22q11.2, ps<.05. Finally, as expected, the typically developing controls had the highest level of global intellectual function with mean FSIQ, PRI/PO and VCI/VC scores respectively of 110.07 (12.61), 107.13 (12.98), and 113.53 (15.18), ps <.01. The patterns of IQ differences were the same when we analyzed the IQ scores separately for each task i.e., it was not the case that the cognitive tasks contained different subsets of the children based on IQ. Interestingly, despite global intellectual differences, processing speed scores did not differ between children with 45,X TS (mean = 74.85, sd = 11.63) and those with DS22q11.2 (mean = 82.55, sd = 13.19), Cohen’s d′ = .61. This suggests a particular weakness in speeded processing task for girls with 45,X TS, a result that has been documented elsewhere (Ross, Roeltgen, Feuillan, Kushner, & Cutler, 1998). However, the most relevant result for the current studies is that all three groups differed significantly on their PO/PRI score, which is the measure of intellectual function most directly related to the experiments we conducted. One-way ANOVAs with group as a between subjects factor were computed on FSIQ, PRI/PO, VCI/VC and processing speed: FSIQ: F(2, 69) = 42.34, p<.001, PRI/PO F(2,61) = 26.35, p<.001, VCI/VC F(2,62) = 36.29, p<.001, Processing Speed F(2,63) = 10.23, p<.001. Due to limitations in the testing environment in the early phases of this research, IQ subscales for 8 children with DS22q11.2 were not made available. However, there was no effect on the pattern of the group differences whether we compared the groups using PRI and the reduced set of PO scores or whether we used PRI and the full set of PIQ scores.
Experiment 1 – Enumeration of Visually Presented Objects
Design and Procedure
The Enumeration task required each child to sit in front of a computer screen and to say into a microphone, as quickly as possible, the number of objects seen on the screen. Target stimuli consisted of 1 to 8 bright green bars, measuring 0.25° × 0.14° on a red background square of side 2° visual angle when viewed from a distance of 60cm. Targets were presented until the child responded. For each numerosity, 20 different stimuli were used (in which the requisite number of targets was placed randomly within an invisible 8 × 8 grid). The experiment began with instructions followed by 16 practice trials (2 for each numerosity). Trials were made up of 20 blocks each with 8 trials (for numerosities 1–8) randomly distributed within them for a total of 160 trials. A rest period was provided after every 4 blocks. Example stimuli are presented in Fig. 1.
Figure 1.
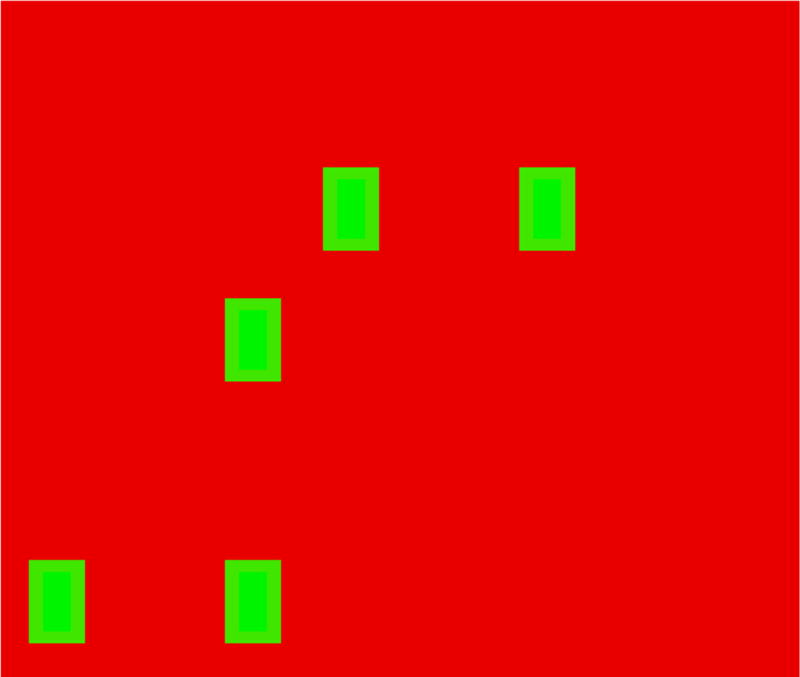
Example stimulus for the Enumeration Task.
Predictions for this experiment based on the “global intelligence” hypothesis (HG) were that performance in the counting range of the enumeration task, which appears to depend most heavily on abilities that are measured by the PO or PRI scales of WISC III and IV (e.g. Sathian et al., 1999), would differ in line with the scores on that measure produced by each group. Thus, the best counting performance would be seen in typically developing controls. Girls with 45,X TS would perform significantly worse than the controls while the performance of children with DS22q11.2 would be significantly worse than those with 45, X TS. Performance on the subitizing component of the task, which is typically not on visuospatial cognition, would not be expected to differ in either the TS or DS22q11.2 groups, compared to the controls. We would have to reject HG if group differences did not match those described earlier in terms of IQ subscales. Instead we would have to accept the “cognitive process” hypothesis (HC), that similarities between any groups were based on the deployment of a similar set of cognitive processes and their attendant impairments.
Results
Trials with reaction times over 2.5 standard deviations above the condition mean for that participant were excluded from the analyses. This is the standard we have applied in our other analyses with the same or related tasks (Bish, Chiodo, Mattei, & Simon, in press; Bish, Ferrante, McDonald-McGinn, Zackai, & Simon, 2005; Simon, Bearden, McDonald-McGinn, & Zackai, 2005). Trials with reaction time less than 550 ms for verbal responses were classified as anticipatory response and excluded from the subsequent analyses. After excluding trials with outlier responses, reaction times were averaged for each trial condition. Reaction times (RT) were adjusted to reflect both speed and accuracy of performance by combining the RT and error rates using the formula RT/(1-%error). Using this adjustment, RT remains unchanged with 100% accuracy and is increased in proportion with the number of errors. This adjustment is typically used in RT experiments when it is desirable to equate groups such as is the case when controlling for any speed/accuracy tradeoffs (e.g. Akhtar & Enns, 1989) or when examining the performance of children with developmental disorders who are hypothesized to make errors on the tasks selected since excluding all trials with errors would likely skew the performance of such children away from a representative characterization of their performance (e.g. Bish, Ferrante, McDonald-McGinn, Zackai, & Simon, 2005).
Because distributions of adjusted reaction times were extremely skewed, we identified outliers for each group using +/− 1.5 times interquartile range from upper and lower quartiles as cut-offs, then outliers were truncated to the highest or lowest values from the remaining distributions for each condition. Degrees of freedom were adjusted using the Welch procedure for t tests and one-way ANOVAs and Dunnett’s T3 test was used for post-hoc comparisons when the equality of variance assumption was violated. For repeated measures ANOVAs, Greenhouse-Geisser corrections were used to correct for violations of the sphericity assumption.
Adjusted reaction times from the Enumeration task were analyzed using a 3 × 8 (Group × Number of Items) analysis of variance (ANOVA). In all groups, reaction times increased as more items were presented, see Fig. 2. However, this increase was greater in DS22q11.2 and TS groups, F(14, 427)=6.19, p<.001. Subitizing ranges for each group were estimated using a long-established method (e.g. Chi & Klahr, 1975). This involves conducting one-way ANOVAs within each group with 1- to 3-item conditions and 1- to 4-item conditions until the quadratic trend yielded significance. For the TD and DS22q11.2 groups, significant quadratic trends emerged with 1 to 3 items, indicating a subitizing range of 2 items, F(1, 18)=6.92, p<.05 and F(1, 33)=21.56, p<.001 respectively. For the 45,X TS group, the quadratic trend became significant with 1–4 items, indicating a subitizing range for 3 items, F(1, 10)=21.49, p<.01.
Figure 2.

Mean reaction time (+/−1SEM) for control, DS22q11.2 and 45,X TS groups for each numerosity in the Enumeration Task.
To characterize performance in subitizing and counting ranges for each group, corresponding slopes of Adjusted Reaction Time × Number of Items were computed for each group using a method proposed by Lorch and Meyers (1990). In short, average adjusted reaction times were calculated for each subject for each condition. Separate regression equations were computed for each subject using condition as the predictor variable. The constants and slopes for the group regression equation were calculated from averages of coefficients derived from the individual analyses. To compute slopes for the subitizing range, numbers of items 1 and 2 were used for the TD and DS22q11.2 groups and items 1 to 3 were used for the 45,X TS group. For the counting range, numbers of items 3 to 8 were used for the TD and DS22q11.2 groups, and items 4 to 8 were used for the 45,X TS group.
For typically developing children, average error rates were 0.27% (median 0%, range 0 – 2.63%) for the subitizing range and 3.30% (median 3.46%, range 0.93–7.16%) for the counting range. Regression equations for subitizing and counting ranges revealed significant slopes for each enumeration mode, t(18)=4.18, p<.01 and t(18)=12.23, p<.001 respectively). The average slope for TD children in the subitizing range was 74.89ms/item (intercept = 749.47ms) and their counting slope was 530.05ms/item (intercept = −577.89ms). For children with DS22q11.2, average error rates were 0.80% (median 0%, range 0 – 6.12%) for the subitizing range and 7.08% (median 4.76%, range 0 – 31.80%) for the counting range. Regression equations for subitizing and counting ranges revealed significant increases in slope for each enumeration mode, t(33) =4.51, p<.001 and t(33)=13.41, p<.001. The average slope for children with DS22q11.2 in the subitizing range was 74.59ms/item (intercept = 832.82ms) and their counting slope was 739.62ms/item (intercept = −843.26ms). For children with 45,X TS, average error rates were 0.003% (median 0%, range 0 – 0.04%) for the subitizing range and 0.029% (median 0.01%, range 0–0.08%) for the counting range. Regression equations for subitizing and counting ranges revealed significant slopes for each enumeration mode, t(10)=3.85, p<.01 and t(10)=7.93, p<.001. The average slope for children with 45,X TS in the subitizing range was 160.82ms/item (intercept = 823.0ms) and their counting slope was 766.64ms/item (intercept = −1016.27ms). In order to test for the relationship between global intelligence measures and performance on this task, correlations between PO/PRI scores and slopes for blocks and numbers were carried out. There were no significant associations between PO/PRI and task performance when all children’s data were combined (Pearson’s r = 0.13 for subitizing slope, −0.25 for counting slope, ps >.09). We also analyzed the relationship by group, though this reduced the sample size for each test. The only significant correlation was a negative relationship between PRI/PO and subitizing slope for children with DS22q11.2 (r = 0.52, p<.01). However, no relationships at all were found between the PRI/PO measure and the attentionally demanding task of counting predicted by HG.
Direct comparison of groups
Slopes were compared between the groups using a repeated measures Group × Range (subitizing or counting) ANOVA, which yielded a significant Group × Range interaction, F(2, 61)=4.23, p<.05. The 45,X TS group had significantly larger slopes in the subitizing range than the other two groups, Dunnett T3, p’s <.01. This is not due to the inclusion of an extra number (N=3) in their range because the slopes computed using items 1 and 2 are quite similar to those computed with items 1 through 3 (160.76 vs.179.43 ms/item). In the counting range, the DS22q11.2 group had significantly larger slopes than the TD group, Dunnett T3, p<.01. The counting range slope for the 45,X TS group did not differ statistically from either that of the controls or the DS22q11.2 groups, Dunnett T3, p=.121 and p=.992, Cohen’s d′ of 1.06 and 0.16 respectively for 45,X TS vs. TD and 45,X TS vs DS22q11.2 groups. However, it is clearly evident from Fig. 2 that the counting performance in the DS22q11.2 and 45,X TS groups is essentially identical for the numerosities of 4 through 8 and the lack of statistical significance is probably due to variability within the 45,X TS sample.
Error rates were analyzed using non-parametric tests since the distributions were not normal. Kruskal-Wallis test was used to compare error rates across groups, and error rates in the counting range were statistically different, χ(2)=24.39, p<.001, but not in the subitizing range χ(2)=1.589, p=.459. Pairwise Mann-Whitney tests showed that the 45,X TS group had significantly lower error rates than the other two groups, Z=4.5, p<.001 for TD vs. 45,X TS, and Z=4.42, p<.001 for DS22q11.2 vs. 45,X TS.
Discussion
Predictions based on the “global intelligence” hypothesis HG in this experiment were that the groups would differ significantly in the counting component of the enumeration task but not in the subitizing component. This is because the former appears to depend on visuospatial attentional processes and the frontoparietal attention network while the latter does not. Since all three groups differed significantly in the most relevant IQ subscale (PO/PRI), predictions based on global scores would be that the TD group would perform significantly better on the counting component of the task than girls with Turner syndrome who, in turn, would perform significantly better than children with chromosome 22q11.2 deletions. Results showed that hypothesis HG was not supported and the lack of any correlation between PO/PRI scores and counting performance adds weight to the view that general nonverbal intelligence levels did not determine numerical task performance. Thus HG was rejected in favor of hypothesis HC. We suggested that the cognitive processes that underlie subitizing are not ones that we hypothesized to differ between the groups and here we found that the performance of children with DS22q11.2 and controls did not differ. This remained the same when we included common subitizing range of 1–2 items only in the analysis. Girls with 45,X TS did produce significantly greater slopes, possibly due to their tendency to trade off speed for accuracy. In contrast, cognitive processes required for counting were expected to produce a similar degree of impairment compared to the TD group. Here children with DS22q11.2 and controls did differ significantly. Furthermore, although no other significant differences were found, which in itself is a finding that contradicts the predictions of HG, Fig. 2 shows that performance in the counting range for girls with 45,X TS was essentially identical to that of children with DS22q11.2 although they could not be distinguished statistically from the controls despite an effect size of greater than one standard deviation. This suggests that future replications should be carried out with samples larger in size than the one reported here. However, even though their study of 12 individuals with Turner syndrome was of 18- to 40-year-old adults with much more experience in the numerical domain, Bruandet and colleagues (Bruandet, Molko, Cohen, & Dehaene, 2004) reported essentially the same results on a very similar task.
In this task we did find one difference between the DS22q11.2 and 45,X TS groups in the form of a steeper subitizing slope in the latter than in the former (and also than in the TD control group). The standard statistical method for determining the extent of the subitizing range also indicated that the 45,X TS group subitized three items compared to two each in the DS22q11.2 and TD groups. Visual inspection of Figure 2 appears to indicate similar subitizing ranges for the TD and 45,X TS groups but with a steeper slope in the former than the latter. The DS22q11.2 group appears to have a smaller subitizing range but with similar profile to the TD group. However, we chose not to adopt an arbitrary visual inspection criterion for separating the different enumeration modes since the statistical method we adopted has long been used as the standard. These subitizing slope differences, if real, might indicate that some other process with a stronger serial component than classical subitizing was taking place, at least in the 45,X TS group. If so, the potential contribution of attentional impairments to such unspecified processes is far from clear. However, even given that a real difference did exist within the subitizing range, this does not affect the primary hypothesis being evaluated since that is focused on counting, which is a form of numerical processing that has clearly been shown to depend upon visuospatial attention.
Our hypothesis that visuospatial attention processing impairments in children with DS22q11.2 and 45,X TS would lead to difficulty in accurately and efficiently counting sets of 4 or more dots was generally supported by the results. Thus, despite large differences in the overall functioning of children with 45,X TS versus those with DS22q11.2, we have identified a component of each group’s cognitive phenotype where they apparently function in a very similar fashion. This is consistent with the position that there is a set of shared impairments in visuospatial attentional and object processing functions that they draw upon in the service of counting visually presented stimuli. Our next question was whether these same spatial cognition impairments would produce a common performance profile in a different task that depends upon more conceptual representations of numbers; that of magnitude comparison. This task, in contrast to enumeration performance, is not primarily dependent on explicitly visual attentional processes to navigate a display of objects. Instead, as demonstrated in studies with typically developing adults, it requires the participant to process mental representations in which are quantities arranged along a “mental number line” and where relative magnitude is depicted in terms of spatial contiguity and other relationships. It has been proposed, by Dehaene and colleagues (Dehaene, Piazza, Pinel, & Cohen, 2003) that attentional processes like those used in the enumeration task are required by typical adults to navigate this representation and this is why a region of posterior superior parietal cortex is necessary for this kind of processing. Thus the distance effect task could still be expected to produce a similar profile of performance in children with 45,X TS and DS22q11.2 if hypothesis HC is correct because it taps into some of the very same spatial and attentional processes that we assume created the pattern seen when the children were engaged in counting. However, if global ability rather than specific processes were to account mainly for differences in performance then all groups should differ significantly, as would be predicted by hypothesis HG.
Experiment 2 – Magnitude Comparison (Distance Effect)
Design and Procedure
The Distance Effect task was adapted from a similar task developed by Ansari and colleagues (Ansari & Karmiloff-Smith, 2002) for a study of children with Williams syndrome. On each trial the child’s task was to indicate, by pressing one of two buttons, which was the larger of either two blue bars 2 cm wide and varying in height between 1 and 12 cm (in 1cm increments) or two numbers. The numbers ranged from 1 to 12 and were created from blue Arabic numerals. Each single or double-digit number was in Helvetica font, 5cm high and between 4.5 and 7 cm in width. The center of each of the pair of bars was displaced 3cm horizontally from the center of the previously presented fixation and was vertically centered at the same point. Numbers, also vertically centered on the same point, were presented at a distance where the center of the single or double-digit number is displaced between 2.5 and 3 cm from a central vertical line 4.5 cm tall that separated the numbers. Stimuli were presented until the child responded or until 7 seconds had elapsed. There were 120 trials in the experiment. These were separated into two blocks of trials (60 block trials and 60 number trials) divided by a short break.
The 60 trials were made up of ten pairs of stimuli with differences of 1, 2, 3, 5, 6 and 7 (either in terms of length in cm or numerical value). To reduce the overall number of trials needed, no differences of 4 were included in the experiment. We reasoned that since differences of 4 were in the center of our range of they would not contribute much to our understanding of how either small or large differences affected performance on magnitude comparison. Example stimuli are presented in Fig. 3. Two versions of the experiment were created and counterbalanced to control the order of which type of stimuli came first. There was no statistical difference in reaction time obtained by the two versions so the data were collapsed for the subsequent analyses.
Figure 3.
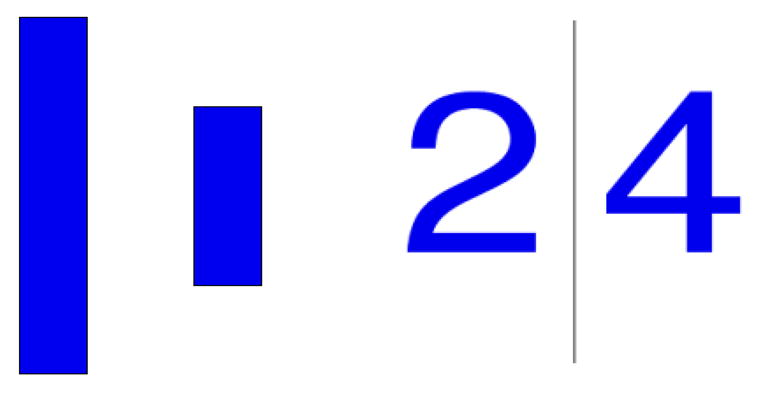
Example stimulus for the Distance Effect Task for both blocks and digits conditions.
As with the enumeration task, predictions for this experiment were based on the “global intelligence” hypothesis (HG) that performance in the small numerical distance range of the task, which appears to depend most heavily on spatial and numerically relevant abilities that are measured by PRI/PO, would differ in line with the scores on those measures produced by each group. This is because the task difficulty is greatest in this task when numerical distance is smallest and thus draw most heavily on spatial and numerical competence. Thus, the best performance would be seen in typically developing controls. Girls with 45,X TS would be expected to perform significantly more poorly than the controls while the performance of children with DS22q11.2 would be significantly worse than those with 45, X TS. Therefore, we would have to reject HG if any of the groups produced a pattern of performance, particularly in the small distance range that was not significantly different from any other group. Instead we would have to accept the “cognitive process” hypothesis (HC), that similarities between groups were based on a similar set of cognitive processes or impairments in those processes.
Results
As in the Enumeration task, participants were excluded from the present report if they performed at chance in at least one condition. Trials with reaction times over 2.5 standard deviations above the condition mean for that participant were excluded from the analyses. Trials with reaction time less than 150 ms for manual responses were classified as anticipatory response and excluded from the subsequent analyses. After excluding trials with outlier responses, reaction times were averaged for each trial condition. Reaction times (RT) were adjusted as in Experiment 1. Outliers were defined for each group using +/− 1.5 times interquartile range from upper and lower quartiles as cut-offs, then outliers were truncated to the highest or lowest values from the remaining distributions for each condition. Degrees of freedom were adjusted using the Welch procedure for t tests and one-way ANOVAs and Dunnett’s T3 test was used for post-hoc comparisons when the equality of variance assumption was violated. For repeated measures ANOVAs, Greenhouse-Geisser corrections were used to correct for violations of the sphericity assumption.
In order to determine the range in which a reliable “distance effect” was observed, pairwise comparisons were computed across groups. There was no significant decrease in reaction time after a distance of 5; thus, we limited our analyses to this range for between group comparisons. Similar to the approach in the Enumeration task, data from the Distance Effect task were analyzed using a regression method appropriate for repeated measures data (Lorch & Meyers, 1990). Results for each group are presented below followed by comparisons between groups; mean adjusted reaction times are shown in Fig. 4 for both block and digit conditions.
Figure 4.


Mean reaction time (+/−1SEM) for control, DS22q11.2 and 45,X TS groups on Enumeration Task both the blocks (A) and digits conditions (B).
Typically developing controls produced average error rates of 1.29% with a maximum of 5.19% in the blocks condition and 3.46% with a maximum of 10.00% in the digits condition. Regression analyses showed that numerical distance contributed significantly between distances 1 through 5 for both the blocks and numbers conditions (t(16) = −6.03 and −4.90, p<.001 respectively). The slopes produced by variations in numerical distance in this range were 45.43ms/distance (intercept = 787.39ms) for blocks and 30.88ms/distance (intercept = 877.39ms) for numbers.
Children with DS2q11.2 produced average error rates of 2.35% with a maximum of 16.67% in the blocks condition and 5.08% with a maximum of 18.52%. Regression analyses showed that numerical distance contributed significantly between distances 1 through 5 for both the blocks and numbers conditions, t(30) = –-8.05 and –-6.28, p<.001 respectively). The slopes produced by variations in numerical distance in this rage were 97.86ms/distance (intercept = 1162.12ms) for blocks and 100.29ms/distance (intercept = 1405.43ms) for numbers.
Children with 45,X TS produced average error rates of 1.47% with a maximum of 8.52%, in the blocks condition and 3.56% with a maximum of 10.19%. Regression analyses showed that numerical distance contributed significantly between distances 1 through 5 for both the blocks and numbers conditions (t(14) = −10.44 and −5.53, p<.001 respectively). The slopes produced by variations in numerical distance in this rage were 94.40ms/distance (intercept = 1111.66ms) for blocks and 72.07ms/distance (intercept = 1252.36ms) for numbers. There was no significant differences between slopes for block and number conditions, t(60) = −.91, p=.37. In order to test for the relationship between global intelligence measures and performance on this task, correlations between PO/PRI scores and slopes for blocks and numbers were carried out. There were no significant associations between PO/PRI and task performance for all children combined (Pearson’s r = 0.20 for blocks slope 1–5, 0.15 for numbers slope 1–5, ps >.23). We also analyzed the relationship by group and condition (blocks and numbers), though this reduced the sample size for each test. No correlations reached significance (all ps >.18).
Direct comparison of groups
There were no differences in the error rates between the three groups for block and number conditions F(2, 60) = .71 & 1.21 respectively, ps>.31 Cohens d′ for blocks and numbers conditions: TD vs DS22q11.2 = −.30, −.38, TD vs. 45,X TS = −.08, −.03, DS22q11.2 vs 45,X TS = .24, .35. There was a group difference in average reaction time for distances 1 through 7, F(2,60) = 5.23, 4.69 respectively, ps<.01. Reaction time of the TD group was significantly faster than that of the DS22q11.2 group (p<.01), and marginally faster than that of the 45,X TS group, (p=.06), Cohens d′ for blocks and numbers conditions: Control vs DS22q11.2 = −.95, −.95, Control vs. 45,X TS = −.89, −.85, DS22q11.2 vs TS = .22, .15. In order to determine if the groups differed from each other with regard to the Distance Effect for distances 1 to 5, a repeated measures ANOVA was calculated on the slopes for both the block and digit conditions. Results indicated that slopes were significantly smaller in the control group than either the DS22q11.2 or 45X, TS groups, F(2,60) = 8.12, p=.001. As illustrated in Fig. 4A, slopes for both the DS22q11.2 (97.86ms/distance) and 45,X TS (94.40ms/distance) groups were steeper than those of the TD group (45.43ms/distance) in the block condition. As illustrated in Fig. 4B, slopes for both the DS22q11.2 (100.29ms/distance) and 45,X TS (72.07ms/distance) groups were steeper than those of the TD group (30.88ms/distance) in the digits condition. These results were consistent when slopes were calculated on distances 1 through 7 as well. Group membership significantly contributed to slope values for the Distance Effect in the block condition, t(61) = −2.62, p =.01, and marginally in the digit condition, t(61) = −1.72, p = .09 with the no differences between the slopes for children with DS22q11.2 and those with 45,X TS (Cohens d′ = −.06 for blocks, and −.36 digits respectively or −.28 for the average slope) but a significant difference between those and the slopes generated by controls. There were no significant differences between the blocks and numbers conditions for any of the groups for all participants combined t(62) = −.91, p =.37, Cohen’s d′ = .23. The same results were found when each group was analyzed separately: TD − t(16) = −1.66, p =.12, Cohen’s d′ = .83; DS22q11.2 − t(30) = .155, p = .88, Cohen’s d′ = .06; 45, X TS − t(14) = −1.46, p = .17, Cohen’s d′ = .78.
Discussion
The “global intelligence” hypothesis HG in this experiment was of significant group differences in distance effect task, especially in the part of the task where numerical distance between two values is small, because of the dependence of spatial, attentional and numerical process. Since all three groups differed significantly on the most relevant IQ scores of PRI/PO, predictions based on global scores alone would be that the TD group would perform significantly better here than girls with Turner syndrome who, in turn, would perform significantly better than children with chromosome 22q11.2 deletions in the range of differences of 1 to 5. Results did not conform to the predictions of hypothesis HG and so we rejected it in favor of hypothesis HC. Furthermore, the lack of any correlation between PO/PRI scores and task performance adds weight to the view that general nonverbal intelligence levels did not determine task performance. Our hypothesis, that visuospatial attention processing impairments in children with DS22q11.2 and 45,X TS would lead to difficulty in distinguishing quantities where the difference between the values of the two stimuli was small, m was supported by the results. All three groups produced an almost identical performance profile when numerical distance was large (5 or more), although response times differed. In the blocks condition, which most directly depended on visuospatial attention and spatial relational representations and processes, the slopes produced by the children with either 45,X TS or DS22q11.2 were almost identical to one another and both were significantly greater than the slope produced by TD children. This means that performance for those two groups did not reach plateau until the numerical distance was much greater than was the case for TD controls. In the numbers condition, which required higher order conceptual and symbolic knowledge, children with 45,X TS showed a slight advantage over children with DS22q11.2 but still could not match the performance of the controls. Again, despite large differences in the overall functioning of children with 45,X TS those with DS22q11.2 we have identified a component of their cognitive phenotype where they apparently function in an almost identical manner. Again, we claim that this is consistent with the position that they shared a set of impairments in visuospatial attentional and numerical processing functions upon which they draw in the service of comparing mentally represented magnitudes.
Thus, Experiments 1 and 2 appear to have provided evidence in favor of the cognitive processing hypotheses rather than the global intelligence hypotheses. In other words, our results are consistent with the hypothesis that children with 45,X TS and those with DS22q11.2 share a common set of impairments in the specific attentional and numerical cognitive processes that we assume are required to carry out the tasks we presented to them. Under conditions that rely heavily on those specific processes, both groups performed in a similar and poorer level than the typically developing controls, despite the differing from each other in the most relevant domain of global intellectual function. However, our results do not (unquestionably) disprove the possibility that some global impairment in cognitive processing determined the similar performance problems in those two groups but not the controls.
One obvious remaining candidate for the source of these group differences is global processing speed because the two groups with developmental disorders scored at a similar level on the processing speed subscale of the WISC III and IV and both populations’ scores were significantly lower than those of TD controls. Perhaps then, the slower speed of these two groups interacted with difficulty within the tasks presented and created the profiles seen in Experiments 1 and 2. This possibility is somewhat less likely to be the correct interpretation when one examines the reaction times to sets of one or two objects on the enumeration task where it is evident that reaction times are almost identical for all three groups. However, those are the easiest of all the conditions we created and so the processing speed by difficulty interaction account could still consistent with the results.
However, because the processing speed subscale generated by the WISC derives from a composite of the scores on the “coding” and “symbol search” tests it is not a very good measure of response time. While these are indeed timed tasks, several higher level cognitive processes are required such as selecting items to process, keeping track of progress, using rules etc. So in Experiment 3 we presented children with a simple motor reaction time task to generate a pure measure of time taken to complete a manual button press response to a visually presented stimulus. If there were significant differences between the three groups as might be predicted by the response time profiles in almost all conditions of the tasks described above, then the hypothesis based on a global difference (HG), in this case processing speed, would be supported. However, if no differences were detected then that hypothesis would have to be rejected and a cognitive processing hypothesis HC would have to be accepted. This would be consistent with our hypothesis that specific cognitive processes required for the tasks presented in Experiments 1 and 2 were equally impaired in the 45,X TS and DS22q11.2 groups and that speed of cognitive processing was not the appropriate way to account for the observed differences.
Experiment 3 – Motor Reaction Time
Design and Procedure
The Reaction Time task was designed to assess each individual’s motor reaction time when cognitive demands were minimized. The stimuli included a drawing of a house that was 19 cm in height and 7.9 cm wide with an entrance that was 5.4 cm high and 3.2 cm wide on the monitor. On each trial the child’s task was to indicate, by pressing a single button as quickly as possible, when a picture of a friendly alien appeared at the right or left side of the entrance. The alien figure was 5.4 cm tall and 1.8 cm in the widest extend. This image remained on the screen until the button was pressed. To ensure understanding of the task, instructions were followed by demonstration and 6 practice trials. The child then completed 1 block consisting of 60 trials. Delays between trials were set to one of 3 intervals (400, 800 or 1200 milliseconds, which were presented in a random order to minimize anticipatory responses. Results of the task were calculated as the average of reaction times across all trials and all delays.
Results
Trials with reaction times over 2.5 standard deviations above the condition mean for that participant were excluded from the analyses. Trials with reaction time less than 150 ms were classified as anticipatory response and excluded from the subsequent analyses. After excluding trials with outlier responses for each delay condition, reaction times were averaged across trial conditions. Mean reaction times (and standard deviations) were as follows: TD group = 379.06ms (48.46), DS22q11.2 group = 438.82ms (147.25), 45,X TS group = 446.49ms (164.06). There were no significant differences in reaction time between the 3 groups, F(2,27) = .49, p = .62. Power of this analysis was estimated to be approximately 12% with small Cohen’s d′ values for each group contrast: 0.46 for TD vs. 22q11.2, 0.54 for TD vs. 45,X TS, and 0.05 for DS22q11.2 and 45,X TS, which confirms that the means for the different groups were generally similar.
Discussion
The prediction from the “global processing speed” hypothesis HG in this experiment, based on the processing speed index from the WISC III/IV scores, was of no group differences reaction time between the 45,X TS and DS22q11.2 groups with both of them being significantly slower than the typically developing controls. Results were not consistent with this prediction since no significant group differences were detected in reaction times. This suggests that differences detected in Experiments 1 and 2 were not the result of a global difference in psychomotor speed. Differences in this major component of response time could have interacted with difficulty within the conditions of those experiments to produce the performance profiles observed if speed alone was a significant determinant of performance. However, since processing speed index measures were slower in the DS22q11.2 and 45,X TS groups than TD controls but simple reaction measures were not, this is consistent with the Hc hypothesis that impairments in specific cognitive processes required by the tasks in the DS22q11.2 and 45,X TS groups and not in a global speed measure explain why their performance was slower in Experiments 1 and 2.
General Discussion
In the three experiments reported in this paper we found a consistent pattern of results that supports the view that children with 45,X Turner syndrome and those with chromosome 22q11.2 deletion syndrome suffer from a common pattern of impairments in visuospatial attention, spatial relationships and simple numerical cognitive processes. Despite significant differences in global intellectual functioning between the three groups, especially in the most relevant domain of nonverbal function as measured by PO & PRI subscales of the WISC III and IV respectively, children with 45X,TS and DS22q11.2 produced very similar performance profiles in the conditions of two numerical processing tasks that are believed to depend most heavily on visuospatial and approximate numerical processing functions that are typically supported by the frontoparietal attention network. Despite similar scores on the WISC III and IV scale of processing speed in the 45X,TS and DS22q11.2 groups, Experiment 3 indicated that overall rate of processing, at least as measured by a simple manual motor reaction time task, does not explain the overlapping performance profiles of the two developmental disability groups.
Thus we believe that our experiments have demonstrated that a sample of participants that can be objectively divided into three distinct subpopulations based on global intelligence scores, actually contained only two distinct subgroups when they were compared in terms of cognitive processing performance on two numerical cognition tasks. One is a group of typically developing children. The other is a group of children with one or other of two genetically distinct syndromes who appear to be almost indistinguishable in terms of what might be termed a cognitive subphenotype of attentionally based numerical processing. Global intellectual differences between the two developmental disorder groups did not account for the overlapping performance patterns seen, nor did the global processing speed similarity. Neither did we find any relationship between measures of general nonverbal intelligence (PO/PRI) and performance on either attentionally demanding numerical task. Instead, results were consistent with predictions based on the hypothesis that a common set impairments in a set of lower level visuospatial cognitive functions would produce similar performance in the two developmental disability groups were supported. This hypothesis is based on Simon’s (Simon, 1997) suggestion that these form the foundation for the construction of a range of higher-level domain specific competencies in attentional, spatial and numerical cognition. In this view, processing problems at that lower level will cascade into impairments in a range of higher-level competencies that typically depend on those component processes. The results generated here are at least consistent with the view that this holds, at least as far as the basic numerical domains of simple magnitude comparison and enumeration are concerned.
However, as we stated earlier, our results do not unquestionably disprove the possibility that some global impairment in cognitive processing, or even a different set of specific cognitive processes, determined the similar performance problems in those two groups but not the controls. Moreover, our “cognitive process” hypothesis has the disadvantage of predicting a null result and such an outcome could, of course, be due to any of a large set of different factors that were not directly tested here. Nevertheless, our results are demonstrably not consistent with the predictions made by the “global intelligence” hypothesis since significant differences were found for the perceptual organization and perceptual reasoning subscales of WISC III and WISC IV that most directly index the aspects of cognitive functioning most relevant to our investigations and for the verbal domain, along with marginal global differences between the DS22q11.2 and 45,X TS groups. Furthermore, while we did not directly study more basic visuospatial functions in the current experiments, we do have (as yet unpublished) data relevant to this issue. For the “cognitive process” hypothesis to be supported it should be true that children with DS22q11.2 and 45,X TS also do not differ on tests of basic visuospatial function. To date, we have found almost identical performance on a spatial attention task completed by children with 45,X TS and others with DS2211.2, many of whom participated in the experiments reported here. Even bearing in mind the notion of “equifinality”, which is the idea that “a diversity of pathways, including chance events [….] may lead to the same outcome (Cicchetti, 2006) (p. 13), the findings we report here are at least consistent with the idea that visuospatial cognitive impairment is one candidate cause of the atypical development of numerical competence.
One interpretive weakness in our dataset is that only 7 of the children with DS22q11.2 completed both of the numerical tasks, a fact that resulted from the way in which tasks were introduced into separate stages of a pilot study followed by a full scale, federally-funded project. Given the characteristic variability between individuals within this population, it is possible that these 7 may have constituted an atypical subgroup of the total sample. Examination of several measures shows this not to be the case. The average Full Scale, Performance and Verbal IQ scores (and Standard Deviations) for 5 of these 7 participants (we were unable to acquire IQ data from 2 for practical reasons and not due to intellectual functioning limitations) were 68(±15), 76(±17) and 73(±8) respectively, compared to 78(±11), 78(±11) and 81(±12) for the other 38 participants with DS22q11.2. The ranges for each measure were almost identical for the two groups. They were (for the 7 vs. 38 subgroups): FSIQ (52–91 vs. 54–103), PIQ (57–104 vs. 55–104), and VIQ (61–83 vs. 58–107). We also compared actual performance measures in the two tasks. For the Enumeration task, the mean reaction time means of the two subgroups differed by no more than 9–11% in each condition. For the Magnitude Comparison task, the mean adjusted reaction time means of the two subgroups also differed by no more than 9–11% in each condition. Therefore, we have a high degree of confidence that those children who did complete both numerical tasks were highly characteristic of the recruited sample of children with DS22q11.2.
Numerous researchers (e.g., Badian, 1983) have equated acquired and developmental dyscalculias and separated them into three categories. “Anarithmetria” is the most high-level category of disorder and deals with the retrieval of arithmetical facts from long-term memory. As such, it applies the least to early developing competence. “Alexia and Agraphia for Numbers” involves difficulties in the reading and writing of numbers while skills in other areas of arithmetical processing remain intact. These kinds of deficits are rather rare in younger children. The final category, “Spatial Acalculia”, is characterized by difficulties in the spatial representation of numerical information. While characteristic problems have been described in terms of alignment errors in column arithmetic, number omission, misreading arithmetic operation signs and difficulties with place values and decimals (e.g. Geary, 1993) it may also be the case that the attentionally based cognitive functions tested in Experiments 1 and 2, and some yet more basic ones (see Simon, Bearden, McDonald-McGinn, & Zackai, 2005) form the foundational competence for the development of early numerical abilities that precede such computational knowledge.
Therefore, it is possible that spatial acalculia is a phenomenon more accurately described in terms of the processes tested by our experiments and related one. Beyond our current results, it has been well documented that both TS and DS22q11.2 are disorders associate with impairments in spatial ability and show particular difficulties in numerical and mathematical tasks. It has also been claimed, at least for Turner syndrome (e.g. Bruandet, Molko, Cohen, & Dehaene, 2004; Molko et al., 2004)that these impairments may be under specific genetic control of the genes in the deleted copy of the X chromosome and that these change the structure and function of brain regions critical to numerical processing such as the intraparietal sulcus. It is our contention that such an interpretation is probably incorrect for two reasons. One is that it relies on several assumptions that are inappropriate when considering the neural basis of atypical (and typical) development. Johnson and colleagues (Johnson, Halit, Grice, & Karmiloff-Smith, 2002) present several assumptions that may be incorrect when trying to understand typical and atypical neural development in any domain. One, the “static” assumption, is that brain-behavior relationships are fixed and the age at which individuals are studied in order to determine that relationship is unimportant. Another, the “deficit” assumption, refers to the unidirectional inference that “damage to specific neural substrates both causes and explains the behavioral deficits observed in developmental disorders” (p. 525). Despite this critique, the above assumptions remain widespread and are implied by Landerl et al’s (Landerl, Bevan, & Butterworth, 2004) recent statement that “that numerical processing is localized to the parietal lobes bilaterally, in particular the intra-parietal sulcus (Dehaene, Piazza, Pinel, & Cohen, 2003), and is independent of other abilities. Developmental dyscalculia is likely to be the result of the failure of these brain areas to develop normally, whether because of injury or because of genetic factors” (p.121).
Given the lack of any identified common genetic changes in children with deletions of chromosome 22q11.2 or those affected by Turner syndrome, the genetic influence on outcomes is likely to be indirect at best and primarily in terms of engendering neurodevelopmental changes that increase the risk for development numerical cognitive dysfunction. Furthermore, children with other disorders that do not directly result from changes in the X or 22nd chromosomes also show similar impairments. One example is children with Williams syndrome (O’Hearn, Landau, & Hoffman, 2005; Paterson, Girelli, Butterworth, & Karmiloff-Smith, 2006) a disorder caused by a deletion of material on chromosome 7q13. Therefore, we believe our current data and the results of a range of other studies cited throughout this paper are consistent with a more parsimonious hypothesis that, because of a similarly impaired visuospatial cognitive foundation, children with 45,X TS and DS22q11.2 share a single cognitive phenotype in the area of numerical competence as the consequence of a developmental progression from common impairments in a set of spatial/attentional abilities and that it is this, and not any direct genetic control of arithmetical ability, that more fully explains their “developmental dysnumeracy”.
Acknowledgments
This work was supported by grants R01HD42974 and R01HD46159 from the National Institutes of Health to TJS and RO1NS42777 and RO1NS35554 to JLR. A huge debt of gratitude is due to Leeza Gabriel for her outstanding contribution assistance in the data analyses presented here. We are grateful to the three anonymous reviewers whose comments enabled us to improve this manuscript considerably. We would like to thank the staff of the “22q & You” clinic at the Children’s Hospital of Philadelphia for their assistance. Most of all we would like to thank the children who took part in the study.
Footnotes
For Experiment 1, eight children with DS22q11.2 and three with 45,X TS were excluded on this basis. For Experiment 2, three children with DS22q11.2 were excluded. No other exclusions were made.
Publisher's Disclaimer: This is a PDF file of an unedited manuscript that has been accepted for publication. As a service to our customers we are providing this early version of the manuscript. The manuscript will undergo copyediting, typesetting, and review of the resulting proof before it is published in its final citable form. Please note that during the production process errors may be discovered which could affect the content, and all legal disclaimers that apply to the journal pertain.
References
- Akhtar N, Enns JT. Relations between covert orienting and filtering in the development of visual attention. Journal of Experimental Child Psychology. 1989;48:315–334. doi: 10.1016/0022-0965(89)90008-8. [DOI] [PubMed] [Google Scholar]
- Ansari D, Donlan C, Thomas MS, Ewing SA, Peen T, Karmiloff-Smith A. What makes counting count? Verbal and visuo-spatial contributions to typical and atypical number development. Journal of Experimental Child Psychology. 2003;85(1):50–62. doi: 10.1016/s0022-0965(03)00026-2. [DOI] [PubMed] [Google Scholar]
- Ansari D, Karmiloff-Smith A. Atypical trajectories of number development: a neuroconstructivist perspective. Trends Cogn Sci. 2002;6:511–516. doi: 10.1016/s1364-6613(02)02040-5. [DOI] [PubMed] [Google Scholar]
- Bachot J, Gevers W, Fias W, Roeyers H. Number sense in children with visuospatial disabilities: Orientation of the mental number line. Psychology Science. 2005;47(1):172–183. [Google Scholar]
- Badian NA. Dyscalculia and noververbal disorders of learning. In: Myklebust HR, editor. Progress in Learning Disabilities. New York, NY: Stratton; 1983. pp. 235–264. [Google Scholar]
- Bish JP, Chiodo R, Mattei V, Simon TJ. Brain & Cognition. Domain specific attentional impairments in childrenwith chromosome 22q11.2 deletion syndrome. in press. [DOI] [PMC free article] [PubMed] [Google Scholar]
- Bish JP, Ferrante S, McDonald-McGinn D, Zackai E, Simon TJ. Maladaptive conflict monitoring as evidence for executive dysfunction in children with chromosome 22q11.2 deletion syndrome. Developmental Science. 2005;8(1):36–43. doi: 10.1111/j.1467-7687.2005.00391.x. [DOI] [PubMed] [Google Scholar]
- Booth JR, Burman DD, Meyer JR, Lei Z, Trommer BL, Davenport ND, Li W, Parrish TB, Gitelman DR, Mesulam MM. Neural development of selective attention and response inhibition. NeuroImage. 2003;20(2):737–751. doi: 10.1016/S1053-8119(03)00404-X. [DOI] [PubMed] [Google Scholar]
- Bruandet M, Molko N, Cohen L, Dehaene S. A cognitive characterization of dyscalculia in Turner syndrome. Neuropsychologia. 2004;42(3):288–298. doi: 10.1016/j.neuropsychologia.2003.08.007. [DOI] [PubMed] [Google Scholar]
- Bunge SA, Dudukovic NM, Thomason ME, Vaidya CJ, Gabrieli JD. Immature frontal lobe contributions to cognitive control in children: evidence from fMRI. Neuron. 2002;33(2):301–311. doi: 10.1016/s0896-6273(01)00583-9. [DOI] [PMC free article] [PubMed] [Google Scholar]
- Campbell L, Swillen A. The cognitive spectrum in velo-cardio-facial syndrome. In: Murphy KC, Scambler PJ, editors. Velo-Cardio-Facial Syndrome: A Model for Understanding Microdeletion Disorders. Cambridge, UK: Cambridge University Press; 2005. pp. 147–164. [Google Scholar]
- Chi MTH, Klahr D. Span and rate of apprehension in children and adults. Journal of Experimental Child Psychology. 1975;19:434–439. doi: 10.1016/0022-0965(75)90072-7. [DOI] [PubMed] [Google Scholar]
- Cicchetti D. Development and Psychopathology. In: Cicchetti D, Cohen DJ, editors. Developmental Psychopathology, Theory & Method. 2. Vol. 1. Wiley; 2006. pp. 1–23. [Google Scholar]
- Corbetta M, Shulman GL. Control of goal-directed and stimulus-driven attention in the brain. Nature Reviews Neuroscience. 2002;3(3):201–215. doi: 10.1038/nrn755. [DOI] [PubMed] [Google Scholar]
- Dehaene S, Piazza M, Pinel P, Cohen L. Three parietal circuits for number processing. Cognitive Neuropsychology. 2003;20:487–506. doi: 10.1080/02643290244000239. [DOI] [PubMed] [Google Scholar]
- Dehaene S, Spelke ES, Pinel P, Stanescu R, Tsivkin S. Sources of mathematical thinking: Behavioral and brain imaging evidence. Science. 1999;284:970–974. doi: 10.1126/science.284.5416.970. [DOI] [PubMed] [Google Scholar]
- Eliez S, Blasey CM, Menon V, White CD, Schmitt JE, Reiss AL. Functional brain imaging study of mathematical reasoning abilities in velocardiofacial syndrome (del22q11.2) Genetics in Medicine. 2001;3(1):49–55. doi: 10.1097/00125817-200101000-00011. [DOI] [PubMed] [Google Scholar]
- Fuson C. Children’s Counting and Concepts of Number. New York, NY: Springer; 1988. [Google Scholar]
- Geary DC. Mathematical Disabilities: Cognitive, neuropsychological, and genetic compenents. Psychological Bulletin. 1993;114(2):345–362. doi: 10.1037/0033-2909.114.2.345. [DOI] [PubMed] [Google Scholar]
- Göbel S, Walsh V, Rushworth MFS. The mental number line and the human angular gyrus. NeuroImage. 2001;14:1278–1289. doi: 10.1006/nimg.2001.0927. [DOI] [PubMed] [Google Scholar]
- Johnson MH. Functional brain development in infants: Elements of an interactive specialization framework. Child Development. 2000;71(1):75–81. doi: 10.1111/1467-8624.00120. [DOI] [PubMed] [Google Scholar]
- Johnson MH, Halit H, Grice SJ, Karmiloff-Smith A. Neuroimaging of typical and atypical development: a perspective from multiple levels of analysis. Dev Psychopathol. 2002;14(3):521–536. doi: 10.1017/s0954579402003073. [DOI] [PubMed] [Google Scholar]
- Karmiloff-Smith A. Development itself is the key to understanding developmental disorders. Trends in Cognitive Sciences. 1998;10(2):389–398. doi: 10.1016/s1364-6613(98)01230-3. [DOI] [PubMed] [Google Scholar]
- Kesler SR, Menon V, Reiss AL. Neuro-functional differences associated with arithmetic processing in Turner syndrome. Cereb Cortex. 2006;16(6):849–856. doi: 10.1093/cercor/bhj028. [DOI] [PMC free article] [PubMed] [Google Scholar]
- Landerl K, Bevan A, Butterworth B. Developmental dyscalculia and basic numerical capacities: a study of 8–9-year-old students. Cognition. 2004;93(2):99–125. doi: 10.1016/j.cognition.2003.11.004. [DOI] [PubMed] [Google Scholar]
- Mazzocco MM, Singh Bhatia N, Lesniak-Karpiak K. Visuospatial skills and their association with math performance in girls with fragile X or Turner syndrome. Child Neuropsychol. 2006;12(2):87–110. doi: 10.1080/09297040500266951. [DOI] [PubMed] [Google Scholar]
- Molko N, Cachia A, Riviere D, Mangin JF, Bruandet M, LeBihan D, Cohen L, Dehaene S. Brain anatomy in Turner syndrome: evidence for impaired social and spatial-numerical networks. Cereb Cortex. 2004;14(8):840–850. doi: 10.1093/cercor/bhh042. [DOI] [PubMed] [Google Scholar]
- Moss EM, Batshaw ML, Solot CB, Gerdes M, McDonald-McGinn DM, Driscoll DA, Emmanuel BS, Zackai EH, Wang PP. Psychoeducational profile of the 22q11.2 microdeletion: A complex pattern. The Journal of Pediatrics. 1999;134(2):193–198. doi: 10.1016/s0022-3476(99)70415-4. [DOI] [PubMed] [Google Scholar]
- O’Hearn K, Landau B, Hoffman JE. Multiple object tracking in people with Williams syndrome and in normally developing children. Psychol Sci. 2005;16(11):905–912. doi: 10.1111/j.1467-9280.2005.01635.x. [DOI] [PMC free article] [PubMed] [Google Scholar]
- Paterson SJ, Brown JH, Gsodl MK, Johnson MH, Karmiloff-Smith A. Cognitive modularity and genetic disorders. Science. 1999;286(5448):2355–2358. doi: 10.1126/science.286.5448.2355. [DOI] [PubMed] [Google Scholar]
- Paterson SJ, Girelli L, Butterworth B, Karmiloff-Smith A. Are numerical impairments syndrome specific? Evidence from Williams syndrome and Down’s syndrome. J Child Psychol Psychiatry. 2006;47(2):190–204. doi: 10.1111/j.1469-7610.2005.01460.x. [DOI] [PubMed] [Google Scholar]
- Piazza M, Mechelli A, Butterworth B, Price CJ. Are subitizing and counting implemented as separate or functionally overlapping processes? NeuroImage. 2002;15(2):435–446. doi: 10.1006/nimg.2001.0980. [DOI] [PubMed] [Google Scholar]
- Pinel P, Le Clec’H G, van de Moortele P, Naccache L, Le Bihan D, Dehaene S. Event-related fMRI analysis of the cerebral circuit for number comparison. Neuroreport. 1999;10(7):1473–1479. doi: 10.1097/00001756-199905140-00015. [DOI] [PubMed] [Google Scholar]
- Posner MI, Petersen SE. The attention system of the human brain. Annual Review of Neuroscience. 1990;13:25–42. doi: 10.1146/annurev.ne.13.030190.000325. [DOI] [PubMed] [Google Scholar]
- Posner MI, Walker JA, Friedrich FJ, Rafal RD. Effects of parietal injury on covert orienting of attention. The Journal of Neuroscience. 1984;4(7):1863–1874. doi: 10.1523/JNEUROSCI.04-07-01863.1984. [DOI] [PMC free article] [PubMed] [Google Scholar]
- Ratcliffe SG, Butler GE, Jones M. Edinburgh study of growth and development of children with sex chromosome abnormalities. IV. Birth Defects. 1991;26(4):1–44. [PubMed] [Google Scholar]
- Rivera SM, Menon V, White CD, Glaser B, Reiss AL. Functional brain activation during arithmetic processing in females with fragile X Syndrome is related to FMR1 protein expression. Hum Brain Mapp. 2002;16(4):206–218. doi: 10.1002/hbm.10048. [DOI] [PMC free article] [PubMed] [Google Scholar]
- Robinson A, Bender BG, Linden MG, Salbenblatt JA. Sex chromosome aneuploidy: the Denver Prospective Study. Birth Defects. 1990;26(4):59–115. [PubMed] [Google Scholar]
- Ross JL, Roeltgen D, Feuillan P, Kushner H, Cutler GB., Jr Effects of estrogen on nonverbal processing speed and motor function in girls with Turner’s syndrome. J Clin Endocrinol Metab. 1998;83(9):3198–3204. doi: 10.1210/jcem.83.9.5087. [DOI] [PubMed] [Google Scholar]
- Rovet J, Szekely C, Hockenberry MN. Specific arithmetic calculation deficits in children with Turner syndrome. J Clin Exp Neuropsychol. 1994;16(6):820–839. doi: 10.1080/01688639408402696. [DOI] [PubMed] [Google Scholar]
- Rovet JF. The cognitive and neuropsychological characteristics of females with Turner syndrome. In: Bender B, Berch D, editors. Sex chromosome abnormalities and behavior: psychological studies. Westview Press; 1991. pp. 39–77. [Google Scholar]
- Rovet JF. The psychoeducational characteristics of children with Turner syndrome. J Learn Disabil. 1993;26(5):333–341. doi: 10.1177/002221949302600506. [DOI] [PubMed] [Google Scholar]
- Rueda MR, Fan J, McCandliss BD, Halparin JD, Gruber DB, Lercari LP, Posner MI. Development of attentional networks in childhood. Neuropsychologia. 2004;42:1029–1040. doi: 10.1016/j.neuropsychologia.2003.12.012. [DOI] [PubMed] [Google Scholar]
- Sathian K, Simon TJ, Peterson S, Patel GA, Hoffman JM, Grafton ST. Neural evidence linking visual object enumeration and attention. Journal of Cognitive Neuroscience. 1999;11(1):36–51. doi: 10.1162/089892999563238. [DOI] [PubMed] [Google Scholar]
- Simon TJ. Reconceptualizing the origins of number knowledge: A “non-numerical” approach. Cognitive Development. 1997;12:349–372. [Google Scholar]
- Simon TJ. The foundations of numerical thinking in a brain without numbers. Trends in Cognitive Sciences. 1999;3(10):363–365. doi: 10.1016/s1364-6613(99)01383-2. [DOI] [PubMed] [Google Scholar]
- Simon TJ, Bearden CE, McDonald-McGinn DM, Zackai E. Visuospatial and numerical cognitive deficits in children with chromosome 22q11.2 deletion syndrome. Cortex. 2005;41(2):145–155. doi: 10.1016/s0010-9452(08)70889-x. [DOI] [PMC free article] [PubMed] [Google Scholar]
- Simon TJ, Bish JP, Bearden CE, Ding L, Ferrante S, Nguyen V, Gee JC, McDonald-McGinn DM, Zackai EH, Emannuel BS. A Multiple Levels Analysis of Cognitive Dysfunction and Psychopathology Associated With Chromosome 22q11.2 Deletion Syndrome in Children. Development and Psychopathology. 2005;17:753–784. doi: 10.1017/S0954579405050364. [DOI] [PMC free article] [PubMed] [Google Scholar]
- Sobin C, Kiley-Brabeck K, Daniels S, Khuri J, Taylor L, Blundell M, Anyane-Yeboa K, Karayiorgou M. Neuropsychological characteristics of children with the 22q11 Deletion Syndrome: a descriptive analysis. Neuropsychol Dev Cogn C Child Neuropsychol. 2005;11(1):39–53. doi: 10.1080/09297040590911167. [DOI] [PMC free article] [PubMed] [Google Scholar]
- Stewart DA, Bailey JD, Netley CT, Park E. Growth, development, and behavioral outcome from mid-adolescence to adulthood in subjects with chromosome aneuploidy: the Toronto Study. Birth Defects Orig Artic Ser. 1990;26(4):131–188. [PubMed] [Google Scholar]
- Swillen A, Devriendt K, Legius E, Prinzie P, Vogels A, Ghesquiere P, Fryns JP. The behavioural phenotype in velo-cardio-facial syndrome (VCFS): from infancy to adolescence. Genetic Counselling. 1999;10(1):79–88. [PubMed] [Google Scholar]
- Swillen A, Vogels A, Devriendt K, Fryns JP. Chromosome 22q11 deletion syndrome: Update and review of the clinical features, cognitive-behavioral spectrum, and psychiatric complications. American Journal of Medical Genetics. 2000;97:128–135. doi: 10.1002/1096-8628(200022)97:2<128::aid-ajmg4>3.0.co;2-z. [DOI] [PubMed] [Google Scholar]
- Temple CMMA. Arithmetic ability and disability in Turner’s syndrome: a cognitive neuropsychological analysis. Developmental Neuropsychology. 1996;14(1):47–67. [Google Scholar]
- Temple E, Posner MIP. Brain mechanisms of quantity are similar in 5-year-old children and adults. Proceedings of the National Academy of Sciences. 1998;95:7836–7841. doi: 10.1073/pnas.95.13.7836. [DOI] [PMC free article] [PubMed] [Google Scholar]
- Woodin MF, Wang PP, Aleman D, McDonald-McGinn DM, Zackai EH, Moss EM. Neuropsychological profile of children and adolescents with the 22q11.2 microdeletion. Genetics in Medicine. 2001;3(1):34–39. doi: 10.1097/00125817-200101000-00008. [DOI] [PubMed] [Google Scholar]