

Abstract
The structural properties of the Aβ42 peptide, a main constituent of the amyloid plaques formed in Alzheimer’s disease, were investigated through a combination of ion-mobility mass spectrometry and theoretical modeling. Replica exchange molecular dynamics simulations using a fully atomic description of the peptide and implicit water solvent were performed on the −3 charge state of the peptide, its preferred state under experimental conditions. Equilibrated structures at 300 K were clustered into three distinct families with similar structural features within a family and with significant root mean square deviations between families. An analysis of secondary structure indicates the Aβ42 peptide conformations are dominated by loops and turns but show some helical structure in the C-terminal hydrophobic tail. A second calculation on Aβ42 in a solvent-free environment yields compact structures turned “inside out” from the solution structures (hydrophobic parts on the outside, polar parts on the inside). Ion mobility experiments on the Aβ42 −3 charge state electrosprayed from solution yield a bimodal arrival time distribution. This distribution can be quantitatively fit using cross-sections from dehydrated forms of the three families of calculated solution structures and the calculated solvent-free family of structures. Implications of the calculations on the early stages of aggregation of Aβ42 are discussed.
Keywords: structure, mass spectrometry, correlation of structure with spectra and other properties, new methods, computational analysis of protein structure, molecular dynamics
Alzheimer’s disease (AD) belongs to a family of neurodegenerative disorders associated with pathological folding and aggregation of peptides and proteins in the brain. A common feature of these diseases is the formation of amyloid fibrils and plaques. The presence of these plaques among AD patients and an understanding of their genetic origin led to the amyloid hypothesis to explain the progress of the disease (Hardy and Higgins 1992). This hypothesis posits that amyloid plaques are central to onset and development of AD. The pros and cons of this hypothesis have recently been reviewed (Hardy and Selkoe 2002).
In recent years, it has become apparent that neither the plaques nor the monomeric protein units are the main pathogenic agents in AD (Dahlgren et al. 2002). What appears to be primarily responsible are small, soluble oligomers termed paranuclei (five or six monomer units) or ADDLs, and protofibrils (Oda et al. 1995; Younkin 1995; Lambert et al. 1998; Wang et al. 1999; Klein et al. 2001, 2004). Hence, the research focus on AD has shifted from characterizing the amyloid fibrils to understanding the detailed role, the structure, and the mechanism of formation of these species (Kirkitadze et al. 2002; Bitan et al. 2003b).
The monomer unit in AD is termed the amyloid β-protein (Aβ). Aβ is formed from the large transmembrane amyloid precursor protein (APP) by cleavage by β- and γ-secretase. While a variety of Aβ peptides are produced, the two dominant forms are Aβ40 and Aβ42, composed of 40 and 42 amino acid residues, respectively. The average molar ratio of Aβ40:Aβ42 in vivo is ~10, but Aβ42 is the dominant form found in amyloid plaques and is the more neurotoxic of the two species (Younkin 1995; Selkoe 1999; Dahlgren et al. 2002).
While the nature of the amyloid fibrils has been successfully probed using a number of experimental techniques (Malinchik et al. 1998; Balbach et al. 2000; Burkoth et al. 2000; Serpell 2000; Petkova et al. 2002, 2004; Tycko 2003, 2004), the structural characterization of the Aβ monomer remains difficult due to its tendency to aggregate. A limited number of NMR studies have been reported on fragments of the Aβ monomer (Lee et al. 1995; Jarvet et al. 2000; Zhang et al. 2000; Lazo et al. 2005) as well as on full-length peptides in which the Met35 residue was oxidized (Riek et al. 2001; Hou et al. 2004). Only a single NMR study has been performed to date on unmodified Aβ40 and Aβ42 monomers in water (Hou et al. 2004). This study produced important information about regions of localized stability of the peptides but, due to lack of long-range constraints, failed to provide a complete atomic characterization of the peptide. In order to understand the aggregation process and why different fragments and mutants aggregate at different rates and apparently by different pathways, it is crucial that monomer structures be obtained. Consequently, the primary goal of the work reported here is to obtain a global tertiary family of structures of wild-type Aβ42 using a combination of ion mobility methods and molecular modeling. Ion mobility provides cross-section data that, it will be argued, correlate with both solution and solvent-free Aβ42 conformations. These cross-sections provide an important benchmark against which the modeling can be assessed. The modeling, on the other hand, provides detailed structural information and information on how environment affects that structure. We focus here on the modeling. A detailed treatment of the experimental portion of the work has recently been published (Bernstein et al. 2005).
Methods
Experiment
The ion mobility measurements (von Helden et al. 1991, 1993) were performed on a home-built instrument that has been previously described (Wyttenbach et al. 2001). Ions are formed by nanoelectrospray (nano-ESI) and injected through a small capillary into an ion funnel. The Aβ42 ions are slowly dehydrated as they travel through the funnel to the entrance of the mobility cell where they are stored. Every 10−3 sec a pulse of stored ions is injected into the mobility cell filled to 5 Torr with helium gas. The ion pulse drifts through the gas under the influence of a weak electric field, exits the cell, passes through a quadrupole mass filter, and is detected as a function of time. The arrival time distribution (ATD) contains information regarding the shapes of the ions and whether more than one conformer is present in the mass-selected ion beam. This information can be quantified in the following manner: The velocity, vD, of an ion drifting through a gas under the influence of a weak electric field E, is proportional to that field:
 |
(1) |
where the proportionality constant K is termed the ion mobility. By making measurements at a variety of electric field strengths, very accurate values of K can be obtained (Mason and McDaniel 1988). Kinetic theory relates K to the ion–He collision cross-section σ, which in turn, can be related to the time the ion packet arrives at the detector, tA:
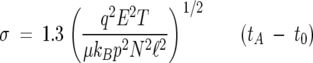 |
(2) |
where q is the ion charge; T, the temperature in Kelvin; p, the pressure in Torr; μ, the reduced mass of the ion–He collision partners; N, the He gas density at 273 K and 760 Torr; kB, the Boltzmann constant; ℓ, the cell length; and t0, the time the ion spent exiting the mobility cell until reaching the detector. All of the parameters on the right-hand side of Equation 2 are known or can be measured accurately; therefore, a precise value of σ can be obtained. When a mass spectrum is desired, the ion funnel is no longer used as a storage device and the ions pass continuously through the cell to the detector.
Wild-type Aβ42 was synthesized by Fmoc (N-[9-fluorenyl] methoxycarbonyl) chemistry, purified by reversed-phase HPLC and characterized by mass spectrometry and amino acid analysis (Lomakin et al. 1996). Samples for nano-ESI were prepared by dissolving previously quantified lyophilized peptides in H2O to produce a concentration of 4 mg/mL. To this solution, 0.006 volume of 1 N NaOH was added, followed by 1 volume of 20 mM ammonium acetate (pH 7.4), reducing the peptide concentration to 2 mg/mL. The solution was sonicated for 1 min and then 100 μL were transferred to a filter (Gel Filtration G-10 Macro Spin Column, Nest Group Inc.), previously hydrated, and washed with 10 mM ammonium acetate (pH 7.4), and spun for 5 min at 2000g. The filtrate was collected and used immediately. The final peptide concentrations of collected filtrate ranged from 30–40 μM.
Modeling
At pH 7, the wild-type Aβ42 peptide (DAEFRHDSGYEVHHQKLVFFAEDVGSNKGAII GLMVGGVVIA42) contains six negatively charged side chains and three positively charged side chains, producing a charge on the molecule of −3. This is the species modeled here. While other charge states are observed experimentally (as discussed in the next section), the −3 charge is the biologically relevant state of the system, as this is the charge state present in solution at physiological pH and under the conditions of our experiment. Modeling was done using the CHARMM all-atom force field (MacKerell et al. 1998) with the covalent bonds involving hydrogen kept constant using the SHAKE algorithm (Allen and Tildesley 1986). The dynamics were propagated with a time step of 2 fsec. The solvent effects were modeled through the GB/SA solvation scheme (Lee et al. 2002). Within this scheme, the electrostatic part of the solvation energy is computed from the generalized Born (GBMV) approximation. The hydrophobic contribution is modeled as a solvent-accessible (SA) surface area term with proportionality coefficient 0.005 (kcal/mol) · Å2. An implicit solvent was used, as explicit solvent folding simulations are computationally intractable for a 42-residue-long peptide. The GB/SA implicit solvent is among the most accurate implicit solvent models developed to date, and takes into account both electrostatic and hydrophobic effects. It has been successfully used to study the folding free energy landscape of protein and peptides (Feig and Brooks 2004). The simulations were organized according to the replica exchange (REX) protocol (Swendsen and Wang 1986; Hukushima and Nemoto 1996; Sugita and Okamoto 1999). In this scheme, a number of identical copies, or “replicas,” of the original system are simulated, in parallel, for a given number of MD steps at different temperatures. Two replicas i and j adjacent in temperatures Ti and Tj, with energies Ei and Ej, are swapped periodically with the probability:
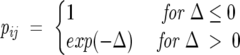 |
(3) |
where Δ≡ [(βi − βj)(Ej − Ei)] and β = 1/kBT.
Because the escape time from local energy minima decreases significantly at elevated temperatures, the REX method enables both enhanced equilibration and sampling by treating the temperature as a variable that can change with time. In addition to leading to a more thorough exploration of conformational space, the algorithm also ensures that the conformations sampled at a given temperature in the REX simulations belong to the canonical statistical ensemble. We and others (Feig et al. 2001; Pitera and Swope 2003; Nymeyer et al. 2004; Baumketner and Shea 2005 Baumketner and Shea 2006) have shown that this protocol is capable of efficiently sampling the conformational space of peptides and small proteins and identifying the low-energy conformations. The protocol used in this study considered 20 identical replicas of the peptide, simulated at temperatures spaced exponentially between 250 K and 650 K. Every 1000 simulation time steps, attempts to exchange replicas with adjacent temperatures were made. A total number of 10,000 replica exchanges were attempted. This resulted in a 20-nsec simulation time per replica, or 400-nsec total simulation time. The simulations were carried out on an AMD Athlon dual-CPU computational cluster with the clock frequency 1.6 GHz. In total, the simulations took >2 mo to complete. As the output of the simulations, 355 peptide conformations were collected over the final 10 nsec of the trajectory at regular time intervals. A second set of conformations was chosen at different intervals to check the statistical uncertainty of the selected conformations. The conclusions drawn from the analysis of this second conformational ensemble did not differ from those we reached by using the first ensemble, indicating that we have not missed any important conformations in our analysis of the data.
Results
A typical nano-ESI mass spectrum is shown in Figure 1. The −3 charge state is largest, as expected from the −3 charge on the peptide in solution. Also evident are a −4 charge state, a very small −2 charge state, and a feature that appears to have a charge of −5/2. This latter peak is clearly a dimer or a higher order aggregate and is discussed in detail elsewhere (Bernstein et al. 2005). The high-resolution spectrum of the −3 charge state (Fig. 1) reveals a series of peaks separated by 0.33 amu, as expected for 13C isotopes of a monomer species with three charges. The distribution of the isotope pattern is fit exactly by the distribution expected for the Aβ42 peptide. A similar distribution of peaks separated by 0.25 amu is obtained for the −4 charge state (data not shown). Hence, both the −3 and −4 species are dominantly monomers. However, because baseline resolution was not obtained in the isotope pattern, a small fraction of −6 dimer could contribute to the peak labeled −3 in Figure 1.
Figure 1.

Negative ion ESI mass spectrum of Aβ42 solution showing charge states −2 through −4. The peak labeled −5/2 has an m/z-value formally corresponding to a dimer of charge −5. The expanded view on the left shows an expanded mass scale for the −3 peak. The insert on the right shows an ATD of the −3 species.
Also shown in Figure 1 is the ATD for the −3 charge state. Since the isotope pattern indicates this peak is primarily composed of monomer, the two dominant features in the ATD must correspond to two distinct, noninterconverting monomer families of conformers on the millisecond timescale. If there were rapid inter-convertion of the structures making up the ATD, a single peak would appear at a time appropriate for the weighted average of the species present. Average cross-sections for the two ATD-features observed were obtained in the usual manner (Wyttenbach et al. 2001), yielding 635 Å2 for the earlier peak and 700 Å2 for the later peak. The ATD expected for a system with two species of 635 Å2 and 700 Å2 should show two relatively well-resolved peaks narrower than those seen experimentally, indicating that the ATD contains more than two features. The fact that the cross-sections of the two main features vary by 10% and that they do not interconvert on the millisecond timescale of the experiment indicates the two conformers differ significantly in structure. It should also be mentioned that a detailed analysis of this ATD, and one from the [Pro19]Aβ42 alloform, indicate that a small amount of oligomer contributes to a third feature at an even shorter time (Bernstein et al. 2005). This point, while a minor complicating factor, does not impact the structural determination made here.
Two independent replica exchange molecular dynamics calculations of Aβ42 were carried out: one in implicit water and one solvent-free. To compare with the experiment, the implicit water structures were instantaneously dehydrated through energy-minimization in vacuum. The cross-sections of the hydrated, the dehydrated, and the solvent-free results are shown as panels A, B, and C in Figure 2. The hydrated peptide(s) exhibit the largest cross-sections because water solvation extends the peptide by replacing intramolecular charge solvation and hydrogen bonding with interactions with water. The radii of gyration for the solvated peptides range from 11 Å to 15 Å, indicating that the peptide exists as a mixture of larger coils and smaller globular conformations. The average cross-section for this distribution of peptides, 858 Å2, is larger than the experimentally determined cross-sections. However, simply dehydrating and energy-minimizing Aβ42 reduces its average size to 765 Å2, bringing the calculated results into the range of experimentally observed cross-sections (see Fig. 2B). Finally, the calculation in a solvent-free environment yields structures that are notably more compact (679 Å2) than the dehydrated and solvated conformations, with radii of gyration not exceeding 10 Å.
Figure 2.
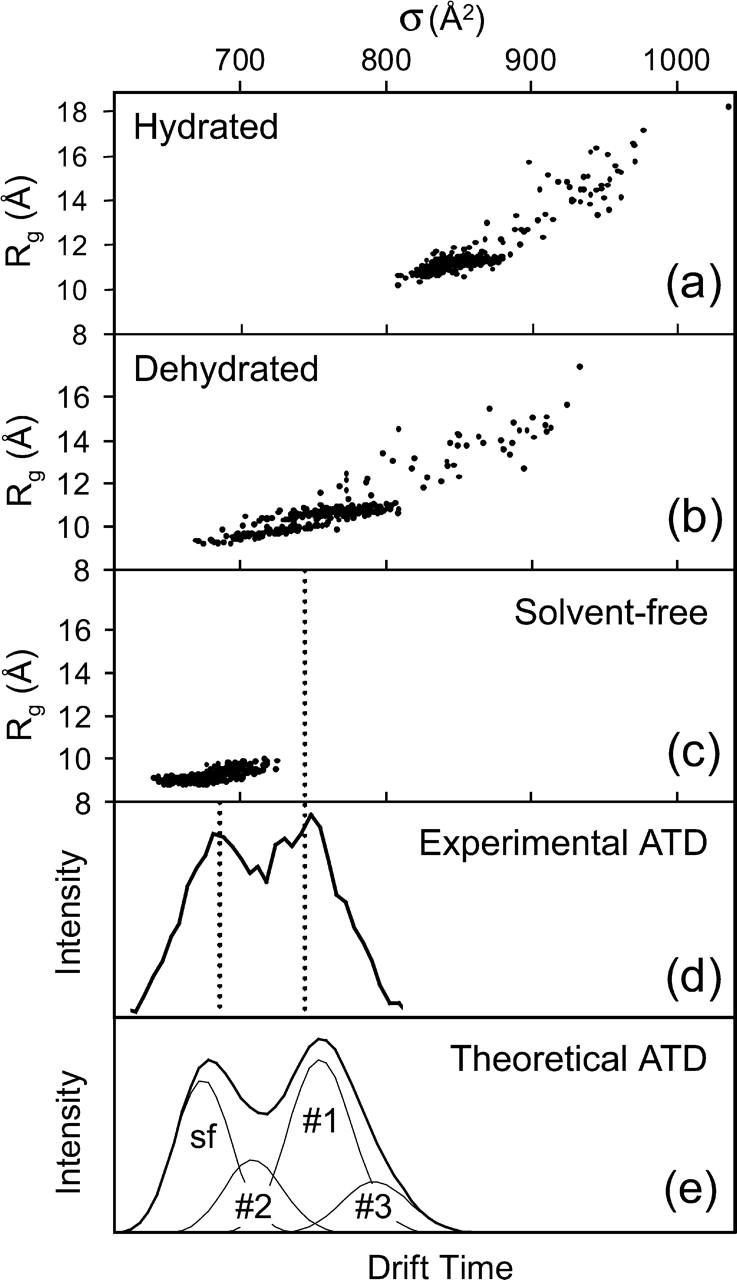
Scatter plot of radius of gyration (Rg) vs. cross-section (σ) of hydrated (A), dehydrated (B), and solvent-free (C) theoretical Aβ42 structures. (D) Experimental ATD of Aβ42 charge state −3. (E) Theoretical ATD of solvent-free (sf) and dehydrated Aβ42 structures consisting of families 1, 2, and 3.
A comparison of the theoretical and experimental results suggests that the two families of structures seen experimentally (Fig. 2D) correspond to the families of solvent-free (Fig. 2C) and dehydrated (Fig. 2B) structures found theoretically. The dotted lines in Figure 2 are given to guide the eye and to confirm this point. Representative conformers of solvent-free and dehydrated structures are shown in Figure 3. The solvent-free conformations are characterized by a quasispherical shape with the hydrophilic residues clustered in the center and the hydrophobic residues exposed. Structures obtained by dehydrating solution-phase conformations are organized in the opposite manner, with hydrophilic residues on the surface and hydrophobic residues in the center. Conversion between the two families would involve “flipping the structure inside out,” a highly unfavored process energetically. Hence, solution structures dehydrated in the ion funnel could get trapped in this configuration and not be able to isomerize to the lower-energy solvent-free family of structures. This scenario would be consistent with the observation of two peaks in the ATD.4 The mechanism of formation of the gas phase structures observed in the ATD is not known. It is clear, however, that these structures must exist and that they do not interconvert with the solution-like structures on the timescale of the experiment. What we see at the exit point of the cell is a snapshot of a system undergoing equilibration. We know that only solution structures exist in the solution in the spray needle before spraying. At a certain point in time during the spray process and injection through the capillary into the ion funnel and before thermalization, some fraction of the solution structures is converted to gas phase structures. The conformations of the two cohorts of structures (solution and gas phase) are so different that isomerization is quenched once thermalization occurs. About one-third of the initial 100% of solution structures in the spray needle are converted in the spray process based on our analysis of the ATD.
Figure 3.

Typical Aβ42 structures obtained by simulations in a solvent-free environment (A), and in implicit water with subsequent dehydration (B) (minimization in solvent-free environment). Hydrophobic residues are shown in white.
While other low-energy structures not seen in the present simulation due to sampling and force field limitations may exist, the agreement between experiment and theory in terms of the size of the peptide suggests that the modeling methods employed yield biophysically meaningful results and plausible structures for Aβ. We therefore anticipate that further analysis of the solution theoretical results should produce new insight into Aβ folding. Our first approach is to see if there are clusters of conformations with structural similarities, and hence, a principal coordinate (PC) analysis was run (Gower 1966). Principal coordinate analysis is an established computational method that seeks to classify the pool of available conformations into distinct groups, or clusters. Conformations are projected onto a two-dimensional space spanned by the first two eigenvectors of a structural similarity matrix obtained by measuring over the pairwise RMS deviations among the conformations obtained at T = 250 K. A two-dimensional plot of the first two of principal coordinates is given in Figure 4. The total variation in interconformational RMS captured by these two PCs is moderate (50%), suggesting that the topology of the conformational space available to Aβ42 at ambient temperature is quite complex. Projections onto two dimensions cannot represent all the distinctive features of conformational space, but our analysis nonetheless suggests there are three families of conformers within the 355 structures in our sample. To further confirm this grouping, we carried out a variant of PCA, the principal component analysis (Jolliffe 1986), on these structures. Results from this analysis were found to be consistent with those obtained from the principal coordinate analysis. Family 3 is the most compact (i.e., structurally similar) while families 1 and 2 are more diverse. Similar cross-sections are found within a family, and they differ significantly between families. Family 1 (207 structures) has the largest number of members, while families 2 and 3 have 66 and 82 members, respectively. The structures belonging to each cluster have similar potential energies (average −1113 kcal/mol), although conformations with large gyration radius (>12 Å) have slightly higher potential energy. Our simulations highlight the fact that the Aβ peptide does not possess a unique folded conformation; rather, the peptide can adopt one of several low energy conformations. Figure 5 shows representative solvated conformations belonging to each family and a breakdown of secondary structure, as computed from the STRIDE algorithm (Frishman and Argos 1995). Conformations within an individual cluster are structurally similar, whereas conformations belonging to different clusters are structurally very dissimilar from one another, with mutual RMS deviations on the order of 10 Å. Families 1 and 3 are most homogeneous with respect to the secondary structure of their constituents. Both families are composed mostly of loops and turns in the N-terminal part of the sequence. Family 1 possesses turn regions spanning residues A2–Q15, A21–V24, and G25–L34; family 2, spanning residues A2–R5, Y10–H15, K16–G25, V36–G38; and family 3, residues A2–R5, H14–D23, and S26–V39. The families differ in the hydrophobic C-terminal region in which family 1 exhibits a greater propensity for helix formation and family 3 is more prone to forming β-strands. Two short β-strand segments are observed for residues I32–G33 and G38–V39 in family 3. In contrast, family 2 contains conformations in which both helices (spanning residues S26–M35) and β-strands appear in the C-terminal region. The amount of ordered α- or β-structure observed in the conformations from all families is small. At most, the ordered residues constitute 10%–20% of the total sequence for any conformation.
Figure 4.

Result of principal coordinate analysis displaying best clustering of the three families of hydrated Aβ42 structures. Each family is separated from another family by an RMSD of ~10 Å.
Figure 5.

Typical representatives of family 1 (A), family 2 (B), and family 3 (C) of solvated Aβ42 structures. Hydrophobic residues are shown in white. Helical sections are indicated by fat cylinders. (D) Secondary structure analysis of all structures of families 1, 2, and 3 using the STRIDE algorithm. (We note that in the CHARMM 22 force field, π- and α-helices have comparable energies.)
Is the existence of three distinctly different families of solution structures consistent with our experimental data? Figure 2E shows the ATD expected for a mixture of a single family of solvent-free Aβ42 and the three families of dehydrated Aβ42 molecules. Average cross sections are 769, 718, and 814 Å2 for families 1, 2, and 3, respectively. The percentage of solvent-free structures was varied to best match the experiment yielding a value of 31%, and consequently 69%, for the three dehydrated families. The population of families 1, 2, and 3 within the dehydrated structures was taken as the relative percentages of the three families obtained in the calculation (58%, 23%, and 19%). In constructing the model ATD, we assumed that there was rapid inter-conversion between structures within a given family but no interconversion between families on the timescale of the experiment (~1 msec). Kinetic theory (Mason and McDaniel 1988) was used to obtain the model line shapes. The shape of the theoretical ATD agrees remarkably well with the experiment (Fig. 2D). The presence of the smaller cluster families 2 and 3 provides a reasonable explanation for the broadening of the two main peaks observed in the experiment. We note that the model presented here may not be the only possible model agreeing with the experiment. However, in any reasonable model put forward there have to be at least four different families of structures with a population distribution and with average cross-sections that are very similar to the model presented here.5
Discussion and Conclusions
By drawing on the complementary strengths of ion-mobility mass spectrometry and theoretical modeling, we were able to shed new light on the conformational states of the monomeric Aβ42 peptide, the building block of amyloid fibers. Our simulations reveal that Aβ42 in aqueous solution adopts both extended chain as well as collapsed-coil structures. Aβ42 does not display a unique fold, as would be the case for a typical protein, but rather comprises a mixture of rapidly inter-converting conformations. The monomeric conformations could be separated into three distinct families whose members displayed mostly coil-like structure, with few helical or strand elements present. Results of our simulations are consistent with solution NMR experiments (based on NOE constraints, chemical shift indices, and J-scalar couplings) and circular dichroism (CD) spectroscopy. The absence of regular α- or β-structure has been demonstrated in NMR studies of Aβ10–35 (Lee et al. 1995; Zhang et al. 2000), Aβ40, Aβ42 (Zagorski et al. 2000; Hou et al. 2004), and oxidized alloforms of Aβ40 and Aβ42 (Riek et al. 2001; Hou et al. 2004). The percentage of ordered residues in soluble Aβ42 found in our simulations agrees reasonably well with percentages determined by NMR and CD (Walsh et al. 1999; Huang et al. 2000; Kirkitadze et al. 2001; Bitan et al. 2003a) that estimate the amount of unordered structure to be 60%–80%, of α-helices to be <10%, and of β-sheets to be ~10%–20%. CD measurements are expected to yield higher percentages of ordered secondary structure elements as they provide an average picture taken over all monomers and oligomers (dimers, trimers, etc.) that exist in dynamic equilibrium in vitro, while here only the secondary structure of monomers is assessed. Oligomers are likely to contain elements of secondary structure not present in the monomeric form. The paucity of regular secondary structure elements in the monomeric peptide in solution contrasts with its mostly helical form in a membrane-like environment (Crescenzi et al. 2002) and its β-sheet structure when incorporated in the amyloid fibril (Serpell 2000).
Previous solution NMR studies (Lee et al. 1995; Zhang et al. 2000; Riek et al. 2001; Hou et al. 2004) indicated that Aβ can possess localized regions of well-defined structure. In particular, the central hydrophobic residues Leu17–Ala21 (Leu-Val-Phe-Phe-Ala) (Zhang et al. 2000) of the Aβ10–35 peptide were found to be well structured. This region, known as the central hydrophobic cluster (CHC), has been shown to be critical for fibril formation (Fraser et al. 1991; Inouye et al. 1993). The CHC also was found to be well structured in Aβ40ox and Aβ42ox (Riek et al. 2001; Hou et al. 2004) peptides in which Met35 is oxidized, as well as in the Aβ40 and Aβ42 peptides (Hou et al. 2004). Molecular dynamics simulations by Straub and coworkers (Massi et al. 2001) on the Aβ10–35 fragment indicate that the CHC residues underwent considerably smaller structural fluctuations than the rest of the peptide during a 1-nsec run. In the present study, all conformations corresponding to the clustered family 3 (Fig. 5D) display a structured CHC, with an RMSD of <0.6 Å relative to the experimental NMR structure of the Aβ10–35 fragment (Zhang et al. 2000). Conformations from families 1 and 2 show less well-structured CHCs. However, family 3 comprises only 15% of our cohort of structures, indicating that the full-length peptide exhibits less structural stability in the CHC than the 10–35 fragment.
It is interesting to consider how the structure of the Aβ42 monomers determines possible pathways for its self-assembly. It has been shown experimentally that the first stage of self-assembly, oligomerization, may involve the transient appearance of α-helices on route to fibril formation. For example, Kirkitadze et al. (2001) reported a transitory increase in α-helical content during fibrillogenesis of Aβ42, as well as Aβ40 and all clinically relevant Aβ alloforms. CD measurements were used to show that the relative amount of α-helices in water solutions of Aβ42 increased from 3% to ~20% after 4 d of incubation, coincident with peptide oligomerization. Because fibrils are rich in β-strands and because the C-terminal part of the Aβ is embedded in the cell membrane in an α-helical form, an α → β structural transition must occur in the process of Aβ secretion and amyloid assembly. Our simulations reveal modest, but statistically significant, amounts of helical structure in the hydrophobic C-terminal region of the peptide, a region with high propensity for forming helices in apolar media. We propose that the experimental increase in α-structure reported at intermediate observation times during fibrillogenesis results from association of unstructured Aβ monomers into oligomers in such a way that the hydrophobic tails of the peptides become shielded from the solvent by the rest of the peptides. This creates a local apolar microenvironment which promotes growth of helical structure from the pre-existing seeds. This hypothesis, shown schematically in Figure 6, is currently being tested through simulations and ion mobility mass spectrometry studies on higher oligomers.
Figure 6.

Schematic representation of Aβ42 conformations in the early stages of aggregation. Monomers without helical structure are in equilibrium with monomers containing small amounts of helical structure at the C terminus. Five or six monomers assemble to form a paranucleus (Bitan et al. 2003a) where the hydrophobic C termini are shielded by the more hydrophilic parts of the peptides. Hydrophobic residues are marked in red.
Acknowledgments
J.-E.S. gratefully acknowledges support from the David and Lucile Packard Foundation, the A.P. Sloan Foundation, and the NSF Career Award no. 0133504. M.T.B. gratefully acknowledges the NSF (grant no. CHE-0503728) and the Air Force Office of Scientific Research (grant nos. F49620-03-1-0046 and F49620-98-1-0195) for equipment support. D.B.T. gratefully acknowledges support provided by the NIH (grant nos. NS38328, NS44147, and AG18921) and the Foundation for Neurologic Diseases. Simulations were performed in part using the TeraGrid facilities (NSF high-performance computing grant nos. MCB040044 and MCA05S027).
Article and publication are at http://www.proteinscience.org/cgi/doi/10.1110/ps.051762406.
Footnotes
Both the solvent-free and the dehydrated model peptide cross-sections are slightly larger than experiment (~7%). However, the difference between these two cross-sections agrees very well with the experimentally observed difference. The small differences in the experimental and the model absolute cross-sections may be due to an insufficient number of exchanges in the modeling, inaccuracies in the minimized structures formed by “instantaneous” dehydration of the hydrated model peptides, or, most likely, difficulties in converting model structures into absolute cross-sections in the Aβ42 size range (Mesleh et al. 1996; Wyttenbach et al. 1997).
It should be pointed out that the experimental ATD can be empirically “fit” using several individual peaks of variable drift time and intensity with a width expected for a single structural species drifting through the mobility cell under our experimental conditions. Using a least-square fitting process we found that two peaks could not adequately fit the data, three came closer, and four could be made to give a very good fit. Adding additional peaks (five or more) did not improve the four-peak fit but did indicate that there could be many empirical multipeak fits that very closely approximate the experimental ATD. While this is not surprising since unconstrained empirical fitting will always produce a solution (or many solutions), the fact that our theoretical model (without adjustable parameters) shown in Figure 2E closely approximates the experimental ATD is remarkable. As a consequence, the theoretical modeling results are strongly supported by experiment suggesting that the modeling gives a good semiquantitative picture of the various structural families present in Aβ42.
References
- Allen, M.P. and Tildesley, D.J.1986. Computer simulation of liquids. Clarendon Press, Oxford, UK.
- Balbach, J.J., Ishii, Y., Antzutkin, O.N., Leapman, R.D., Rizzo, N.W., Dyda, F., Reed, J., and Tycko, R. 2000. Amyloid fibril formation by Aβ(16–22), a seven-residue fragment of the Alzheimer’s β-amyloid peptide, and structural characterization by solid state NMR. Biochemistry 39: 13748–13759. [DOI] [PubMed] [Google Scholar]
- Baumketner, A. and Shea, J.-E. 2005. The influence of different treatments of electrostatic interactions on the thermodynamics of folding of peptides. J. Phys. Chem. B 109: 21322–21328. [DOI] [PubMed] [Google Scholar]
- ———.2006. The thermodynamics of folding of a β-hairpin peptide probed through replica exchange molecular dynamics simulations. Theo. Chem. Acc. http://www.springerlink.com.
- Bernstein, S.L., Wyttenbach, T., Baumketner, A., Shea, J.-E., Bitan, G., Teplow, D.B., and Bowers, M.T. 2005. Amyloid β-protein: Monomer structure and early aggregation states of A β 42 and its Pro(19) alloform. J. Am. Chem. Soc. 127: 2075–2084. [DOI] [PubMed] [Google Scholar]
- Bitan, G., Vollers, S.S., and Teplow, D.B. 2003a. Elucidation of primary structure elements controlling early amyloid β-protein oligomerization. J. Biol. Chem. 278: 34882–34889. [DOI] [PubMed] [Google Scholar]
- Bitan, G., Kirkitadze, M.D., Lomakin, A., Vollers, S.S., Benedek, G.B., and Teplow, D.B. 2003b. Amyloid β-protein (A β) assembly: A β 40 and A β 42 oligomerize through distinct pathways. Proc. Natl. Acad. Sci. 100: 330–335. [DOI] [PMC free article] [PubMed] [Google Scholar]
- Burkoth, T.S., Benzinger, T.L.S., Urban, V., Morgan, D.M., Gregory, D.M., Thiyagarajan, P., Botto, R.E., Meredith, S.C., and Lynn, D.G. 2000. Structure of the β-amyloid(10–35) fibril. J. Am. Chem. Soc. 122: 7883–7889. [Google Scholar]
- Crescenzi, O., Tomaselli, S., Guerrini, R., Salvadori, S., D’Ursi, A.M., Temussi, P.A., and Picone, D. 2002. Solution structure of the Alzheimer amyloid β-peptide (1–42) in an apolar microenvironment—Similarity with a virus fusion domain. Eur. J. Biochem. 269: 5642–5648. [DOI] [PubMed] [Google Scholar]
- Dahlgren, K.N., Manelli, A.M., Stine, W.B., Baker, L.K., Krafft, G.A., and LaDu, M.J. 2002. Oligomeric and fibrillar species of amyloid-β peptides differentially affect neuronal viability. J. Biol. Chem. 277: 32046–32053. [DOI] [PubMed] [Google Scholar]
- Feig, M. and Brooks III, C.L. 2004. Recent advances in the development and application of implicit solvent models in biomolecule simulations. Curr. Opin. Struct. Biol. 14: 217–224. [DOI] [PubMed] [Google Scholar]
- Feig, M., Karanicolas, J., and Brooks III, C.L.2001. MMTSB tool set: MMTSB NIH research resource. The Scripps Research Institute, La Jolla, CA.
- Fraser, P.E., Nguyen, J.T., Surewicz, W.K., and Kirschner, D.A. 1991. pH-dependent structural transitions of Alzheimer amyloid peptides. Biophys. J. 60: 1190–1201. [DOI] [PMC free article] [PubMed] [Google Scholar]
- Frishman, D. and Argos, P. 1995. Knowledge-based secondary structure assignment. Proteins 23: 566–579. [DOI] [PubMed] [Google Scholar]
- Gower, J.C. 1966. Some distance properties of latent root and vector methods used in multivariate analysis. Biometrika 53: 325–328. [Google Scholar]
- Hardy, J.A. and Higgins, G.A. 1992. Alzheimer’s disease—The amyloid cascade hypothesis. Science 256: 184–185. [DOI] [PubMed] [Google Scholar]
- Hardy, J. and Selkoe, D.J.2002.Theamyloidhypothesisof Alzheimer’sdisease: Progress and problems on the road to therapeutics. Science 297: 353–357. [DOI] [PubMed] [Google Scholar]
- Hou, L., Shao, H., Zhang, Y., Li, H., Menon, N.K., Neuhaus, E.B., Brewer, J.M., Byeona, I.-J.L., Ray, D.G., Vitek, M.P., et al. 2004. Solution NMR studies of the A β (1–40) and A β (1–42) peptides establish that the Met35 oxidation state affects the mechanism of amyloid formation. J. Am. Chem. Soc. 126: 1992–2005. [DOI] [PubMed] [Google Scholar]
- Huang, T.H.J., Yang, D.-S., Plaskos, N.P., Go, S., Yip, C.M., Fraser, P.E., and Chakrabartty, A. 2000. Structural studies of soluble oligomers of the Alzheimer β-amyloid peptide. J. Mol. Biol. 297: 73–87. [DOI] [PubMed] [Google Scholar]
- Hukushima, K. and Nemoto, K. 1996. Exchange Monte Carlo method and application to spin glass simulations. J. Phys. Soc. Jpn. 65: 1604–1608. [Google Scholar]
- Inouye, H., Fraser, P.E., and Kirschner, D.A. 1993. Structure of β-crystallite assemblies formed by Alzheimer β-amyloid protein analogues: Analysis by X-ray diffraction. Biophys. J. 64: 502–519. [DOI] [PMC free article] [PubMed] [Google Scholar]
- Jarvet, J., Damberg, P., Bodell, K., Eriksson, L.E.G., and Gräslund, A. 2000. Reversible random coil to β-sheet transition and the early stage of aggregation of the A β (12–28) fragment from the Alzheimer peptide. J. Am. Chem. Soc. 122: 4261–4268. [Google Scholar]
- Jolliffe, I.T.1986. Principal component analysis. Springer-Verlag, New York.
- Kirkitadze, M., Condron, M.M., and Teplow, D.B. 2001. Identification and characterization of key kinetic intermediates in amyloid β-protein fibrillogenesis. J. Mol. Biol. 312: 1103–1119. [DOI] [PubMed] [Google Scholar]
- Kirkitadze, M.D., Bitan, G., and Teplow, D.B. 2002. Paradigm shifts in Alzheimer’s disease and other neurodegenerative disorders: The emerging role of oligomeric assemblies. J. Neurosci. Res. 69: 567–577. [DOI] [PubMed] [Google Scholar]
- Klein, W.L., Krafft, G.A., and Finch, C.E. 2001. Targeting small Aβ oligomers: The solution to an Alzheimer’s disease conundrum? Trends Neurosci. 24: 219–224. [DOI] [PubMed] [Google Scholar]
- Klein, W.L., Stine, W.B., and Teplow, D.B. 2004. Small assemblies of unmodified amyloid-Aβ protein are the proximate neurotoxin in Alzheimer’s disease. Neurobiol. Aging 25: 569–580. [DOI] [PubMed] [Google Scholar]
- Lambert, M.P., Barlow, A.K., Chromy, B.A., Edwards, C., Freed, R., Liosatos, M., Morgan, T.E., Rozovsky, I., Trommer, B., Viola, K.L., et al. 1998. Diffusible, nonfibrillar ligands derived from A β (1–42) are potent central nervous system neurotoxins. Proc. Natl. Acad. Sci. 95: 6448–6453. [DOI] [PMC free article] [PubMed] [Google Scholar]
- Lazo, N.D., Grant, M.A., Condron, M.C., Rigby, A.C., and Teplow, D.B. 2005. On the nucleation of amyloid β-protein monomer folding. Protein Sci. 14: 1581–1596. [DOI] [PMC free article] [PubMed] [Google Scholar]
- Lee, J.P., Stimson, E.R., Ghilardi, J.R., Mantyh, P.W., Lu, Y.-A., Felix, A.M., Llanos, W., Behbin, A., Cummings, M., Van Criekinge, M., et al. 1995. H-1-NMR of A-β amyloid peptide congeners in water solution—Conformational-changes correlate with plaque competence. Biochemistry 34: 5191–5200. [DOI] [PubMed] [Google Scholar]
- Lee, M.S., Salsbury Jr., F.R., and Brooks III, C.L. 2002. Novel generalized Born methods. J. Chem. Phys. 116: 10606–10614. [Google Scholar]
- Lomakin, A., Chung, D.S., Benedek, G.B., Kirschner, D.A., and Teplow, D.B. 1996. On the nucleation and growth of amyloid β-protein fibrils: Detection of nuclei and quantitation of rate constants. Proc. Natl. Acad. Sci. 93: 1125–1129. [DOI] [PMC free article] [PubMed] [Google Scholar]
- MacKerell Jr., A.D., Bashford, D., Bellott, M., Dunbrack Jr., R.L., Evanseck, J.D., Field, M.J., Fischer, S., Gao, J., Guo, H., Ha, S., et al. 1998. All-atom empirical potential for molecular modeling and dynamics studies of proteins. J. Phys. Chem. B 102: 3586–3616. [DOI] [PubMed] [Google Scholar]
- Malinchik, S.B., Inouye, H., Szumowski, K.E., and Kirschner, D.A. 1998. Structural analysis of Alzheimer’s Aβ (1–40) amyloid: Protofilament assembly of tubular fibrils. Biophys. J. 74: 537–545. [DOI] [PMC free article] [PubMed] [Google Scholar]
- Mason, E.A. and McDaniel, E.W.1988. Transport properties of ions in gases. Wiley, New York.
- Massi, F., Peng, J.W., Lee, J.P., and Straub, J.E. 2001. Simulation study of the structure and dynamics of the Alzheimer’s amyloid peptide congener in solution. Biophys. J. 80: 31–44. [DOI] [PMC free article] [PubMed] [Google Scholar]
- Mesleh, M.F., Hunter, J.M., Shvartsburg, A.A., Schatz, G.C., and Jarrold, M.F.1996.Structuralinformationfromionmobilitymeasurements:Effects of the long-range potential. J. Phys. Chem. 100: 16082–16086. [Google Scholar]
- Nymeyer, H., Gnanakaran, S., and Garcia, A.E. 2004. Atomic simulations of protein folding, using the replica exchange algorithm. Methods Enzymol. 383: 119–149. [DOI] [PubMed] [Google Scholar]
- Oda, T., Wals, P., Osterburg, H.H., Johnson, S.A., Pasinetti, G.M., Morgan, T.E., Rozovsky, I., Stine, W.B., Snyder, S.W., Holzman, T.F., et al. 1995. Clusterin alters the aggregation of amyloid β-peptide (a-β(1–42)) and forms slowly sedimenting a-β complexes that cause oxidative stress. Exp. Neurol. 136: 22–31. [DOI] [PubMed] [Google Scholar]
- Petkova, A.T., Ishii, Y., Balbach, J.J., Antzutkin, O.N., Leapman, R.D., Delaglio, F., and Tycko, R. 2002. A structural model for Alzheimer’s β-amyloid fibrils based on experimental constraints from solid state NMR. Proc. Natl. Acad. Sci. 99: 16742–16747. [DOI] [PMC free article] [PubMed] [Google Scholar]
- Petkova, A.T., Buntkowsky, G., Dyda, F., Leapman, R.D., Yau, W.-M., and Tycko, R. 2004. Solid state NMR reveals a pH-dependent anti-parallel β-sheet registry in fibrils formed by Aβ-amyloid peptide. J. Mol. Biol. 335: 247–260. [DOI] [PubMed] [Google Scholar]
- Pitera, J.W., and Swope, W. 2003. Understanding folding and design: Replica-exchange simulations of “Trp-cage” fly miniproteins. Proc. Natl. Acad. Sci. 100: 7587–7592. [DOI] [PMC free article] [PubMed] [Google Scholar]
- Riek, R., Güntert, P., Döbeli, H., Wipf, B., and Wütrich, K. 2001. NMR studies in aqueous solution fail to identify significant conformational differences between the monomeric forms of two Alzheimer peptides with widely different plaque-competence, Aβ (1–40)(ox) and Aβ (1–42)(ox). Eur. J. Biochem. 268: 5930–5936. [DOI] [PubMed] [Google Scholar]
- Selkoe, D.J. 1999. Translating cell biology into therapeutic advances in Alzheimer’s disease. Nature 399: A23–A31. [DOI] [PubMed] [Google Scholar]
- Serpell, L.C. 2000. Alzheimer’s amyloid fibrils: Structure and assembly. Biochim. Biophys. Acta 1502: 16–30. [DOI] [PubMed] [Google Scholar]
- Sugita, Y. and Okamoto, Y. 1999. Replica-exchange molecular dynamics method for protein folding. Chem. Phys. Lett. 314: 141–151. [Google Scholar]
- Swendsen, R.H. and Wang, J.-S. 1986. Replica Monte Carlo simulation of spin-glasses. Phys. Rev. Lett. 57: 2607–2609. [DOI] [PubMed] [Google Scholar]
- Tycko, R. 2003. Applications of solid state NMR to the structural characterization of amyloid fibrils: Methods and results. Prog. NMR Spectrosc. 42: 53–68. [Google Scholar]
- ———. 2004. Progress towards a molecular-level structural understanding of amyloid fibrils. Curr. Opin. Struct. Biol. 14: 96–103. [DOI] [PubMed] [Google Scholar]
- von Helden, G., Hsu, M.T., Kemper, P.R., and Bowers, M.T. 1991. Structures of carbon cluster ions from 3 to 60 atoms—Linears to rings to fullerenes. J. Chem. Phys. 95: 3835–3837. [Google Scholar]
- von Helden, G., Hsu, M.T., Gotts, N., and Bowers, M.T. 1993. Carbon cluster cations with up to 84 atoms—Structures, formation mechanism, and reactivity. J. Phys. Chem. 97: 8182–8192. [Google Scholar]
- Walsh, D.M., Hartley, D.M., Kusumoto, Y., Fezoui, Y., Condron, M.M., Lomakin, A., Benedek, G.B., Selkoe, D.J., and Teplow, D.B. 1999. Amyloid β-protein fibrillogenesis—Structure and biological activity of protofibrillar intermediates. J. Biol. Chem. 274: 25945–25952. [DOI] [PubMed] [Google Scholar]
- Wang, J., Dickson, D.W., Trojanowski, J.Q., and Lee, V.M.Y. 1999. The levels of soluble versus insoluble brain Aβ distinguish Alzheimer’s disease from normal and pathologic aging. Exp. Neurol. 158: 328–337. [DOI] [PubMed] [Google Scholar]
- Wyttenbach, T., von Helden, G., Batka Jr., J.J., Carlat, D., and Bowers, M.T. 1997. Effect of the long-range potential on ion mobility measurements. J. Am. Soc. Mass Spectrom. 8: 275–282. [Google Scholar]
- Wyttenbach, T., Kemper, P.R., and Bowers, M.T. 2001. Design of a new electrospray ion mobility mass spectrometer. Int. J. Mass Spectrom. 212: 13–23. [Google Scholar]
- Younkin, S.G. 1995. Evidence that Aβ42 is the real culprit in Alzheimer’s-disease. Ann. Neurol. 37: 287–288. [DOI] [PubMed] [Google Scholar]
- Zagorski, M.G., Shao, H., Ma, K., Yang, J., Li, H., Zeng, H., and Zhang, Y. 2000. Amyloid Aβ (l–40) and Aβ (l–42) adopt remarkably stable, monomeric, and extended structures in water solution at neutral pH. Neurobiol. Aging 21: S10–S11. [Google Scholar]
- Zhang, S., Iwata, K., Lachenmann, M.J., Peng, J.W., Li, S., Stimson, E.R., Lu, Y.-A., Felix, A.M., Maggio, J.E., and Lee, J.P. 2000. The Alzheimer’s peptide Aβ adopts a collapsed coil structure in water. J. Struct. Biol. 130: 130–141. [DOI] [PubMed] [Google Scholar]