Abstract
φ-Values, a relatively direct probe of transition-state structure, are an important benchmark in both experimental and theoretical studies of protein folding. Recently, however, significant controversy has emerged regarding the reliability with which φ-values can be determined experimentally: Because φ is a ratio of differences between experimental observables it is extremely sensitive to errors in those observations when the differences are small. Here we address this issue directly by performing blind, replicate measurements in three laboratories. By monitoring within- and between-laboratory variability, we have determined the precision with which folding rates and φ-values are measured using generally accepted laboratory practices and under conditions typical of our laboratories. We find that, unless the change in free energy associated with the probing mutation is quite large, the precision of φ-values is relatively poor when determined using rates extrapolated to the absence of denaturant. In contrast, when we employ rates estimated at nonzero denaturant concentrations or assume that the slopes of the chevron arms (mf and mu) are invariant upon mutation, the precision of our estimates of φ is significantly improved. Nevertheless, the reproducibility we thus obtain still compares poorly with the confidence intervals typically reported in the literature. This discrepancy appears to arise due to differences in how precision is calculated, the dependence of precision on the number of data points employed in defining a chevron, and interlaboratory sources of variability that may have been largely ignored in the prior literature.
Keywords: φ-values, protein folding, stopped-flow mixing, FynSH3 domain
Since its introduction some 15 years ago (Garvey and Matthews 1989; Goldenberg et al. 1989; Matouschek et al. 1989), φ-value analysis has been applied with varying levels of completeness to more than two dozen proteins and has become the benchmark experimental method for characterizing folding transition states (Daggett and Fersht 2003). Recently, however, significant controversy has emerged over the precision that can be assigned to measures of this important experimental parameter (Sanchez and Kiefhaber 2003; Fersht and Sato 2004; Garcia-Mira et al. 2004; Settanni et al. 2005).
The controversy regarding φ precision stems from the following arguments: When ΔGU is plotted against RTln(kf) (= ΔG‡) for multiple mutations at a given position, the data cluster closely about a single line with a slope equal to the weighted φ of all of the mutations (Mok et al. 2001; Northey et al. 2002). Under these circumstances, however, the slopes of the lines connecting individual mutants, which correspond to the φ-values associated with specific substitutions, scatter about the slope of the best-fit line. Sanchez and Kiefhaber (2003) believe that this scatter reflects experimental error rather than real, context-dependent changes in φ. Based on this assumption they conclude that the significant variations observed when ΔΔGU is <7 kJ/mol indicate, in turn, that the φ-value reliability falls off rapidly below this cutoff. There appears, however, to be little direct evidence that experimental error dominates the observed scatter (Garvey and Matthews 1989). Indeed, it has been argued that the observed variations are dominated instead by real, mutation-specific changes in the folding mechanism (Fersht and Sato 2004).
In this paper we describe the results of a more direct test of the claimed relationship between φ-value reliability and ΔΔGU and also explore the relative merits of the various methods employed in the literature for calculating φ from experimental kinetic data. We have performed this study by employing blind, triplicate measurements of the folding of multiple mutants of the FynSH3 domain. We have used these measurements to determine the precision with which folding rates and φ are measured in our laboratories. The results of this study provide insights into the sources of variability that affect the precision of φ estimates under typical laboratory conditions using generally accepted laboratory practices.
Results
We have performed independent, triplicate measurements of the folding kinetics of the wild-type and seven-point mutations (at two sites) of the FynSH3 domain, a small, well-characterized two-state protein (Plaxco et al. 1998; Northey et al. 2002). To do so, the relevant proteins were expressed and purified in one laboratory and provided to the other two laboratories. Each laboratory was then assigned the task of collecting chevron curves for each protein under previously defined conditions (Maxwell et al. 2005) using the methods traditionally employed in that laboratory. No further guidance or instruction was provided, and thus the results presented here represent fully independent measurements. Of note, the methods employed in this study do not appear to differ in any significant, reported detail from the large majority of previously described protocols.
Cross-wise comparison of the 24 data sets we have obtained allows us to estimate the precision with which folding kinetics are typically determined in our laboratories. Moreover, given that a unique φ links any two pairs of folding and unfolding rates, irrespective of whether the φ-value so obtained is readily interpreted (Fersht and Sato 2004), these 24 data sets define 16 single- and 12 double-mutant φ-values per laboratory. We have used these to define the relationship between φ-value precision and ΔΔGU.
Chevron curve precision
We have defined experimental chevron curves for eight FynSH3 sequences (Fig. 1) using standard stopped-flow techniques. In order to judge whether the precision of these measurements is comparable to that of typical literature reports, we have evaluated the root-mean-squared errors in our chevron plots relative to those of 28 previously reported chevron curves (Maxwell et al. 2005) collected in 16 different laboratories (Fig. 2). In doing so we find that the mean, the median, and the maximum root-mean-squared residuals for our 24 individual chevron curves are smaller than the mean, the median, and the maximum errors in this large, diverse data set. It thus appears that the precision of our measurements compares favorably with typical literature values, suggesting that the magnitude of the experimental errors in our experiments may reflect what is typically encountered and reported on in the literature.
Figure 1.
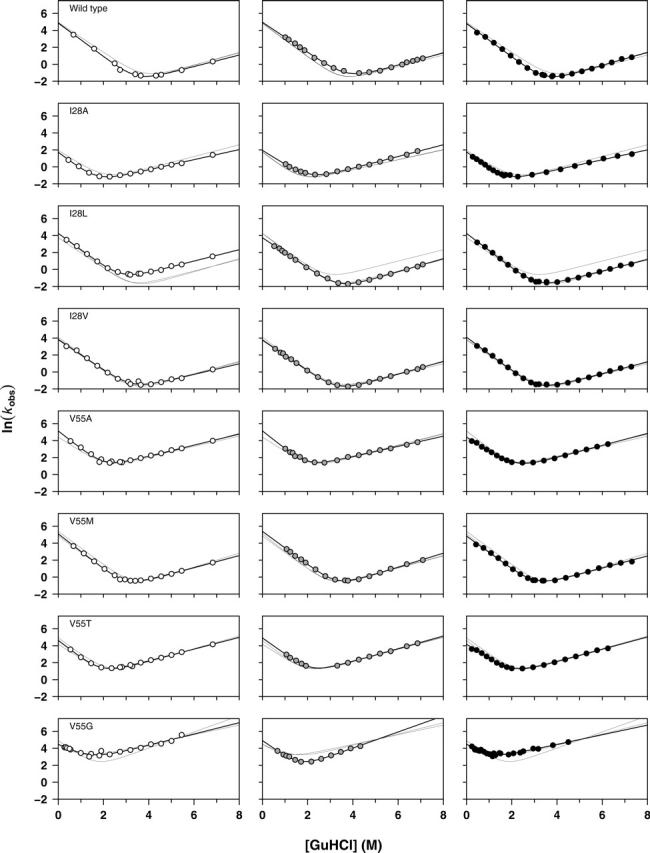
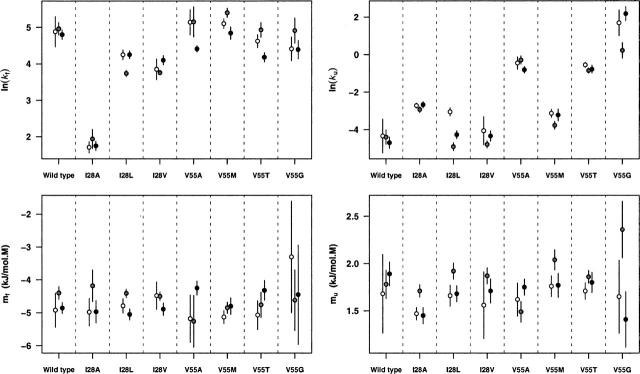
Chevron plots for the wild-type FynSH3 domain and the seven point mutants studied here. All three chevron fits are illustrated in each column, but the data points produced by each laboratory (white, gray, and black) are presented in separate columns for clarity. These data provide an indication of the precision with which folding and unfolding rates are measured in our laboratories under typical experimental conditions using generally accepted laboratory practices.
Figure 2.
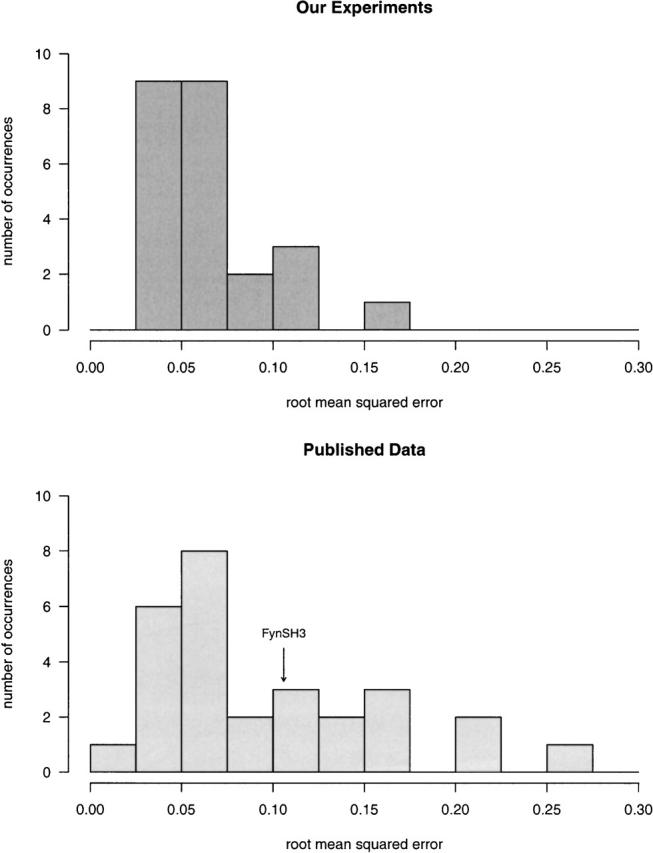
The precision of the kinetic measurements described here compares favorably with many previously reported in the literature. For example, the mean, the median, and the maximum root mean squared residuals associated with the 24 chevron curves we have determined (triplicate measurements of each of eight sequence, upper panel) are less than those of a set of 28 previously reported chevron curves determined in 16 different laboratories (lower panel) (Maxwell et al. 2005). Indicated is the precision with which the FynSH3 wild-type folding rate is defined by the previously reported data.
Rate constant and kinetic m-value precision
We have determined folding and unfolding rates and their associated kinetic m-values (mf and mu represent the slope of the folding and the unfolding arms of the chevron expressed in units of kJ/mol·M) for eight FynSH3 sequences (Fig. 1). Among these sequences, we do not observe any significant correlation between the precision with which ln(kf) is measured and its absolute value, suggesting that over this admittedly narrow span of folding rates (kf ranges from 6 to 160 sec −1) neither faster nor slower rates pose significant additional technical challenges for the stopped-flow techniques we have employed. When we define the reliability of ln(kf) (estimates of the unfolding rate in the absence of denaturant) as the standard deviation of independent measurements performed across our three laboratories, we find that the value is defined with a mean precision of 6% (Table 1). This is similar to previously reported estimates of the deviation in replicate folding-rate measurements (Zarrine-Afsar and Davidson 2004). Consistent with the longer extrapolations employed in their estimation, however, the standard deviations of our three estimates of ln(ku) (estimates of the unfolding rate in the absence of denaturant) are poorer, ranging from 0.14 to 1.02 (Fig. 3). Of note, the scatter we observe for both ln(kf) and ln(ku) are somewhat larger than the errors estimated from the goodness of fit of individual chevrons. For example, whereas the standard deviations we observe in replicate measurements of ln(kf) correspond to naïve standard errors of 0.05 to 0.25 (σ/√3), the standard errors estimated from the fitting of single chevrons range only from 0.05 to 0.15, indicating that cross-correlations between the fitted parameters and intralaboratory variability may be nontrivial contributors to the observed imprecision. Indeed, with regard to the latter issue we find that the correlations between ln(kf) and ln(ku) obtained from the 24 chevron curves we have fit range from 0.30 to 0.56 (mean 0.38). The estimates for ln(kf) and ln(ku) thus cannot be considered independent, suggesting, in turn, that error bars based on naive estimates of standard errors of single chevron fits will be incomplete. The standard deviations of the observed kinetic m-values range from 0.08 to 0.72 kJ/mol·M (Table 1), with the standard deviation in mf always being the greater of the two. The more limited precision in mf presumably arises due to the limited range of denaturant concentration over which the mutant proteins remain folded. When taken as standard error this 0.04–0.41 kJ/mol·M range is contained within the 0.03–0.66 kJ/mol·M range of estimated standard errors obtained from fitting individual data sets.
Table 1.
Kinetic and thermodynamic properties of FynSH3 and seven point mutants
| ln (kt)a | mf (kJ/mol.M) | ln (ku)a | mu (kJ/mol.M) | ΔGu (kJ/mol) | meq (kJ/mol.M) | |
| WT | 4.88 (0.08) | −4.73 (0.28) | −4.48 (0.19) | 1.78 (0.11) | 23.20 (0.35) | −6.51 (0.30) |
| V55T | 4.58 (0.38) | −4.72 (0.38) | −0.73 (0.16) | 1.79 (0.08) | 13.15 (1.06) | −6.51 (0.34) |
| V55M | 5.11 (0.28) | −4.93 (0.18) | −3.37 (0.35) | 1.86 (0.16) | 21.04 (1.48) | −6.78 (0.18) |
| V55A | 4.90 (0.42) | −4.90 (0.56) | −0.52 (0.27) | 1.62 (0.13) | 13.43 (0.46) | −6.52 (0.45) |
| V55G | 4.57 (0.29) | −4.12 (0.72) | 1.36 (1.02) | 1.81 (0.49) | 7.95 (3.25) | −5.93 (1.02) |
| I28V | 3.90 (0.18) | −4.62 (0.23) | −4.40 (0.37) | 1.71 (0.16) | 20.58 (0.85) | −6.34 (0.28) |
| I28L | 4.08 (0.29) | −4.75 (0.32) | −4.08 (0.94) | 1.75 (0.14) | 20.22 (1.85) | −6.50 (0.21) |
| I28A | 1.80 (0.12) | −4.71 (0.46) | −2.77 (0.14) | 1.54 (0.14) | 11.34 (0.64) | −6.25 (0.32) |
Mean and standard deviations observed across three laboratories.
a Extrapolated rates in the absence of denaturant.
Figure 3.
A comparison of the three sets of measurements described here. No systematic errors are observed in the scatter in the kinetic parameters ln(kf), ln(ku) (both extrapolations to zero denaturant), mf, or mu (the slopes of the folding and the unfolding chevron arms, respectively); no one research group systematically over- or underestimated any of these parameters. The error bars represent 95% confidence intervals for fits of the chevron data. The symbol scheme is as described in Fig. 1.
Systematic vs. random errors in measuring kinetics
Each of the three laboratories collaborating in this effort employed different stopped-flow equipment to determine folding kinetics. Nevertheless, we observe no significant, systematic laboratory-to-laboratory variation; no one laboratory consistently over- or underestimated either folding or unfolding rates, and none of the three laboratories produced values consistently farther from the mean than those of the other laboratories (Fig. 3).
φ-Value precision
φ-Values can be defined from chevron data via the equation
 |
(1) |
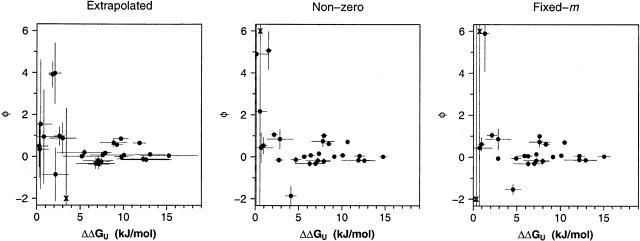
where the prime mark (′) denotes the relevant parameters for the mutant protein. At least three methods of estimating the relevant folding and unfolding rates for use in this equation have been reported in the literature. Perhaps the most straightforward and most commonly employed of these is to calculate φ from folding and unfolding rates extrapolated to zero denaturant conditions (we term this the “extrapolation method”). An advantage of the extrapolation method is that it makes no a priori assumptions about whether mutation can affect the slope of a chevron, nor does it require the perhaps arbitrary selection of nonzero denaturant concentrations at which to estimate rates. Conversely, however, the approach often relies on long extrapolations between the actual, experimental observations (necessarily collected at nonzero denaturant concentrations) and the estimated rates employed in the final φ determination. These extrapolations tend to degrade the precision with which rates, and thus φ, are determined. In order to avoid this potential difficulty, many groups have defined φ using folding and unfolding rates estimated at nonzero denaturant concentrations (we have arbitrarily picked 1 M and 5 M for kf and ku, respectively) or by assuming that mf and mu are fixed to a common value for all mutants (we term these approaches “nonzero” and “fixed-m”, respectively). We have calculated φ-values using all three approaches and find that, when ΔΔGU is high, the nonzero and fixed-m methods produce more precisely defined φ-values than the extrapolation method. However, while we find that the φ-values of these mutations as derived using each of the three methods are closely similar, small but statistically significant deviations are observed (data not shown). This is not surprising given the differing assumptions that underlie the three methods. Moreover, given these differing assumptions, the fixed-m and nonzero approaches cannot be regarded as better approaches per se.
The relationship between φ-value precision and folding free energy changes
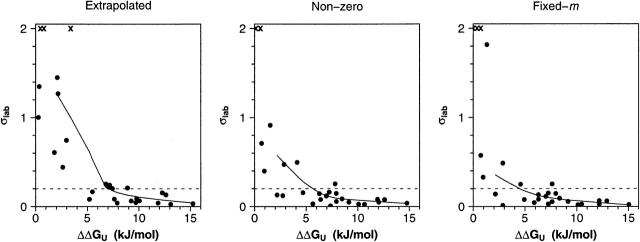
The precision of all three approaches for measuring φ depends significantly on the extent to which the probing mutation affects ΔΔGU. For example, using the extrapolation method (Figs. 4, 5, left) we find that the standard deviations (across three independent measurements) of the majority of our φ estimates rise >0.2 if ΔΔGU falls < ~7.5 kJ/mol (~1.8 kcal/mol). (We note, too, that the width of the 95% confidence intervals associated with this will be several times greater than this standard deviation.) Above the 7.5 kJ/mol cutoff, however, replicate measurements of φ are much more consistent. In contrast, the range over which reasonably precise φ-values can be determined is noticeably improved using the nonzero and fixed-m method (Figs. 4, 5, middle and right).
Figure 4.
Shown here are the average ΔΔGu values and average φ-values obtained from independent measurements across three laboratories. The horizontal and the vertical bars present the standard deviations of the respective measurements. As indicated by the rapid increase in the size of the error bars on the left-hand sides of these plots, we find that the precision with which we can measure φ is reasonable when the estimated ΔΔGU is high but becomes quite poor at lower ΔΔGU. At larger ΔΔGU the precision of estimates of φ is significantly improved when we employ the nonzero and fixed-m analysis methods, an observation that also holds for estimates of ΔΔGU. Several data points are simply indicated with the symbol “x” at the top of the plot for clarity.
Figure 5.
Shown are the observed experimental standard deviations of the 28 φ-values reported here as a function of the mean observed ΔΔGU for each of the three analysis methods we have employed. To illustrate the differences in φ-value variability that result from the three different estimation approaches, a line using a scatter-plot smoother was added. For both the nonzero and the fixed-m approach, the standard deviation of the φ-values among the three laboratories drops below the arbitrarily chosen line at 0.2 at a value of ΔΔGU of ~5 kJ/mol, while for the approach using extrapolation to zero denaturant, this value is ~7.5 kJ/ mol. The “x” symbols on the upper axis denote estimates that lie above σ = 2.
Are our mutations representative?
When ΔΔGU is high, mutations at position 28 typically generate φ of ~0.65, whereas mutations at position 55 typically produce φ of ~0. These values span the range covered by the large majority of reported φ-values (Sanchez and Kiefhaber 2003). Of the 28 single and double substitutions connecting our eight sequences, mutations at both positions 28 and 55 are reasonably well-represented (and reasonably precisely measured) when ΔΔGU is high. Similarly, the falloff in precision observed at lower free energy changes generally holds for mutations at both positions, albeit the reduced number of data points renders it difficult to address this issue quantitatively. It thus appears that the results presented here can be generalized to the study of other mutations, at least when employing the techniques and conditions typical of our laboratories.
Systematic errors in φ analysis
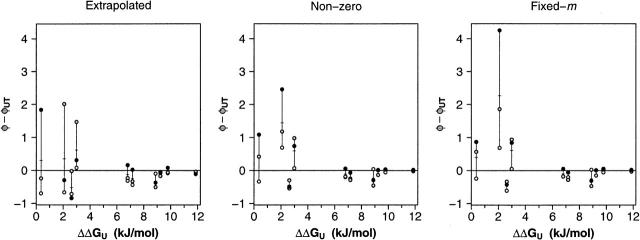
The inability to measure φ precisely when ΔΔGU is low appears to hold across each of the three laboratories participating in this study. For example, pair-wise comparisons among the laboratories produce no evidence that any one group is systematically over- or underestimating φ, and none of the laboratories’s φ-values are systematically farther from the three-laboratory mean (e.g., Fig. 6; data not shown). An additional check for systematic variation is provided by data collected by Davidson and coworkers at the University of Toronto (UT) (Northey et al. 2002), who have previously characterized the folding kinetics of several of the mutants employed in this study. Using their data we have calculated “nonzero” φ-values for 10 of the 28 single- and double-mutant substitutions characterized here (Table 2). Despite the differing experimental conditions employed in the two studies, the individual data sets produced by our laboratories are well correlated with those calculated from Davidson’s data when ΔΔGU is large. Nevertheless, almost all of the φ estimates produced by the three laboratories differ significantly from the corresponding UT-derived values when ΔΔGU is lower (Fig. 6).
Figure 6.
When ΔΔGU is large, φ-values derived independently in each of our groups closely approach those calculated using previously reported data from an independent laboratory (φUT) (Northey et al. 2002). In contrast, rather large deviations are observed when ΔΔGU is smaller. The crossed bars indicate the mean of the values reported here. Otherwise, the symbol scheme is as described above (Fig. 1).
Table 2.
Pairwise φ values
| Extrapolated | UT valuesa | ||
| Proteins | φ (σ) | ΔΔGu (σ) | φ |
| Wt-I28A | 0.64 (0.04) | 11.9 (0.7) | 0.71 |
| Wt-I28L | 0.87 (0.75) | 3.0 (1.6) | 0.25 |
| Wt-I28V | 0.98 (0.44) | 2.6 (0.6) | 1.50 |
| Wt-V55A | −0.01 (0.09) | 9.8 (0.8) | 0.01 |
| Wt-V55M | −0.84 (1.24) | 2.2 (1.6) | |
| Wt-V55T | 0.07 (0.06) | 10.1 (1.2) | |
| Wt-V55G | 0.05 (0.03) | 15.3 (3.3) | |
| I28A-I28L | 0.66 (0.21) | 8.9 (1.6) | 0.98 |
| I28A-I28V | 0.56 (0.06) | 9.2 (0.7) | 0.66 |
| I28A-V55A | 3.99 (1.47) | 2.1 (0.7) | 3.62 |
| I28A-V55M | 0.85 (0.04) | 9.7 (0.9) | |
| I28A-V55T | 3.93 (0.62) | 1.8 (0.5) | |
| I28A-V55G | −6.32 (8.55) | 3.4 (2.6) | |
| I28L-I28V | 0.34 (1.37) | 0.4 (1.0) | 0.04 |
| I28L-V55A | −0.34 (0.25) | 6.8 (2.2) | −0.21 |
| I28L-V55M | 0.94 (2.24) | 0.8 (1.8) | |
| I28L-V55T | −0.19 (0.22) | 7.1 (1.8) | |
| I28L-V55G | −0.12 (0.15) | 12.3 (3.0) | |
| I28V-V55A | −0.37 (0.24) | 7.2 (1.2) | −0.12 |
| I28V-V55M | 1.55 (3.09) | 0.5 (1.3) | |
| I28V-V55T | −0.24 (0.20) | 7.4 (1.0) | |
| I28V-V55G | −0.15 (0.13) | 12.6 (2.9) | |
| V55A-V55M | 0.07 (0.08) | 7.6 (1.4) | |
| V55A-V55T | 0.49 (1.01) | 0.3 (1.0) | |
| V55A-V55G | 0.19 (0.16) | 5.5 (3.1) | |
| V55M-V55T | 0.17 (0.04) | 7.9 (0.4) | |
| V55M-V55G | 0.10 (0.02) | 13.1 (1.8) | |
| V55T-V55G | 0.01 (0.08) | 5.2 (2.2) | |
Mean and standard deviations across three laboratories; ΔΔGU in kJ/mol.
aValues calculated from kinetic data reported in Northey et al. (2002).
Potential sources of error in φ analysis
Intralaboratory sources of variability can limit the precision with which φ can be measured. Due to the inevitability of experimental error, φ-values cannot be determined with infinite precision with only a finite number of observations. Thus, in addition to the magnitude of this experimental error and the magnitude of ΔΔGU, φ precision is also a function of the number of data points used to define the required chevron curves. In order to demonstrate the relationship between the precision of a single estimate of φ and the number of observations used to define it, we have simulated 10-, 20-, and 40-point chevron curves using our observed chevron curves and experimental errors for the wild-type protein and mutants I28A and I28V (Fig. 7). These substitutions were chosen to represent high ΔΔGU and low ΔΔGU substitutions, respectively. We find that, in both cases, φ precision is approximately proportional to the square root of the number of observed data points.
Figure 7.
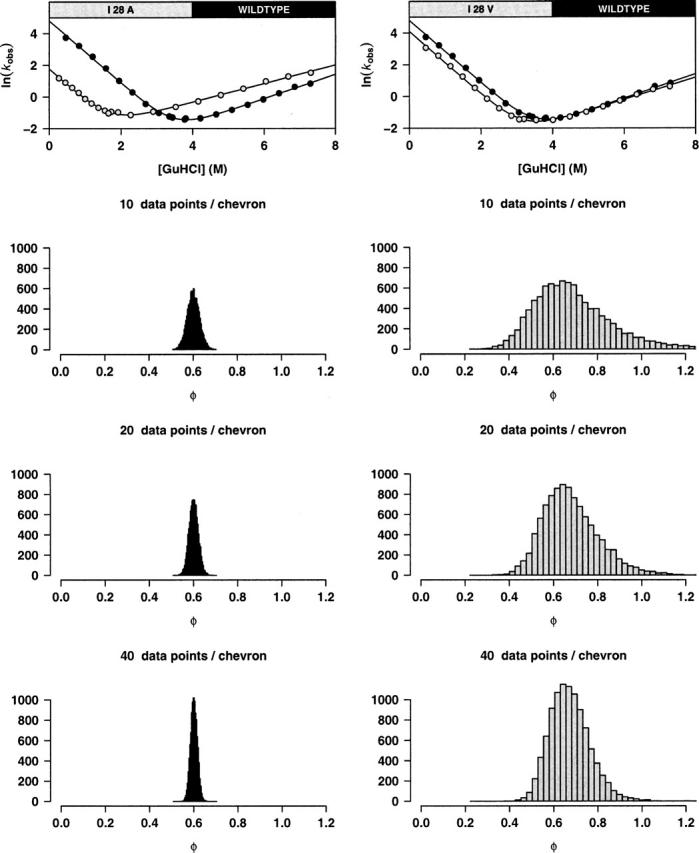
The precision of a single estimate of φ (i.e., based on kinetic data collected by a single laboratory in a single experiment) is approximately proportional to the square root of the number of kinetic observations employed to define the relevant chevron curves. For substitutions producing both large (12.5 kJ/mol, left) and small (2.6 kJ/mol, right) ΔΔGU we used the fitted chevron curves and the estimated experimental errors to carry out a simulation study. Ten thousand new chevron curves were generated from each data set by picking a fixed number of equally spaced points on the original chevron curves and adding Gaussian noise with standard deviation equal to the observed experimental error. When plotted as histograms, the resulting 10,000 estimated φ-values illustrate the dependency of φ precision on both ΔΔGU and the number of data points employed.
Interlaboratory sources of variability also impact φ precision. In order to demonstrate this, we have analyzed our estimated folding parameters, ln(kf), ln(ku), mf, and mu, in more detail. While simple inspection suggests that the estimates for these parameters vary significantly for some sequences (Fig. 3), we have formally tested this hypothesis. For all eight sequences, we conducted likelihood ratio tests to investigate the significance of the differences between the estimated kinetic parameters. For each mutant, these (asymptotically χ2) tests compare the likelihood obtained from fitting a single chevron curve to the data from the three laboratories combined to the likelihood obtained for allowing separate chevron curves. We find that, even when the three, independently collected chevron curves appear effectively indistinguishable (e.g., I28V as seen in Fig. 1), the differences between the estimated parameters are highly statistically significant (all p-values < 0.00015; data not shown). It thus appears that, even with kinetic data that appear (by eye) to overlap quantitatively, interlaboratory sources of variability contribute significantly to uncertainty associated with experimentally determined φ-values.
Discussion
We find that, using the practices and conditions generally employed in our laboratories we can estimate ln(kf) and ln(ku) with a precision of a few percent. φ, however, is a ratio of the differences between these experimental observables and thus is extremely sensitive to errors when the difference is small. Because of this, and despite the precision in ln(kf) that we achieve, the standard deviation of our blind, triplicate φ-value measurements based on these extrapolations is poor unless ΔΔGU is rather large. In contrast, our ability to measure φ reliably is significantly improved when we employ folding and unfolding rates estimated at nonzero denaturant concentrations or when we adopt the assumption that mf and mu are fixed. We note, however, that the latter approaches reflect a trade-off. The improved precision is matched by a requirement to select somewhat arbitrary denaturant concentrations or on the potentially mechanistically unjustified assumptions that mf and mu are invariant upon mutation.
It appears universally accepted that estimates of φ become uselessly imprecise as ΔΔGU becomes arbitrarily small. The results reported here nevertheless appear to violate conventional wisdom, which typically places the φ reliability cutoff at 0.8–2.9 kJ/mol (0.2–0.7 kcal/mol) (e.g., Riddle et al. 1999; Hamill et at. 2000; Friel et al. 2003; Fersht and Sato 2004; Garcia-Mira et al. 2004; Settanni et al. 2005). Several potential sources for this discrepancy are apparent. First, because detailed description of the methods employed to estimate confidence intervals on φ are almost universally lacking in the prior literature, it is difficult to directly compare previous claimed levels of precision with those reported here. Furthermore, even assuming that proper error propagation has been employed in the literature (Zarrine-Afsar and Davidson 2004), such methods typically assume independent errors in ln(kf) and ln(ku) (Sanchez and Kiefhaber 2003). As described above, however, this assumption does not hold for our data sets, suggesting that the literature estimates of φ standard errors may, by ignoring this potentially important effect, underestimate the true experimental errors. Second, the precision of φ-values derived using data collected within a single laboratory depends not only on the magnitude of ΔΔGU, but also on the precision with which individual rates are measured, the position of the inflection of the chevron curve (see, e.g., V55G in Fig. 1), and the quantity of data employed to define a chevron. Also, as some previous reports employed larger data sets, more suitable mutations, and/or more stable proteins than those employed here, it is reasonable to assume that some prior studies have achieved better precision (for single, intralaboratory φ-value estimates) than that reported here. We also note, however, that even the most reproducible single-laboratory measurement can miss important interlaboratory effects, a source of additional variability that appears to have been ignored in prior estimates of φ precision.
Our results cannot be taken as proof of the impossibility of accurately determining φ whenever ΔΔGU falls below some arbitrary cutoff, and we do not mean to imply that any single cutoff will hold universally across all studies and for all applications. It is clear, for example, that the appropriate cutoff will depend at least in part on the degree of precision required for a given study and on both inter- and intralaboratory sources variability (such as the number of data points employed) that, at least in principle, can be controlled. The cutoff also will depend on the degree to which the kinetic m-values change upon substitution (with each analysis method having a different dependence on this effect) and the denaturant dependence of φ, if any. It is thus our hope that, instead of being considered a “one-size-fits-all” benchmark for φ-value analysis, our work will encourage the field to address the critical issue of φ-value precision with more rigor and completeness than has historically been the norm.
Last, the results reported here should provide some guidance for the comparison of simulation and experiment. Contemporary theoretical and computational methods have achieved a level of sophistication that allows them to predict φ-value patterns (Daggett et al. 1998; Alm et al. 2002; Clementi et al. 2003; Daggett and Fersht 2003; Ejtehadi et al. 2004; Garbuzynskiy et al. 2004; Marianayagam and Jackson 2004; Settanni et al. 2005). But even if a simulation is arbitrarily accurate, the correlation between predicted and observed φ-values will ultimately be limited by the error inherent in the experimental measurements. For this reason, the observation that φ is poorly defined for mutations that do not significantly alter ΔGU suggests that greater emphasis should be placed on the prediction of φ-values associated with large ΔΔGU (albeit keeping in mind the important caveats raised by Fersht and Sato [2004], who note that the nonconservative mutations required to generate large ΔΔGU may produce difficult-to-interpret φ values because the mutations affect multiple side-chain interactions simultaneously). This, in turn, suggests that confidence-weighted fits of predicted versus observed φ-values might be a more appropriate test of theoretical results than simple, unweighted correlations. More generally, the results reported here also suggest that experimental φ-values must be employed with care when used to validate simulation results or test theoretical models of folding.
Materials and methods
Wild-type FynSH3 was expressed and purified as previously described (de los Rios and Plaxco 2005). Four mutations at position 55 and three at position 28 (see Table 1) were generated using standard protocols and confirmed by DNA sequencing. The protein was expressed in BL21 cells, purified via nickel affinity chromatography, dialyzed, lyophilized, and used without cleavage of the His-tag. All eight constructs were expressed and purified in one laboratory and shipped to the two collaborative laboratories. All experiments were conducted in 50 mM phosphate (pH 7), 25°C (Maxwell et al. 2005). Of note, the stability of wild-type FynSH3 is effectively independent of pH over the range from 6 to 9 (data not shown).
Kinetic and thermodynamic measurements
Characterization of the eight proteins was performed in replicate, with each of three laboratories performing one replicate experiment. The replicates were conducted blind; no data were shared until after the relevant experiments were completed, and—save for defining consensus temperature, buffer, and pH—no discussion regarding methods was conducted. The values of composite parameters (parameters derived from two or more kinetic or equilibrium measurements, such as ΔΔGU and φ) were determined independently from each laboratory’s data before being averaged.
The “white group” monitored folding using a pneumatically driven Applied Photophysics SX18MV stopped-flow fluorometer in pressure-hold mode. The protein was equilibrated in either 6 M GuHCl or in buffer for 1–2 h before measurements. Refolding/unfolding were initiated by dilution of these solutions into buffer with the appropriate concentration of GuHCl (solutions made volumetrically) at 25°C and monitored via fluorescence, with an excitation of 280 nm and emission detected >310 nm via a cutoff filter. At each GuHCl concentration, data from four to six experiments were fitted to single exponentials using the supplied software and the fitted rates averaged.
The “gray group” performed kinetic measurements of unfolding and folding using a π-Star pneumatically drive stopped-flow reaction analyzer (Applied Photophysics) in the fluorescence mode. Refolding was initiated by 1:10 dilutions of the protein in 5.98–6.37 M GuHCl into buffer with appropriate concentrations of GuHCl. GuHCl solutions were made volumetrically by diluting commercial, 8 M stock (Sigma). Folding and unfolding were monitored via fluorescence, with excitation and emission at 280 nm and 340 nm, respectively. Data were collected between 0 and 5 sec in oversampling and pressure-hold modes. For each condition, a minimum of 6–10 kinetic traces were averaged and fit to a monophasic decay equation using a nonlinear algorithm supplied. A final protein concentration of 10 μM was used both in folding and unfolding experiments.
The “black group” measured folding and unfolding rates using a Biologic SFM 4 stopped-flow device coupled to a Fluoromax 3 fluorometer. Excitation was from 270–290 nm and emission was recorded from 330–350 nm. All samples were temperature-equilibrated for 10 min each time the syringes were reloaded. A three-syringe, two-mixer setup was employed, where syringe 1 contained buffer at 0 M GuHCl for refolding and 8 M GuHCl for unfolding; syringe 2 contained buffer at the concentration midpoint for denaturation; and syringe 3 contained either native or unfolded protein. All GuHCl concentrations were determined from the index of refraction of the solutions (Nozaki 1972). Reactions were initiated by diluting the protein 10-fold into various concentrations of GuHCl, which were determined by adjusting the relative volumes delivered by syringes 1 and 2. Five curves were recorded for each denaturant concentration and averaged. The resulting traces were fit to a single exponential decay using the program SigmaPlot.
Comparison with prior literature estimates of experimental chevron precision
In order to compare the precision of our rate data with the experimental precision typically obtained in the field, we calculated root-mean-squared errors, as residuals of ln(kobs), for the 24 individual chevron plots we have obtained (one per lab per sequence) (Fig. 2) with those from previously published chevron data reported in Maxwell et al. (2005). These were defined as the square root of the mean residual squared error, obtained by fitting our data and the previously published data to chevron curves. Maxwell et al. describes the folding kinetics of 30 apparently two-state protein domains characterized in 18 different laboratories under experimental conditions to similar or identical those employed here. Omitted from our analysis were the proteins EC298 and U1A; only six T-jump data points are reported for the former and the latter exhibits significantly curved chevron arms.
Statistical analysis
Average estimates and standard deviations for blind triplicate measurements of folding and unfolding rates (extrapolated to zero denaturant) are reported (Table 1). Estimates and standard deviations are also reported for φ-values independently measured in each laboratory (i.e., using only that laboratory’s estimated folding and unfolding rates) (Tables 2,3).
Table 3.
Change in folding free energies and the standard deviations of triplicate φ
| Extrapolated | Nonzero | Fixed-m | ||||
| Mutation | ΔΔGU | σ (φ) | Δ ΔGU | σ (φ) | Δ ΔGU | σ (φ) |
| Wt-I28L | 2.98 | 0.74 | 2.86 | 0.47 | 2.86 | 0.49 |
| Wt-I28V | 2.62 | 0.44 | 2.17 | 0.13 | 2.14 | 0.14 |
| Wt-V55A | 9.78 | 0.09 | 9.13 | 0.05 | 9.15 | 0.06 |
| Wt-V55M | 2.17 | 1.27 | 2.73 | 0.12 | 2.86 | 0.01 |
| Wt-V55T | 10.07 | 0.06 | 10.08 | 0.03 | 10.11 | 0.02 |
| Wt-V55G | 15.26 | 0.03 | 14.77 | 0.04 | 15.05 | 0.02 |
| I28A-I28L | 8.88 | 0.21 | 7.79 | 0.25 | 7.61 | 0.25 |
| I28A-I28V | 9.24 | 0.06 | 8.48 | 0.09 | 8.34 | 0.09 |
| I28A-V55A | 2.08 | 1.45 | 1.52 | 0.91 | 1.32 | 1.82 |
| I28A-V55M | 9.70 | 0.04 | 7.92 | 0.06 | 7.62 | 0.05 |
| I28A-V55T | 1.79 | 0.61 | 0.57 | 10.63 | 0.37 | 60.88 |
| I28A-V55G | 3.40 | 8.73 | 4.12 | 0.49 | 4.57 | 0.25 |
| I28L-I28V | 0.36 | 1.35 | 0.68 | 0.71 | 0.72 | 0.57 |
| I28L-V55A | 6.80 | 0.25 | 6.27 | 0.14 | 6.29 | 0.13 |
| I28L-V55M | 0.82 | 2.24 | 0.12 | 8.63 | 0.01 | 32.27 |
| I28L-V55T | 7.08 | 0.22 | 7.22 | 0.16 | 7.25 | 0.15 |
| I28L-V55G | 12.28 | 0.15 | 11.91 | 0.08 | 12.18 | 0.06 |
| I28V-V55A | 7.16 | 0.24 | 6.95 | 0.12 | 7.02 | 0.11 |
| I28V-V55M | 0.46 | 3.08 | 0.56 | 7.7 | 0.72 | 50.27 |
| I28V-V55T | 7.44 | 0.20 | 7.91 | 0.15 | 7.97 | 0.15 |
| I28V-V55G | 12.64 | 0.13 | 12.59 | 0.08 | 12.91 | 0.06 |
| V55A-V55M | 7.61 | 0.08 | 6.4 | 0.08 | 6.30 | 0.08 |
| V55A-V55T | 0.29 | 1.00 | 0.95 | 0.4 | 0.96 | 0.33 |
| V55A-V55G | 5.48 | 0.17 | 5.64 | 0.03 | 5.89 | 0.04 |
| V55M-V55T | 7.90 | 0.04 | 7.35 | 0.01 | 7.25 | 0.03 |
| V55M-V55G | 13.10 | 0.02 | 12.04 | 0.05 | 12.19 | 0.03 |
| V55T-V55G | 5.20 | 0.08 | 4.69 | 0.16 | 4.93 | 0.08 |
Mean ΔΔGU as determined using the listed methods (from rates extrapolated to zero denaturant, etc.) in kJ/mol. σ represents the standard deviation of our sets of three independent φ value determinations.
In order to examine the relationship between the precision of a single estimate of φ (an intralaboratory measurement) and the number of kinetic observations that are used to define it (Fig. 7), we used the fitted chevron curves for wild type, I28A, and I28V and their estimated experimental errors to carry out a simulation study. New chevron curves were obtained from data generated by picking a fixed number of equally spaced points on the original chevron curves and adding Gaussian noise with standard deviation equal to the observed experimental error. This procedure was repeated 10,000 times for both the small and the large ΔΔGU settings and using 10, 20, and 40 data points. The resulting 10,000 estimated φ-values are plotted as histograms, clearly showing the dependence of the precision of φ on ΔΔGU and the number of data points.
Acknowledgments
We thank Alan Fersht and Alan Davidson for extensive and very helpful critical comments regarding this paper. This work was supported by NIH funding via grants GM62868-01A2 (to K.W.P.), GM59663 (to P.W.-S.), and GM50945 (to S.M.), and by grant C-1588 from the Robert A. Welch Foundation (to P.W.-S.). I.R. was supported by a faculty innovation award from Johns Hopkins University.
Abbreviations
GuHCl, guanidine hydrochloride
Article and publication are at http://www.proteinscience.org/cgi/doi/10.1110/ps.051870506.
References
- Alm, E., Morozov, A.V., Kortemme, T., and Baker, D. 2002. Simple physical models connect theory and experiment in protein folding kinetics. J. Mol. Biol. 322: 463–476. [DOI] [PubMed] [Google Scholar]
- Clementi, C., Garcia, A.E., and Onuchic, J.N. 2003. Interplay among tertiary contacts, secondary structure formation and side-chain packing in the protein folding mechanism: All-atom representation study of protein L. J. Mol. Biol. 326: 933–954. [DOI] [PubMed] [Google Scholar]
- Daggett, V. and Fersht, A. 2003. The present view of the mechanism of protein folding. Nat. Rev. Mol. Cell Biol. 4: 497–502. [DOI] [PubMed] [Google Scholar]
- Daggett, V., Li, A.J., and Fersht, A.R. 1998. Combined molecular dynamics and φ-value analysis of structure–reactivity relationships in the transition state and unfolding pathway of barnase: Structural basis of Hammond and anti-Hammond effects. J. Am. Chem. Soc. 120: 12740–12754. [Google Scholar]
- de los Rios, M.A. and Plaxco, K.W. 2005. Apparent Debye-Huckle electrostatic effects in the folding of a simple, single-domain protein. Biochemistry 44: 1243–1250. [DOI] [PubMed] [Google Scholar]
- Ejtehadi, M.R., Avall, S.P., and Plotkin, S.S. 2004. Three-body interactions improve the prediction of rate and mechanism in protein folding models. Proc. Natl. Acad. Sci. 101: 15088–15093. [DOI] [PMC free article] [PubMed] [Google Scholar]
- Fersht, A.R. and Sato, S. 2004. φ-value analysis and the nature of protein-folding transition states. Proc. Natl. Acad. Sci. 101: 7976–7981. [DOI] [PMC free article] [PubMed] [Google Scholar]
- Friel, C.T., Capaldi, A.P., and Radford, S.E. 2003. Structural analysis of the rate-limiting transition states in the folding of Im7 and Im9: Similarities and differences in the folding of homologous proteins. J. Mol. Biol. 326: 293–305. [DOI] [PubMed] [Google Scholar]
- Garbuzynskiy, S.O., Finkelstein, A.V., and Galzitskaya, O.V. 2004. Outlining folding nuclei in globular proteins. J. Mol. Biol. 336: 509–525. [DOI] [PubMed] [Google Scholar]
- Garcia-Mira, M.M., Bohringer, D., and Schmid, F.X. 2004. The folding transition of the cold shock protein is strongly polarized. J. Mol. Biol. 339: 555–569. [DOI] [PubMed] [Google Scholar]
- Garvey, E.P. and Matthews, C.R. 1989. Effects of multiple replacements at a single position on the folding and stability of dihydrofolate reductase from Escherichia coli. Biochemistry 28: 2083–2093. [DOI] [PubMed] [Google Scholar]
- Goldenberg, D.P., Frieden, R.W., Haack, J.A., and Morrison, T.B. 1989. Mutational analysis of a protein-folding pathway. Nature 338: 127–132. [DOI] [PubMed] [Google Scholar]
- Hamill, S.J., Steward, A., and Clarke, J. 2000. The folding of an immunoglobulin- like Greek key protein is defined by a common-core nucleus and regions constrained by topology. J. Mol. Biol. 297: 165–178. [DOI] [PubMed] [Google Scholar]
- Marianayagam, N.J. and Jackson, S.E. 2004. The folding pathway of ubiquitin from all-atom molecular dynamics simulations. Biophys. J. 111: 159–171. [DOI] [PubMed] [Google Scholar]
- Matouschek, A., Kellis, J.T., Serrano, L., and Fersht, A.R. 1989. Mapping the transition-state and pathway of protein folding by protein engineering. Nature 340: 122–126. [DOI] [PubMed] [Google Scholar]
- Maxwell, K.L., Wildes, D., Zarrine-Afsar, A., de los Rios, M.A., Brown, A.G., Friel, C.T., Hedberg, L., Horng, J.-C., Bona, D., Miller, E.J., et al. 2005. Protein folding: Defining a “standard” set of experimental conditions and a preliminary kinetic data set of two-state proteins. Protein Sci. 14: 602–616. [DOI] [PMC free article] [PubMed] [Google Scholar]
- Mok, Y.K., Elisseeva, E.L., Davidson, A.R., and Forman-Kay, J.D. 2001. Dramatic stabilization of an SH3 domain by a single substitution: Roles of the folded and unfolded states. J. Mol. Biol. 307: 913–928. [DOI] [PubMed] [Google Scholar]
- Northey, J.G., Maxwell, J.L., and Davidson, A.R. 2002. Protein folding kinetics beyond the φ value: Using multiple amino acid substitution to investigate the structure of the SH3 domain folding transition state. J. Mol. Biol. 320: 389–402. [DOI] [PubMed] [Google Scholar]
- Nozaki, Y. 1972. The preparation of guanidine hydrochloride. Methods Enzymol. 26: 43–50. [DOI] [PubMed] [Google Scholar]
- Plaxco, K.W., Guijarro, J.I., Morton, C.J., Pitkeathly, M., Campbell, I.D., and Dobson, C.M. 1998. The folding kinetics and thermodynamics of the Fyn-SH3 domain. Biochemistry 37: 2529–2537. [DOI] [PubMed] [Google Scholar]
- Riddle, D.S., Grantcharova, V.P., Santiago, J.V., Alm, E., Ruczinski, I., and Baker, D. 1999. Experiment and theory highlight role of native state topology in SH3 folding. Nat. Struct. Biol. 6: 1016–1024. [DOI] [PubMed] [Google Scholar]
- Sanchez, I.E. and Kiefhaber, T. 2003. Origin of unusual φ-values in protein folding: Evidence against specific nucleation sites. J. Mol. Biol. 334: 1077–1085. [DOI] [PubMed] [Google Scholar]
- Settanni, G., Rao, F., and Caflish, A. 2005. φ-Value analysis by molecular dynamics simulations of reversible folding. Proc. Natl. Acad. Sci. 102: 628–633. [DOI] [PMC free article] [PubMed] [Google Scholar]
- Zarrine-Afsar, A. and Davidson, A.R. 2004. The analysis of protein folding kinetic data produced in protein engineering experiments. Methods 34: 41–50. [DOI] [PubMed] [Google Scholar]


