Abstract
High-pressure freezing of Escherichia coli K-12 and Pseudomonas aeruginosa PAO1 in the presence of cryoprotectants provided consistent vitrification of cells so that frozen-hydrated sections could be cut, providing ∼2-nm resolution of structure. The size and shape of the bacteria, as well as their surface and cytoplasmic constituents, were nicely preserved and compared well with other published high-resolution techniques. Cells possessed a rich cytoplasm containing a diffuse dispersion of ribosomes and genetic material. Close examination of cells revealed that the periplasmic space was compressed during cryosectioning, a finding which provided supporting evidence that this space is filled by a compressible gel. Since the outer membrane and peptidoglycan layer are bonded together via lipoproteins, the space between them (although still part of the periplasmic space) was not as compacted. Even when this cryosectioning compression was taken into account, there was still substantial variability in the width of the periplasmic space. It is possible that the protoplast has some capacity to float freely within the periplasm.
Transmission electron microscopy (TEM) of ultrathin sections of prokaryotes constitutes a basic technique for the examination of bacterial structure. TEM is one of the few available methods to decipher the interior of cells and to observe the juxtaposition of boundary layers such as plasma membranes and cell walls. TEM is also useful for establishing the cells' interactions with the surrounding environment (4, 6, 8, 9, 11, 26). Thin sectioning of conventionally embedded specimens gives limited information about cellular structures and their macromolecular constituents, since the required chemical fixation, dehydration, embedding, and heavy-metal staining processes produce artifacts that are difficult to assess (7, 11). Preparative methods for TEM employing rapid freezing and vitrification of cells for physical fixation are being used increasingly in the study of eukaryotic cells (including tissues), thus resulting in better preservation and visualization of structure (12-14, 21, 27, 32, 36).
Because of their small size and difficult manipulation, prokaryotes have not been as readily studied by using so-called modern cryotechniques, although freeze-etching and freeze-substitution have shown impressive advances over the last decade (2, 5, 9, 17, 20, 40). Indeed, freeze-etching has been a method in microbiology since the early 1960s (28), yet it has limited potential since there is little control over the fracture plane, and it is best used for the study of membrane and S-layer structure (40). Freeze-substitution has presented better views of bacteria, revealing an evenly dispersed cytoplasm, a concentrated periplasm (the “periplasmic gel”) (20), and an outer membrane (OM) complete with its phospholipid-lipopolysaccharide (LPS) asymmetry (3, 5, 9, 16, 17); even the O-side chains have been viewed (25).
Since the discovery of vitrification, cryo-TEM has shown it to be an optimal method for the preservation of biological structure (10, 12, 13, 19, 21, 37, 40). Samples are so rapidly frozen that ice crystals do not form, thereby embedding the cell in an amorphous “glass” of ice for examination in the microscope and using a minimal electron dose. Cryo-TEM of thin vitreous films, or foils, has become a routine high-resolution technique for the study of isolated small particles such as viruses, proteins, macromolecular assemblies, and vesicles (19). The thin-film technique is not suitable for larger objects such as bacteria because of their thickness and mass. The most accurate cryotechnique for viewing prokaryotic ultrastructure involves the use of frozen-hydrated sections. Like freeze-substitution, bacteria are vitrified to physically fix the cells and stop molecular motion. But here, the resemblance stops, since instead of chemically fixing the frozen structures with chemical fixatives and dehydrating cells through substitution so that plastic sections can eventually be made, the vitrified bacteria are sectioned, and sections are viewed while frozen at extremely low temperatures. Of course, these are difficult procedures, and further complicating imaging, no stains can be used. Instead, phase contrast must be employed so that the structure of the cell can be drawn out from the vitrified ice. Remarkably good images result that can then be correlated with images produced by more conventional techniques (11).
Obviously, the advantages of viewing hydrated frozen samples are substantial since few artifacts are generated during vitrification. Yet the sectioning process itself produces artifacts, but these are related to the cutting direction and can be systematically evaluated (13). Recent improvements to the sectioning apparatus, combined with high-pressure freezing (HPF), have given improved reliability to the production of frozen-hydrated thin sections (41). HPF decreases the freezing temperature of water as well as the tendency of small particles (bacteria) to nucleate ice crystal formation, thereby increasing the vitrification depth by a factor on the order of 10 or more, tremendously facilitating the cryosectioning of biological samples (10, 38). Here we report on the use of HPF for the production of frozen-hydrated sections of the two most studied gram-negative bacteria, Pseudomonas aeruginosa PAO1 and Escherichia coli K-12. This is the first report of the use of HPF for the production of frozen-hydrated sections of bacteria.
MATERIALS AND METHODS
Growth, freezing, and sectioning of bacteria.
P. aeruginosa PAO1 and E. coli K-12 were grown in Trypticase soy broth containing 15% (wt/wt) sucrose to mid-exponential growth phase (optical density at 470 nm, 0.5 to 0.7) at 37°C. The sucrose was added as a cryoprotectant. Cells were washed twice in 15% sucrose in deionized water and centrifuged at 6,000 × g for 5 min so as to keep shear forces to a minimum and to pellet the bacteria. In a separate experiment, 20% (wt/vol) dextran (42 kDa) was also used as a cryoprotectant for strain PAO1. The pellets were frozen inside thin copper tubes (inner diameter, 350 μm) by using a Leica EM PACT high-pressure freezer. High-pressure freezing provided consistent vitrification of samples inside these copper tubes. Frozen samples, always kept at temperatures below −135°C, were then transferred to the cryochamber of a Leica Ultracut UCT ultramicrotome, with nominal section thickness set to 50 nm, and frozen-hydrated sections of cells in the copper tubes were cut as described previously (1). Continuous use of an antistatic device during sectioning of properly trimmed samples allowed the reproducible production of ribbons of frozen-hydrated sections of bacteria in a dehumidified room.
Cryo-TEM.
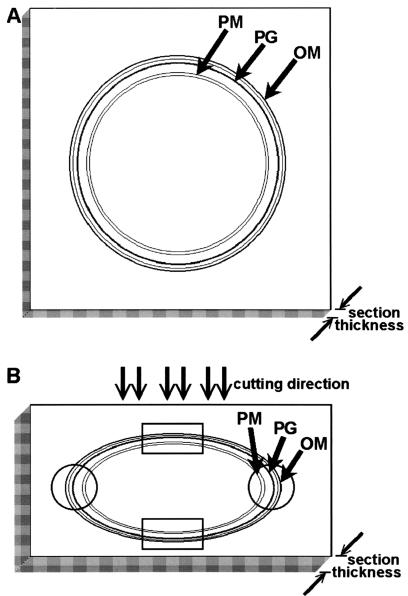
Grids containing the frozen-hydrated thin sections were mounted into a Gatan cryoholder for direct observation at −170°C in a Leo 912 AB energy-filtered cryo-TEM operating at 100 kV. Images were taken using a 1,024-by-1,024-pixel slow-scan charge-coupled device camera (Proscan). Images were stored and analyzed by using analySIS (SIS, Münster, Germany) software. Length measurements were done on the least deformed regions of cells (regions of high curvature; Fig. 1 shows details). To estimate compression on the bacterial envelopes, measurements of width of compartments in regions of lowest curvature (highly deformed) were divided by the corresponding width in the high- curvature (not deformed) regions (Fig. 1) and are thus expressed as percentages.
FIG. 1.
Compression of the bacterial envelope in gram-negative cells during cryosectioning. (A) Schematic drawing of a cross-section in the absence of compression. (B) Schematic drawing of a highly compressed cross-section. The circles at each end of the cell enclose nondeformed regions of the envelope, while rectangles enclose highly deformed regions; compression along the cutting direction corresponds to an increase in the section thickness (see edges of each diagram).
RESULTS AND DISCUSSION
High-pressure freezing of bacteria.
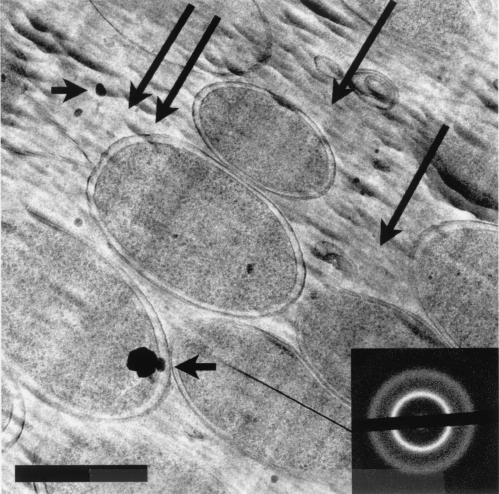
High-pressure freezing in the presence of a cryoprotectant provided consistent vitrification of the specimens as shown by selected-area electron diffraction and the two broad rings in the diffractogram (Fig. 2, inset). Vitrification was achieved at a lower concentration of sucrose than that of dextran, which may be due to a lower freezing point for the sucrose solution. It is possible that the lower-molecular-weight cryoprotectant (sucrose) could have an osmotic effect, but since the cells were grown with sucrose in the medium, any such effect was likely negligible.
FIG. 2.
An energy-filtered image of a frozen-hydrated section of E. coli K-12 shown at low magnification. The long arrows point to knife marks (running in the direction indicated by the arrows), and the shorter arrows point to ice crystal contamination. The inset shows corresponding electron diffraction pattern. Bar, 500 nm.
General interpretive problems with frozen-hydrated sections.
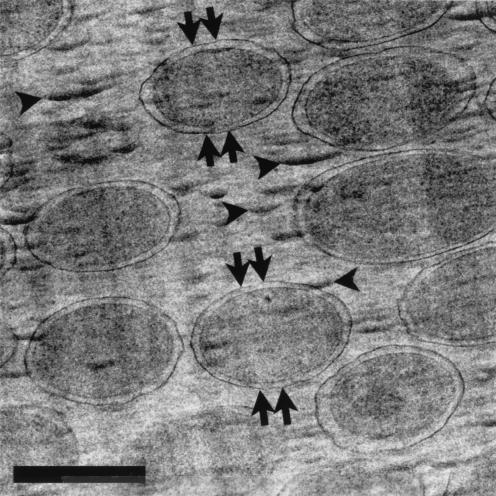
Bacteria are clearly visible in unfixed, unstained frozen-hydrated sections when phase-contrast imaging (Fig. 2 and 3) is used. Because these sections cannot be collected on a fluid surface with high surface tension (e.g., a water surface is used to float and stretch traditional plastic sections), all tensional stresses created during sectioning remain in the sections. Cutting artifacts are particularly visible at low magnifications (Fig. 2 and 3). These include knife marks (long arrows in Fig. 2), compression along the cutting direction (Fig. 1 and pointed out by the double arrows in Fig. 3), and crevasses (arrowheads in Fig. 3). Compression distorts the specimen so that it is dimensionally deformed (in one direction) as it is drawn over the knife's edge. This is why bacteria look more oblong than circular when cross-sectioned (Fig. 1, 4, and 5). Crevasses are a feature unique to frozen-hydrated sections and appear as 20- to 30-nm-wide fissures that are perpendicular to the cutting direction (Fig. 2). This results in local irregularities in the thickness of sections so that artificial localized mass differences are seen (21). Knife marks are produced by an uneven cutting edge, and this is the reason that an artifact such as this is seen throughout the length of the section (Fig. 3). For a more detailed discussion on frozen-hydrated section artifacts, see references 13, 21, and 34.
FIG. 3.
A frozen-hydrated section of P. aeruginosa PAO1 at low magnification. Compression along the cutting direction is indicated by the double arrows, and crevasses are indicated by arrowheads. Bar, 500 nm.
FIG. 4.
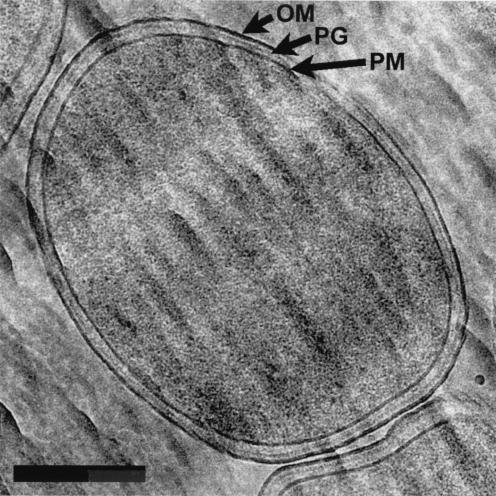
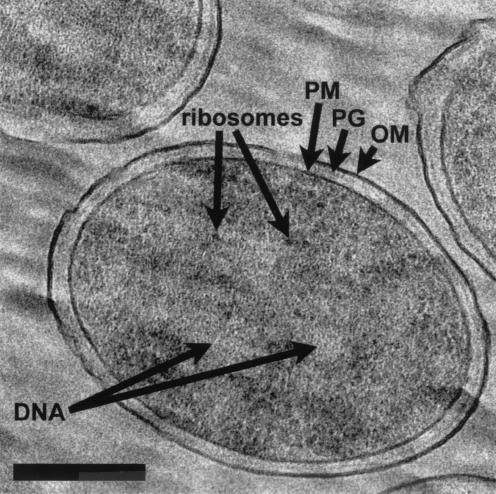
E. coli K-12 at higher magnification. OM, PG, and PM are clearly seen around cells, and the cytoplasm has an even distribution of ribosomes and genetic material. Bar, 200 nm.
Our system also suffers from another drawback. Since we rely on copper tubes of extremely narrow internal diameter for rapid thermal conduction, rod-shaped bacteria are subjected to capillary action as they are drawn into the tubes. This plus their high concentration and eventual packing order causes them to align parallel to the long axis of the tube (i.e., they form a nematic liquid crystal). For this reason, longitudinal sections of cells were rare, and only tangential sections and cross-sections were seen (Fig. 2 and 3). We believe that longitudinal sections can be obtained by using a specialized chuck in the cryoultramicrotome that allows the positioning of the copper tube at different angles to the knife's edge, and we are currently attempting to implement this and other design modifications to our existing equipment.
Frozen-hydrated thin sections of E. coli K-12 and P. aeruginosa PAO1.
The images obtained of both of these gram-negative bacteria are still remarkable, even keeping in mind the above-outlined problems. These images must be true to the natural state of both bacteria since, if vitrified samples are thawed, more than 70% of viability is regained (14, 29). Our protocol provides a high density of vitrified cells (Fig. 2 and 3) for detailed structural analysis.
Higher magnification of individual bacteria reveals that the width of PAO1 is approximately one-third less than that of K-12. Otherwise, P. aeruginosa (Fig. 4) and E. coli (Fig. 5) look markedly similar. Both bacteria possess an evenly distributed cytoplasm packed with ribosomes and a disbursed nucleoid with no visible aggregation of DNA fibers (Fig. 4 and 5). Intracellular particles, such as polyalkanoate, glycogen, or polyphosphate granules (8), were not seen.
FIG. 5.
P. aeruginosa PAO1 at higher magnification. The OM, PG, and PM are clearly seen around cells, and the cytoplasm has a similar appearance to that of E. coli in Fig. 4. Bar, 200 nm.
Cell envelope.
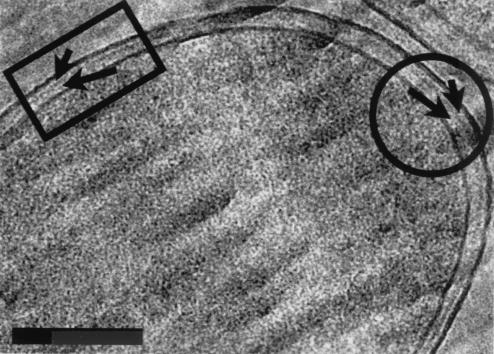
The cell envelope was clearly seen around all cells and consisted of the plasma membrane (PM), peptidoglycan (murein) layer (PG), and OM (Fig. 4 and 5). As mentioned previously, deformation makes the cross-sections in Fig. 4 and 5 more ellipsoid in shape and causes a contraction in the thickness of the PM, PG, and OM at the top and bottom of each cell (Fig. 1 and 6). In the other regions of each cell, these structures are better preserved and thicker (Fig. 1, 7, and 8). The periplasmic space (i.e., the space between the PM and the OM) was noticeably wider in the uncompressed regions (Table 1), a finding which adds to the debate about an accurate width for the periplasmic space (18). Since these frozen-hydrated cells are as close as possible to the natural state, these periplasmic measurements should be among the most accurate yet obtained. Unlike similar images of freeze-substituted bacteria, the periplasm contained within this space has little contrast and seems empty. This appears to contradict the concept of a periplasmic gel, but unlike the surrounding membranes, which possess substantial amounts of phosphorus in their constituent phospholipids and LPS, the periplasm contains (mostly) proteins and oligosaccharides (5, 18, 22). These are made up of low-atomic-number elements (e.g., C, H, and O), and their mass will not contribute greatly to the energy-filtered image. Furthermore, density profiles of the E. coli cell envelope in cryosections have shown the periplasm to be less dense than the cytoplasm (which we see in all our images), with respective densities of 1.05 and 1.11 g · ml−1 (11). In freeze-substituted images, the periplasm is apparent because it stains well with heavy-metal contrasting agents; in fact, it stains so well that it obscures the PG layer. The periplasm is not seen in conventional thin sections since it is leached from the cell during dehydration (5, 7, 8). Clearly, though, freeze-substitution and conventional thin sections have underestimated the width of the periplasmic space (18).
FIG. 6.
Enlarged view of Fig. 4 showing the uneven compression of the cell wall resulting from the force of cutting the thin section (see text for more detailed explanation). Comparison between highly deformed (rectangle) and nondeformed (rectangle) regions of the envelope shows that the space between PM and PG (long arrows) is more condensed than the space between PG and OM (short arrows). Bar, 150 nm.
FIG. 7.
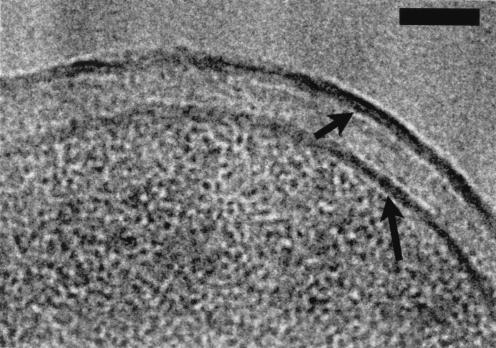
High magnification of the K-12 cell envelope showing the asymmetric densities of the two OM faces (short arrow) in contrast with the more symmetric PM (long arrow). Bar, 50 nm.
TABLE 1.
Measurements of structures, compartments, and compression of bacterial envelopesa
| Bacterial strain | Thickness (nm) of:
|
Periplasmic width (nm) | Distance between PG and OM (nm) | Avg compression (%) of:
|
||||
|---|---|---|---|---|---|---|---|---|
| PM | PG | OM | Periplasm | Space between cellular components
|
||||
| PG and OM | PM and PG | |||||||
| P. aeruginosa PAO1 | 5.95 ± 0.92 | 2.41 ± 0.54 | 7.48 ± 0.59 | 23.89 ± 3.86 | 6.15 ± 0.91 | 38.21 | 22.37 | 42.83 |
| E. coli K-12 | 5.84 ± 0.38 | 6.35 ± 0.53 | 6.87 ± 1.01 | 20.99 ± 2.69 | 5.34 ± 0.89 | 32.47 | 9.14 | 38.88 |
Values represent the means ± standard deviations for the eight measurements.
Measurements of the uncompressed regions of the periplasmic space showed another interesting feature: there was over 10% variability in its width in both E. coli and P. aeruginosa (Table 1). This suggests that the protoplast has some freedom of movement within the space. Clearly, certain macromolecular assemblages must span the periplasmic space for secretion (e.g., virulence factors) and transport of specific components (e.g., iron) (42), and these will have little tolerance for spatial distortion. It is possible that adhesion zones (so-called Bayer's junctions) between the OM and PM exist to facilitate the transport of substances (3), but we have not seen these zones in any of our cryosections. There is a certain attraction to envisioning the protoplast floating with a limited freedom within the periplasm, being able to come closer to specific regions of the OM-PG complex or to move and dock into preexisting transport complexes so as to aid or facilitate certain uptake or export functions. “Floating” would be limited by the compressibility or elasticity of the periplasmic gel.
Recently, the crystal structure determination of an E. coli multidrug efflux transporter has been solved (30). The AcrAB-TolC system is composed of a PM-anchored protein (AcrA) with a projection (AcrB) extending through the periplasm, where it connects to the multifunctional OM channel, TolC. The periplasmic length of the transporter is ∼17 nm (30), which is shorter than our periplasmic measurements (mean values are given in Table 1) but is close to the narrowest value. It is possible that, in locations such as this, the protoplast has moved closer to the OM so as to facilitate efflux. Structure determination at high resolution of components of other protein secretion systems will provide us with more representative data on the variability of width of the periplasmic space.
PG.
The PG can be seen as a thin line beneath the OM (Fig. 7 and 8). PG, like the periplasm, is made of low-atomic-number elements, and its visualization dramatically indicates that the PG meshwork must be highly compacted to distinguish its mass so clearly from the other vitrified periplasmic substance. This compaction is relative only to the periplasm within which the PG resides, since it is a truly elastic network that is under high (turgor) pressure (33, 43, 44). Although PG has been shown by neutron diffraction to have a thickness of more than a single molecular layer (24), its natural thickness within an intact cell has been difficult to estimate, since it is a fabric network capable of dynamically responding to thermal fluctuations that could alter the thickness at single points in time (33). Interestingly, our measurements of the PG in our frozen-hydrated sections (Table 1) compare favorably with atomic force microscopy measurements of the layer in isolated hydrated murein sacculi from the same strains of E. coli (6.0 nm) and P. aeruginosa (3.0 nm) (44). It is possible that the PGs of different types of gram-negative bacteria could have subtly dissimilar thicknesses, which correspond to the number of molecular layers and associated proteins, even within similar peptidoglycan chemotypes (both E. coli and P. aeruginosa possess A1γ chemotypes).
FIG. 8.
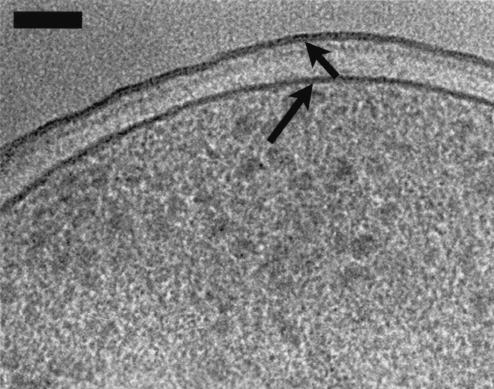
An image of the PAO1 envelope (similar to that of K-12 depicted in Fig. 7). The cell was grown on Trypticase soy agar and processed in 20% (wt/vol) dextran for high-pressure freezing. This high-magnification view of the envelope shows OM (short arrow) asymmetry in comparison to that of the PM (long arrow). The periplasmic space appears wider in comparison to the other images, which might be due to the growth of the cells on solid medium or to the presence of dextran as the cryoprotectant. Bar, 50 nm.
Figures 7 and 8 also show that the PG is closely apposed to the OM. This would be expected since in E. coli the OM is covalently bonded to the PG via lipoproteins (e.g., Braun's lipoprotein), whereas in P. aeruginosa the bonding is electrostatic (5, 9, 31). A recent structure determination of the 56-residue polypeptide moiety of the E. coli lipoprotein revealed that the polypeptide assembles into a cylindrical trimer with a length of 8.3 nm (39). This length is greater than our measured distance between OM and PG (Table 1) and suggests that the N terminus of the lipoprotein is partially buried in the bilayer. Moreover, other macromolecular assemblies (e.g., secretion systems, iron acquisition complexes, etc.) may also be involved in the juxtaposition of the OM and PG.
Outer and plasma membranes.
Membranes of both bacteria are well preserved in the cryosections. In the OM, the outer face of the bilayer is more intensely contrasted than the inner face (Fig. 7 and 8). This shows that the lipid asymmetry of the OM in these bacteria has been retained. LPS has a larger number of phosphates per unit area than a typical phospholipid, such as phosphatidylethanolamine (9, 15, 31), and it would be expected that LPS should then have more inherent contrast in the filtered image. LPS also has more available carboxyl and phosphate groups, which interact more strongly with Mg2+ and Ca2+ (15) than phospholipid, and these complexed metal ions should also increase the contrast of the outer face of the OM.
Because the E. coli used in our study is a K-12 strain, its LPS is semirough, consisting of lipid A and core oligosaccharide with no O-side chains. Here, the phosphate and other charged groups reside near the surface of this truncated LPS molecule, and the image contrast should be exactly as seen (Fig. 7). The LPS of our P. aeruginosa PAO1 strain is more complex, since it is serotype O5 with both A-band and B-band LPSs residing on each cell (23, 35). The A-band LPS (common antigen) has a relatively simple O-side chain consisting of repeating units of α-d-rhamnose trimer (linked 1→2, 1→3, and 1→3) forming side chains that are ∼10 to 20 units long. This side chain is uncharged. The B-band O-side chain is more complex and consists of a repeating trimeric pattern of 2-acetamido-3-acetamidino-2,3-dideoxy-d-mannuronic acid (Man[2NAc3N]A), 2,3-diacetamido-d-mannuronic acid (2,3-diNAcManA), and 2-acetamido-2,6-dideoxy-d-galactose (N-acetylfucosamine; Fuc2NAc) extending ∼40 nm from the outer membrane (25). The A- and B-side chains are substantial components of these LPSs and should be visualized in frozen-hydrated thin sections as a polymer brush extending from the OM of P. aeruginosa. Yet they are not visible (Fig. 8) because the 15% sucrose (or 20% dextran), which is used as a cryoprotectant(s) and is required for vitrification, provides an external mass density that approaches the density of the O-side chains, thus making them invisible. Since contrast is proportional to density in frozen-hydrated sections (11), this problem will be difficult to overcome; the use of lower sucrose concentrations does not achieve vitrification. Freeze-substitution was able to visualize the B-band O-side chains (25), but this was because heavy metal stains bound to available reactive sites on the mannuronic acid residues (5, 9). For the frozen-hydrated sections of P. aeruginosa, which are unstained and rely on inherent molecular densities, the greatest contrast from LPS would be due to the lipid A and core oligosaccharide moieties, and this produced an OM image similar to that of E. coli (cf. Fig. 7 and 8).
The PM shows similar contrast with both its bilayer faces (Fig. 7 and 8). Most striking is its macromorphology, since it appears to be stretched tight around the entire periphery of each cell. There are no cytoplasmic infoldings resembling mesosomes (Fig. 4 and 5), a fact which emphasizes the apparent artifactual basis of these cellular inclusions (8, 11). Frequently, ribosomes are seen in close contact with the PM (Fig. 5), and it is possible that these are actively engaged in synthesizing proteins for transport.
In this paper, we describe a general protocol for the vitrification of bacteria and their visualization via frozen-hydrated thin sections. The quality of structural preservation is extremely good, but there are physical artifacts (e.g., deformation, crevasses, etc.) that must be understood before interpretation can be made (Table 1). We feel that this cryotechnique holds great promise for the proper elucidation of prokaryotic structure. It is a difficult technique that is both labor- and equipment intensive, and it cannot be performed in all microbiological laboratories whose workers are interested in structure. Yet cryosections will not only help in the visualization of native structure but will also help to better understand the artificial properties of other more traditional methods so that improved interpretative value can be made with them.
Acknowledgments
We thank Philip Hyam from Leica-Microsystems in Canada for his advice and support, especially for making the Leica equipment (high-pressure freezing device and cryomicrotome) available to T.J.B.'s laboratory.
This work was supported by a Natural Science and Engineering Research Council of Canada (NSERC) Discovery grant to T.J.B. V.R.F.M. is the recipient of a Ph.D. scholarship from CNPq in Brazil. Most microscopy was performed in the NSERC Guelph Regional STEM Facility, which is partially funded by a NSERC Major Facility Access grant to T.J.B.
REFERENCES
- 1.Al-Amoudi, A., J. Dubochet, and D. Studer. 2002. Amorphous solid water produced by cryosectioning of crystalline ice at 113 K. J. Microsc. 207:146-153. [DOI] [PubMed] [Google Scholar]
- 2.Amako, K., K. Murata, and U. Umeda. 1983. Structure of the cell envelope of Escherichia coli observed by rapid freezing and substitution fixation method. Microbiol. Immunol. 27:95-99. [DOI] [PubMed] [Google Scholar]
- 3.Bayer, M. E. 1991. Zones of membrane adhesion in the cryofixed envelope of Escherichia coli. J. Struct. Biol. 197:268-280. [DOI] [PubMed] [Google Scholar]
- 4.Beveridge, T. J. 2000. Ultrastructure of gram-positive cell walls, p. 3-10. In V. A. Fischetti, R. P. Novick, J. J. Ferretti, and D. A. Portnoy (ed.), Gram-positive pathogens. American Society for Microbiology, Washington, D.C.
- 5.Beveridge, T. J., and L. L. Graham. 1991. Surface layers of bacteria. Microbiol. Rev. 55:684-705. [DOI] [PMC free article] [PubMed] [Google Scholar]
- 6.Beveridge, T. J., S. A. Makin, J. L. Kadurugamuwa, and Z. Li. 1997. Interactions between biofilms and the environment. FEMS Microbiol. Rev. 20:291-303. [DOI] [PubMed] [Google Scholar]
- 7.Beveridge, T. J., T. J. Popkin, and R. M. Cole. 1994. Electron microscopy, p. 42-71. In P. Gerhardt (ed.), Methods for general molecular bacteriology. American Society for Microbiology, Washington, D.C.
- 8.Beveridge, T. J. 1981. Ultrastructure, chemistry and function of the bacterial cell wall. Int. Rev. Cytol. 72:229-317. [DOI] [PubMed] [Google Scholar]
- 9.Beveridge, T. J. 1999. Structures of gram-negative cell walls and their derived membrane vesicles. J. Bacteriol. 181:4725-4733. [DOI] [PMC free article] [PubMed] [Google Scholar]
- 10.Dubochet, J. 1995. High-pressure freezing for cryoelectron microscopy. Trends Cell Biol. 5:366-368. [DOI] [PubMed] [Google Scholar]
- 11.Dubochet, J., A. W. McDowall, B. Menge, E. N. Schmid, and K. G. Lickfeld. 1983. Electron microscopy of frozen-hydrated bacteria. J. Bacteriol. 155:381-390. [DOI] [PMC free article] [PubMed] [Google Scholar]
- 12.Dubochet, J., and N. Sartori Blanc. 2001. The cell in absence of aggregation artifacts. Micron 32:91-99. [DOI] [PubMed] [Google Scholar]
- 13.Dubochet, J., M. Adrian, J. J. Chang, J. C. Homo, J. Lepault, A. W. McDowall, and P. Schultz. 1988. Cryo-electron microscopy of vitrified specimens. Q. Rev. Biophys. 21:129-228. [DOI] [PubMed] [Google Scholar]
- 14.Erk, I., G. Nicolas, A. Caroff, and J. Lepault. 1998. Electron microscopy of frozen biological objects: a study using cryosectioning and cryosubstitution. J. Microsc. 189:236-248. [DOI] [PubMed] [Google Scholar]
- 15.Ferris, F. G. 1989. Metallic ion interactions with the outer membrane of gram-negative bacteria, p. 295-323. In T. J. Beveridge and R. J. Doyle (ed.), Metal ions and bacteria. John Wiley & Sons, New York, N.Y.
- 16.Graham, L. L., and T. J. Beveridge. 1990. Effect of chemical fixatives on accurate preservation of Escherichia coli and Bacillus subtilis structure in cells prepared by freeze-substitution. J. Bacteriol. 172:2150-2159. [DOI] [PMC free article] [PubMed] [Google Scholar]
- 17.Graham, L. L., R. Harris, W. Villiger, and T. J. Beveridge. 1991. Freeze-substitution of gram-negative eubacteria: general cell morphology and envelope profiles. J. Bacteriol. 172:1623-1633. [DOI] [PMC free article] [PubMed] [Google Scholar]
- 18.Graham, L. L., T. J. Beveridge, and N. Nanninga. 1991. Periplasmic space and the concept of the periplasm. Trends Biochem. Sci. 16:328-329. [DOI] [PubMed] [Google Scholar]
- 19.Harris, J. R. 1997. Negative staining and cryoelectron microscopy: the thin film techniques. BIOS Scientific Publishers, Oxford, United Kingdom.
- 20.Hobot, J. A., E. Carlemalm, W. Villiger, and E. Kellenberger. 1984. Periplasmic gel: new concept resulting from the reinvestigation of bacterial cell envelope ultrastructure by new methods. J. Bacteriol. 160:143-152. [DOI] [PMC free article] [PubMed] [Google Scholar]
- 21.Hsieh, C. E., M. Marko, J. Frank, and C. A. Mannella. 2002. Electron tomographic analysis of frozen-hydrated tissue sections. J. Struct. Biol. 138:63-73. [DOI] [PubMed] [Google Scholar]
- 22.Kennedy, E. P. 1982. Osmotic regulation and the biosynthesis of membrane-derived oligosaccharides in Escherichia coli. Proc. Natl. Acad. Sci. USA 37:1092-1095. [DOI] [PMC free article] [PubMed] [Google Scholar]
- 23.Knirel, Y. A., E. V. Vinogradov, N. A. Kocharova, N. A. Paramonov, N. K. Kochetkov, B. A. Dmitriev, E. S. Stanislavsky, and B. Lanyi. 1988. The structure of O-specific polysaccharides and serological classification of Pseudomonas aeruginosa. Acta Microbiol. Hung. 35:3-24. [PubMed] [Google Scholar]
- 24.Labischinski, H., E. W. Goodell, A. Goodell, and M. L. Hochberg. 1991. Direct proof of a “more-than-single-layered” peptidoglycan architecture of Escherichia coli W7: a neutron small-angle scattering study. J. Bacteriol. 173:751-756. [DOI] [PMC free article] [PubMed] [Google Scholar]
- 25.Lam, J. S., L. L. Graham, J. Lightfoot, T. Dasgupta, and T. J. Beveridge. 1992. Ultrastructural examination of lipopolysaccharides of Pseudomonas aeruginosa strains and their isogenic rough mutants by freeze-substitution. J. Bacteriol. 174:7159-7167. [DOI] [PMC free article] [PubMed] [Google Scholar]
- 26.Langley, S., and T. J. Beveridge. 1999. Effect of O-side-chain-lipopolysaccharide chemistry on metal binding. Appl. Environ. Microbiol. 65:489-498. [DOI] [PMC free article] [PubMed] [Google Scholar]
- 27.Leforestier, A., J. Dubochet, and F. Livolant. 2001. Bilayers of nucleosome core particles. Biophys. J. 81:2414-2421. [DOI] [PMC free article] [PubMed] [Google Scholar]
- 28.Moor, H., and K. Muhlethaler. 1963. The fine structure of frozen yeast cells. J. Cell Biol. 17:609-628. [DOI] [PMC free article] [PubMed] [Google Scholar]
- 29.Moor, H., G. Bellin, C. Sandri, and K. Akert. 1980. The influence of high pressure freezing on mammalian nerve tissue. Cell Tissue Res. 209:201-216. [DOI] [PubMed] [Google Scholar]
- 30.Murakami, S., R. Nakashima, E. Yamashita, and A. Yamaguchi. 2002. Crystal structure of bacterial multidrug efflux transporter AcrB. Nature 419:587-593. [DOI] [PubMed] [Google Scholar]
- 31.Nikaido, H., and M. Vaara. 1985. Molecular basis of bacterial outer membrane permeability. Microbiol. Rev. 49:1-32. [DOI] [PMC free article] [PubMed] [Google Scholar]
- 32.Norlen, L., A. Al-Amoudi, and J. Dubochet. 2003. A cryotransmission electron microscopy study of skin barrier formation. J. Investig. Dermatol. 120:555-560. [DOI] [PubMed] [Google Scholar]
- 33.Pink, D., J. Moeller, B. Quinn, M. Jericho, and T. Beveridge. 2000. On the architecture of the gram-negative bacterial murein sacculus. J. Bacteriol. 182:5925-5930. [DOI] [PMC free article] [PubMed] [Google Scholar]
- 34.Richter, K. 1994. Cutting artefacts on ultrathin cryosections of biological bulk specimens. Micron 25:297-308. [DOI] [PubMed] [Google Scholar]
- 35.Riviera, M., L. E. Byrant, R. E. W. Hancock, and E. J. McGroarty. 1988. Heterogeneity of lipopolysaccharides from Pseudomonas aeruginosa: analysis of lipopolysaccharide chain length. J. Bacteriol. 170:512-521. [DOI] [PMC free article] [PubMed] [Google Scholar]
- 36.Robards, A. W., and U. B. Sletyr. 1985. Low-temperature methods in biological electron microscopy. In A. M. Glauert (ed.), Practical methods in electron microscopy. Elsevier, Amsterdam, The Netherlands.
- 37.Sartori Blanc, N., D. Studer, K. Ruhl, and J. Dubochet. 1998. Electron beam-induced changes in vitreous sections of biological samples. J. Microsc. 192:194-201. [DOI] [PubMed] [Google Scholar]
- 38.Sartori Blanc, N., K. Richter, and J. Dubochet. 1993. Vitrification depth can be increased more than 10 fold by high-pressure freezing. J. Microsc. 172:55-61. [Google Scholar]
- 39.Shu, W., J. Liu, H. Ji, and M. Lu. 2000. Core structure of the outer membrane lipoprotein from Escherichia coli at 1.9-Å resolution. J. Mol. Biol. 299:1101-1112. [DOI] [PubMed] [Google Scholar]
- 40.Sletyr, U. B., and T. J. Beveridge. 1999. Bacterial S-layers. Trends Microbiol. 7:253-260. [DOI] [PubMed] [Google Scholar]
- 41.Studer, D., W. Graber, A. Al-Amoudi, and P. Eggli. 2001. A new approach for cryofixation by high-pressure freezing. J. Microsc. 203:285-294. [DOI] [PubMed] [Google Scholar]
- 42.Thanassi, D. G., and S. J. Hultgren. 2000. Multiple pathways allow protein secretion across the bacterial outer membrane. Curr. Opin. Cell Biol. 12:420-430. [DOI] [PubMed] [Google Scholar]
- 43.Yao, X., J. Walter, S. Burke, M. H. Jericho, D. Pink, R. Hunter, and T. J. Beveridge. 2002. Atomic force microscopy, computer simulations and theoretical considerations of the surface properties and turgor pressures of bacteria. Colloids Surf. B Biointerfaces 23:213-230. [Google Scholar]
- 44.Yao, X., M. Jericho, D. Pink, and T. Beveridge. 1999. Thickness and elasticity of gram-negative murein sacculi measured by atomic force microscopy. J. Bacteriol. 181:6865-6875. [DOI] [PMC free article] [PubMed] [Google Scholar]


