Abstract
Three sublines of NIH 3T3 cells had the properties of non-neoplastic, preneoplastic, and neoplastic cells, respectively. The closer the cells were to neoplastic behavior, characterized by continuing growth at high density, the slower they multiplied at lower density. Under the conditions of high population density and low calf serum concentration used in the assay for transformed focus formation, the transformed or neoplastic cells were much more sensitive to killing by methotrexate (MTX) than were non-neoplastic cells in the same culture. This differential sensitivity of neoplastic cells was far more pronounced in molecular, cellular, and developmental biology medium 402 (MCDB 402) than in DMEM. It is associated with the presence in MCDB 402 of folinic acid, known clinically as leucovorin, which is a reduced form of the folic acid present in DMEM. Although leucovorin had been shown to selectively spare normal bone marrow and intestine in animals from the killing effect of MTX on tumor cells, we demonstrate the preferential killing of neoplastic over non-neoplastic cells of the same derivation. Neither neoplastic nor non-neoplastic cells were killed once they had stopped multiplying at their respective saturation densities. The development of the light foci characteristic of the preneoplastic cells was less sensitive to MTX than the formation of the dense foci produced by the fully neoplastic cells. The system should serve as a valuable model to establish basic principles and optimal conditions for selective killing of neoplastic cells by chemotherapeutic drugs.
Keywords: chemotherapy, folinic acid, transformation
The common goal of cancer chemotherapy is to kill the cancer cells while sparing the normal cells. Antifolates were the first antimetabolic drugs to demonstrate effectiveness in the treatment of neoplastic diseases (1). The most effective and widely used of the antifolates is methotrexate (MTX). The antifolates have been especially effective in the treatment of acute leukemia (2), head and neck cancer (3), and micrometastases of osteosarcoma (4) and have proven useful in treating choriocarcinoma, Burkitt’s lymphoma, and carcinoma of the bronchi, breast, cervix, and vagina (3). MTX and other antifolates produce toxic side effects, the most serious occurring in bone marrow and intestinal epithelium. The toxic side effects of MTX are mitigated by folinic acid (leucovorin), thymidine, and purines (4–10). The use of these compounds allows administration of higher concentrations of MTX to kill the cancer cells while protecting normal cells. The relative sensitivity to MTX of various normal and transformed cells has been studied in culture, but the normal cells have been freshly isolated from the organism and the cancer cells were established cell lines with an unclear relationship to the normal cells (10–15). We have developed a system of controlled “spontaneous” transformation of the NIH 3T3 mouse fibroblast line in which the number of transformed cells is quantified by the number and size of multilayered foci formed on a monolayered background of nontransformed cells (16–19). The system allows us to quantitate the effect of chemotherapeutic drugs on transformed cells and their progenitor nontransformed cells growing side by side in the same culture. We chose MTX as the first anticancer drug for testing comparative cytotoxicity because of the extensive information about its effects on cells (20, 21) and its clinical effects in human cancer (1, 22). We report here that progressive states of transformation are correlated with reduced rates of cell multiplication at low population density and increased susceptibility to MTX in the presence of leucovorin, which protects nontransformed cells from MTX.
MATERIALS AND METHODS
The NIH 3T3 line of mouse embryo fibroblasts (23) was obtained in 1988 from Stuart Aaronson, then at the National Cancer Institute in Bethesda, MD. The cells, designated SA′, were subcultured once in DMEM with 10% calf serum (CS), and dimethyl sulfoxide to 7.5% was added before cryopreservation in liquid nitrogen. They were thawed for the present experiments in July and September 1997 for culture in molecular, cellular, and developmental biology medium 402 (MCDB 402) with 10% CS. It is necessary to return at intervals to the original stock of cells to obtain quantitatively reproducible results on neoplastic transformation because those results gradually change on subculture regardless of the conditions used in subculture (16, 17). The cells were subcultured at 3-day intervals with a seeding density of 2 × 10⁴ cells per 100-mm Petri culture dish in MCDB 402 with 10% CS. When used in an assay for transformed focus formation, 105 cells were seeded on 60-mm Petri dishes in MCDB 402 with 2% CS. The first assay was considered a primary (1°) assay, which extended for 10–14 days with semiweekly medium change to permit full development of transformed foci. Some of the cultures then were fixed in Bouin’s reagent washed with Tris-saline buffer and stained with 4% Giemsa at pH 7.0. Sister cultures were detached by incubation in 0.01% trypsin with 0.5 mM EDTA in Tris-saline buffer, and counted and reseeded in a 2° assay as in the 1° assay. The successive assays were repeated for 3° and 4° assays. When we thought there would be too many transformed cells in a culture to allow for discrete focus formation, 104 or 103 of the cells were seeded together with 105 of a subline A′ that had undergone more than 100 serial low-density subcultures and lost the capacity to form foci in 1° or even 2° assays. They were incubated, fixed, and stained or counted as described above. Cells also were diluted to obtain a seeding of 50–100 cells by themselves, incubated in MCDB 402 plus 10% CS for 6 days or longer, then fixed and stained for counting. Foci were counted over a fluorescent light box, as were grossly visible colonies. Colonies developing in only 6 or 7 days were sometimes too small to reliably enumerate by the unaided eye and were counted in a stereomicroscope.
RESULTS
Growth Rate and Sensitivity to MTX of Transformed and Nontransformed Cells.
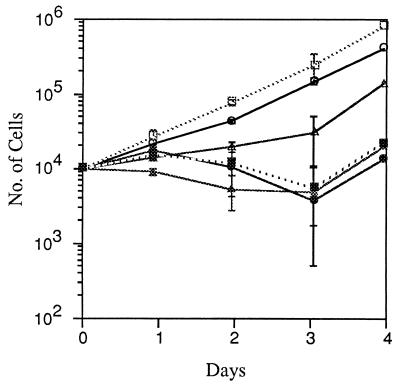
The growth rates and sensitivity to killing by MTX were tested with three cell types: (i) nontransformed A′ cells that are also resistant to transformation in two successive rounds of assay at prolonged confluence; (ii) SA′ standard passage cells that produce a few light transformed foci in a 1° assay, and many dense foci in a 2° assay; and (iii) 4° SA′ cells fully transformed after four successive assays at prolonged confluence. The latter were given a 3-day period of low-density growth to recover from the inhibition of confluence. MTX (200 nM) was added to half the cultures of each cell type, and the treated and untreated cells were counted and then cloned in the absence of MTX on each of the 4 days of the growth curves. The growth curves are shown in Fig. 1. The nontransformed A′ cells multiplied exponentially at about 1.7 population doublings per day, the fastest of the three types. The SA′ standard passage cells exhibited a slight lag of 2 days before beginning exponential multiplication, at a slightly lower rate than the A′ cells. The 4° SA′ transformed cells increased very slowly for 3 days but more quickly from then on to day 4. (Further experiments showed the late increase in growth rate was sustained on longer periods of incubation, but returned to the initial low rate at each subculture after trypsinization.) The multiplication of all three cell types was suppressed during the first 3 days of treatment with MTX with a slight increase in cell number by the fourth day.
Figure 1.
MTX effect on growth rates of three sublines. Cells (104) were seeded from standard passages of A′ and SA′ and from transformed cells recovered by growth at low density for 3 days from the 4° assay of SA′ (4°, SA′) in MCDB 402 with 10% CS. MTX (200 nM) was added to half the cultures of each group. The cells were trypsinized for counting at daily intervals. Untreated cultures, open symbols; MTX-treated cultures, closed symbols. A′ cells, □, ▪; SA′ cells, ○, •; 4° SA′ cells, ▵, ▴.
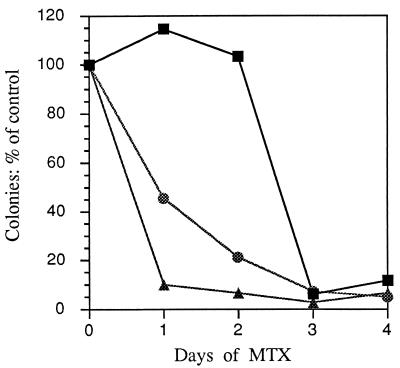
The relative effect on cloning efficiency of pretreating the cells with MTX is shown in Fig. 2. Cells from the growth curves in Fig. 1 were seeded for colony formation in 10% CS without MTX for 6 days or longer. The cloning efficiency of the A′ cells was unaffected by 2 days of pretreatment with MTX but it decreased to one-tenth the control value on days 3 and 4. The cloning efficiency of the SA′ standard passage cells decreased progressively on each successive day of MTX treatment, exhibiting a greater sensitivity to the drug than the A′ cells. The 4° SA′ transformed cells dropped sharply in cloning efficiency after 1 day of MTX treatment, and more gradually after that. They were clearly the most sensitive of the three cell types. The results indicate that cells like those of SA′, which are progressively transformed under the constraint of confluence, are more sensitive to killing by MTX than A′ cells, which resist transformation, but fully transformed cells are the most easily killed of all three types.
Figure 2.
Effect of MTX pretreatment on cloning efficiency of three sublines. Cells (104) of the A′, SA′, and 4° SA′ sublines were treated with 200 nM MTX during the growth curves of Fig. 1. On each successive day for 4 days, treated and untreated cultures were trypsinized, and 100 cells were reseeded in MCDB 402 with 10% CS without MTX. They were incubated for 6 days, fixed, and stained, and the number of colonies were counted in a stereomicroscope. A′ cells, ▪; SA′ cells, •; 4° SA′ cells, ▴.
Selective Damage to Transformed Cells by MTX During Focus Formation.
It repeatedly has been observed for any given cell line that its sensitivity to killing by MTX is correlated with growth rate. This is obviously not the case in comparing growth rate and sensitivity to MTX among the three different sublines used here where sensitivity to MTX in 10% CS is related to the degree of transformation of the cells. However, we have found that all three of the sublines become relatively resistant to MTX when shifted from 10% CS to 2% CS and exposed to MTX during the cloning procedure (not shown). Because the assay for focus formation is done in the presence of 2% CS, effects of MTX on focus formation would seem to call for an increase in MTX concentration. However, pilot experiments showed that the transformed cells retained their sensitivity to MTX under the higher population densities of the assay procedure despite the downshift to 2% CS, so we continued using 200 nM MTX in studying its effect on focus formation during the assay. The MTX was added for 3 days beginning on the third day of the assay to allow the transformed cells to recover from the trypsinization and attain maximal growth rate before exposure to MTX. Removal of the drug on day 6 gave sufficient time to the end of the assay at 14 days for foci to develop if the transformed cells had been only reversibly inhibited during the treatment period.
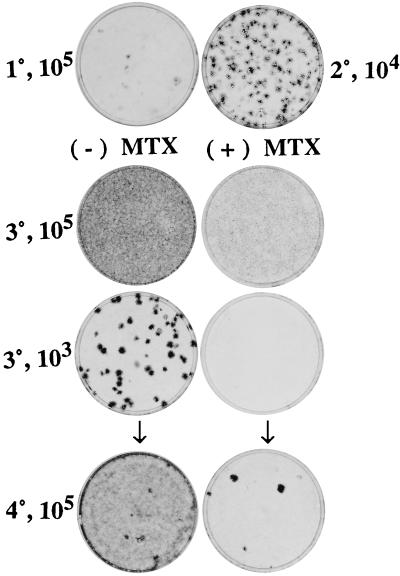
The SA′ cells went through the 1° assay in either 2% or 10% CS but all of the later assays were in 2% CS. Half of the cultures in the 3° assay were treated with 200 nM MTX from day 3 through day 6 as noted above, and then all the cultures proceeded to completion of the assay in the absence of MTX. Some then were fixed and stained for focus formation, and the others were trypsinized, counted, and used in a 4° assay for focus formation. The percent focus formers are recorded in Table 1, and the cell yields are in Table 2. Photographs of focus formation are in Fig. 3.
Table 1.
Progressive transformation in serial assays with selective killing of focus formers in the 3° assay
| Assay | MTX, nM (3–6 day) | 2% CS in 1°*
|
10% CS in 1°*
|
|---|---|---|---|
| % Foci formers | |||
| 1° | 0 | 0.012 | 0.02 |
| 2° | 0 | 1.4 | 1.05 |
| 3° | 0 | 6.6 | 5.6 |
| 200 | <0.1 | <0.1 | |
| 4° | 0 (0)** | 18.5 | 8.4 |
| 0 (200)** | 0.006 | 0.025 | |
105 SA′ cells were seeded in MCDB 402 with 2% or 10% CS in the serial 1° and 2% in all subsequent assays. The 3° assay was of 103 cells from the 2° assay mixed with 105 A′ cells to form a background for focus formation in 2% CS. MTX (200 nM) was added from days 3 to 6 of the 3° assay. The 2° and 4° assays included cultures with varying numbers of SA′ cells appropriate to make discrete countable numbers of foci.
The 1° assay was in either 2% or 10% CS as indicated. All subsequent assays were in 2% CS. Although the cell layers were thicker in the 1° assay with 10% CS and the individual foci denser than in 2% CS, the foci in subsequent assays, all of which were in 2% CS, were lighter and fuzzier in those originating from the 1° assay in 10% CS than those originating from the 1° assay in 2% CS.
The value (in parentheses) for MTX concentration in the 4° assay refers to that used at 3–6 days of the 3° assay. MTX was not used in the 4° assay.
Table 2.
Cell yields at 14 days in three serial assays with MTX treatment in the 3° assay
| Assay | No. SA′ cells seeded | MTX, nm (3–6 day) | 2% CS in 1°
|
10% CS in 1°
|
SA′ std. pass. | A′ std. pass. |
|---|---|---|---|---|---|---|
| No. of cells (×10−5) | ||||||
| 1° | 105 | 0 | 6.28 | 20.1* | ||
| 2° | 105 | 0 | 55.1 | 35.3 | ||
| 3° | 105 | 0 | 50.2 | 38.0 | 5.72† | 5.93† |
| 105 | 200 | 6.16 | 3.80 | 4.00† | — | |
| 103 (105)‡ | 0 | 20.1 | 12.1 | |||
| 103 (105)‡ | 200 | 3.92 | 3.75 | |||
The procedure was the same as that of Table 1 but counts were made of the number of cells at the end of each assay. In addition, during the 3° assay, parallel 1° assays with cell counts were made of the standard passage of the SA′ and A′ cells.
The high value for cell numbers in the 10% CS 1° assay results from the high serum concentration rather than transformation. Because 2% CS is used in all subsequent assays, high cell numbers reflect the extent of cell transformation.
The assays of the standard passage SA′ were 1° assays but they were made in parallel with the 3° assay of SA′ cells.
103 (105): in the 3° serial assay of SA′ cells, 103 were mixed with 105 A′ cells, which served as a background for display of focus formation by the 3° SA′ cells.
Figure 3.
Progressive transformation of SA′ cells in serial assays for focus formation and the sensitivity to MTX of actively multiplying transformed cells. Freshly thawed SA′ cells (105) were seeded in MCDB 402 with 10% CS, which was switched to 2% CS at 3 days for an additional 11 days before fixation and staining (1°, 105). Cells (104) from a sister culture were mixed with 105 standard passage A′ cells for a 2° assay (2°, 104). They also were seeded at 105 cells in the 2° assay, and these were subcultured after 14 days for a 3° assay at 105 alone (3°, 105) and 103 with 105A′ cells (3°, 103). Half of the cultures in the 3° assay were treated from days 3 through 6 with 200 nM MTX and then incubated 8 more days without MTX (3°, 105) and (3°, 103) before staining. Sister cultures from the untreated and MTX-treated 3° assay of 103 cells were reseeded at 105 for a 4° assay in the absence of MTX (4°, 105). Cultures that were untreated in the 3° assay are on the left in both the 3° and 4° assay, and the MTX-treated 3° assay and their 4° descendants are on the right. The arrows connect the untreated and MTX-treated 3°, 103 cultures with their respective 4°, 105 subcultures.
A few pale foci were seen in the 1° assay in 2% CS (Table 1 and Fig. 3) and about twice as many denser foci in 10% CS (Table 1). There was a large increase in the percentage of focus formers in the 2° assay, although the increase was greater and the foci denser in the 2° assay cultures derived from the 1° assay in 2% CS than the 1° assay in 10% CS. Treatment with MTX from 3 to 6 days in the 3° assay of 103 SA′ cells on a background of 105 A′ cells (we call this seeding 103/105) resulted in a complete elimination of foci (Table 1 and Fig. 3). Treatment of 105 SA′ cells with MTX in the 3° assay led to a striking decrease in the density of cells at the end of the assay (Fig. 3). Focus formation in the 4° assay was done with cells from the 103/105 seeding of cells of the 3° assay. Its purpose was to determine whether there were any focus-forming individual cells in the MTX-treated 3° cultures despite the absence of foci there. In fact, a few foci registered in the 4° assay of the MTX-treated 3° cultures but they were 340- to 3,100-fold less than the number from the untreated 3° cultures.
The cell yields at the conclusion of the first three assays (Table 2) followed the focus-forming capacities of the cells, or, in the case of the 1° assays in 2% CS and 10% CS, the concentration of CS in the medium. The cell yield rose in the 2° assays where the focus formers had risen to about 1% of the total population. In the 3° assay, even a dilution of the SA′ cells to 103 mixed with 105 A′ background cells gave large, dense foci, resulting in a substantial increase in saturation density over the cell yield of standard passage SA′ and A′ cells (Table 2). MTX treatment greatly reduced or eliminated the increased cell yields from the 3° assay of SA′ cells, but had a much smaller effect on the cell yield of a 1° assay of the SA′ standard passage cells (Table 2, next to last column).
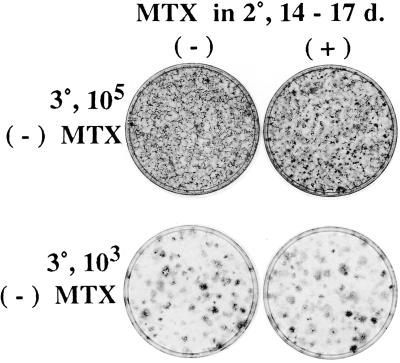
The next to the last column of Table 2 shows that MTX treatment from days 3–6 of a 1° assay of SA′ cells reduces the cell yield slightly, and it eliminated the formation of the light foci typical of a 1° assay (not shown). The standard passage SA′ cells can be considered preneoplastic because they give rise to a small number of light foci in a 1° assay (see Fig. 3). To further explore the effect of MTX on the conversion of preneoplastic to neoplastic cells, the treatment of a 1° assay was done again, and it was followed by a 2° assay in the absence of MTX. The results in Table 3 confirm that MTX eliminates the small number of foci formed in the 1° assay and shows that the numbers of foci in the 2° assay are reduced from 12- to 33-fold. The reduction is considerably less than that of the fully transformed cells as seen in Table 1 and Fig. 3, indicating that cells in the early stages of transformation are less sensitive to MTX than they are in later stages. The relatively low sensitivity of the preneoplastic cells to MTX may be because they do not multiply as freely in a crowded culture as the fully transformed cells. This surmise, in turn, raised the question as to whether the fully transformed cells would become resistant to MTX if exposed in very late stages of their assay when their multiplication is markedly reduced. Accordingly, a 2° assay of 105 cells from a 1° assay was treated with MTX for 3 days beginning at the customary end of the assay at 14 days, with no significant effect on the transformed appearance of the culture. The cells then were reassayed for focus formation in the absence of MTX. There was no reduction in focus formation by the MTX-treated cells in the reassay (Fig. 4). It is evident that there is no significant killing of fully transformed cells by MTX when they are not multiplying, unlike their massive killing when they are multiplying.
Table 3.
Effect of MTX on focus formation in 1° assay of SA′ cells and subsequent 2° assay of the cells without MTX
| Assay | MTX (nM) | Series A
|
Series B
|
|---|---|---|---|
| % of focus formers | |||
| 1° | 0 | 0.013 | 0.010 |
| 200 | <0.001 | <0.001 | |
| 2° | 0 (0)* | 1.05 | 0.75 |
| 0 (2000)* | 0.086 | 0.023 | |
Two parallel low-density passages of SA′ cells were seeded in MCDB 402 with 2% CS for a 1° assay. MTX (200 nM) was added to the medium of half the cultures from days 3 through 6. Treated and untreated cultures were fixed and stained at 14 days. Sister cultures were used for a 2° assay without MTX. The percentages of foci in each assay are recorded.
The value (in parentheses) for MTX concentration in the 2° assay refers to the concentration applied from days 3–6 of the 1° assay. MTX was not used in the 2° assay.
Figure 4.
Resistance to MTX of nonmultiplying transformed cells. On day 14 of a 2° assay of 105 SA′ cells, cultures were untreated or treated with 200 nM MTX for 3 days. They then were subcultured without MTX for a 3° assay with 105 cells (Upper) or 103 cells mixed with 105 standard passage A′ cells (Lower). There is no obvious difference in transformation between untreated and MTX-treated cultures when subcultured without MTX in the 3° assay with either 105 cells, or with 103 cells on a background of A′ cells.
Differential Effectiveness of MTX in MCDB 402 and DMEM.
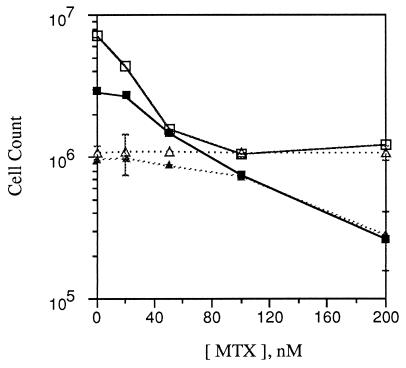
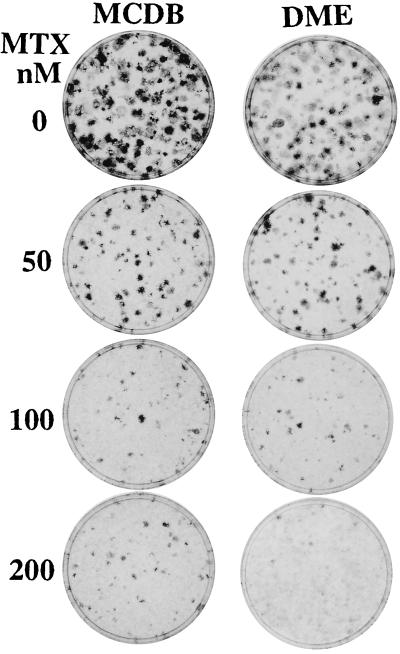
We have found that MTX is inhibitory to the multiplication of nontransformed cells at much lower concentrations when added to DMEM than to MCDB 402 (21). The major part of the differential is caused by the presence of 1 μM folinic acid (leucovorin) in MCDB 402 instead of the folic acid present in DMEM. We wished to determine the relative sensitivity of transformed and nontransformed cells to MTX in both media. A mixture of the two cell types, as well as the nontransformed cells alone, were treated with a series of MTX concentrations from 3 to 6 days after their seeding for assay, in DMEM or MCDB 402, with 2% CS in both. After removal of the MTX, the cultures were incubated 8 more days before cell counts were done and other cultures stained for focus formation. The cell counts are in Fig. 5, and a photograph of focus formation is in Fig. 6.
Figure 5.
Selectivity of MTX impairment of growth by transformed and nontransformed cells in media of different composition. Assays (3°) were prepared with 103 SA′ cells mixed with 105 standard passage A′ or 105 A′ cells alone in either MCDB 402 or DMEM, both with 2% CS. They were treated with the indicated concentrations of MTX from days 3 through 6, then incubated without MTX to 14 days when they were trypsinized and counted. SA′ + A′ cells in MCDB 402, □ or in DMEM, ▪; A′ cells in MCDB 402, ▵ or in DMEM, ▴.
Figure 6.
Focus formation by cells treated with MTX in media of different composition. The cultures shown are sisters to those trypsinized and counted in Fig. 5 and were treated with the indicated concentrations of MTX in MCDB 402 (Left) and in DMEM (Right).
MTX at the highest concentration used had no effect on cell counts of A′ in MCDB 402, but the counts of these cells decreased in DMEM beginning at 50 nM MTX and were sharply lower with 200 nM MTX (Fig. 5). The cell yields in the untreated mixed culture in MCDB 402 were seven times higher than those of the A′ cells (Fig. 5) as a result of the thick growth in the transformed foci (Fig. 6). The counts decreased in MCDB 402 even with the lowest concentration of MTX but reached a minimum with 100 nM MTX that was equal to the counts of the A′ cultures at all MTX concentrations. The cell yields in untreated DMEM were lower than in untreated MCDB 402 because the foci were fewer, smaller, and lighter. Although the counts in DMEM were unaffected in treatment with 20 nM MTX, they declined continuously with higher concentrations to counts far below those of the untreated A′ cells and exactly to the level of the A′ cells treated with the same high concentrations of MTX.
In examining the photograph in Fig. 6, it is apparent that treatment with the higher concentrations of MTX has markedly reduced the size of the foci in MCDB 402, which accounts for the reduction in cell counts to the level of the A′ cells. Unlike the experiment in Fig. 3, however, the treatment did not completely eliminate the foci, which indicates variability in the sensitivity of the transformed cells. MTX also decreased the size of foci in DMEM but at the same time it damaged the background A′ cells. Such damage is evident in the 200 nM MTX treatment in DMEM, which reduced the counts of the mixed cultures and the A′ cultures to precisely the same cell number (Fig. 5). The results indicate that the transformed cells are similarly sensitive to MTX in both media but the nontransformed cells are much more sensitive in DMEM than in MCDB 402.
DISCUSSION
The SA′ cells used here are the NIH 3T3 cells received by our laboratory and frozen in 1988. When 105 cells are seeded and then left at confluence for about 10 days in 2% CS, they produce about 10 lightly transformed foci. On serial subculture in a 2° assay, they produce large numbers of foci that are denser than those of the 1° assay; another subculture in a 3° assay produces even more foci, which are still denser and larger than those in the 2° assay. Past evidence indicates that the constraint of confluence induces the transformation and its progression and also selects for the transformed cells (17–19). If the nontransformed cells are kept in a continuous state of rapid multiplication by frequent subculture at low density, they become increasingly resistant to transformation (17) as was the case for the A′ cells used here as a background for discrete focus formation by the transformed SA′ cells. The SA′ cells therefore exhibit preneoplastic behavior and resemble the easily transformed skin fibroblasts isolated from patients with cancer of the breast and other organs (24–27) or from individuals with a hereditary predisposition for cancer (28–31).
The SA′ cells multiply at a lower rate than the A′ cells for 2 days after trypsinization and subculture (Fig. 1). The strongly transformed 4° SA′ cells multiply at an even lower rate and for a longer time after trypsinization, although they later speed up and continue to grow at high densities when contact inhibition sets in for the A′ cells. The heritable lag in growth rate of the SA′ and 4° SA′ cells indicates they bear genetic damage, much as the cells transformed by Rous sarcoma virus (32) or cells from aging organisms do (33, 34). MTX reduces the colony-forming capacity of the growing cells in increasing order of susceptibility: A′ < SA′ < 4° SA′. The susceptibility gap is even wider in the early stages of the assay for focus formation, which makes it possible to virtually eliminate the transformed cells with no evidence of harm to the nontransformed cells. However, if MTX is introduced very late in the assay when both cell types are quiescent, it has little effect on either cell type. Resistance to MTX in nonmultiplying cells has been described in cell culture (35, 36) and long been suspected in the treatment of cancer patients (4). Indeed, MTX seems to be most effective in osteosarcoma when the primary tumor is treated surgically or by x-rays and MTX blocks further growth of multiplying micrometastases in the lung (4).
Although the transformed cells had similar susceptibility to MTX, whether in MCDB 402 or DMEM, the nontransformed cells were much more easily killed in DMEM than in MCDB 402. Unlike DMEM, MCDB 402 contains folinic acid, thymidine, and adenine, which preferentially mitigate the cytocidal effect of MTX on normal tissues over tumor cells (3–5, 7, 9–15). At the 1 μM concentration in MCDB 402, of these three metabolites, only folinic acid, also known as leucovorin, provides protection of nontransformed cells to the high concentrations of MTX used here (21). It appears as though leucovorin provides little or no protection to the transformed cells. It currently is thought that polyglutamate residues are added to reduced folates and MTX to a much greater extent in tumor cells than normal tissues, and that the MTX polyglutamated folates are retained in the tumor cells where they continue to block dihydrofolate reductase despite the presence of leucovorin (37–41). Leucovorin does, however, rescue cells of normal bone marrow and intestinal mucosa from the cytotoxic effects of MTX. The effectiveness of such rescue treatment in improving the therapeutic index of MTX in a variety of human tumors, plus our demonstration of its discriminatory power, suggests that extensive polyglutamylation of folates is a prevalent characteristic of tumors (41). This alteration may, in turn, reflect the oxidation-reduction state of tumor cells (37).
This report shows a differential sensitivity to MTX between cells of the same line at differing stages of transformation. This demonstration was made possible by the development of a method for progressive transformation of cells and for quantitating the killing of drug-treated cells by reassaying the treated and untreated cells. The method allows testing of cytotoxic drugs on transformed and nontransformed cells in the same culture under rigorously controlled conditions in which various modifiers of the drug’s action can be added or removed at will. Although the results cannot be directly extrapolated to treatment of individual patients, they can provide a set of general principles to guide such treatment.
Acknowledgments
We thank Drs. Larry Matherly, Richard Strohman, Barry Shane, and Jeffrey Wolf for their comments on the manuscript. We also thank Mrs. Dorothy M. Rubin for the manuscript preparation. The research was supported by the Council for Tobacco Research and the Elsasser Family Fund.
ABBREVIATIONS
- MTX
methotrexate
- MCDB 402
molecular, cellular, and developmental biology medium 402
- CS
calf serum
References
- 1.Chabner B A. In: Cancer Chemotherapy. Pinedo H M, editor. New York: Elsevier; 1979. pp. 1–24. [Google Scholar]
- 2.Farber S, Diamond L K, Mercer R D, Sylvester R F, Wolff J A. N Eng J Med. 1948;238:787–793. doi: 10.1056/NEJM194806032382301. [DOI] [PubMed] [Google Scholar]
- 3.Levitt M, Mosher M B, DeConti R C, Farber L R, Skeel R T, Marsh J C, Mitchell M S, Papac R J, Thomas E D, Bertino J R. Cancer Res. 1973;33:1729–1734. [PubMed] [Google Scholar]
- 4.Frei E, Jaffe N, Tattersall M H N, Pitman S, Parker L. N Eng J Med. 1975;292:846–851. doi: 10.1056/NEJM197504172921607. [DOI] [PubMed] [Google Scholar]
- 5.Goldin A, Venditti J M, Kline I, Mantel N. Nature (London) 1966;212:1448–1550. doi: 10.1038/2121548a0. [DOI] [PubMed] [Google Scholar]
- 6.Johnson R E, Hardy W G, Zelen M. J Natl Cancer Inst. 1966;36:15–20. [PubMed] [Google Scholar]
- 7.Tattersall M H N, Brown B, Frei E. Nature (London) 1975;253:198–200. doi: 10.1038/253198a0. [DOI] [PubMed] [Google Scholar]
- 8.Sirotnak F M, Donsbach R C. Cancer Res. 1975;35:1737–1744. [PubMed] [Google Scholar]
- 9.Semon J H, Grindley G B. Cancer Res. 1978;38:2905–2911. [PubMed] [Google Scholar]
- 10.Howell S B, Mansfield S J, Taetle R. Cancer Res. 1981;41:945–950. [PubMed] [Google Scholar]
- 11.Borsa J, Whitmore G F. Cancer Res. 1969;29:731–744. [PubMed] [Google Scholar]
- 12.Pinedo H M, Zaharko D S, Bull J M, Chabner B A. Cancer Res. 1976;36:4418–4424. [PubMed] [Google Scholar]
- 13.Fabre I, Fabre G, Goldman I D. Cancer Res. 1984;44:3190–3195. [PubMed] [Google Scholar]
- 14.Groff J P, Blakley R L. Cancer Res. 1978;38:3847–3853. [PubMed] [Google Scholar]
- 15.Hryniuk W M. Cancer Res. 1972;32:1506–1511. [PubMed] [Google Scholar]
- 16.Rubin H, Xu K. Proc Natl Acad Sci USA. 1989;86:1860–1864. doi: 10.1073/pnas.86.6.1860. [DOI] [PMC free article] [PubMed] [Google Scholar]
- 17.Rubin H. Proc Natl Acad Sci USA. 1992;89:977–981. doi: 10.1073/pnas.89.3.977. [DOI] [PMC free article] [PubMed] [Google Scholar]
- 18.Rubin H. Proc Natl Acad Sci USA. 1994;91:12076–12080. doi: 10.1073/pnas.91.25.12076. [DOI] [PMC free article] [PubMed] [Google Scholar]
- 19.Rubin H. Proc Natl Acad Sci USA. 1994;91:6619–6623. doi: 10.1073/pnas.91.14.6619. [DOI] [PMC free article] [PubMed] [Google Scholar]
- 20.Schimke R T. Mutat Res. 1992;276:145–149. doi: 10.1016/0165-1110(92)90004-s. [DOI] [PubMed] [Google Scholar]
- 21.Chow, M., Koo, J. J., Ng, P. & Rubin, H. (1998) Mutat. Res., in press. [DOI] [PubMed]
- 22.Schilsky R L. In: The Chemotherapy Source Book. Perry M C, editor. Baltimore: Williams & Wilkins; 1992. pp. 301–317. [Google Scholar]
- 23.Jainchill J L, Aaronson S A, Todaro G J. J Virol. 1969;4:549–553. doi: 10.1128/jvi.4.5.549-553.1969. [DOI] [PMC free article] [PubMed] [Google Scholar]
- 24.Azzarone B, Macieira-Coelho A. J Cell Sci. 1987;87:155–162. doi: 10.1242/jcs.87.1.155. [DOI] [PubMed] [Google Scholar]
- 25.Azzarone B, Chaponnier C, Krief P, Marcel M, Suarez H, Macieira-Coelho A. Mutat Res. 1988;199:313–325. doi: 10.1016/0027-5107(88)90211-4. [DOI] [PubMed] [Google Scholar]
- 26.Danes S B. Oncology. 1980;37:386–389. doi: 10.1159/000225478. [DOI] [PubMed] [Google Scholar]
- 27.Smith H S, Owens R B, Hiller A J, Nelson-Rees W A, Johnston J O. Int J Cancer. 1976;17:219–234. doi: 10.1002/ijc.2910170211. [DOI] [PubMed] [Google Scholar]
- 28.Kopelovich L. Mutat Res. 1988;199:369–385. doi: 10.1016/0027-5107(88)90215-1. [DOI] [PubMed] [Google Scholar]
- 29.Chen S, Kazim D, Kraveka J, Pollack R E. Proc Natl Acad Sci USA. 1989;86:2008–2012. doi: 10.1073/pnas.86.6.2008. [DOI] [PMC free article] [PubMed] [Google Scholar]
- 30.Tainsky M A, Zamanigan F, Yim S O, Pathak S, Grovanalla B C, Strong L C. Proc Am Assoc Cancer Res. 1989;30:315. (Abstr.). [Google Scholar]
- 31.Lynch H T, Alban W A, Danes B S, Layton M A, Kimberling W J, Lynch J F, Cheng S C, Costello K A, Mulcahy G M, Wagner C A, Tindall S A. Cancer. 1984;53:612–622. doi: 10.1002/1097-0142(19840201)53:3+<612::aid-cncr2820531306>3.0.co;2-5. [DOI] [PubMed] [Google Scholar]
- 32.Rubin H. Exp Cell Res. 1966;41:149–161. doi: 10.1016/0014-4827(66)90555-6. [DOI] [PubMed] [Google Scholar]
- 33.Rubin H, Chow M, Yao A. Proc Natl Acad Sci USA. 1996;93:1825–1830. doi: 10.1073/pnas.93.5.1825. [DOI] [PMC free article] [PubMed] [Google Scholar]
- 34.Rubin H. Mech Aging Dev. 1997;98:1–35. doi: 10.1016/s0047-6374(97)00067-5. [DOI] [PubMed] [Google Scholar]
- 35.Johnson L F, Fuhrman C L, Abelson H T. Cancer Res. 1978;38:2408–2412. [PubMed] [Google Scholar]
- 36.Li J C, Kaminskas E. Proc Natl Acad Sci USA. 1984;81:5694–5698. doi: 10.1073/pnas.81.18.5694. [DOI] [PMC free article] [PubMed] [Google Scholar]
- 37.Matherly L H, Anderson L A, Goldman I D. Cancer Res. 1984;44:2325–2330. [PubMed] [Google Scholar]
- 38.Matherly L H, Barlowe C K, Goldman I D. Cancer Res. 1986;46:588–593. [PubMed] [Google Scholar]
- 39.Poser R G, Sirotnak F M, Chello P L. Cancer Res. 1981;41:4441–4446. [PubMed] [Google Scholar]
- 40.Cook J D, Cichowitz D J, George S, Lawler A, Shane B. Biochemistry. 1987;26:530–539. doi: 10.1021/bi00376a027. [DOI] [PubMed] [Google Scholar]
- 41.Matherly L H, Seither R L, Goldman I D. In: Anticancer Drugs: Antimetabolite Metabolism and Natural Anticancer Agents. Powis G, editor. Oxford: Pergamon; 1994. pp. 139–177. [Google Scholar]


