

Abstract
Identifying task related activation in the basal ganglia (BG) is an important area of interest in normal motor systems and cognitive neuroscience. The purpose of this study was to compare changes in brain activation in the BG using results obtained from two different masking methods: a mask drawn in standardized space from a T1 weighted anatomical image and individual region of interest (ROI) masks drawn from each subject’s echo-planar (EPI) image from different tasks with reference to the high resolution fast spin echo image of each subject. Two standardized masks were used: a mask developed in Talairach space (Basal Ganglia Human Area Template (BGHAT)) and a mask developed in Montreal Neurological Institute space (MNI mask). Ten subjects produced fingertip force pulses in five separate contraction tasks during fMRI scanning. ROIs were the left caudate, putamen, external and internal portions of the globus pallidus, and subthalamic nucleus. ANOVA revealed a similar average number of voxels in the EPI mask across tasks in each BG region. The percent signal change (PSC) was consistent within each region regardless of which mask was used. Linear regression analyses between PSC in BGHAT and EPI masks and MNI and EPI masks yielded r² values between 0.74–0.99 and 0.70–0.99 across regions, respectively. In conclusion, PSC in different BG ROIs can be compared across studies using these different masking methods. The masking method used does not affect the overall interpretation of results with respect to the effect of task. Use of a mask drawn in standardized space is a valid and time saving method of identifying PSC in the small nuclei of the BG.
Keywords: fMRI, subthalamic nucleus, caudate, putamen, globus pallidus, percent signal change, mask
Introduction
Functional magnetic resonance imaging (fMRI) has become an important tool in understanding brain organization and task related changes in brain function in both the healthy and diseased populations. Since its introduction, blood oxygenation level-dependent (BOLD) based fMRI has emerged as the primary method of indirectly identifying areas of neuronal activation within the brain (Bandettini et al., 1992; Kwong et al., 1992; Ogawa et al., 1992). The magnitude of the task related BOLD signal change between rest and activation is relatively small, typically in the order of 1–3% for individual voxels (Moonen and Bandettini, 2000, p. 278). This can be problematic when trying to assess activation in small regions of the brain such as nuclei of the basal ganglia (BG) where the signal to noise ratio is smaller than in the cortex (Parrish et al., 2000). The BG are an important area of interest in normal motor systems and cognitive neuroscience (Turner et al., 2003; Monchi et al., 2006; Seidler et al., 2006). The BG are also of particular interest in studying many movement disorders such as Parkinson’s disease (Graybiel et al., 1994; Grafton, 2004), Huntington’s disease (Coyle and Schwarcz, 1976), dystonia (Peller et al., 2006), and psychiatric problems such as schizophrenia (Lidsky et al., 1979).
The basic sampling unit of fMRI is the volume element or voxel. Depending on the scanning parameters, a typical voxel size may be around 30 µl, and depending on the matrix size and number of slices collected, there can be thousands of voxels in the brain (Woods, 1996). When examining the subthalamic nucleus (STN) in humans, which has an estimated size of 240 µl (Hamani et al., 2004), this translates to examining activation in only 8 voxels. In order to identify activation in the STN, these 8 voxels must be appropriately identified from surrounding structures whose function and resulting activation during a task may be very different (e.g. the red nucleus). Incorrect identification of regions of interest (ROI) within the brain will lead to erroneous conclusions about task related activation in those regions, and could have the potential of influencing patient care.
Different approaches have been employed to identify task related activation in specific ROIs within the brain. One approach is to create a template identifying specific ROIs on a transformed anatomical image. Transformation allows data from multiple subjects to be placed in the same orientation and grid which enables voxel based statistical computations for groups of subjects or patients. The major advantage of using a mask developed in standardized space is that data can be used in neuroinformatic databases that integrate brain imaging studies from other laboratories across the world (Martone et al., 2004; Van Horn et al., 2004). However, a major disadvantage is that it fails to account for variability in cortical landmarks across subjects so that a given voxel does not represent a homologous anatomic location in each individual’s brain (Woods, 1996; Lazar et al., 2002). This may be more problematic for smaller structures in the brain, like the nuclei of the BG, given the limited spatial resolution of whole brain fMRI (Aron and Poldrack, 2006).
A second approach used in analysis, which minimizes intersubject variability in brain anatomy, is to identify ROIs on individual subject images using high resolution structural and functional imaging protocols (Woods, 1996). The major advantage of this method is that the anatomical image and functional image are co-registered allowing ROIs to be determined on an individual subject basis. A major disadvantage of this method however is the time consuming nature of completing this identification on a slice by slice basis for every subject.
We are unaware of any previous comparison of these two commonly used analysis methods. Understanding the different results obtained from using the two methods will facilitate interpretation of data obtained using either method, and may validate comparisons between studies involving different methodologies. Therefore, the purpose of this study was to compare changes in brain activation in the BG nuclei using these two methods. To that end, ROI masks of the BG were developed in the two most widely used spaces in the neuroscience community, Talairach space and Montreal Neurological Institute (MNI) space (Chau and McIntosh, 2005). The masks developed in standardized space were then compared against individual ROI masks drawn from each subject’s echo-planar (EPI) image.
Materials and Methods
Subjects
Ten right-handed subjects, 4 males and 6 females, age 20–37 years, participated in the experiment. This study was performed in accordance with the Declaration of Helsinki. All participants gave written informed consent prior to inclusion in the study.
Experimental design
During the experiment, subjects produced force output using a rigid precision grip device using their right hand (Figure 1A). The custom grip apparatus is made of nonmetallic material allowing its use inside the fMRI environment. The grasping apparatus is connected to a 35 ft nylon tube, which leads into an Entran (EPX-N13-250P) pressure transducer located outside the scanner room. When the pinch grip is performed the hydraulic pressure inside the tube increases, which is sensed by the pressure transducer. The pressure transducer output was amplified through a pressure gauge amplifier. A PCMCI National Instruments A/D converter sampled the pressure at a frequency of 100 Hz. The target force level in this experiment was specified at 15% of the maximal voluntary contraction (MVC). The MVC was calculated for each subject at the beginning of data collection similarly to previous work (Vaillancourt et al., 2004).
Figure 1.
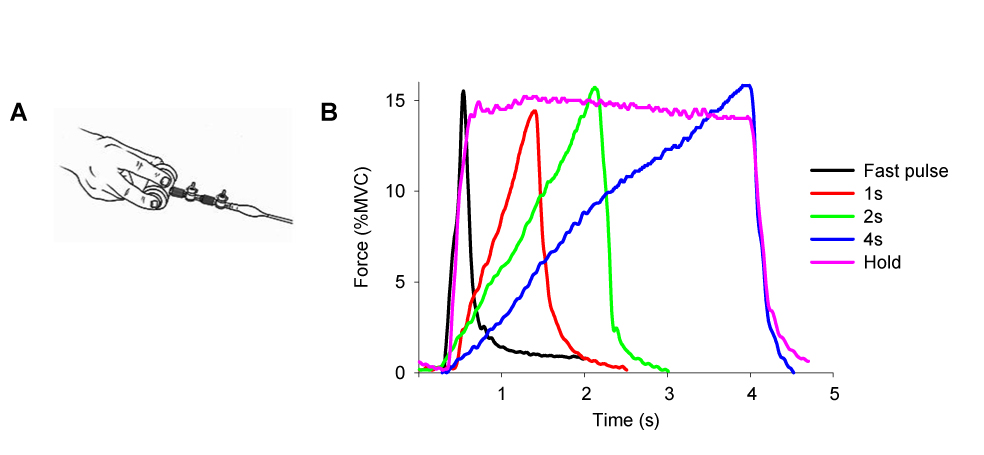
A. Hand configuration for the force pulse task. B. The five force contractions produced in each scan.
The experiment used a block design paradigm. There were five functional scans each lasting 7 minutes and 10 seconds. Each functional scan started with a 30s rest block alternating with a 70s task block, which repeated four times and ended with a 30s rest block. Each 70s task block consisted of 30s force production with visual feedback, a 10s break, and 30s force production with auditory feedback. Only data from the visual feedback and rest conditions were analyzed for this paper. During the force conditions subjects were required to generate a force pulse to 15% of MVC every five seconds, resulting in six force pulses in one 30s block. For each functional scan, subjects were instructed to generate force pulses in one of five force contraction types: 0.5s, 1s, 2s, 4s, and Hold (Figure 1B).
During each functional scan there was always a horizontal target bar presented on the screen that was stationary and set at 15% of MVC. For the rest block, the target bar was in red color and subjects were required to fixate on the red target bar and produce no force. During the force block, the red target bar turned green that cued the initiation of force production. (1) 0.5s task: the green time of the target bar lasted only 0.5s, and returned to red for 4.5s. Correspondingly, subjects were to generate a force pulse to 15% MVC as accurate and fast as possible within approximately 0.5s, and release force for the remaining 4.5s. (2) 1s task: the target bar turned green for 1s, and returned to red for 4s. Subjects were required to produce force to 15% MVC over 1s, and then relax when the target bar returned to red. (3) 2s task: the target bar turned green for 2s, and returned to red for 3s. Subjects were required to generate force to 15% MVC over 2s and then relax for 3s. (4) 4s task: the target bar turned green for 4s, and returned to red for 1s. Subjects were required to generate force to 15% MVC over a 4s period and then relax for 1s. (5) Hold: the green time of the target bar was 4s, and returned to red for 1s. Subjects were required to generate force to 15% MVC as fast as possible, and maintained the force level for the 4s period. There was also a horizontal white bar shown on the screen that represented the force magnitude produced by the subject. The white target bar moved vertically towards the green target bar when subjects produced force. A 15% force output was a spatial overlap of the two bars. The order of the five scans was randomly presented for each subject. Anatomical scans were taken following the functional scan. Each subject participated in a 1 hour training session prior to data collection.
fMRI Data Acquisition
Imaging data were obtained on a 3T Signa scanner (3T94 EXCITE 2, General Electric Healthcare, Milwaukee, WI) . Head motion was restricted by using adjustable padding between the head and head coil apparatus. In addition, a fixation point was given to the subject together with visual feedback to facilitate a stable head position within and between scans (Thulborn, 1999). Functional images were obtained using a single shot, gradient-echo echo-planar imaging pulse sequence (EPI) (TE 25 ms, TR 2500 ms, flip angle 90°, field of view 200 mm × 200 mm, image matrix 64 × 64, 42 slices at 3 mm thickness with a 0 mm gap in between). High resolution fast spin echo (FSE) T2 weighted images were also acquired (TE 98 ms, TR 7000 ms, flip angle 90°, with a field of view of 200 × 200 mm, image matrix 512 × 512, 42 slices at 3 mm thickness). The FSE images were co-registered to the EPI. T1 weighted anatomical scans were acquired using a spoiled gradient echo pulse sequence (TE 1.8 ms, TR 8.5 ms, flip angle 25°, field of view 220 × 220 mm, imaging matrix 256 × 256, 120 contiguous slices with 1.5 mm slice thickness). All slices were acquired axially.
fMRI Data Analysis
To develop the individual EPI masks and the BGHAT mask in Talairach space, the public domain software AFNI (Cox, 1996) was used. To develop the Montreal Neurological Institute (MNI) mask the public domain software SPM5 was used (Friston, 2006). Motion detection and correction procedures were performed on each functional time series using 3D volume registration in AFNI. The head motion in all data sets was less than 1 mm in any direction (average peak to peak displacement within each sequence). The head motion was not significantly different between the five force tasks F(4, 36) = 0.47, p = 0.75. We also calculated head motion between scans. The first image from the first scan run was used as the base image for all five functional scans. The average between scan displacement across all scans and all subjects was 0.68 mm, 0.33 mm, and 0.32 mm in the superior-inferior, left-right, and posterior-anterior directions respectively. Data were not spatially blurred.
Regions of Interest
The specific regions of interest (ROIs) used in this study were the left caudate, left putamen, left external portion of the globus pallidus (GPe), left internal portion of the globus pallidus (GPi), and the left subthalamic nucleus (STN) (Figure 2A). ROIs were drawn on axial planes in two ways (Figure 2A) and results obtained from each method were compared. First, an ROI analysis was performed for the BG using a mask drawn in two different standardized spaces: a mask developed in Talairach space using AFNI and a mask developed in MNI space using SPM5. For the Talairach mask, ROIs were drawn on a single Talairach transformed anatomical image to form a template mask (BGHAT mask), and this template was overlaid on each subject’s Talairach transformed functional image. For the MNI mask, ROIs were drawn on a single subject’s anatomical image transformed to fit the average T1-weighted ICBM152 template. All ROIs were drawn prior to any data analysis. The second method of ROI analysis involved drawing a mask of the same BG regions on each subject’s EPI with reference to the high resolution FSE image of each subject (EPI mask). This method does not require transformation into standardized space. Our previous experience with drawing ROIs within the BG (Spraker et al., 2007; Vaillancourt et al., 2007) and anatomical guidelines from previously published literature were used to help identify boundaries of each nuclei:
Figure 2.
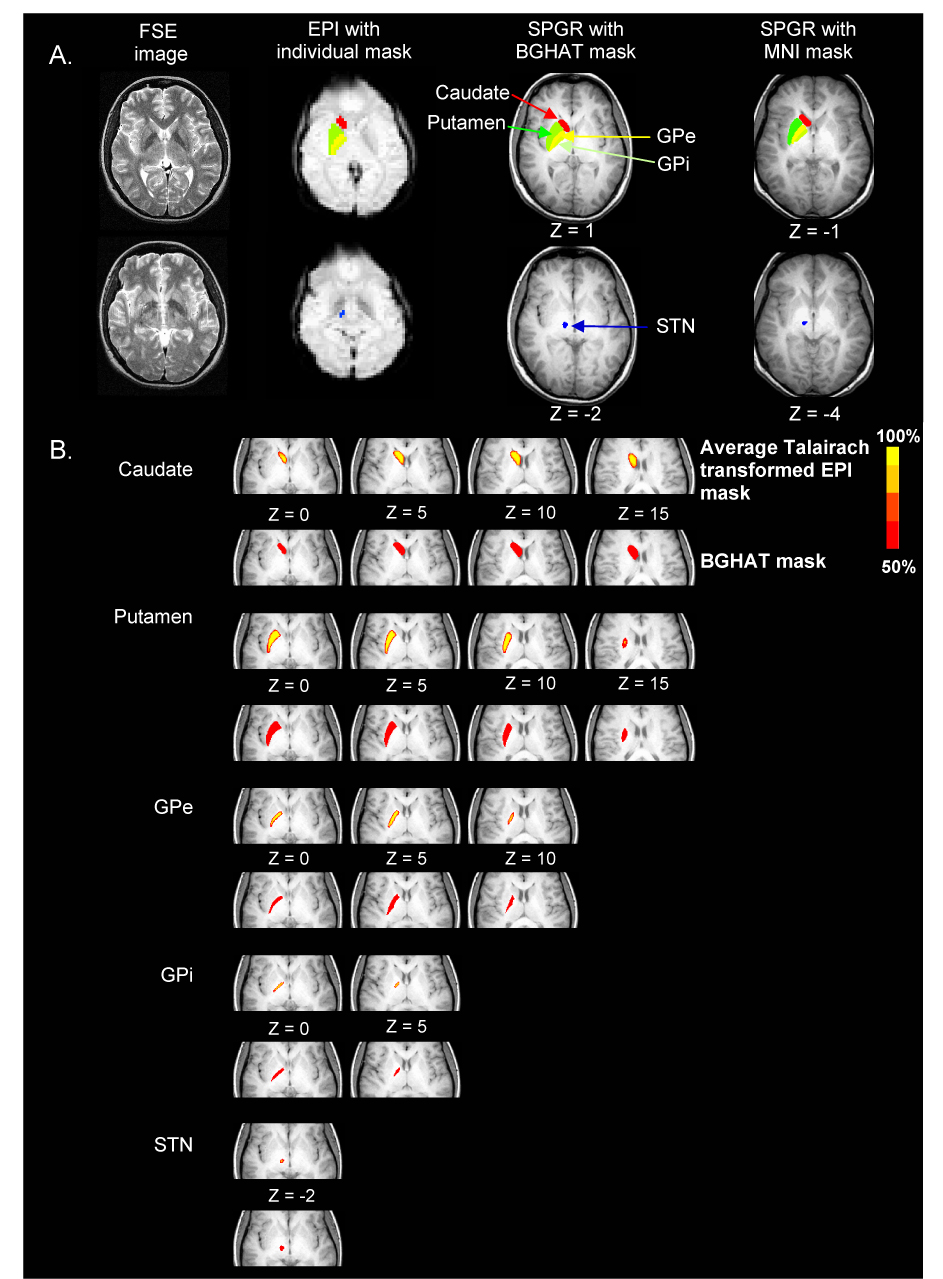
A. FSE, EPI and SPGR images from one subject. ROIs were caudate (red), putamen (dark green), GPe (yellow), GPi (light green), and STN (blue) which are shown for the EPI mask (EPI image), the BGHAT mask (SPGR image), and the MNI mask (SPGR image). B. Average Talairach transformed EPI mask and the BGHAT mask at different axial slices for each of the five BG regions. For the average EPI mask, areas were included that presented in more than 50% of EPI drawings.
Caudate nucleus
the caudate nucleus is a curved structure with the rostral head being more voluminous than the body rostrally (Yelnik, 2002). It can be identified up to the level of the top of the ventricles. The medial border of the caudate nucleus is defined by the frontal horn or body of the lateral ventricle and the lateral edge by the anterior limb of the internal capsule (Ifthikharuddin et al., 2000). In the coronal plane, the caudate nucleus can be identified from the section in which the pineal gland is most prominently displayed (Ifthikharuddin et al., 2000).
Putamen
limited medially on inferior sections by the globus pallidus and on more superior levels by the internal capsule (Ifthikharuddin et al., 2000). Anteriorly, the anterior limb of the internal capsule separates the putamen from the caudate. Laterally, it is limited by the external capsule which is identified as high intensity white matter.
Globus pallidus
limited medially by the posterior limb of the internal capsule and laterally by the putamen (Ifthikharuddin et al., 2000). It is divided into the globus pallidus internal portion (GPi) and the globus pallidus external portion (GPe). The GPe lies lateral to the GPi and is almost twice as large (Yelnik, 2002).
STN
lies ventral to the thalamus, medial to the peduncular portion of the internal capsule, and lateral and caudal to the hypothalamus. It is lateral to the red nucleus and dorsolateral to the substantia nigra in the coronal plane (or anteromedial in the axial plane) (Dormont et al., 2004). The anterior portion of the STN has been shown to be hypointense on coronal T2 weighted EPI images and always visible while the posterior part of the sensorimotor STN is not always visible on T2 weighted images (Dormont et al., 2004). The center of the STN has been suggested to be represented by the anterior border of the red nucleus (Bejjani et al., 2000), or 2mm anterior to a line drawn orthogonal to the anterior border of the red nucleus (Danish et al., 2006). The size of the STN may be smaller than reported in the Talairach and Tournoux atlas, particularly in the medial-lateral direction (Richter et al., 2004).
Test-retest (intrarater) reliability in drawing the EPI masks was assessed by redrawing the ROI on the 50 EPIs for one subject without reference to the original EPI mask for that subject. The percentage of voxel overlap between the first and second EPI mask drawings averaged across task was: caudate 95.4%, putamen 98.4%, GPe 96.8%, GPi 95.7%, and STN 96.6%.
To characterize how well the EPI overlapped with a mask developed in standardized space, we created an average Talairach transformed EPI mask for each region (Figure 2B) and compared the overlap with the BGHAT mask. The individual EPI masks for each BG nucleus in each of the five force tasks were first transformed into Talairach space. This resulted in 50 EPI masks for each BG nucleus. An average mask for each BG nucleus was then created by averaging the 50 EPI masks. Finally, we quantified the minimum, maximum, and median xy coordinates on a slice by slice basis for the average Talairach transformed EPI mask and the BGHAT Talairach transformed mask (Table 1). To allow comparison of coordinates of each mask, we also show coordinates of the MNI mask (Table 2). It is important to note however that the coordinates of the two standardized masks will be different since a different brain template was used to develop each of them (Chau and McIntosh, 2005; Lancaster et al., in press).
Table 1.
Summary statistics for basal ganglia regions in the average Talairach transformed EPI mask and the BGHAT mask. Data are the minimum, maximum, and median xy coordinates axially every 3mm.
| Averaged Talairach Transformed EPI Mask | BGHAT Talairach Transformed Mask | ||||||||||||
|---|---|---|---|---|---|---|---|---|---|---|---|---|---|
| x coordinate |
y coordinate |
x coordinate |
y coordinate |
||||||||||
| z | Min | Max | Median | Min | Max | Median | Min | Max | Median | Min | Max | Median | |
| Caudate | −3 | −11 | −6 | −8 | 7 | 15 | 10 | −13 | −6 | −10 | 7 | 17 | 12 |
| 0 | −16 | −4 | −9 | 4 | 21 | 13 | −17 | −5 | −10 | 6 | 21 | 14 | |
| 3 | −18 | −4 | −10 | 4 | 22 | 14 | −19 | −3 | −10 | 5 | 21 | 14 | |
| 6 | −19 | −4 | −10 | 3 | 22 | 14 | −19 | −3 | −10 | 4 | 22 | 14 | |
| 9 | −19 | −5 | −11 | 2 | 22 | 14 | −19 | −3 | −10 | 2 | 22 | 14 | |
| 12 | −19 | −6 | −12 | 0 | 21 | 12 | −19 | −3 | −11 | 1 | 21 | 12 | |
| 15 | −18 | −6 | −12 | −2 | 18 | 9 | −19 | −4 | −11 | −2 | 18 | 9 | |
| 18 | −17 | −8 | −13 | −6 | 15 | 5 | −18 | −6 | −12 | −5 | 15 | 5 | |
| 21 | −16 | −11 | −13 | −8 | 8 | 0 | −17 | −9 | −13 | −11 | 9 | −1 | |
| Putamen | −3 | −30 | −13 | −22 | −10 | 15 | 5 | −31 | −11 | −22 | −13 | 17 | 5 |
| 0 | −32 | −13 | −25 | −16 | 17 | 5 | −33 | −12 | −25 | −18 | 17 | 4 | |
| 3 | −32 | −14 | −25 | −17 | 17 | 4 | −33 | −13 | −25 | −19 | 18 | 4 | |
| 6 | −31 | −16 | −25 | −17 | 16 | 3 | −31 | −15 | −25 | −19 | 17 | 2 | |
| 9 | −30 | −17 | −25 | −16 | 14 | 1 | −30 | −17 | −25 | −19 | 15 | 1 | |
| 12 | −29 | −18 | −24 | −14 | 11 | −1 | −29 | −16 | −24 | −17 | 12 | −1 | |
| 15 | −27 | −20 | −23 | −9 | 5 | −2 | −28 | −20 | −24 | −12 | 7 | −2 | |
| GPe | −3 | −26 | −11 | −19 | −10 | 4 | −2 | −29 | −11 | −20 | −14 | 3 | −2 |
| 0 | −27 | −10 | −20 | −15 | 6 | −2 | −30 | −10 | −20 | −19 | 6 | −2 | |
| 3 | −27 | −11 | −20 | −16 | 7 | −2 | −29 | −10 | −21 | −20 | 8 | −4 | |
| 6 | −27 | −12 | −20 | −16 | 8 | −3 | −28 | −11 | −20 | −20 | 9 | −4 | |
| 9 | −25 | −14 | −19 | −14 | 6 | −3 | −27 | −13 | −19 | −19 | 8 | −4 | |
| GPi | 0 | −23 | −9 | −16 | −12 | 2 | −4 | −26 | −8 | −17 | −16 | 3 | −5 |
| 3 | −19 | −9 | −14 | −9 | 3 | −2 | −20 | −9 | −14 | −11 | 4 | −3 | |
| 6 | −16 | −11 | −14 | −5 | 2 | −2 | −17 | −10 | −14 | −8 | 3 | −2 | |
| STN | −5 | −14 | −7 | −11 | −17 | −11 | −14 | −13 | −7 | −10 | −17 | −12 | −14 |
| −2 | −13 | −8 | −11 | −16 | −11 | −14 | −14 | −8 | −11 | −17 | −10 | −13 | |
Table 2.
Summary statistics for basal ganglia regions in the MNI mask. Data are the minimum, maximum, and median xy coordinates axially every 3mm.
| MNI Mask | |||||||||
|---|---|---|---|---|---|---|---|---|---|
| x coordinate |
y coordinate |
||||||||
| z | Min | Max | Median | Min | Max | Median | |||
| Caudate | −6 | −16 | −4 | −10 | 5 | 24 | 15 | ||
| −3 | −19 | −4 | −10 | 5 | 26 | 17 | |||
| 0 | −20 | −4 | −11 | 5 | 26 | 17 | |||
| 3 | −20 | −5 | −11 | 5 | 25 | 17 | |||
| 6 | −20 | −5 | −12 | 4 | 25 | 16 | |||
| 9 | −20 | −6 | −12 | 3 | 23 | 14 | |||
| 12 | −19 | −7 | −13 | 2 | 21 | 12 | |||
| 15 | −18 | −9 | −13 | −1 | 17 | 8 | |||
| 18 | −18 | −11 | −15 | −5 | 13 | 4 | |||
| Putamen | −6 | −32 | −14 | −24 | −8 | 19 | 7 | ||
| −3 | −33 | −14 | −26 | −14 | 20 | 7 | |||
| 0 | −35 | −16 | −27 | −17 | 19 | 5 | |||
| 3 | −34 | −18 | −28 | −17 | 18 | 4 | |||
| 6 | −33 | −19 | −28 | −16 | 16 | 3 | |||
| 9 | −32 | −19 | −27 | −15 | 14 | 2 | |||
| 12 | −31 | −21 | −27 | −13 | 8 | −1 | |||
| GPe | −6 | −27 | −11 | −19 | −8 | 6 | 0 | ||
| −3 | −29 | −11 | −21 | −14 | 9 | 0 | |||
| 0 | −29 | −12 | −21 | −14 | 10 | 0 | |||
| 3 | −29 | −13 | −22 | −15 | 10 | −1 | |||
| 6 | −28 | −15 | −22 | −15 | 8 | −2.5 | |||
| GPi | −3 | −25 | −9 | −17 | −12 | 4 | −3 | ||
| 0 | −24 | −10 | −16 | −11 | 4 | −2 | |||
| 3 | −18 | −12 | −15 | −5 | 4 | −1 | |||
| STN | −5 | −15 | −8 | −12 | −20 | −12 | −16 | ||
| −2 | −16 | −9 | −13 | −17 | −15 | −16 | |||
Next, we calculated the average percent signal change (PSC) within each region using the BGHAT and MNI masks and the individual untransformed EPI masks. The PSC for each voxel was calculated for the task condition against the baseline rest condition within each scan. To do the ROI analysis using the standardized masks, the individual’s PSC data was transformed into Talairach space using AFNI and into MNI space using SPM5. The BGHAT and the MNI masks were then applied to the respective transformed data sets. In the alternate method we drew the BG regions on each subject’s EPI images and then applied this mask on original untransformed data to obtain the PSC within each region. In both methods, the mean PSC within a region was calculated as the average of all voxels. The average PSC within a region was calculated for the 0.5s, 1s, 2s, 4s, and Hold force tasks using each mask. Data were confirmed to have a normal distribution using the Kolmogorov-Smirnov test. A three-way ANOVA was performed to detect differences across the type of mask used (BGHAT, MNI, and EPI), task (0.5s, 1s, 2s, 4s, and Hold), and region (caudate, putamen, GPe, GPi, and the STN) using Statistica (version 6.1, StatSoft Inc.). Robust regression analyses were performed using S-PLUS (version 8.0, Insightful Corp.). All statistics in the analysis of variance were evaluated as significant when there was less than a 5% chance of making a Type I error (p < .05). Only significant effects are reported.
Results
Voxel count by mask type
Figure 2B shows that the BG ROIs in the average Talairach transformed EPI mask and the BGHAT mask are spatially similar. Examination of the summary statistics in Table 1 confirms appropriate spatial overlap across these masks. This is also shown in Figure 3. As expected, the coordinates of the MNI mask (Table 2) were slightly different from those of the BGHAT mask.
Figure 3.
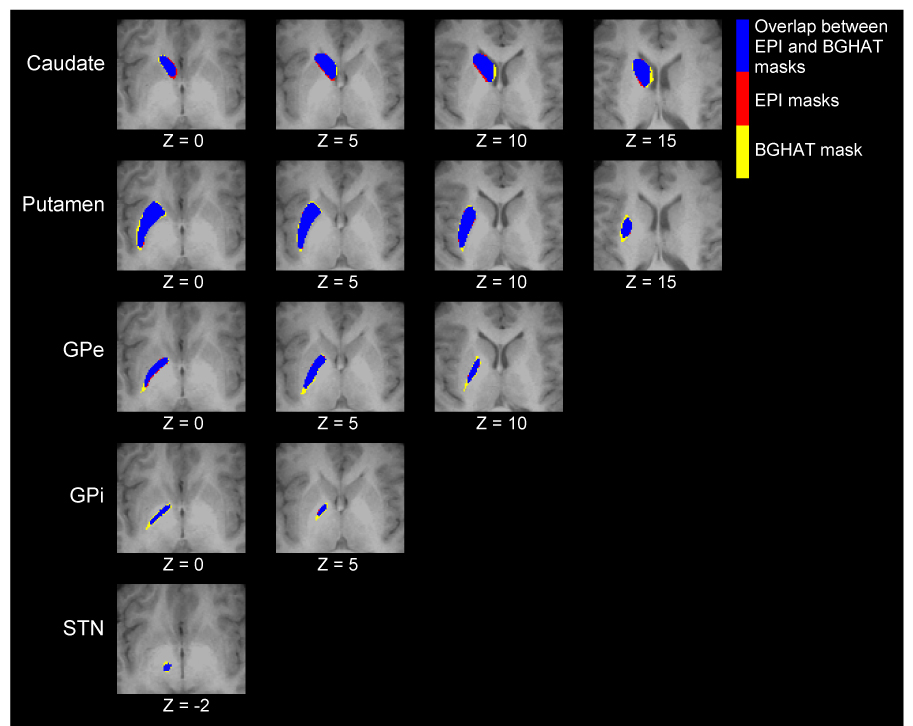
Average Talairach transformed EPI mask (red), the BGHAT mask (yellow), and the region of overlap between them (blue).
Figure 4 shows the number of voxels present in each BG region across task condition for the untransformed EPI masks, the BGHAT mask, and the MNI mask. For comparison purposes, the number of voxels in the BGHAT and MNI masks is divided by the voxel size in the individual EPI mask. The average number of voxels in the EPI mask was similar for each task within each BG region. A 2 way ANOVA was performed to compare the number of voxels used to create the individual EPI masks for each subject across task condition and region. There were no differences between task conditions in the number of voxels in each region. As expected, there were differences in the number of voxels in each region [F(4,36)=1021.65, p< .001]. Importantly however, there was no task by region interaction showing that the number of voxels in each EPI mask was stable in that it did not differ as a function of task across the different BG regions.
Figure 4.
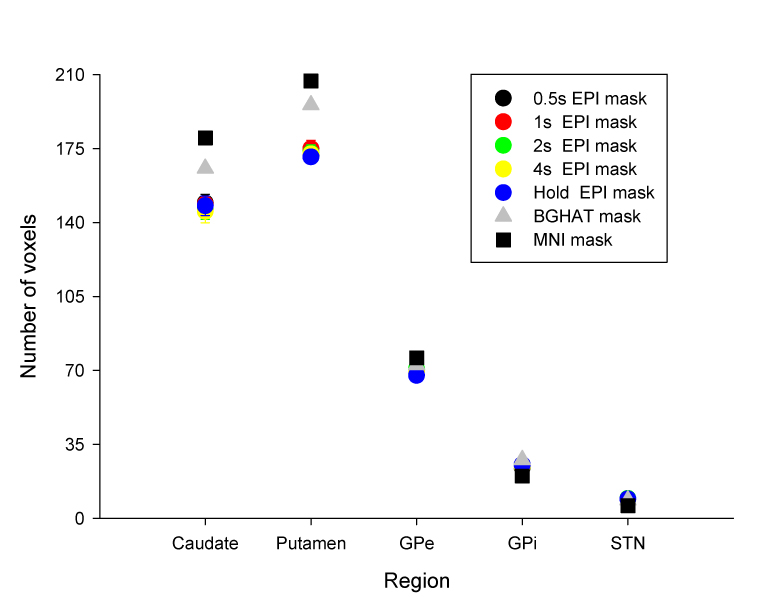
The average number of all voxels in the individual EPI masks in each task condition averaged across subjects (circles) and the number of voxels in the BGHAT mask (triangle) and the MNI mask (square). Note, for the BGHAT and MNI masks, the number of voxels is the same regardless of task. For comparison purposes, the number of voxels in the BGHAT and MNI masks is divided by the voxel size in the individual EPI mask.
Percent signal change across mask type
Figure 5 shows the average PSC for each mask type across task condition in the individual ROIs. The average PSC was consistent within each region regardless of which mask was used. Statistical analysis supported this observation. A 3 way ANOVA (Mask by Region by Task) revealed no significant main effect for Mask. The main effect for Region was significant [F(4,36)=3.03, p= 0.030], as was the main effect for Task [F(4,36)=3.65, p= 0.013] with PSC increasing with increasing duration of contraction. None of the interactions were significant. To examine whether the choice of individual used to create a mask drawn in standardized space significantly impacted the PSC results, we created a second BGHAT mask on a different subject. We applied this second BGHAT mask to the remaining subjects and recalculated the PSC. We compared results obtained with each of the BGHAT masks using ANOVA. There was no main effect of mask and no Mask by Task interaction.
Figure 5.
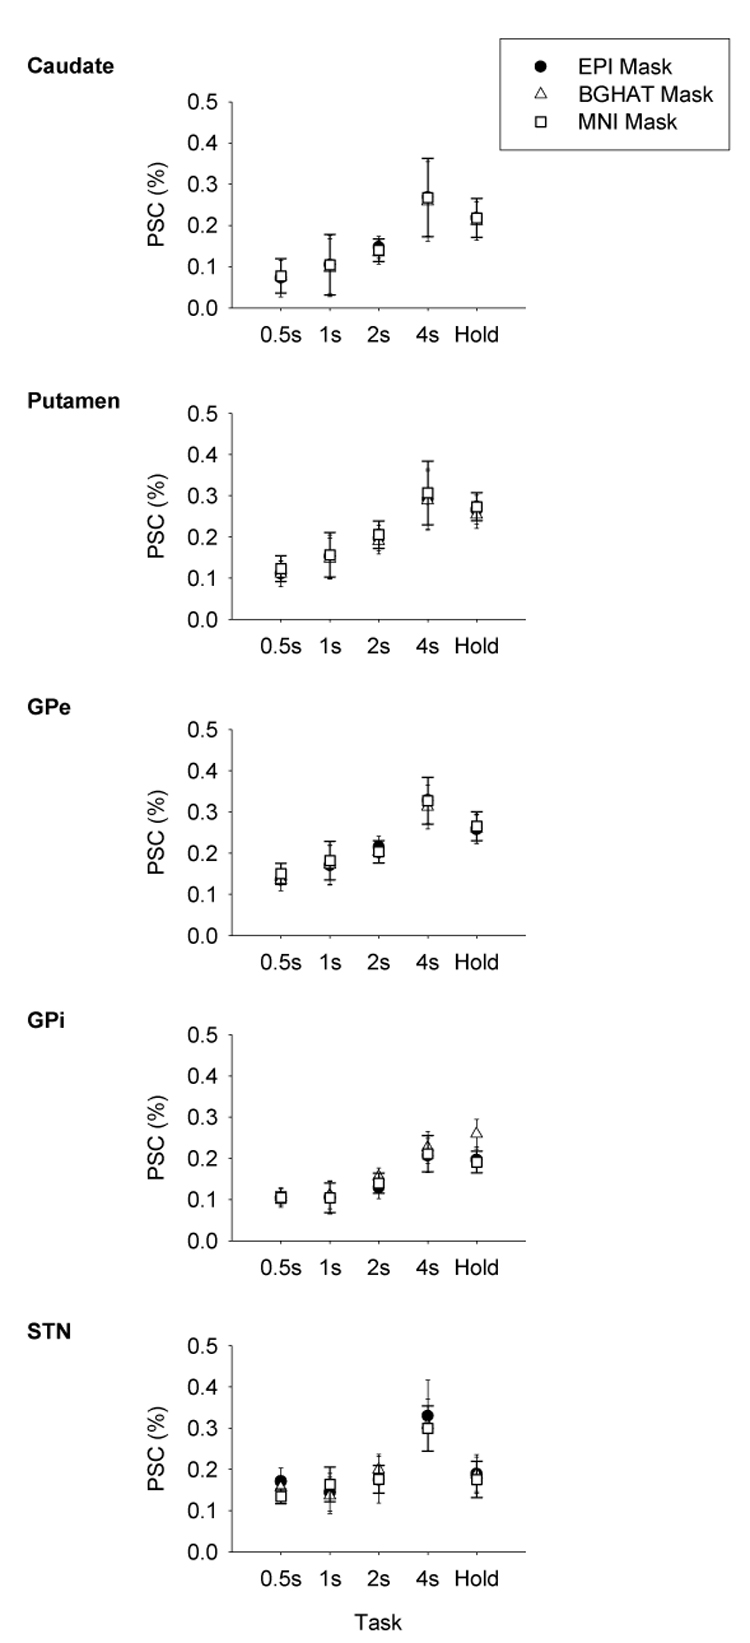
Percent signal change across the five force contraction tasks calculated using the individual EPI mask (circles), the BGHAT mask (triangles), and the MNI mask (squares) for each BG ROI. Data are the mean and standard error.
To further validate the use of a standardized mask, we performed robust linear regression analysis between the PSC calculated using the individual EPI masks and the BGHAT masks (Figure 6 panel A) and the individual EPI masks and the MNI mask (Figure 6 panel B) across regions. There were strong linear relationships between EPI and both sets of standardized mask data. The amount of variance accounted for with linear regression was high across all regions with r² values ranging from 0.74 to 0.99 for the BGHAT vs. EPI masks and 0.70 to 0.99 for the MNI vs. EPI masks. Slopes were similar across regions (BGHAT and EPI: Caudate 0.96, Putamen 0.98, GPe 0.94, GPi 0.87, and STN 0.88; MNI and EPI: Caudate 1.02, Putamen 1.03, GPe 0.96, GPi 0.92, and STN 0.84). Intercepts were also similar across regions (BGHAT and EPI: Caudate 0.001, Putamen -0.001, GPe 0.005, GPi -0.036, and STN 0.021; MNI and EPI: Caudate -0.003, Putamen 0.005, GPe 0.013, GPi 0.022, and STN 0.034).
Figure 6.
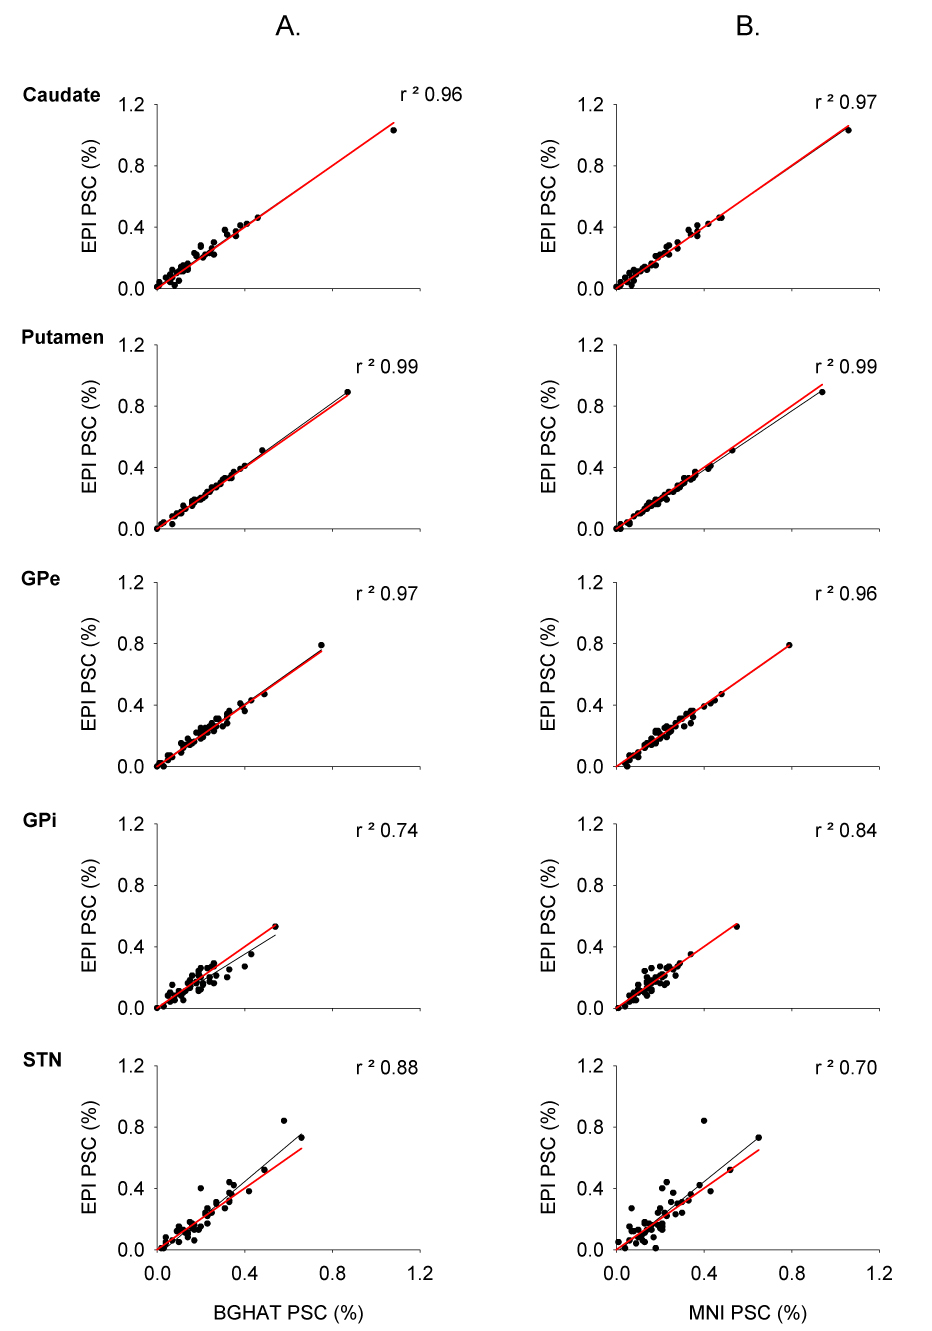
Linear regression (black lines) between the percent signal change calculated using the BGHAT mask (part A) and the MNI mask (part B) against the percent signal change calculated using the individual EPI masks for each of BG ROIs. Each data point represents the average percent signal change for every subject for each force contraction task. For reference purposes, the unit line with an intercept of 0 and a slope of 1 is shown in red.
Discussion
The purpose of this study was to compare changes in brain activation in the nuclei of the BG using results obtained from two different ROI masking methods. The first masking method used was a mask drawn in standardized space. Two standardization methods were used, a Talairach transformation using AFNI (BGHAT mask) and an MNI transformation using SPM5 (MNI mask). Each of these masks was drawn on a single subject’s transformed anatomical image. The second masking method was an EPI mask for every task condition drawn on each individual subject’s EPI with reference to the high resolution fast spin echo image. There are two important findings from this study. First, use of a standardized mask produced PSC values that were very consistent with results obtained using an EPI generated mask. This suggests that results obtained across studies using these different masking methods can be compared. Second, the masking method used did not affect the overall interpretation of results with respect to the effect of task. The strong linear relationship between PSC from the EPI and the BGHAT masks and the EPI and the MNI masks provides evidence of validity for the use of a mask of the BG drawn in standardized space.
Identification of neural activation related to specific brain structures is indirectly reflected by changes in the BOLD response with fMRI (Logothetis and Wandell, 2004). Current and future applications of fMRI provide the ability to move from basic cognitive neuroscience to a myriad of clinical applications including fMRI guided neurosurgery, pharmacological fMRI and pre-symptomatic diagnosis of disease (Matthews et al., 2006). In understanding basic cognitive processes however, the ability to ascribe task related changes in brain function to specific brain regions is dependent on the ability to correctly localize specific brain regions. This task is made all the more challenging when one considers small nuclei of the brain such as the BG, which have increasingly been shown to be important in many aspects of motor control and cognitive neuroscience, and an area of particular interest in studying many movement disorders.
Group analysis of functional data from multiple subjects is based on accurate co-registration of anatomy. Stereotaxic methods for region identification offer one way to relate activation to specific brain regions. The use of a standardized template for ROI identification such as those developed in Talairach or MNI space however has several disadvantages. First, the spatially normalized templates are developed from neurologically normal brain images. Relationships that hold in the normal brain may not be applicable in the diseased brain, which has implications for clinical fMRI. It is also now understood that there can be considerable variation in brain anatomy between individuals, including differences in the location and shape of key sulci that form the basic landmarks of the stereotaxic coordinate system (Steinmetz et al., 1990a; Steinmetz et al., 1990b). Overall, standardized templates may be better at representing central structures close to the origin of the 3D coordinate space like the BG than for more lateral structures. Within the BG, we found a similar number of voxels in the BGHAT and MNI masks compared to the number of voxels in the EPI mask for each region which suggests this to be the case. However, it should be noted that any spatial smoothing of the data, such as smoothing that occurs as a result of motion correction due to interpolation, may significantly affect results in the small nuclei of the BG.
Given the aforementioned disadvantages of using spatially transformed images, it is important to understand how transforming data to stereotaxic space may affect interpretation of brain activation levels. The first finding in this study was that use of either of the spatially transformed masks produced PSC values that were comparable to those generated using individual EPI masks. Thus, use of spatially transformed images does not adversely affect calculation of PSCs in the small nuclei of the BG. Further work is required to confirm this in more lateral and distal areas of the brain, particularly in the frontal and parietal regions, where the effects of differential distortion due to the anatomy of the region may be of concern. Further work is also needed to validate the normalized masks in different patient populations with disease processes affecting the brain and in older subjects who may show large amounts of atrophy. Within the BG, we showed here that the PSC was smallest for the pulse task. Given that one cost of using a normalization approach is in the signal to noise ratio, the PSC itself may have been expected to be lower when calculated using a spatially transformed mask compared to the EPI mask. However, we did not find either a Mask by Task interaction or a Mask by Task by Region interaction for PSC. This suggests that using spatial normalization does not differentially affect detection of activation in regions or in tasks with different signal to noise ratios.
The second finding from this study is that the masking method used does not affect the overall interpretation of results with respect to the effect of task. We found that the PSC did not differ as a function of mask and task or mask and region. This is also supported by the high r² values for each region between the PSC calculated between the BGHAT and EPI masks and the MNI and EPI masks (Figure 6). An enormous savings in time and resources is provided by using a mask created in standardized space rather than an EPI mask. To draw a mask on individual slices for each scan even for just the five BG nuclei of interest in this study takes anywhere from 60–90 minutes per scan when a highly trained individual performs the drawing. For ten subjects across five tasks, this translates into a conservative estimate of 50 hours of time spent marking regions of interest per experiment. On the other hand, using a standardized mask such as the BGHAT mask or the MNI mask which has already been generated is an automated procedure and only requires minimal manual intervention in terms of review. Tracing regions manually on scans from individual subjects where post-mortem confirmation is not available is the gold standard for ROI analysis on fMRI data. However, it is not without problems beyond its time and labor intensive nature. An automated technique may be more reliable for larger data sets since manual tracing requires careful training and frequent calibration checks across and within individuals over time (Andreasen et al., 1996). For larger data sets, manual tracing is also more likely to be associated with rater drift leading to diminished reliability and validity (Andreasen et al., 1996).
Use of a standardized mask has other advantages beyond time savings, the most important of which being the ability to compare data across laboratories. Reporting Talairach or MNI coordinates enables data to be presented in a standardized coordinate system that can be added to neuroinformatic databases that integrate brain imaging studies from other laboratories across the world (Fox and Lancaster, 2002; Martone et al., 2004; Van Horn et al., 2004). However, it should be noted that the mapping of a coordinate in MNI space to Talairach space generates distinct coordinates for different subjects (Chau and McIntosh, 2005; Lancaster et al., in press).
We conclude that developing a mask of the BG in standardized space is a valid and time saving method of identifying PSC in the small nuclei of the BG. The BGHAT mask used in the present study can be obtained though e-mail from the corresponding author or by download from http://mcl.mvsc.uic.edu/index.htm
Acknowledgments
This research was supported in part by grants from the National Institutes of Health (R0I–NS-52318, R03-MH-075791). We thank the staff at the Center for MR Research at UIC for their contribution to the data collection.
Footnotes
Publisher's Disclaimer: This is a PDF file of an unedited manuscript that has been accepted for publication. As a service to our customers we are providing this early version of the manuscript. The manuscript will undergo copyediting, typesetting, and review of the resulting proof before it is published in its final citable form. Please note that during the production process errors may be discovered which could affect the content, and all legal disclaimers that apply to the journal pertain.
References
- Andreasen NC, Rajarethinam R, Cizadlo T, Arndt S, Swayze VW, 2nd, Flashman LA, O‘Leary DS, Ehrhardt JC, Yuh WT. Automatic atlas-based volume estimation of human brain regions from MR images. J Comput Assist Tomogr. 1996;20:98–106. doi: 10.1097/00004728-199601000-00018. [DOI] [PubMed] [Google Scholar]
- Aron AR, Poldrack RA. Cortical and subcortical contributions to Stop signal response inhibition: role of the subthalamic nucleus. J Neurosci. 2006;26:2424–2433. doi: 10.1523/JNEUROSCI.4682-05.2006. [DOI] [PMC free article] [PubMed] [Google Scholar]
- Bandettini PA, Wong EC, Hinks RS, Tikofsky RS, Hyde JS. Time course EPI of human brain function during task activation. Magn.Reson.Med. 1992;25:390–398. doi: 10.1002/mrm.1910250220. [DOI] [PubMed] [Google Scholar]
- Bejjani BP, Dormont D, Pidoux B, Yelnik J, Damier P, Arnulf I, Bonnet AM, Marsault C, Agid Y, Philippon J, Cornu P. Bilateral subthalamic stimulation for Parkinson's disease by using three-dimensional stereotactic magnetic resonance imaging and electrophysiological guidance. J Neurosurg. 2000;92:615–625. doi: 10.3171/jns.2000.92.4.0615. [DOI] [PubMed] [Google Scholar]
- Chau W, McIntosh AR. The Talairach coordinate of a point in the MNI space: how to interpret it. Neuroimage. 2005;25:408–416. doi: 10.1016/j.neuroimage.2004.12.007. [DOI] [PubMed] [Google Scholar]
- Cox RW. AFNI: software for analysis and visualization of functional magnetic resonance neuroimages. Comput Biomed Res. 1996;29:162–173. doi: 10.1006/cbmr.1996.0014. [DOI] [PubMed] [Google Scholar]
- Coyle JT, Schwarcz R. Lesion of striatal neurones with kainic acid provides a model for Huntington's chorea. Nature. 1976;263:244–246. doi: 10.1038/263244a0. [DOI] [PubMed] [Google Scholar]
- Danish SF, Jaggi JL, Moyer JT, Finkel L, Baltuch GH. Conventional MRI is inadequate to delineate the relationship between the red nucleus and subthalamic nucleus in Parkinson's disease. Stereotact Funct Neurosurg. 2006;84:12–18. doi: 10.1159/000092682. [DOI] [PubMed] [Google Scholar]
- Dormont D, Ricciardi KG, Tande D, Parain K, Menuel C, Galanaud D, Navarro S, Cornu P, Agid Y, Yelnik J. Is the subthalamic nucleus hypointense on T2-weighted images? A correlation study using MR imaging and stereotactic atlas data. AJNR Am J Neuroradiol. 2004;25:1516–1523. [PMC free article] [PubMed] [Google Scholar]
- Fox PT, Lancaster JL. Opinion: Mapping context and content: the BrainMap model. Nat Rev Neurosci. 2002;3:319–321. doi: 10.1038/nrn789. [DOI] [PubMed] [Google Scholar]
- Friston KJ. Statistical parametric mapping: the analysis of functional brain images. Oxford: Academic Press; [Google Scholar]
- Grafton ST. Contributions of functional imaging to understanding parkinsonian symptoms. Curr Opin Neurobiol. 2004;14:715–719. doi: 10.1016/j.conb.2004.10.010. [DOI] [PubMed] [Google Scholar]
- Graybiel AM, Aosaki T, Flaherty AW, Kimura M. The basal ganglia and adaptive motor control. Science. 1994;265:1826–1831. doi: 10.1126/science.8091209. [DOI] [PubMed] [Google Scholar]
- Hamani C, Saint-Cyr JA, Fraser J, Kaplitt M, Lozano AM. The subthalamic nucleus in the context of movement disorders. Brain. 2004;127:4–20. doi: 10.1093/brain/awh029. [DOI] [PubMed] [Google Scholar]
- Ifthikharuddin SF, Shrier DA, Numaguchi Y, Tang X, Ning R, Shibata DK, Kurlan R. MR volumetric analysis of the human basal ganglia: normative data. Acad Radiol. 2000;7:627–634. doi: 10.1016/s1076-6332(00)80579-6. [DOI] [PubMed] [Google Scholar]
- Kwong KK, Belliveau JW, Chesler DA, Goldberg IE, Weisskoff RM, Poncelet BP, Dennedy DN, Hoppel BE, Cohen MS, Tuner R, Cheng HM, Brady TJ, Rosen BR. Dynamic magnetic resonance imaging of human brain activity during primary sensory stimulation. Procedures of the National Academy of Science. 1992;89:5675–5679. doi: 10.1073/pnas.89.12.5675. [DOI] [PMC free article] [PubMed] [Google Scholar]
- Lancaster JL, Tordesillas-Gutierrez D, Martinez M, Salinas F, Evans A, Zilles K, Mazziotta JC, Fox PT. Bias between MNI and Talairach coordinates analyzed using the ICBM-152 brain template. Hum Brain Mapp. doi: 10.1002/hbm.20345. in press. [DOI] [PMC free article] [PubMed] [Google Scholar]
- Lazar NA, Luna B, Sweeney JA, Eddy WF. Combining brains: a survey of methods for statistical pooling of information. Neuroimage. 2002;16:538–550. doi: 10.1006/nimg.2002.1107. [DOI] [PubMed] [Google Scholar]
- Lidsky TI, Weinhold PM, Levine FM. Implications of basal ganglionic dysfunction for schizophrenia. Biol Psychiatry. 1979;14:3–12. [PubMed] [Google Scholar]
- Logothetis NK, Wandell BA. Interpreting the BOLD signal. Annu Rev Physiol. 2004;66:735–769. doi: 10.1146/annurev.physiol.66.082602.092845. [DOI] [PubMed] [Google Scholar]
- Martone ME, Gupta A, Ellisman MH. E-neuroscience: challenges and triumphs in integrating distributed data from molecules to brains. Nat Neurosci. 2004;7:467–472. doi: 10.1038/nn1229. [DOI] [PubMed] [Google Scholar]
- Matthews PM, Honey GD, Bullmore ET. Applications of fMRI in translational medicine and clinical practice. Nat Rev Neurosci. 2006;7:732–744. doi: 10.1038/nrn1929. [DOI] [PubMed] [Google Scholar]
- Monchi O, Petrides M, Strafella AP, Worsley KJ, Doyon J. Functional role of the basal ganglia in the planning and execution of actions. Ann Neurol. 2006;59:257–264. doi: 10.1002/ana.20742. [DOI] [PubMed] [Google Scholar]
- Moonen CTW, Bandettini PA, editors. Functional MRI. New York: Sprigner-Verlag; 2000. [Google Scholar]
- Ogawa S, Tank D, Menon R, Ellermann JM, Kim SG, Merkle H, Ugurbil K. Intrinsic signal changes accompanying sensory stimulation: Functional brain mapping using MRI. Procedures of the National Academy of Science. 1992;89:5951–5955. doi: 10.1073/pnas.89.13.5951. [DOI] [PMC free article] [PubMed] [Google Scholar]
- Parrish TB, Gitelman DR, LaBar KS, Mesulam MM. Impact of signal-to-noise on functional MRI. Magn Reson Med. 2000;44:925–932. doi: 10.1002/1522-2594(200012)44:6<925::aid-mrm14>3.0.co;2-m. [DOI] [PubMed] [Google Scholar]
- Peller M, Zeuner KE, Munchau A, Quartarone A, Weiss M, Knutzen A, Hallett M, Deuschl G, Siebner HR. The basal ganglia are hyperactive during the discrimination of tactile stimuli in writer's cramp. Brain. 2006;129:2697–2708. doi: 10.1093/brain/awl181. [DOI] [PubMed] [Google Scholar]
- Richter EO, Hoque T, Halliday W, Lozano AM, Saint-Cyr JA. Determining the position and size of the subthalamic nucleus based on magnetic resonance imaging results in patients with advanced Parkinson disease. J Neurosurg. 2004;100:541–546. doi: 10.3171/jns.2004.100.3.0541. [DOI] [PubMed] [Google Scholar]
- Seidler RD, Noll DC, Chintalapati P. Bilateral basal ganglia activation associated with sensorimotor adaptation. Exp Brain Res. 2006;175:544–555. doi: 10.1007/s00221-006-0571-y. [DOI] [PubMed] [Google Scholar]
- Spraker MB, Yu H, Corcos DM, Vaillancourt DR. Role of individual Basal Ganglia nuclei in force amplitude generation. J Neurophysiol. 2007;98:821–834. doi: 10.1152/jn.00239.2007. [DOI] [PMC free article] [PubMed] [Google Scholar]
- Steinmetz H, Furst G, Freund HJ. Variation of perisylvian and calcarine anatomic landmarks within stereotaxic proportional coordinates. AJNR Am J Neuroradiol. 1990a;11:1123–1130. [PMC free article] [PubMed] [Google Scholar]
- Steinmetz H, Rademacher J, Jancke L, Huang YK, Thron A, Zilles K. Total surface of temporoparietal intrasylvian cortex: diverging left-right asymmetries. Brain Lang. 1990b;39:357–372. doi: 10.1016/0093-934x(90)90145-7. [DOI] [PubMed] [Google Scholar]
- Thulborn KR. Visual feedback to stabilize head position for fMRI. Magn Reson Med. 1999;41:1039–1043. doi: 10.1002/(sici)1522-2594(199905)41:5<1039::aid-mrm24>3.0.co;2-n. [DOI] [PubMed] [Google Scholar]
- Turner RS, Desmurget M, Grethe J, Crutcher MD, Grafton ST. Motor subcircuits mediating the control of movement extent and speed. J Neurophysiol. 2003;90:3958–3966. doi: 10.1152/jn.00323.2003. [DOI] [PubMed] [Google Scholar]
- Vaillancourt DE, Mayka MA, Thulborn KR, Corcos DM. Subthalamic nucleus and internal globus pallidus scale with the rate of change of force production in humans. Neuroimage. 2004;23:175–186. doi: 10.1016/j.neuroimage.2004.04.040. [DOI] [PubMed] [Google Scholar]
- Vaillancourt DE, Yu H, Mayka MA, Corcos DM. Role of the basal ganglia and frontal cortex in selecting and producing internally guided force pulses. Neuroimage. 2007;36:793–803. doi: 10.1016/j.neuroimage.2007.03.002. [DOI] [PMC free article] [PubMed] [Google Scholar]
- Van Horn JD, Grafton ST, Rockmore D, Gazzaniga MS. Sharing neuroimaging studies of human cognition. Nat Neurosci. 2004;7:473–481. doi: 10.1038/nn1231. [DOI] [PubMed] [Google Scholar]
- Woods RP. Modeling for intergroup comparisons of imaging data. Neuroimage. 1996;4:S84–S94. doi: 10.1006/nimg.1996.0058. [DOI] [PubMed] [Google Scholar]
- Yelnik J. Functional anatomy of the basal ganglia. Mov Disord. 2002;17 Suppl 3:S15–S21. doi: 10.1002/mds.10138. [DOI] [PubMed] [Google Scholar]