

Abstract
Calmodulin (CaM) is a ubiquitous, essential calcium-binding protein that regulates diverse protein targets in response to physiological calcium fluctuations. Most high-resolution structures of CaM-target complexes indicate that the two homologous domains of CaM are equivalent partners in target recognition. However, mutations between calcium-binding sites I and II in the N-domain of Paramecium calmodulin (PCaM) selectively affect calcium-dependent sodium currents. To understand these domain-specific effects, N-domain fragments (PCaM1–75) of six of these mutants were examined to determine whether energetics of calcium binding to sites I and II or conformational properties had been perturbed. These PCaM(1–75) sequences naturally contain 5 Phe residues but no Tyr or Trp; calcium binding was monitored by observing the reduction in intrinsic phenylalanine fluorescence at 280 nm. To assess mutation-induced conformational changes, thermal denaturation of the apo PCaM(1–75) sequences, and calcium-dependent changes in Stokes radii were determined. The free energy of calcium binding to each mutant was within 1 kcal/mole of the value for wild type and calcium reduced the Rs of all of them. A striking trend was observed whereby mutants showing an increase in calcium affinity and Rs had a concomitant decrease in thermal stability (by as much as 18°C). Thus, mutations between the binding sites that increased disorder and reduced tertiary constraints in the apo state promoted calcium coordination. This finding underscores the complexity of the linkage between calcium binding and conformational change and the difficulty in predicting mutational effects.
Keywords: Gel permeation chromatography, hydrodynamics, Stokes radius, thermal stability, cooperativity, sodium channels, structure, CaM, Ca2+
Calmodulin (CaM) is an essential regulatory calcium-binding protein in the EF-hand family that includes troponin C, calbindin, S-100, and many others (Celio et al. 1996). Cooperative calcium binding to CaM (Fig. 1A ▶ ) links calcium fluxes initiated by signal transduction events to modulation of dozens of target proteins throughout the cell (see Crivici and Ikura 1995; Rhoads and Friedberg 1997; Jurado et al. 1999). These targets are found in almost every cell type and have roles in varied processes, including regulation of motility, ion channels, cell growth, and metabolism.
Fig. 1.
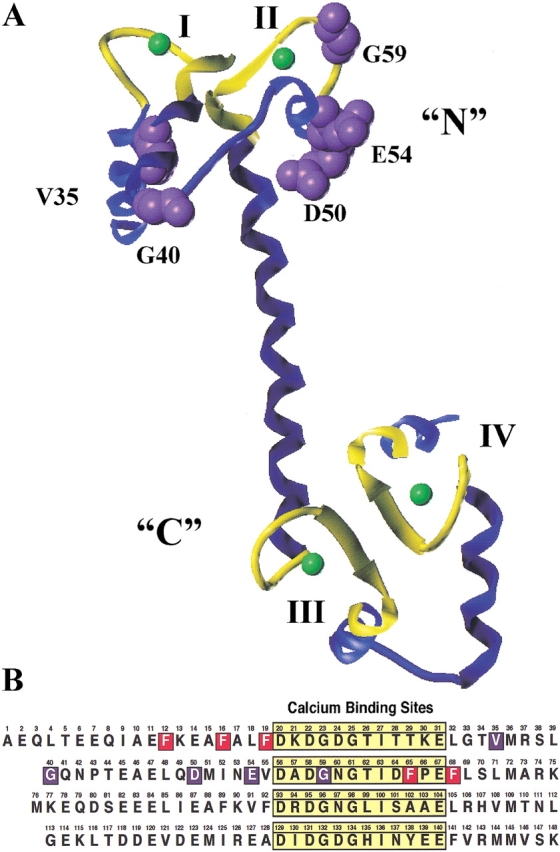
(A) Crystal structure of calcium-saturated Paramecium calmodulin (1CLM.pdb; Rao et al. 1993) created using Sybyl 6.5 (MIPS3-IRIX 6.2 Tripos Associates, Inc.). Calcium-binding sites I and II are in the N-domain; sites III and IV are in the C-domain. The calcium ions are represented by green spheres, the calcium-binding sites are in yellow, and positions of mutations studied are purple. (B) Amino acid sequence of PCaM. Calcium-binding sites are boxed and highlighted yellow. Positions of N-domain mutations are shown in purple, and phenylalanine residues in the N-domain are shown in red.
The sequence of CaM is acidic and highly conserved among eukaryotic species. For example, Paramecium CaM (PCaM; Fig. 1B ▶) is 88% identical to CaM from human, rat, and Drosophila. Although CaM is small (∼17 kD), it can be subdivided into two half-molecule domains, denoted as the N-domain (residues 1–75) and the C-domain (residues 76–148; Fig. 1 ▶). Given the sequence and structure similarity, these appear to have arisen from gene duplication events. CaM contains four calcium-binding sites that are each composed of 12 residues (Fig. 1A ▶; Moncrief et al. 1990) flanked by two helices (e.g., site I is between helices A and B). Two calcium-binding sites and their flanking helices comprise each domain. The geometry of calcium binding is pentagonal bipyramidal, and the terminal glutamate in each site plays a key role by providing two of the oxygen ligands for the calcium ion. With four sites that may be either vacant or saturated, CaM can adopt any of 16 possible ligation states.
Despite their sequence similarity, the two domains of CaM are not equivalent with respect to their energetics of calcium binding. During a calcium titration, both sites in the C-domain (III and IV) become almost fully saturated before the sites in the N-domain (I and II) are occupied in vertebrate calmodulin (Seamon 1980; Klevit et al. 1984; Wang 1985; Kilhoffer et al. 1992) and PCaM (Jaren et al., unpubl.). Thus, the full-length molecule populates at least one intermediate between the apo and fully saturated end states of the titration. Correspondingly, there are at least three conformational states of CaM: apo (denoted as [0000]), where 0 indicates vacant sites I to IV; intermediate ([0011]), where the N-domain is apo and the C-domain is saturated with calcium; and calcium-saturated ([1111]). This intermediate has structural properties that are not equivalent to the average of the two endstates (Pedigo and Shea 1995a; Shea et al. 2000).
Clear biological evidence for separable roles of the two domains with respect to the control of some target proteins came from genetic screens of randomly mutagenized Paramecia. Kung et al. (1992) found that altered stimuli-induced swimming behaviors could be traced to domain-specific mutations in calmodulin that altered regulation of ion channels. The under-reacting mutants with altered regulation of calcium-dependent sodium currents contained mutations in the N-domain of Paramecium CaM (PCaM) but not in the C-domain. Furthermore, these mutations were found primarily outside of the calcium binding sites I and II and sites III and IV bound calcium normally (Jaren et al. 2000). As shown in Figure 1 ▶, the mutations were in helices B and C and the linker between them. Only one mutation (G59S) was localized within a binding site. This suggested that calcium binding to sites I and II was preserved in these mutants but that its coupling to conformational rearrangements (within or between domains) necessary for target recognition, association, and activation might be perturbed.
To test this hypothesis, it was essential to determine the free energies of calcium binding and cooperativity of sites I and II in the N-domain. However, determining these properties with fluorescence is difficult because the N-domain contains neither tyrosine nor tryptophan (Kretsinger 1976; Moncrief et al. 1990). The calcium-induced differences in UV absorbance of CaM are small and not attributable solely to changes in the N-domain (Klevit 1983). Although NMR can be used selectively to monitor sites I and II (Jaren et al., unpubl.), a stoichiometric titration does not yield equilibrium constants, and a discontinuous equilibrium titration capable of resolving free energies of binding requires >100 mg of protein (Pedigo and Shea 1995a). Labeling CaM with extrinsic fluorescent reporter groups or introducing aromatic amino acids via site-specific mutagenesis is fraught with hazards of disrupting the binding and linkage phenomena under investigation.
To address whether the intrinsic calcium binding behavior of the N-domain of PCaM had been modified by mutations found to affect sodium channel regulation, we cloned and bacterially overexpressed fragments containing residues 1–75 of the wild type and each mutant sequence (hereafter, this truncated sequence is referred to as PCaM(1–75)) and studied their thermodynamic and macroscopic conformational properties. Equilibrium calcium titrations of wild-type and mutant PCaM(1–75) samples were determined from the calcium-induced decrease in intrinsic phenylalanine fluorescence, attributable to one or more of the five phenylalanine residues located within helices A and D (Fig. 2 ▶). Two of the Phe residues (F16 and F65) were known to be sensitive reporters of calcium occupancy of sites I and II, as shown by 1-D proton NMR studies of a stoichiometric titration of CaM (Dalgarno et al. 1984) and a discontinuous equilibrium titration of CaM (Pedigo and Shea 1995a). However, to the best of our knowledge, this is the first report of using phenylalanine fluorescence to monitor calcium binding to a protein and holds promise for studying ligand binding to other proteins that lack tyrosine and tryptophan.
Fig. 2.

(A) Average NMR structure (from 25 structures) of the N-domain (residues 1–75 shown) of vertebrate apo calmodulin (1CFD.pdb; Kuboniwa et al. 1995) (B) The N-domain (residues 1–75 shown) of calcium-saturated Paramecium calmodulin (1CLM.pdb; Rao et al. 1993). Both were created using Sybyl 6.5 (MIPS3-IRIX 6.2 Tripos Associates, Inc.). Phenylalanine residue side chains are shown in red.
The mutants were compared to wild-type PCaM(1–75) to determine whether substitutions markedly changed the tertiary structure of the domain, which is expected to be important for recognizing target proteins. This was assessed by determining whether the Stokes radius (Rs) was similar to that of wild-type PCaM(1–75) and whether it undergoes a normal calcium-induced decrease. Thermal denaturation studies of the apo form of each mutant PCaM(1–75) were conducted to determine whether the stability (i.e., intramolecular contacts) had changed.
Using these approaches, the mutant sequences were found to bind calcium as well as or better than wild-type PCaM(1–75). A strong correlation was found between an increase in calcium affinity, an increase in Rs, and a decrease in thermal stability of the apo state, indicating that increased calcium affinity correlates with increased disorder. The mutations that had the greatest effect were farthest from the 12-residue binding sites, in the linker between helices B and C (i.e., in the intradomain hinge between the two EF-hand units). This indicates the importance of residues outside of those participating in the acid-pairs that are well known to affect calcium affinity of EF-hand proteins (Marsden et al. 1990; Falke et al. 1991; Procyshyn and Reid 1994; Wu and Reid 1997; Black et al. 2000). The correlation of increased affinity with increased disorder is consistent with findings regarding engineered mutants of CaM (Tan et al. 1996; Meyer et al. 1996; Sorensen 1997; Ababou and Desjarlais 2001) and has ramifications for predicting the ligand binding and structural properties of highly similar proteins that are being identified rapidly as databases of genomic sequences become available.
Results
A new optical spectroscopic approach was developed to monitor calcium occupancy of sites I and II in calmodulin. The calcium affinity, hydrodynamic radius and thermal stability of six PCaM(1–75) mutants were compared to explore the molecular basis for differences in their ability to regulate calcium-dependent sodium channels in P. tetraurelia.
Phenylalanine fluorescence
The steady-state fluorescence intensity of the five phenylalanine residues located within helices A and D (Fig. 2 ▶) of PCaM(1–75) was measurable with a standard fluorimeter without modification. The calcium-dependent decrease in intensity of ∼70% at 280 nm (Fig. 3A ▶) allowed us to determine binding isotherms for sites I and II of wild-type and mutant PCaM(1–75) samples. Spectra that were not corrected for contributions of buffer yielded a fractional decrease of ∼30% in intensity, which corresponded to the percent decrease observed during a titration.
Fig. 3.

(A) Normalized fluorescence emission scans of apo (solid line) and calcium-saturated (dashed line) PCaM(1–75) (λex = 250 nm). A buffer scan was subtracted from each scan. (B) Stoichiometric calcium titration of PCaM(1–75) using phenyalanine fluorescence (λex = 250 nm, λem = 280 nm) as a reporter.
When analyzing these calcium-dependent response curves as titration isotherms, it is essential that the quantitative relationship between the decrease in Phe intensity and calcium occupancy be determined. Proportionality between binding and signal change was supported by evaluating stoichiometric titrations of PCaM(1–75) monitored by Phe fluorescence (Fig. 3B ▶), which showed that 50 ± 5% of the signal change occurred at a ratio of one equivalent of calcium to PCaM(1–75), which binds two calcium ions. A titration of PCaM(1–74) monitored by HSQC-NMR showed F65 and F68 titrated between 0 and 2 Ca2+/CaM (data not shown). Support for the assumption of linear signal change is provided by NMR studies showing that sites I and II fill simultaneously in CaM from many species (Seamon 1980; Klevit et al. 1984; Pedigo and Shea 1995a), including Paramecium (Jaren et al. unpubl.).
Calcium affinity of sites I and II
Equilibrium titrations of wild-type and mutant PCaM(1–75) showed well-defined plateaus at high and low levels of calcium. Figure 4A ▶ shows one of four replicate experiments for each sequence. The average of the fitted free energies (ΔG2), for wild-type PCaM(1–75) was –12.79 (±0.04) kcal/mole, and the estimate of intradomain cooperativity (ΔGc) was –2.42 (± 0.6) kcal/mole (Table 1). All six of the PCaM mutants had a total free energy of calcium binding that was within 1 kcal/mole of the average value determined for wild-type PCaM(1–75). However, there was a distinct and reproducible pattern of differences in median ligand-binding curves.
Fig. 4.
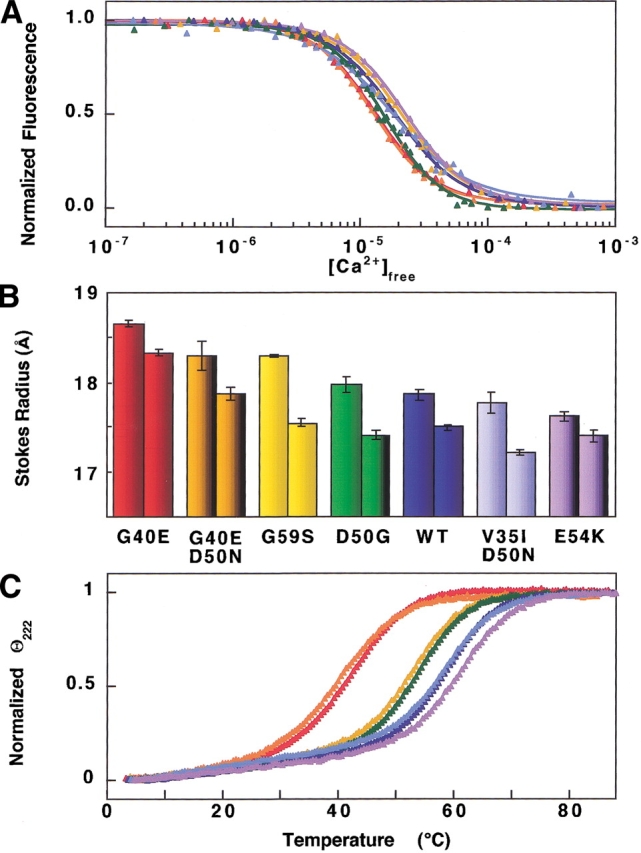
G40E (red), G40E,D50N (orange), G59S (yellow), D50G (green), wild type (blue), V35I,D50N (light blue), E54K (purple). (A) Calcium titrations of mutant and wild-type PCaM1–75 sequences monitored by phenylalanine fluorescence. One representative data set and simulated curve is shown for each sequence. Averages and standard deviations of free energies of calcium binding to sites I and II from four trials are reported in Table 1. (B) Stokes radii of mutant and wild-type PCaM1–75 in the absence (first bar) and presence (second bar) of calcium. Error bars indicate standard deviations of three trials for each sequence. (C) Representative thermal denaturation data and simulated curves for one trial of mutant and wild-type PCaM1–75 sequences. Averages and standard deviations of the Tm, ΔH, and ΔCp values from three trials are listed in Table 3.
Table 1.
Free energies of calcium binding to sites I and II of PCaM1–75
| Protein | ΔG1a | ΔG2 | ΔGcb |
| WT | −5.59 ± 0.26 | −12.79 ± 0.04 | −2.42 ± 0.56 |
| V35I/D50N | −5.98 ± 0.28 | −12.74 ± 0.14 | −1.60 ± 0.52 |
| G40E | −5.82 ± 0.20 | −13.16 ± 0.07 | −2.33 ± 0.37 |
| G40E/D50N | −5.74 ± 0.12 | −13.34 ± 0.10 | −2.69 ± 0.18 |
| D50G | −5.23 ± 0.58 | −12.96 ± 0.09 | −3.32 ± 1.22 |
| E54K | −5.64 ± 0.08 | −12.58 ± 0.04 | −2.10 ± 0.10 |
| G59S | −5.62 ± 0.14 | −12.66 ± 0.04 | −2.24 ± 0.28 |
a Gibbs free energies (in kcal/mole (1 kcal = 4.184 J)) are described according to equation 1. Free energies and errors represent averages and standard deviations between four trials. The √var for each trial ranged from 0.008 to 0.063, with an average of 0.024.
b Estimate of cooperative free energy is described by equation 3.
The two sequences carrying the G40E mutation (i.e., G40E alone and G40E/D50N), which is in the linker region between helices B and C, had lower (more favorable) ΔG2 values of −13.16 (±0.07) kcal/mole (ΔΔG of −0.4 kcal/mole from wild type) and −13.34 (±0.10) kcal/mole. (ΔΔG of 0.6 kcal/mole). In contrast, the mutant E54K had the highest (least favorable) ΔG2 value of −12.58 (±0.04) kcal/mole (ΔΔG of 0.2). There was positive cooperativity between sites I and II for all sequences with the free energy of cooperativity for wild type being −2.42 (±0.6) kcal/mole. Although errors are intrinsically high, considering the accuracy of Δc relies on the accuracy of ΔG1 and ΔG2, V35I/D50N was the least cooperative ΔGc = −1.60 (±0.5) kcal/mole and D50G was the most cooperative ΔGc = −3.32 (±1.2) kcal/mole.
Although the differences between the calcium-binding behavior of the mutants and wild-type PCaM(1–75) were small, they are considered significant because they were larger than the average experimental variations. The standard deviation for four trials of each protein was 0.1 kcal/mole or less and the average square root of the variance for the NONLIN analyses of the 28 trials in this study was 0.02 with no major outliers. A low correlation of the coefficients of all fitted parameters was observed.
Hydrodynamic properties
The average Rs of apo wild-type PCaM(1–75) was 17.86 (±0.06) Å. Although the Rs values of apo mutant PCaM(1–75) were similar to that of wild type (within 1 Å), there was a clear stratification. The values of Rs ranged from that of G40E, which was larger than wild type by 0.79 Å, to E54K, which was smaller than wild type by 0.24 Å. All of these differences were statistically significant in comparison to standard deviations that ranged from 0.03 to 0.07 Å for three trials for each sequence.
In all cases, calcium caused the Rs to decrease (Fig. 4B ▶). The Rs of calcium-saturated wild-type PCaM(1–75) was 17.50 (±0.03) Å. The mutants ranged from 18.33 Å (±0.04) for G40E to 17.21 Å (±0.03) for V35I/D50N. The ΔRs of wild-type PCaM(1–75) was 0.37 Å, and values of ΔRs for the mutants ranged from 0.22 Å for E54K PCaM(1–75) to 0.75 Å for G59S PCaM(1–75) (Table 2). Although ΔRs was large for G59S PCaM(1–75), the Rs of its calcium-saturated form was quite close to that of wild-type PCaM(1–75), indicating that the mutation primarily affects the apo conformation.
Table 2.
Calcium-dependent stokes radii of PCaM1–75
| Protein | Rs (Å) Apo | Rs (Å) Calcium | ΔRs |
| WT | 17.86 ± 0.06 | 17.50 ± 0.03 | 0.37 |
| V35I,D50N | 17.77 ± 0.11 | 17.21 ± 0.03 | 0.56 |
| G40E | 18.65 ± 0.04 | 18.33 ± 0.04 | 0.32 |
| G40E,D50N | 18.30 ± 0.15 | 17.87 ± 0.07 | 0.42 |
| D50G | 17.97 ± 0.09 | 17.41 ± 0.06 | 0.56 |
| E54K | 17.62 ± 0.05 | 17.40 ± 0.07 | 0.22 |
| G59S | 18.29 ± 0.01 | 17.54 ± 0.04 | 0.75 |
Values and errors represent averages and standard deviations between three trials.
Thermal stabilities
Changes in ellipticity at 222 nm were monitored (Fig. 4C ▶) during thermal denaturation to determine the unfolding properties of the wild-type and mutant PCaM(1–75) sequences (Table 3). All denaturation profiles were best fit by a two-state model for unfolding (Bolen and Santoro 1988; Pace 1990) as described in Materials and Methods.
Table 3.
Thermal denaturation properties of Apo PCaM1–75
| Protein | Tm (°C)a | ΔH°VH (kcal/mole)a | ΔCp (cal/K•mole)a |
| WT | 58.9 ± 0.4 | 51.3 ± 0.8 | 1121 ± 360 |
| V35I/D50N | 58.9 ± 0.3 | 50.0 ± 1.0 | 1057 ± 450 |
| G40E | 41.8 ± 0.7 | 38.4 ± 1.9 | 867 ± 442 |
| G40E,D50N | 40.8 ± 0.5 | 34.9 ± 2.1 | 879 ± 360 |
| D50G | 53.9 ± 0.1 | 49.4 ± 0.8 | 1360 ± 60 |
| E54K | 61.2 ± 0.3 | 46.3 ± 3.2 | 1033 ± 90 |
| G59S | 52.8 ± 0.2 | 48.4 ± 0.4 | 1403 ± 90 |
Thermal unfolding studies were performed as described in Materials and Methods. Data were fit to a two-state model of unfolding described by equation 5.
a Average values and standard deviations from three trials are reported. The √var for fits of each individual trial ranged from 0.003–0.008 with an average of 0.004.
Wild-type PCaM(1–75) had a Tm of 58.9°C (±0.4). The Tm value for V35I/D50N PCaM(1–75) was identical to that of wild type, whereas E54K PCaM1–75 was slightly stabilized (by 2.3°C). The other four mutants were all destabilized considerably. The most severe changes were seen for G40E/D50N (ΔTm of −18.1°C) and for G40E (ΔTm of −17.1°C), both of which have a modification in the linker between the two EF-hands.
The enthalpy of unfolding of wild-type PCaM(1–75) was 51.3 (±0.8) kcal/mole. Four of the mutants were within 5 kcal/mole of that value; however, the enthalpy of unfolding for G40E/D50N (34.9 [±2.1] kcal/mole) and G40E (38.4 [±1.9] kcal/mole) were much lower. The average change in heat capacity is not well defined by this experiment. For three trials of wild-type PCaM(1–75) the change in heat capacity was 1.1 [±0.4] kcal/K•mole, and all of the mutants had a change in heat capacity within the standard deviation of wild type.
Correlation of properties
A correlation was observed whereby an increase in Tm corresponded to a decrease in Stokes radius (Fig. 5A ▶) and a decrease in calcium affinity of the apo state (Fig. 5B ▶). The G40E mutation in the linker between helices B and C destabilized apo PCaM(1–75) and raised its affinity for calcium while E54K, a mutation that stabilized apo PCaM(1–75), lowered its affinity for calcium.
Fig. 5.

Correlation of hydrodynamic radius and calcium-binding affinity with stability of apo PCaM(1–75) variants. Values for wild type (WT) are marked. Error bars reflect 65% confidence intervals reported in Tables 1 and 2. (A) Stokes radii of apo (diamond) and calcium-saturated (right arrow) proteins. Fitted lines for apo (dashed line) and calcium-saturated (solid line) Rs values indicate correlation with Tm. (B) Free energies of calcium binding (ΔG2). Line indicates correlation with Tm.
Discussion
PCaM responds structurally to calcium in a manner similar to vertebrate CaM based on a comparison of calcium-induced changes in hydrodynamic properties and ellipticity (Jaren et al. 2000). Studies by HSQC NMR of 15N-13C-labeled PCaM (Jaren et al. unpubl.) show that the secondary structure of apo PCaM has high α-helical content and that helical segments are distributed in a pattern very similar to that of apo CaM from Xenopus (Zhang et al. 1995) and chicken (Urbauer et al. 1995). Crystallographic studies show that the secondary and tertiary structure of calcium-saturated PCaM (Rao et al. 1993; Wilson and Brunger 2000) is very similar to that of vertebrate CaM (Babu et al. 1988) and Drosophila CaM (Taylor et al. 1991). Thus, the domain-specific PCaM mutants studied here provide an excellent opportunity for exploring structural and thermodynamic coupling between calcium binding, conformational change, and target activation that will be applicable to CaM from other species.
Studies were carried out in 1 mM MgCl2 to mimic physiological conditions. The affinity of calmodulin for magnesium is in the millimolar range and the ion appears to bind preferentially to the N-domain (Tsai et al. 1987; Gilli et al. 1998; Malmendal et al. 1999; Masino et al. 2000). Magnesium binding does not cause the same conformational changes that binding of calcium causes, as it does not contact residue 12 in the calcium binding loops responsible for calcium-induced structural changes (Malmendal et al. 1998). Magnesium does increase the stability of CaM, but does not affect its affinity for some targets (Martin et al. 2000; Masino et al. 2000). As determined by phenylalanine fluorescence, total free energies of calcium binding to PCaM(1–75) in the presence and absence of 1 mM MgCl2 were within 0.1 kcal/mole (data not shown).
Phenylalanine fluorescence
Compared to tyrosine and tryptophan, phenylalanine has a lower extinction coefficient and a slightly lower quantum yield (Chen 1967), which has caused it to be used infrequently as a reporter of conformational change in proteins.
This approach of monitoring intrinsic phenylalanine fluorescence has unique advantages as a probe of calcium binding to sites I and II in CaM because it circumvents the need to introduce a covalent fluorescent probe or amino acid substitution, which might alter both the structural and energetic properties of calcium binding. A comparison of sequences of the N-domain of CaM from >50 eukaryotic species from GenBank (http://www.ncbi.nlm.nih.gov) and Swiss Protein Bank (http://www.expasy.cbr.nrc.ca/sprot) shows that the N-domain is highly conserved with no sequence having Tyr or Trp. This makes it likely that this technique will be useful for studying calcium binding to the N-domain of CaM from other species as well as other proteins that contain only phenylalanine.
The wavelengths used for excitation (250 nm) and emission (280 nm) were chosen to optimize the dynamic range of the calcium-dependent change in signal. They agree with published emission spectra of Phe in proteins (Chen 1967). In the studies reported here, the large change in intensity of phenylalanine fluorescence at 280 nm (∼70%; Fig. 3A ▶) was proportional to calcium occupancy of sites I and II (∼50% change upon binding one calcium ion; Fig. 3B ▶) and allowed for highly reproducible titration curves with low noise (Fig. 4A ▶).
Calcium binding
The free energies of calcium binding (Table 1) to mutant PCaM(1–75) sequences showed that all were within 1 kcal/mole of the value for wild-type PCaM(1–75). Thus, none would be classified as defective in calcium binding. However, it was surprising that three had a calcium affinity higher than that of the wild-type protein. Because the range of free energies of calcium binding to the mutants brackets the value for wild-type PCaM(1–75), we conclude that differences in intrinsic calcium-binding properties per se are not the primary cause of defective sodium-channel regulation.
These studies also showed that sequence differences far outside of the 12-residue sites (Fig. 1 ▶) can perturb calcium-binding energetics. In this study, mutations were concentrated between sites I and II (in helices B and C and the linker between them), and as noted by Nelson and Chazin (1998), there is an extensive network of pairwise interactions between these flanking helicies in all EF-hand proteins (Nelson and Chazin 1998). Mutations of residue 41 in the B/C helix linker and residue 75 in helix D show the importance of these regions in their role in calcium affinity of sites I and II. An engineered disulfide bond between residues 41 and 75 does not allow the N-domain transit to the open form upon calcium binding (Tan et al. 1996), and replacement of these polar residues with nonpolar side chains causes a decrease in calcium affinity of sites I and II (Ababou and Desjarlais 2001). Presumably, the PCaM mutants studied here disrupt helix interactions and have varying consequences on structural disorder and calcium-binding affinities. It was illuminating to learn that this disruption could lead to a more favorable free energy of calcium binding.
Hydrodynamic properties
The absolute values of Rs determined for the PCaM(1–75) variants were all larger than would be predicted for a protein of ∼8.2 kD behaving as a compact globular species (Potschka 1987). This finding is consistent with the properties of cloned domains of rat CaM (Sorensen and Shea 1998) and is interpreted to indicate that these proteins are more hydrated, extended, or flexible than compact molecules of similar mass. The Rs values for apo G40E, G40E/D50N, and G59S PCaM(1–75) were significantly larger than the Rs of apo wild-type PCaM(1–75). We conclude that the interactions between paired EF-hands are most disrupted in these molecules. Given that position 59 is within site II, it is possible that the β-sheet region between sites I and II is affected. A plausible explanation for the differences in the G40E-containing mutations is that the Glu substitution perturbs the hinge between the two EF-hands. This hinge is necessary for exposure of the hydrophobic pockets that subsequently interact with targets (Tan et al. 1996). Apo E54K PCaM(1–75) was smaller than wild type perhaps because the change in charge creates more favorable interactions with other residues in this acidic protein, allowing it to be more compact (e.g., reducing repulsion).
Calcium-dependent hydrodynamic studies of the PCaM(1–75) mutants (Fig. 4B ▶) indicated that all underwent a calcium-dependent decrease in Stokes radius as expected on the basis of the behavior of the wild-type PCaM(1–75) (Table 2). It is of interest to determine whether changes observed for the full-length PCaM mutants are consistent with those determined for the corresponding cloned fragments to elucidate potential alterations in interdomain interactions. Compared to the mutant PCaM(1–148) molecules (Jaren et al. 2000), the exact order of Rs magnitudes is preserved with the mutant PCaM(1–75) molecules. The mutants E54K PCaM(1–148) and V35I/D50N PCaM(1–148) are both smaller than wild type as they are as N-domain fragments, and the other four mutants are larger than wild type both in the full-length and N-domain fragments. This suggests that these N-domain mutations do not cause a significant structural perturbation of the C-domain, which is consistent with the observation that sites III and IV have no change in calcium affinity from wild type (Jaren et al. 2000).
Thermal stability
The range of melting temperatures of the apo mutant PCaM(1–75) samples was >20°C (from 40.8°C–61.2°C; Table 2). Consistent with being more compact than wild type, the mutant E54K PCaM(1–75) was more stable than wild type, a finding that was surprising given that a substitution of Lys for Glu provides for charge reversal and that E54 is a highly conserved residue, as noted above.
The progression of the stabilities of the mutants in Figure 4C ▶ paired with the progression of Rs measurements in Figure 4B ▶. The G40E-containing mutants were both the largest and the least stable. However, the correlation between Tm and Rs was not proportional. Comparing G40E/D50N PCaM(1–75) to G59S PCaM(1–75), it was evident that although their apo Rs values were similar, the stability of G40E/D50N PCaM(1–75) was much lower. Although calcium saturation brought the Rs of G59S PCaM(1–75) into close agreement with that of wild type, calcium saturation did not rescue the tertiary structure of G40E/D50N PCaM(1–75). Thus, it appears that the energetic penalties associated with the increase in Rs are not identical for these mutants. It is likely that the G40E mutation disrupts interactions between helices B and C to a greater extent than does the G59S mutation in site II. The wide range of melting temperatures and ΔH values for the mutant PCaM(1–75) sequences shows that disruption of a single critical residue of calmodulin is sufficient to dramatically affect stability.
The greatest increases in calcium affinity and decreases in thermal stability were observed for the two G40E-containing mutants, suggesting that it is the modification of G40 that dominates their properties. This implies that in the N-domain of CaM the linker between helices B and C is just as critical to energetic properties as the network of helix–helix interactions (Nelson and Chazin 1998).
Affinity vs. disorder
A correlation was found between the physicochemical properties of the seven PCaM(1–75) molecules studied here: the higher the affinity for calcium, the larger the Stokes radius and the lower the stability (Fig. 5 ▶). Similarly, when comparing the N-domain to the C-domain of rat CaM, sites III and IV of the C-domain have a higher affinity for calcium than sites I and II in the N-domain and the C-domain is less stable (Sorensen and Shea 1998; Masino et al. 2000). The correlation of increased calcium affinity and decreased stability is also observed with isolated domains of troponin C (Fredricksen and Swenson 1996) and mutations of polar residues in calmodulin to nonpolar residues at positions 41 and 71 (Ababou and Desjarlais 2001). Complementary results are found when a disulfide bridge is introduced (Tan et al. 1996); affinity decreases when stability is increased.
These results suggest that if calcium-binding energetics were the only property that needed to be optimized for biological function, the sequence of CaM would be different. However, evolutionary pressure forced CaM to maintain a balance between calcium binding, conformational change, and protein–protein interactions. Apparently, it is deleterious to improve calcium binding by further destabilizing the structure, which presumably would alter other structural properties important to target interactions.
These studies have implications for understanding how proteins optimize ligand-binding energetics while maintaining a folded structure that can be recognized by other proteins and not degraded by the proteolytic machinery of the cell. Clearly the most stable structure is not necessarily the most functional biologically. In the case of CaM, an allosteric monomer, it appears that small sequence variations between the two highly homologous domains change tertiary constraints, which in turn change a protein with duplicate domains (e.g., a dimer of covalently linked monomers) into one with sequential binding to its domains. There are many parallels to the switching properties now understood for the allosteric pathway of intermediate ligation states of tetrameric hemoglobin (Ackers et al. 2000) in which one of the six half-saturated ligation states (e.g., the tetramer having one dimer saturated) is the preferred intermediate over the course of oxygen binding and release.
Implications for channel regulation
These studies showed that the N-domain mutants that alter calcium-dependent sodium channel regulation in Paramecium all had calcium affinities similar to that of wild-type PCaM(1–75). The mutant PCaM(1–75) molecules also had similar apo and calcium-saturated Stokes radii, indicating that their shapes were not grossly perturbed. These mutants may regulate channels differently due to directly altered protein–protein interactions with their targets.
The six mutants of PCaM have a common effect on the regulation of calcium-dependent sodium currents. However, they were not defective in the same way or to the same extent as assessed by calcium-binding energy, Stokes radius, or thermal stability. It is possible that properties critical to physiological dysfunction have not been tested by these studies. For example, if the molecular mechanism of regulation depends on interdomain interactions that allow the C-domain to modify properties of the N-domain (Sun et al. 1999; Shea et al. 2000), it will be essential to address this in the context of the full-length molecule.
Future directions
Preliminary studies suggest that phenylalanine fluorescence may be used to monitor binding of calcium to sites I and II of PCaM(1–148), which will permit us to assess whether linkage to the C-domain affects their affinity for calcium (VanScyoc et al. 2001). A complete understanding of the molecular defects of the mutants in target binding and activation awaits detailed analysis with other residue-specific methods, including NMR and proteolytic footprinting.
Materials and methods
Cloning of PCaM(1–75) fragments
JM-109 cells transfected with bacterial overexpression vectors (pKK/OK) for wild-type and mutant Paramecium calmodulin genes were a gift from C. Kung (University of Wisconsin, Madison). Overexpression plasmids for PCaM(1–75) sequences were constructed using standard cloning methods as described previously for fragments of rat CaM (Sorensen and Shea 1998). Primers were synthesized by the DNA Facility at the University of Iowa College of Medicine. The amplified segments were inserted into a pT7–7 vector for overexpression. Sequences were evaluated by 5` and 3` sequencing by the DNA Facility.
Protein overexpression and purification
The wild-type and mutant PCaM(1–75) genes were overexpressed in BL21 DE3-pLysS cells. The proteins were then purified following the method described by Putkey et al. (1985) with a subsequent 10-min.incubation at 80°C and with saturating calcium to precipitate contaminating proteins. The recombinant proteins were 97%–99% pure, as judged by silver-stained SDS-PAGE and reversed-phase HPLC. Compositions and concentrations were determined by amino acid analysis by the Molecular Analysis Facility at the University of Iowa's College of Medicine. Calculated molecular weights for the mutant PCaM(1–75) fragments ranged from 8181 to 8311 Da, with wild type being 8239 Da.
Phenylalanine fluorescence emission spectra
All spectra were collected at 22°C using an SLM 4800CTM (SLM Instruments, Inc.) with a xenon short-arc lamp (Ushio Inc.). Emission spectra of apo buffer (50 mM HEPES, 100 mM KCl, 0.05 mM EGTA, 5 mM NTA, and 1 mM MgCl2), 6 μM PCaM(1–75) in apo buffer, and 6 μM PCaM(1–75) in calcium-saturated buffer (apo buffer and 5 mM CaCl2) were collected (8 nm slitwidths, λex = 250 nm, 0.5 nm increments). Three scans were averaged, a buffer scan was subtracted from the spectra for apo and calcium-saturated PCaM(1–75), and each curve was normalized [(F − Fmin)/(Fmax − Fmin)] to generate the emission scans shown in Figure 3A ▶.
Stoichiometric titration of PCaM(1–75) monitored by Phe fluorescence
The concentration of PCaM(1–75) was determined by UV absorbance in 0.1 N NaOH, using published extinction coefficients for phenylalanine (Beaven and Holiday 1952). The calcium titrant concentration (25 mM CaCl2 in 50 mM HEPES and 100 mM KCl at pH 7.4) was determined by atomic absorption. A stoichiometric concentration of 280 μM of PCaM(1–75) (in 50 mM HEPES, 100 mM KCl at pH 7.4) was titrated at 22°C (8 nm slitwidths, λex = 250 nm, λem = 280 nm). A representative normalized titration curve [(F − Fmin)/(Fmax − Fmin)] from three replicate studies is shown in Figure 3B ▶.
Equilibrium calcium titrations monitored by Phe fluorescence
Free energies of calcium binding to sites I and II were determined from titrations (Fig. 4A ▶) conducted in the presence of Oregon Green 488 BAPTA-5N (Molecular Probes) that served as an indicator of free calcium concentration. A Kd of 3.424 × 10⁻⁵ M for Oregon Green was determined in 50 mM HEPES, 100 mM KCl, and 1 mM MgCl2 at 22°C. Mutant and wild-type PCaM(1–75) (6 μM, λex = 250 nm, λem = 280 nm, 8 nm slitwidths) and Oregon Green (0.1 μM, λex= 495 nm, λem= 521 nm, 8 nm slitwidths ) in 50 mM HEPES, 100 mM KCl, and 1 mM MgCl2 at 22°C were titrated with 100 mM CaCl2 in the same buffer with a microburet.
The concentration of free calcium was determined by the fractional saturation of Oregon Green as done previously using difBAPTA (Swenson and Fredricksen 1992; Pedigo and Shea 1995b). Four replicate titrations of each PCaM(1–75) sequence were conducted. A representative set of normalized titration data [(F − Fmin)/(Fmax − Fmin)] for each sequence is shown in Figure 4A ▶.
Analysis of ΔG of calcium binding
Gibbs free energies were obtained from fits of the titrations to an Adair equation (model-independent ligand-binding function; see Shea et al. 2000) describing the binding reaction shown below. The average degree of saturation for the two sites is described by equation 1.
 |
1 |
The macroscopic equilibrium constant K1 (ΔG1 = −RT ln K1) represents the sum of two intrinsic equilibrium constants (kI and kII) that may or may not be equal. The macroscopic equilibrium constant K2 (ΔG2 = −RT ln K2) accounts for saturating both sites I and II (i.e., it is the product of kI, kII,and kI−II). This term accounts for any positive or negative cooperativity between the two sites (Ackers et al. 1983). Thus, the equivalence (or lack thereof) of the calcium affinity of sites I and II was not specified by the equation used to fit the data, and the degree of cooperativity could be estimated from the differences between the two macroscopic equilibrium constants.
Changes in fluorescence intensity for the calcium titrations of each mutant were normalized to the highest and lowest experimentally determined signals. To account for finite variations in the asymptotes of the titration profiles for different trials, the function [f(X)] used for nonlinear least-squares analysis is given by equation 2.
 |
2 |
where Y– refers to the average fractional saturation as described by equation 1 and corresponds to the value of fluorescence intensity at the lowest calcium concentration of the titration being fit (Shea et al. 1996). Note that the value of the parameter span is negative for a monotonically decreasing signal as was found for the calcium-induced change in Phe intensity for the wild-type and mutant PCaM(1–75) sequences (Fig. 3A ▶). Values for all parameters were fit simultaneously using NONLIN (Johnson and Frasier 1985).
NONLIN provides several measures of goodness-of-fit for the parameters that minimized the variance in each fit. These error statistics included (a) the value of the square root of variance, (b) the values of asymmetric 65% confidence intervals, (c) the systematic trends in the distribution of residuals, (d) the magnitude of the span of residuals, and (e) the absolute value of elements of the correlation matrix. From these, best-fit values were selected after trying several sets of initial guesses for parameters to probe for the presence of local minima. Free energies of calcium binding were determined from four titrations of each PCaM(1–75) sample; averages and standard deviations of these values are in Table 1.
Cooperativity between sites I and II
It is not possible analytically to determine the free energy of site–site interactions or intradomain cooperativity, ΔGc, from macroscopic binding data alone. However, a lower limit of this value may be estimated by assuming that sites I and II have equal intrinsic affinities for calcium (i.e., kI = kII). If that were the case, intradomain cooperativity may be expressed as shown in equation 3.
 |
3 |
The value of ΔGc in Table 1 cannot indicate positive cooperativity if there is no interaction between the sites (i.e., a negative value of ΔGc always indicates a favorable interaction). The value ΔGc may not reflect cooperativity alone if the sites are not equivalent (i.e., if kI ≠ kII; see Pedigo and Shea 1995a for discussion). The error in ΔGc is propagated from ΔG1 and ΔG2.
Analytical gel permeation chromotography
Stokes radius (Rs) determinations (Fig. 4B ▶) were performed using a Superdex-75 column (Pharmacia) and FPLC (Pharmacia, LCC-500 Plus). Samples of wild-type and mutant PCaM(1–75) molecules were diluted to 2.43 × 10⁻⁴ M in apo (50 mM HEPES, 100 mM KCl, 0.05 mM EGTA, 5 mM NTA, and 1 mM MgCl2 at pH 7.4) or high calcium (apo buffer plus 10 mM CaCl2) buffers. The Rs for each PCaM(1–75) sample was determined as described previously (Sorensen and Shea 1996, Sorensen and Shea 1998). Samples (100 μL) were injected onto the appropriate buffer-equilibrated column at 21°C–23°C with a 0.4 mL/min flow rate and 2 or 5 mm/sec chart speed with elution profiles monitored at 254 nm. BSA, ovalbumin, chymotrypsinogen, and RNAse were used to generate a standard curve. Values in Table 2 are the average and standard deviation of three independent determinations of Rs for each sample.
Thermal stability
Thermal denaturation studies (Fig. 4C ▶) were conducted using an Aviv 62DS circular dichroism instrument. PCaM(1–75) samples were diluted to 5 μM into apo CD buffer (2 mM HEPES, 100 mM KCl, 1 mM MgCl2, 0.05 mM EGTA, 5 mM NTA at pH 7.4). Samples were monitored at 222 nm with temperature increasing from 5°C to ∼90°C at a rate of 1°C/min. Average ellipticity was recorded every 30 sec for 20 sec. Temperature and ellipticity were recorded concurrently by using an immersible thermocouple accurate to ±0.4°C. At the end of the temperature ramp, the sample was cooled rapidly, and percent renaturation was calculated from the signal at 5°C, as shown in equation 4
 |
4 |
where θU is the signal of the denatured protein at 5°C, θi is the initial signal at 5°C, and θN is the signal of the renatured protein at 5°C (Swint and Robertson 1993; Fredricksen and Swenson 1996). The extent of renaturation for PCaM(1–75) fragments was >96% for each trial.
Analysis of Tm and ΔH
Data were fit to a two-state model of unfolding, which approximates denaturation as being a transition from a native (N) to an unfolded (U) conformation (Bolen and Santoro 1988; Pace 1990). Equation 5 describes the two-state model used to fit Yobs (the ellipticity at 222 nm) as a function of temperature (T).
 |
5 |
In this expression, fN is the fractional population that occupies the native form, fU is the fractional population that occupies the unfolded form, yN is the intercept of the baseline of the native state, yU is the intercept of the baseline of the unfolded state, mN is the slope of the baseline of the native state, and mU is the slope of the baseline of the unfolded state. The values of Tm and ΔHVH were determined based on an equilibrium constant (K = exp(−ΔG/RT)) for unfolding determined from the fractional populations of native and unfolded states (fN and fU) with a modified Gibbs-Helmholtz equation shown in equation 6.
 |
6 |
In this expression ΔH is the van't Hoff enthalpy, ΔCp is the heat capacity, and Tm is the melting temperature. Results of the analysis of three independent experimental studies were averaged; values and standard deviations are in Table 3. For each PCaM(1–75) sample, a representative denaturation profile and curve simulated from its corresponding resolved parameters are shown in Figure 4C ▶.
These analyses were compared to fits of each data set to a three-state model of unfolding that has a single intermediate (I) state (N to I to U; Eftink et al. 1996), as described previously for rat CaM (Sorensen and Shea 1998). In all cases, fits to the two-state model were superior as judged by lower values of the variance, narrower confidence intervals, and a more random pattern of residuals.
Acknowledgments
We thank Ching Kung and coworkers (University of Wisconsin-Madison) for providing bacterial overexpression vectors for mutant Paramecium CaM, Brenda Sorensen for determining the Kd of Oregon Green in the buffers used in this study, Lynn Teesch and Elena Rus for amino acid analysis (University of Iowa College of Medicine, Molecular Analysis Facility), and Shapoor Riahi (University of Iowa) for atomic absorption analysis of calcium solutions. These studies were supported by a graduate fellowship (W.S.V.) from the University of Iowa Center for Biocatalysis and Bioprocessing and by a grant (M.A.S.) from the National Institutes of Health (RO1 GM 57001).
The publication costs of this article were defrayed in part by payment of page charges. This article must therefore be hereby marked "advertisement" in accordance with 18 USC section 1734 solely to indicate this fact.
Abbreviations
EGTA, ethylene glycol bis(aminoethylether)-N,N,N',N'-tetraacetic acid
HEPES, N-(2-hydroxy-ethyl)piperazine-N'-2-ethanesulfonic acid
HSQC, heteronuclear single quantum coherence
N-domain, residues 1-75 of CaM
NTA, nitrilotriacetic acid
PCaM, Paramecium calmodulin (1-148)
Article and publication are at www.proteinscience.org/cgi/doi/10.1110/ps.11601.
References
- Ababou, A. and Desjarlais, J.R. 2001. Solvation energetics and conformational change in EF-hand proteins. Protein Sci. 10 301–312. [DOI] [PMC free article] [PubMed] [Google Scholar]
- Ackers, G.K., Shea, M.A., and Smith, F.R. 1983. Free energy coupling within macromolecules: The chemical work of ligand binding at the individual sites in cooperative systems. J. Mol. Biol. 170 223–242. [DOI] [PubMed] [Google Scholar]
- Ackers, G.K., Holt, J.M., Huang, Y., Grinkova, Y., Klinger, A.L., and Denisov, I. 2000. Confirmation of a unique intra-dimer cooperativity in the human hemolobin alpha(1)beta(1) half-oxygenated intermediate supports the symmetry rule model of allosteric regulation. Proteins 4 23–43. [DOI] [PubMed] [Google Scholar]
- Babu, Y.S., Bugg, C.E., and Cook, W.J. 1988. Structure of calmodulin refined at 2.2 Å resolution. J. Mol. Biol. 204 191–204. [DOI] [PubMed] [Google Scholar]
- Beaven, G.H. and Holiday, E.R. 1952. Ultraviolet absorbtion spectra of proteins and amino acids. In Advances in Protein Chemistry (eds. M.L. Anson, K. Bailey, and J.T. Edsall), Academic Press, New York. [DOI] [PubMed]
- Black, D.J., Tikunova, S.B., Johnson, J.D., and Davis, J.P. 2000. Acid pairs increase the N-terminal Ca2 + affinity of CaM by increasing the rate of Ca2 + association. Biochemistry 39 13831–13837. [DOI] [PubMed] [Google Scholar]
- Bolen, D.W. and Santoro, M.M. 1988. Unfolding free energy changes determined by the linear extrapolation method. Incorporation of delta G standard (N-U) values in a thermodynamic cycle. Biochemistry 27 8069–8074. [DOI] [PubMed] [Google Scholar]
- Celio, M.R., Pauls, T., and Schwaller, B. 1996. Guidebook to the calcium-binding proteins. Oxford University Press, Oxford, New York.
- Chen, R.F. 1967. Fluorescence quantum yields of tryptophan and tyrosine. Anal. Lett. 1 35–42. [Google Scholar]
- Crivici, A. and Ikura, M. 1995. Molecular and structural basis of target recognition by calmodulin. In Annu. Rev. Biophys. Biomol. Struct. (ed. R.M. Stroud), Annual Reviews, Inc., Palo Alto, California. [DOI] [PubMed]
- Dalgarno, D.C., Klevit, R.E., Levine, B.A., Williams, R.J.P., Dobrowolski, Z., and Drabikowski, W. 1984. 1H NMR Studies of calmodulin: Resonance assignments by use of tryptic fragments. Eur. J. Biochem. 138 281–289. [DOI] [PubMed] [Google Scholar]
- Eftink, M.R., Ionescu, R., Ramsay, G.D., Wong, C., Wu, J.Q., and Maki, A.H. 1996. Thermodynamics of the unfolding and spectroscopic properties of the V66W mutant of Staphylcoccal nuclease and its 1–136 fragment. Biochemistry 35 8084–8094. [DOI] [PubMed] [Google Scholar]
- Falke, J.J., Snyder, E.E., Thatcher, K.C., and Voertler, C.S. 1991. Quantitating and engineering the ion specificity of an EF-hand-like Ca2 + binding site. Biochemistry 30 8690–8697. [DOI] [PubMed] [Google Scholar]
- Fredricksen, R.S. and Swenson, C.A. 1996. Relationship between stability and function for isolated domains of troponin C. Biochemistry 35 14012–14026. [DOI] [PubMed] [Google Scholar]
- Gilli, R., Lafitte, D., Lopez, C., Kilhoffer, M., Makarov, A., Briand, C., and Haiech, J. 1998. Thermodynamic analysis of calcium and magnesium binding to calmodulin. Biochemistry 37 5450–5456. [DOI] [PubMed] [Google Scholar]
- Jaren, O.R., Harmon, S., Chen, A.F., and Shea, M.A. 2000. Paramecium calmodulin mutants defective in ion channel regulation can bind calcium and undergo calcium-induced conformational switching. Biochemistry 39 6881–6890. [DOI] [PubMed] [Google Scholar]
- Johnson, M.L. and Frasier, S.G. 1985. Nonlinear least-squares analysis. Methods Enzymol. 117 301–342. [Google Scholar]
- Jurado, L.A., Chockalingam, P.S., and Jarrett, H.W. 1999. Apocalmodulin. Physiology Rev. 79 661–682. [DOI] [PubMed] [Google Scholar]
- Kilhoffer, M.-C., Kubina, M., Travers, F., and Haiech, J. 1992. Use of engineered proteins with internal tryptophan reporter groups and pertubation techniques to probe the mechanism of ligand-protein interactions: Investigation of the mechanism of calcium binding to calmodulin. Biochemistry 31 8098–8106. [DOI] [PubMed] [Google Scholar]
- Klevit, R.E. 1983. Spectroscopic analyses of calmodulin and its interactions. Methods Enzymol. 102 82–104. [DOI] [PubMed] [Google Scholar]
- Klevit, R.E., Dalgarno, D.C., Levine, B.A., and Williams, R.J.P. 1984. 1H-NMR studies of calmodulin: The nature of the Ca2 +-dependent conformational change. Eur. J. Biochem. 139 109–114. [DOI] [PubMed] [Google Scholar]
- Kretsinger, R.H. 1976. Calcium-binding proteins. Annu. Rev. Biochem. 45 239–265. [DOI] [PubMed] [Google Scholar]
- Kuboniwa, H., Tjandra, N., Grzesiek, S., Ren, H., Klee, C.B., and Bax, A. 1995. Solution structure of calcium-free calmodulin. Nature Struct. Biol. 2 768–776. [DOI] [PubMed] [Google Scholar]
- Kung, C., Preston, R.R., Maley, M.E., Ling, K.-Y., Kanabrocki, J.A., Seavey, B.R., and Saimi, Y. 1992. In Vivo Paramecium mutants show that calmodulin orchestrates membrane responses to stimuli. Cell Calcium 13 413–425. [DOI] [PubMed] [Google Scholar]
- Malmendal, A., Evenas, J., Thulin, E., Gippert, G.P., Drakenberg, T., and Forsen, S. 1998. When size is important: Accommodation of magnesium in a calcium binding regulatory domain. J. Biol. Chem. 273 28994–29001. [DOI] [PubMed] [Google Scholar]
- Malmendal, A., Linse, S., Evenas, J., Forsen, S., and Drakenberg, T. 1999. Battle for the EF-hands: Magnesium-calcium interference in calmodulin. Biochemistry 38 11844–11850. [DOI] [PubMed] [Google Scholar]
- Marsden, B.J., Shaw, G.S., and Sykes, B.D. 1990. Calcium binding proteins. Elucidating the contributions to calicum affinity from an analysis of species variants and peptide fragments. Biochem. Cell Biol. 68 587–601. [DOI] [PubMed] [Google Scholar]
- Martin, S.R., Masino, L., and Bayley, P.M. 2000. Enhancement by Mg2 + of domain specificity in Ca2 + -dependent interactions of calmodulin with target sequences. Protein Sci. 9 2477–2488. [DOI] [PMC free article] [PubMed] [Google Scholar]
- Masino, L., Martin, S.R., and Bayley, P.M. 2000. Ligand binding and thermodynamic stability of a multidomain protein, calmodulin. Protein Sci. 9 1519–1529. [DOI] [PMC free article] [PubMed] [Google Scholar]
- Meyer, D.F., Mabuchi, Y., and Grabarek, Z. 1996. The role of phe-92 in the Ca(2+)-induced conformational transition in the C-terminal domain of calmodulin. J. Biol. Chem. 271 11284–11290. [DOI] [PubMed] [Google Scholar]
- Moncrief, N.D., Kretsinger, R.H., and Goodman, M. 1990. Evolution of EF-hand calcium-modulated proteins. I. Relationships based on amino acid sequences. J. Mol. Evol. 30 522–562. [DOI] [PubMed] [Google Scholar]
- Nelson, M.R. and Chazin, W.J. 1998. An interaction-based analysis of calciuminduced conformational changes in Ca2+ Sensor Prot. Protein Sci. 7 270–282. [DOI] [PMC free article] [PubMed] [Google Scholar]
- Pace, C.N. 1990. Measuring and increasing protein stability. TIBTECH 8 93–97. [DOI] [PubMed] [Google Scholar]
- Pedigo, S. and Shea, M.A. 1995a. Discontinuous equilibrium titrations of cooperative calcium binding to calmodulin monitored by 1-D 1H-nuclear magnetic resonance spectroscopy. Biochemistry 34 10676–10689. [DOI] [PubMed] [Google Scholar]
- ———. 1995b. Quantitative endoproteinase GluC footprinting of cooperative Ca2+ binding to calmodulin: Proteolytic susceptibility of E31 and E87 indicates interdomain interactions. Biochemistry 34 1179–1196. [DOI] [PubMed] [Google Scholar]
- Potschka, M. 1987. Universal calibration of gel permeation chromatography and determination of molecular shape in solution. Anal. Biochem. 162 47–64. [DOI] [PubMed] [Google Scholar]
- Procyshyn, R.M. and Reid, R.E. 1994. An examination of glutamic acid in the −X Chelating position of the helix-loop-helix calcium binding motif. Arch. Biochem. Biophys. 311 425–429. [DOI] [PubMed] [Google Scholar]
- Putkey, J.A., Slaughter, G.R., and Means, A.R. 1985. Bacterial expression and characterization of proteins derived from the chicken calmodulin cDNA and a calmodulin processed gene. J. Biol. Chem. 260 4704–4712. [PubMed] [Google Scholar]
- Rao, S.T., Wu, S., Satyshur, K.A., Ling, K.-Y., Kung, C., and Sundaralingam, M. 1993. Structure of Paramecium tetraurelia calmodulin at 1.8Å resolution. Protein Sci. 2 436–447. [DOI] [PMC free article] [PubMed] [Google Scholar]
- Rhoads, A.R. and Friedberg, F. 1997. Sequence motifs for calmodulin recognition. FASEB J. 11 331–340. [DOI] [PubMed] [Google Scholar]
- Seamon, K.B. 1980. Calcium- and magnesium-dependent conformational states of calmodulin as determined by nuclear-magnetic resonance. Biochemistry 19 207–215. [DOI] [PubMed] [Google Scholar]
- Shea, M.A., Verhoeven, A.S., and Pedigo, S. 1996. Calcium-induced interactions of calmodulin domains revealed by quantitative thrombin footprinting of Arg37 and Arg106. Biochemistry 35 2943–2957. [DOI] [PubMed] [Google Scholar]
- Shea, M.A., Sorensen, B.R., Pedigo, S., and Verhoeven, A. 2000. Proteolytic footprinting titrations for estimating ligand-binding constants and detecting pathways of conformational switching of calmodulin. Methods Enzymol. 323 254–301 [DOI] [PubMed] [Google Scholar]
- Sorensen, B.R. 1997. Ph.D. dissertation, University of Iowa .
- Sorensen, B.R. and Shea, M.A. 1996. Calcium binding decreases the stokes radius of calmodulin and mutants R74A, R90A, and R90G. Biophys. J. 71 3407–3420. [DOI] [PMC free article] [PubMed] [Google Scholar]
- ———. 1998. Interactions between domains of apo calmodulin alter calcium binding and stability. Biochemistry 37 4244–4253. [DOI] [PubMed] [Google Scholar]
- Sun, H., Yin, D., and Squier, T.C. 1999. Calcium-dependent structural coupling between opposing globular domains of calmodulin involves the central helix. Biochemistry 38 12266–12279. [DOI] [PubMed] [Google Scholar]
- Swenson, C.A. and Fredricksen, R.S. 1992. Interaction of troponin C and troponin C fragments with troponin I and the troponin I inhibitory peptide. Biochemistry 31 3420–3429. [DOI] [PubMed] [Google Scholar]
- Swint, L. and Robertson, A.D. 1993. Thermodynamics of unfolding for turkey ovomucoid third domain: Thermal and chemical denaturation. Protein Sci. 2 2037–2049. [DOI] [PMC free article] [PubMed] [Google Scholar]
- Tan, R.-Y., Mabuchi, Y., and Grabarek, Z. 1996. Blocking the Ca2+-induced conformational transitions in calmodulin with disulfide bonds. J. Biol. Chem. 271 7479–7483. [DOI] [PubMed] [Google Scholar]
- Taylor, D.A., Sack, J.S., Maune, J.F., Beckingham, K., and Quiocho, F.A. 1991. Structure of a recombinant calmodulin from Drosophila melanogaster refined at 2.2-Å resolution. J. Biol. Chem. 266 21375–21380. [DOI] [PubMed] [Google Scholar]
- Tsai, M.-D., Drakenberg, T., Thulin, E., and Forsén, S. 1987. Is the binding of magnesium(II) to calmodulin significant? An investigation by magnesium-25 nuclear magnetic resonance. Biochemistry 26 3635–3643. [DOI] [PubMed] [Google Scholar]
- Urbauer, J.L., Short, J.H., Dow, L.K., and Wand, A.J. 1995. Structural analysis of a novel interaction by calmodulin: High affinity binding of a peptide in the absence of calcium. Biochemistry 34 8099–8109. [DOI] [PubMed] [Google Scholar]
- VanScyoc, W.S., Coffeen, L.A., and Shea, M.A. 2001. Structure, stablility and calcium binding properties of defective ion channel regulation mutants of Paramecium calmodulin. Biophys. J. 80 317A. [Google Scholar]
- Wang, C.-L.A. 1985. A note on Ca2+ binding to calmodulin. Biochem. Biophys. Res. Commun. 130 426–430. [DOI] [PubMed] [Google Scholar]
- Wilson, M.A. and Brunger, A.T. 2000. The 1.0 A crystal structure of Ca(2+) -bound calmodulin: An analysis of disorder and implications for functionally relevant plasticity. J. Mol. Biol. 301 1237–1256. [DOI] [PubMed] [Google Scholar]
- Wu, X. and Reid, R.E. 1997. Structure/calcium affinity relationships of site III of calmodulin: Testing the acid pair hypothesis using calmodulin mutants. Biochemistry 36 8649–8656. [DOI] [PubMed] [Google Scholar]
- Zhang, M., Tanaka, T., and Ikura, M. 1995. Calcium-induced conformational transition revealed by the solution structure of apo calmodulin. Nature Struct. Biol. 2 758–767. [DOI] [PubMed] [Google Scholar]