

Abstract
The precise regulation of epidermal growth factor receptor (EGFR) signaling is crucial to its function in cellular growth control. Various studies have suggested that the C-terminal phosphorylation domain, itself a substrate for the EGFR kinase activity, exerts a regulatory influence upon it, although the molecular mechanism for this regulation is unknown. The fluorescence resonance energy transfer (FRET) technique was employed to examine how C-terminal domain conformational changes in the context of receptor activation and autophosphorylation might regulate EGFR enzymatic activity. A novel FRET reporter system was devised in which recombinant purified EGFR intracellular domain (ICD) proteins of varying C-terminal lengths were site-specifically labeled at their extreme C termini with blue fluorescent protein (BFP) and a fluorescent nucleotide analog, 2′(3′)-O-(2,4,6-trinitrophenyl)-adenosine 5′-triphosphate (TNP-ATP), binding at their active sites. This novel BFP/TNP-ATP FRET pair demonstrated efficient energy transfer as evidenced by appreciable BFP-donor quenching by bound TNP-ATP. In particular, a marked reduction in energy transfer was observed for the full-length BFP-labeled EGFR-ICD protein upon phosphorylation, likely reflecting its movement away from the active site. The estimated distances from the BFP module to the TNP-ATP-occupied active site for the full-length and C-terminally truncated proteins also reveal the possible folding geometry of this domain with respect to the kinase core. The present studies demonstrate the first use of BFP/TNP-ATP as a FRET reporter system. Furthermore, the results described here provide biophysical evidence for phosphorylation-dependent conformational changes in the C-terminal phosphorylation domain and its likely interaction with the kinase core.
Keywords: protein tyrosine kinase, ErbB, HER, FRET
Signaling by polypeptide growth factors is commonly mediated by cell surface receptors with intrinsic protein tyrosine kinase (PTK) activity. Following stimulation by growth factors, receptor PTKs invoke numerous intracellular signaling pathways involved in cellular proliferation and differentiation. Aberrant signaling from these receptors has been implicated in various forms of cancer (Dancey 2004). The epidermal growth factor receptor (EGFR, also ErbB1 or HER1), the first of many receptors with intrinsic PTK activity to be characterized, is a single polypeptide comprising a glycosylated extracellular growth factor binding domain, a single membrane-spanning region, an intracellular kinase domain, and a C-terminal phosphorylation domain (Schlessinger 2000, 2002; Burgess et al. 2003). Over the years, numerous receptor PTKs have been characterized that share structural homology with the EGFR, including the three other ErbB family members (ErbB2–4 or HER2–4) (Schlessinger 2002; Burgess et al. 2003). In the case of the EGFR, the receptor undergoes rapid ligand-induced dimerization and activation, leading to phosphorylation of intracellular substrates as well as its C-terminal phosphorylation domain. However, models in which the unoccupied EGFR exists in dimeric form have also been proposed (Yu et al. 2002; Landau et al. 2004). In any event, autophosphorylation of key tyrosine residues within the ~230 amino acid C-terminal portion of the intracellular domain (ICD) of the EGFR elicits mitogenic signaling cascades via its engagement of Src homology 2 (SH2) and phosphotyrosine-binding domain (PTB)–containing proteins (Pawson 1994, 1995; Schlessinger 2002).
EGFR function is regulated by multiple mechanisms to ensure proper spatial and temporal signaling in the cell including (1) the binding of at least 12 different ligands through homodimerization and heterodimerization with another ErbB family member, (2) internalization and down-regulation of the receptor, and (3) modulation of its kinase activity by autophosphorylation. These three modes of regulation are shared among many receptor PTKs. Distinguishing the EGFR from other receptor PTKs, however, may be the precise mechanism by which its catalytic activity is regulated, especially in the basal state. Whereas most receptor PTKs require the phosphorylation of the activation loop (A-loop) for full catalytic activity, biochemical and mutational studies have suggested that EGFR kinase activation does not require this phosphorylation (Honegger et al. 1988; Margolis et al. 1989). In this regard, the EGFR may have catalytic potential even in the absence of ligand stimulation, a notion that is consistent with a published crystal structure of the EGFR kinase domain. Here, despite its lack of phosphorylation, and in the absence of any cofactors or nucleotide substrate analogs, the A-loop is seen to adopt a conformation similar to the phosphorylated active form of other receptor PTKs, and the EGFR is apparently primed and ready for the phosphotransfer reaction (Stamos et al. 2002; Burgess et al. 2003).
Various studies have implicated the EGFR C terminus as an autoinhibitory domain (Bertics and Gill 1985; Bertics et al. 1988; Wedegaertner and Gill 1992; Cheng and Koland 1996). Kinetic analyses have indicated that the C-terminal domain regulates EGFR function by virtue of inhibiting PTK activity in the absence of phosphorylation (Bertics and Gill 1985; Bertics et al. 1988). Consistent with these findings were our steady-state fluorescence experiments characterizing the nucleotide and peptide substrate binding properties of the EGFR kinase. Here, we demonstrated that the C-terminal domain reduced the affinity of the nucleotide binding site for a fluorescent ATP analog, which suggested that the C-terminal domain modulates the nucleotide-binding properties of the PTK domain (Cheng and Koland 1996). However, the exact mechanism of this autoinhibitory effect of the C-terminal domain on the PTK remains unclear.
To obtain further insight into the mechanism of EGFR kinase regulation, we have here sought to determine whether structural changes in the EGFR C terminus occur upon its phosphorylation. To examine this possibility, the fluorescence resonance energy transfer (FRET) technique was employed by using recombinant purified EGFR-ICD proteins. The FRET technique enabled us to estimate the distance between the catalytic site of the kinase domain and the extreme C terminus and to monitor any changes in this distance. In FRET experiments, the fluorescent nucleotide analog, 2′(3′)-O-(2,4,6-trinitrophenyl)-adenosine 5′-triphosphate (TNP-ATP) was used as an acceptor molecule bound at the catalytic site, and a green fluorescent protein variant, enhanced blue fluorescent protein (BFP), conjugated at the extreme C terminus served as a donor probe.
Our FRET experiments showed appreciable energy transfer between BFP and TNP-ATP in the nonphosphorylated state of the C-terminally full-length EGFR-ICD-BFP construct. A marked reduction in energy transfer was observed upon phosphorylation, indicating a conformational change of the BFP-fused region of the C terminus. The results of these studies provide molecular insight into the role of autophosphorylation in modulating different C-terminal conformations with respect to the kinase domain. Our FRET investigations also demonstrate the efficacy of the BFP/TNP-ATP FRET pair, and therefore indicate its potential use as a spectroscopic tool for future studies of nucleotide binding proteins.
Results
Biochemical characterization of BFP-labeled EGFR-ICD proteins
The precise mechanism for the regulation of the EGFR by the C-terminal phosphorylation domain has remained elusive. Kinetic and fluorescence investigations have suggested that this domain exerts its regulatory influence on the kinase by intrasteric inhibition of ATP and substrate binding to the active site (Posner et al. 1992, 1994; Cheng and Koland 1996). In an effort to clarify the role of the C-terminal domain in the modulation of its kinase activity, the structural conformations of the C terminus were examined in the context of receptor activation and autophosphorylation. EGFR ICD proteins of varying C-terminal lengths were generated for their application in FRET experiments. Here, these recombinant purified EGFR-ICD proteins were fused C-terminally with a BFP, which served as the donor fluorophore. Figure 1A ▶ shows the schematic of the C-terminally full-length, EGFR-ICD-BFP (amino acid residues 645–1186), the C-terminally truncated EGFR-Δ1022-BFP (amino acid residues 645–1022), and EGFR-Δ976-BFP (amino acid residues 645–976). The full-length EGFR-ICD-BFP contains all five known autophosphorylation sites, whereas EGFR-Δ1022-BFP contains only one (Tyr 992), and EGFR-Δ976-BFP is devoid of all the major tyrosine autophosphorylation sites (Fig. 1A ▶).
Figure 1.

(A) Schematic structures of the BFP-labeled EGFR-ICD proteins indicating the EGFR amino acid residues included in each construct and the location of known C-terminal tyrosine residue phosphorylation sites (Y). (B) Characterization of purified BFP-labeled EGFR-ICD proteins. EGFR-ICD-BFP, EGFR-Δ1022-BFP, and EGFR-Δ976-BFP were resolved by 10% SDS-PAGE and visualized with Coomassie blue staining (left panel) or immunoblotted with anti-EGFR (middle panel) or anti-GFP (right panel). (C) In vitro phosphorylation activities of BFP-labeled EGFR-ICD proteins. Incubations were carried out in the presence or absence of Mn2+ and ATP (see Materials and Methods). Proteins were resolved by SDS-PAGE and immuno-blotted with anti-EGFR or anti-phosphotyrosine (top,middle). The kinase activity of EGFR-Δ976-BFP was assayed via its ability to phosphorylate the C-terminal phosphorylation domain substrate, EGFR-CT. EGFR-CT was subsequently resolved by SDS-PAGE and immunoblotted with anti-EGFR and anti-phosphotyrosine.
EGFR-ICD-BFP, EGFR-Δ1022-BFP, and EGFR-Δ976-BFP proteins were analyzed by SDS-PAGE upon purification by using metal-ion chelation chromatography (Fig. 1B ▶). Predominant protein bands of ~90 kDa, ~73 kDa, and ~68 kDa were observed with Coomassie blue staining, corresponding to the expected sizes of EGFR-ICD-BFP, EGFR-Δ1022-BFP, and EGFR-Δ976-BFP, respectively (Fig. 1B ▶, left panel). An antibody recognizing the ICD of the EGFR was used in immunoblotting to confirm the identity of the purified proteins (middle panel). A GFP antibody that also recognizes the BFP amino acid sequence was used to verify that the BFP module was conjugated to the expressed EGFR-ICD proteins (right panel).
The integrity of the intrinsic PTK activity of the BFP-labeled EGFR-ICD proteins was examined by in vitro phosphorylation reactions, in which phosphorylation was detected by anti-phosphotyrosine immunoblotting (Fig. 1C ▶). EGFR-ICD-BFP and EGFR-Δ1022-BFP demonstrated an ability to autophosphorylate, as evidenced by the detection of anti-phosphotyrosine signals only when Mn2+ and ATP were added. The enzymic activity of EGFR-Δ976-BFP, which lacks the C-terminal autophosphorylation domain, was assessed by determining its ability to phosphorylate EGFR-CT, a purified C-terminal domain of the EGFR that served as an exogenous substrate. Figure 1C ▶ (lower panel) shows that EGFR-Δ976-BFP effectively phosphorylated the EGFR-CT substrate upon addition of Mn2+ and ATP.
Steady-state fluorescence analyses
The steady-state fluorescence excitation and emission spectra of the BFP-labeled EGFR-ICD proteins were recorded (Fig. 2A ▶). The excitation and emission spectra of the full-length and the truncated forms (Δ1022 and Δ976) displayed similar profiles, typical of the BFP fluorophore.
Figure 2.
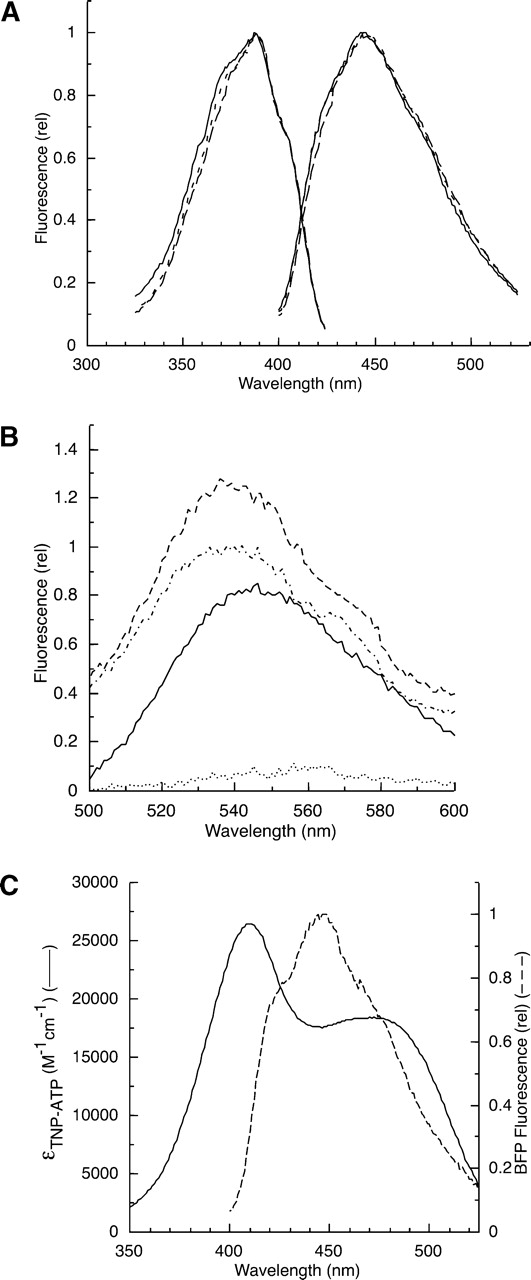
(A) Fluorescence spectra of the purified EGFR-ICD-BFP proteins. The excitation and emission spectra of EGFR-ICD-BFP (solid line), EGFR-Δ1022-BFP (long dashes) and EGFR-Δ976-BFP (short dashes) were recorded with 8-nm excitation and emission band passes and corrected by subtraction of a buffer blank spectrum. (B) Fluorescence emission spectra of TNP-ATP recorded in the presence of buffer alone (dotted line), EGFR-ICD-BFP (solid line), EGFR-Δ1022-BFP (dotted/dashed line), and EGFR-Δ976-BFP (dashed line). (C) Spectral overlap of the fluorescence emission spectrum of EGFR-ICD-BFP (dashed line) and the TNP-ATP absorbance spectrum (solid line) normalized to the units of extinction coefficient.
We previously reported the binding properties of the fluorescent nucleotide analog TNP-ATP at the catalytic core of the EGFR, which is monitored by the significant enhancement of its inherently low fluorescence quantum yield upon binding to the hydrophobic environment of the ATP binding site (Cheng and Koland 1996). In the present work, the purified BFP-labeled EGFR proteins were each tested for their ability to bind the TNP-ATP acceptor probe at the catalytic core. Figure 2B ▶ shows representative fluorescence emission spectra of TNP-ATP in the presence and absence of the BFP-labeled EGFR-ICD proteins. In the presence of the proteins, the fluorescence of TNP-ATP was significantly enhanced with notable blue-shifts in the wavelength maximum from 555 nm to 540 nm, indicative of TNP-ATP binding at the active site (Fig. 2B ▶). The intensity of the TNP-ATP fluorescence enhancement was greater in the case of the C-terminally truncated proteins versus the full-length protein, as was observed in our previous TNP-ATP binding studies (Cheng and Koland 1996).
Dynamic light scattering measurements
Prior to FRET analysis of the BFP-labeled EGFR-ICD proteins, the possibility of dimerization was assessed by dynamic light scattering analysis. This analysis yields the diffusion rate of a particle in solution and its apparent hydrodynamic radius (Rh) and molecular mass. Table 1 shows the Rh values and apparent molecular masses for each of the purified proteins. Under nonphosphorylating conditions, EGFR-ICD-BFP, EGFR-Δ1022-BFP, and EGFR-Δ976-BFP yielded Rh values consistent with their molecular masses, indicative of their homogenous monomeric distribution. To test whether the metal activator Mn2+ and/or phosphorylation promoted dimerization, the EGFR-ICD proteins were phosphorylated prior to dynamic light scattering analysis. The Rh values for the EGFR-ICD proteins under phosphorylating conditions did not change as a result of Mn2+ addition or phosphorylation, indicating their persistent monomeric state.
Table 1.
Dynamic light scattering analysis of BFP-labeled EGFR-ICD proteins
| Sample | Rh (nm) | Mr (kDa) | % Mass intensity |
| EGFR-ICD | 4.34 ± 0.14 | 104 | 93 |
| EGFR-ICD~Pa | 4.35 ± 0.17 | 105 | 91 |
| EGFR-Δ976 | 3.70 ± 0.70 | 72 | 91 |
| EGFR-Δ976~Pa | 3.64 ± 0.53 | 69 | 92 |
| EGFR-Δ1022 | 3.56 ± 0.75 | 66 | 89 |
| EGFR-Δ1022~Pa | 3.62 ± 0.69 | 68 | 88 |
Protein samples were analyzed by use of a DynaPro Molecular Sizing Instrument and Dynamics software. The actual translation diffusion coefficient measured for each sample was used to estimate the hydrodynamic radius (Rh) based on the Stokes-Einstein equation, and the molecular mass (Mr) was estimated by using the supplied standard curve of Mr versus Rh data. The percent mass intensity for each sample was calculated after subtraction of solvent scattering peaks. Rh values are given as the average ± SE of four independent determinations.
a Denotes the BFP-labeled proteins under phosphorylating conditions.
Steady-state FRET measurements
BFP and TNP-ATP were used as a donor/acceptor pair in FRET experiments to study the effects of phosphorylation on the conformation of the EGFR C-terminal phosphorylation domain. On the basis of the good spectral overlap between BFP emission and TNP-ATP excitation (Fig. 2C ▶), it was expected that if the C-terminally labeled BFP donor were in close proximity to TNP-ATP bound to the kinase active site, a significant quenching would be observed. Any appreciable change in donor quenching as a result of C-terminal phosphorylation would indicate conformational changes. Figure 3 ▶ shows representative primary data of BFP donor fluorescence quenching by TNP-ATP titration. Here, the intensity of fluorescence emission by EGFR-ICD-BFP decreased with each addition of TNP-ATP, indicating a dramatic quenching effect until saturation of the nucleotide-binding site, a phenomenon that was also observed for the C- terminally truncated proteins (see Fig. 6 ▶, below). It is noted here that FRET experiments are also commonly conducted by monitoring a change in acceptor fluorescence emission. In the present experiments, however, the low quantum yield of the TNP-ATP acceptor precluded FRET measurements by observation of the acceptor emission.
Figure 3.

Quenching of EGFR-ICD-BFP fluorescence by TNP-ATP; 0.5 μM EGFR-ICD-BFP was titrated with increasing amounts of TNP-ATP (0, 0.125, 0.25, 0.5, 1, 1.5, 2 μM) as fluorescence emission spectra of the BFP reporter were recorded. With successive additions, the BFP emission intensity progressively decreased, indicative of increased donor quenching until saturation of the nucleotide-binding site. Representative results of several experiments are shown (see also Fig. 6 ▶).
Figure 6.

Efficiency of BFP/TNP-ATP energy transfer for EGFR-ICD-BFP proteins. BFP fluorescence emission spectra of the EGFR-ICD-BFP constructs were measured in the presence of increasing TNP-ATP concentrations under phosphorylating (solid symbols) or nonphosphorylating (open symbols) conditions (see Materials and Methods). The spectra were numerically integrated to obtain relative quantum yields, which were corrected for inner filter quenching effects (see Fig. 4 ▶) and plotted. Data shown are the averages of three independent experiments. (Representative raw data are given in Fig. 3 ▶.) The titration data for EGFR-ICD-BFP (squares), EGFR-Δ1022-BFP (triangles), and EGFR-Δ976-BFP (circles) were each fit with a hyperbolic curve to estimate the energy transfer that would occur at saturation of TNP-ATP binding (Table 2). Note that the quantum yield scale is expanded.
To ensure that the donor quenching was specifically due to energy transfer and to correct the raw FRET data for inner filter effects that contribute to the overall donor quenching at high TNP-ATP concentrations, a control experiment was performed in which BFP donor quenching was assayed after a limited trypsin proteolysis of EGFR-ICD-BFP (see Materials and Methods). Figure 4A ▶ demonstrates the efficacy of the limited proteolysis condition in which the BFP peptide sequence remained completely intact when probed with a GFP antibody, whereas EGFR-ICD proved to be susceptible to proteolysis and was no longer detectable when probed with anti-EGFR antibody. The typical BFP emission profile also demonstrated that the limited proteolysis did not affect the spectral properties of BFP (Fig. 4B ▶). Figure 4C ▶ shows the degree of BFP quenching as a function of TNP-ATP concentration after EGFR-ICD-BFP proteolysis. Titration of the cleaved BFP module with TNP-ATP showed limited donor quenching particularly at lower concentrations, in contrast to the immediate quenching response observed when intact EGFR-ICD-BFP proteins were examined. There was a small amount of quenching, however, due to inner filter effects at TNP-ATP concentrations near saturation (Fig. 4C ▶). These control donor quenching data yielded concentration-dependent inner filter effect correction parameters used in correcting all subsequent donor quenching data.
Figure 4.

Effect of limited trypsin proteolysis on FRET between EGFR-ICD-BFP and TNP-ATP. (A) Limited trypsin digestion of EGFR-ICD-BFP. Varying concentrations of trypsin were incubated with EGFR-ICD-BFP to determine the optimal condition for cleavage of the BFP module from the EGFR-ICD protein. After proteolysis, samples were resolved by SDS-PAGE and then immunoblotted with anti-GFP (upper panel) or anti-EGFR (lower panel). (B) Effects of trypsin proteolysis on fluorescence emission of the BFP reporter. Shown are the fluorescence emission spectra of EGFR-ICD-BFP before (solid line) or after (dashed line) trypsin (1 μg/mL) treatment. (C) Contribution of TNP-ATP inner filter quenching to observed BFP-donor quenching. Fluorescence emission spectra of trypsin-treated EGFR-ICD-BFP were recorded in the presence of increasing amounts of TNP-ATP to indicate the magnitude of inner filter quenching. Emission spectra were integrated to give relative quantum yields, and the data were fit with an exponential to determine the concentration-dependent inner filter quenching efficiencies used for correction of EGFR-ICD-BFP titration data (see Fig. 6 ▶). The composite results of three independent experiments are shown.
The mechanism by which TNP-ATP quenched the fluorescence of the intact EGFR-ICD-BFP construct was further investigated by performing fluorescence titrations similar to those of Figure 3 ▶, but in the presence or absence of the authentic substrate ATP. Here fluorescence titration data were quantified by integration of emission spectra to give relative quantum yields, correcting these quantum yields for inner filter quenching, and plotting the corrected quantum yields as a function of TNP-ATP concentration (Fig 5 ▶). It was seen that in the absence of ATP, TNP-ATP elicited a saturable quenching of EGFR-ICD-BFP fluorescence apparently attributed to the binding of TNP-ATP to the catalytic site with a micromolar dissociation constant (cf. Cheng and Koland 1996). However, in the presence of 2 mM ATP, quenching by TNP-ATP was much attenuated. The ability of ATP to effectively block TNP-ATP-dependent quenching of EGFR-ICD-BFP fluorescence was consistent with the demonstrated competition of TNP-ATP and ATP in binding to the EGFR active site (Cheng and Koland 1996), and further indicated that the observed TNP-ATP-dependent quenching was due to FRET from the C-terminal BFP probe to EGFR active site-bound TNP-ATP. A residual binding of TNP-ATP to the catalytic site in the presence of 2 mM ATP would be predicted from the relative dissociation constants of the two nucleotides (Cheng and Koland 1996).
Figure 5.

Specificity of the TNP-ATP-dependent quenching of EGFR-ICD-BFP fluorescence. Fluorescence titrations similar to those of Figure 3 ▶ were performed in the absence (open circles) or presence (filled circles) of 2 mM ATP. Phosphorylation was inhibited by addition of 1 mM EDTA. Recorded emission spectra were numerically integrated to determine the relative quantum yields, which were then corrected for inner filter quenching (see Fig. 4 ▶), and the titration data were plotted. Apparently by competing with TNP-ATP binding to the catalytic site, ATP largely blocked the TNP-ATP-dependent quenching of EGFR-ICD-BFP fluorescence. Note that the quantum yield scale is expanded.
Figure 6 ▶ shows energy transfer data for the full-length and C-terminally truncated BFP-labeled EGFR-ICD proteins under phosphorylating and nonphosphorylating conditions. The donor quenching data points were fit to a hyperbolic curve to estimate the maximum energy transfer at saturation for each construct under different conditions. The full-length EGFR-ICD-BFP, when nonphosphorylated, resulted in appreciable energy transfer (46%), whereas upon C-terminal phosphorylation the energy transfer was markedly reduced (28%). The distance from TNP-ATP to the BFP module was estimated by using Förster’s FRET/distance relation (see Materials and Methods). Briefly, the R0 value, or the distance at which energy transfer is 50% for the TNP-ATP/BFP FRET pair, was calculated by determining their degree of spectral overlap (J) by integration of their respective absorption and emission spectra (Fig. 2C ▶). The dipole orientation of the fluorophores was assumed to be random yielding a κ2 value of 2/3, whereas the quantum yield value of 0.25 was used for the BFP donor (Patterson et al. 2001). The calculation based upon the above mentioned parameters yielded an R0 value of 39.1 Å. The estimated C-terminal distances to the active site for EGFR-ICD-BFP were 40 Å and 46 Å, in the nonphosphorylated and phosphorylated states, respectively (Table 2).
Table 2.
FRET analysis of BFP-labeled EGFR-ICD proteins
| Sample | % Energy transfer | Distance (Å) | Kd (μM) |
| EGFR-ICD | 46 ± 1.7 | 40 | 0.21 ± 0.04 |
| EGFR-ICD~Pa | 28 ± 2.3 | 46 | 0.27 ± 0.08 |
| EGFR-Δ976 | 57 ± 1.2 | 37 | 0.16 ± 0.01 |
| EGFR-Δ976~Pa | 58 ± 1.4 | 37 | 0.18 ± 0.01 |
| EGFR-Δ1022 | 43 ± 1.0 | 41 | 0.21 ± 0.01 |
| EGFR-Δ1022~Pa | 41 ± 1.3 | 41 | 0.24 ± 0.01 |
Donor emission spectra of various EGFR-ICD-BFP constructs recorded during TNP-ATP titrations (e.g. Fig. 3 ▶) were integrated to yield relative quantum yields, which were corrected for inner filter quenching effects (Fig. 4 ▶). The quantum yield versus TNP-ATP concentration profiles were fit with hyperbolic curves (Fig. 6 ▶), yielding the percentage of energy transfer at saturation, the corresponding distance in Å ngstroms, and the apparent TNP-ATP dissociation constant (Kd). Percentages of energy transfer and Kd values are given as the average ± SE of three independent determinations.
aDenotes the BFP-labeled proteins under phosphorylating conditions.
EGFR-Δ1022-BFP possesses an intermediate C-terminal truncation that retains 46 C-terminal amino acid residues, including an acidic motif (amino acid residues 979–996) (Fig. 1A ▶) and a single known autophosphorylation site (Tyr 992). Given that EGFR-Δ1022-BFP has a short C-terminal length with this acidic motif still intact, the goal here was measuring its C-terminal distance to the TNP-ATP-bound active site to determine the overall folding geometry of this domain. Moreover, it was thought that FRET analysis of EGFR-Δ1022-BFP might reveal the role of the acidic motif on the conformation of this domain, especially in the context of phosphorylation (see Discussion). The results, however, indicated that phosphorylated and nonphosphorylated EGFR-Δ1022-BFP displayed similar energy transfer levels of 43% and 41%, respectively, corresponding to a negligible distance change from ~41 Å to 41.5 Å (Table 2).
The EGFR-ICD-BFP and EGFR-Δ1022-BFP constructs were under phosphorylating conditions stoichiometrically phosphorylated (~1.0 mol phosphate/mol protein) as judged by radiochemical assays (data not shown) and the gel shifts seen in Figure 1B ▶. However, it might be that the C-terminal domain of the EGFR, with its multiple phosphorylation sites, can in the native context become more highly phosphorylated, and thus the C terminus/active site distance changes reported here for the EGFR-ICD-BFP protein possibly underestimate what could occur in the case of the authentic receptor.
As a control, EGFR-Δ976-BFP, which lacked the entire C-terminal region, was used. As expected, EGFR-Δ976-BFP yielded the highest level of energy transfer (57%) and was not subject to significant changes under phosphorylating conditions. Table 2 summarizes our energy transfer results and dissociation constants (Kd) for TNP-ATP binding for the BFP-labeled EGFR-ICD proteins derived from their respective hyperbolic curve fits.
Discussion
Previous investigations of the EGFR PTK have suggested that the C-terminal phosphorylation domain modulates PTK activity by regulating access of substrates to the catalytic site (Bertics and Gill 1985; Bertics et al. 1988; Walton et al. 1990; Cheng and Koland 1996). In this regard, the C-terminal domain appears to play a pivotal role in the overall signaling functions of the EGFR. This view has become particularly relevant in light of the recently published crystallographic structures of the kinase domain, which support the notion of the EGFR kinase adopting a constitutively active conformation in the absence of ligand-stimulation (Stamos et al. 2002; Burgess et al. 2003). To date, limited crystallographic data for the C-terminal domain exist, and as such, the nature of the C-terminal interaction with the catalytic domain is unclear (see below).
Given that the C-terminal domain of the EGFR must first access the catalytic site for phosphorylation and then become accessible to intracellular signaling proteins, conformational changes would be predicted in the course of receptor activation and signaling. Indeed, it was previously reported by analytical gel filtration analyses that C-terminal phosphorylation induces a structural change in the EGFR-ICD (Cadena et al. 1994). The present studies employed the FRET technique to further characterize these conformational changes. FRET measurements yielded an estimate of the distance between a C-terminal BFP donor and active-site-bound TNP-ATP and revealed how phosphorylation changed this distance and conformation. Our technique for site-specific fluorescent labeling of the EGFR-ICD with the BFP module yielded catalytically competent recombinant proteins, as indicated by phosphorylation and TNP-ATP binding assays (Figs. 1 ▶, 2 ▶).
Our initial results demonstrated that the TNP-ATP/BFP pair served as a functional FRET reporter system, as evidenced by the marked quenching of BFP donor fluorescence as the TNP-ATP acceptor occupied the active site (Fig. 3 ▶). Determining the state of aggregation for these ICD proteins was crucial to discern whether the observed energy transfer was intramolecular or intermolecular, or a combination of both. To address this question, each EGFR-ICD construct was subjected to dynamic light scattering analysis of polydispersity, i.e., to gauge the fraction of monomers and/or dimers. As shown in Table 1, the full-length (EGFR-ICD-BFP), as well as both forms of the C-terminally truncated proteins (EGFR-Δ976-BFP and EGFR-Δ1022-BFP) existed almost exclusively as monomers, as reflected by their apparent molecular mass and homogeneity. The same light scattering analyses under phosphorylating conditions (Mn2+ and ATP) did not indicate dimerization, implying that the observed FRET was intramolecular in nature.
At the onset of our FRET studies, it was important to verify that the observed quenching of the BFP donor by the TNP-ATP acceptor reflected true Förster FRET and was not due to interactions of the unbound TNP-ATP fraction and the BFP moiety. To this end, the BFP module was proteolytically cleaved from the EGFR-ICD construct and control TNP-ATP quenching profiles were obtained. The minimal BFP quenching observed was near-linear and consistent with the anticipated amount of inner filter quenching. These control quenching profiles were fit to an exponential curve to allow correction of subsequent FRET titrations for concentration-dependent inner filter quenching.
The most notable finding from our FRET experiments was the significant reduction in energy transfer of the full-length EGFR-ICD upon phosphorylation, likely the result of the BFP-fused C terminus moving away from the TNP-ATP-bound active site. It is uncertain on the basis of our results whether this conformational change is strictly limited to the C-terminal region near the BFP module or reflects a larger segmental movement of this domain.
Our FRET measurements also provided insight into the overall folding geometry of the C-terminal domain with respect to the kinase core. It is currently unknown precisely what kind of tertiary structure this phosphorylation domain adopts in nonphosphorylated and phosphorylated states. Based upon our analyses of the C-terminal truncations, the efficiency of energy transfer did not necessarily correlate to the C-terminal lengths, suggesting that it is unlikely that the C terminus assumes a fully extended conformation, in which case a minimal FRET would also have been observed in the case of the full-length protein. The C-terminally full-length EGFR-ICD in the nonphosphorylated state displayed a slightly higher level of energy transfer than does the intermediate C-terminal truncation, EGFR-Δ1022 (cf. ~46% and ~42%; Table 2), even though its C terminus is ~180 amino acid residues longer. A structural model that accounts for this observation is one in which the C terminus adopts a “loop-like” conformation with respect to the kinase domain. It is possible that this loop configuration facilitates a physical interaction of the extreme C-terminal phosphorylation sites with the kinase core.
Indeed, there exists some structural evidence of a C-terminalinteraction with the kinase core. One crystal structure of the EGFR kinase domain includes a partial tertiary structure of the first 40 C-terminal residues with respect to the kinase core (Wood et al. 2004). Specifically, in this structure the ordered C-terminal residues 971–980 form a short α-helix that interacts intramolecularly with the N- and C-terminal lobes of the kinase core. Moreover, this C-terminal segment, by virtue of close physical proximity, appears to partially block the front of the ATP binding cleft. A second ordered segment containing residues 986–994 is shown to interact with the N-terminal lobe of the kinase domain and could be a point at which the C-terminal domain loops back in the direction of its point of attachment to the kinase core. Our results are consistent with this structural model. A second EGFR kinase domain structure shows an ordered segment of the C-terminal domain interacting intermolecularly with the kinase core of a crystal neighbor (Stamos et al. 2002). While our work does not rule out the possibility that such intermolecularinteractions between cytoplasmic domains occur in the context of receptors dimerized in a native membrane, the EGFR-ICD proteins investigated in this study were monomeric under both nonphosphorylating and phosphorylating conditions (Table 1). Thus the structural changes seen here with C-terminal domain phosphorylation could reflect intramolecular interactions between the C terminus and the kinase core, which are possibly involved in kinase regulation.
The distances from the BFP module to the active site bound TNP-ATP derived from our FRET measurements (Table 2) should be viewed as estimates. The BFP module was likely relatively immobile on the time scale of its fluorescence, especially compared with smaller fluorescent probes. Hence, it was possible that assigning a κ2 value of 2/3, which assumes random orientation of the BFP/TNP-ATP chromophores, could affect the accuracy of our distance calculations. Despite the dramatic reduction in energy transfer upon phosphorylation for the full-length protein (from 46% to 28%), the difference translates to a relative distance change of only ~6 Å from BFP to the active site. Again, it is unclear whether the ~6 Å excursion from the active site for the BFP reflects only the local movement of the extreme C-terminal region or a large segmental rearrangement. Overall, the distance measurements vary over only a small range (37–46 Å) for three constructs that differ by up to 200-amino acid residues in length.
FRET analysis of EGFR-Δ1022-BFP, in particular, allowed us to examine the role of a specific structural motif contained within this C-terminal fragment. The structural modeling study of Landau and coworkers (2004) has implicated an acidic motif (residues 980–991) in providing electrostatic stability for dimerization of EGFR kinase domains. Given that the short C-terminal fragment of EGFR-Δ1022-BFP still retained this acidic motif, it was of particular interest in assessing how the high negative charge distribution of its C terminus would impact the energy transfer and C-terminal conformation, especially when the single tyrosine residue (amino acid 992) became phosphorylated. The results indicated that energy transfer levels were not significantly influenced under phosphorylating conditions, suggesting a lack of conformational changes of this C-terminal fragment. It may be that the short C-terminal fragment of EGFR-Δ1022-BFP simply lacks the flexibility of the full-length C-terminal domain to assume a similar loop-structure when fused to a BFP module. Alternatively, the C-terminal portion containing the major sites of autophosphorylation, such as tyrosine 1148 and 1173 might be necessary for facilitating this loop conformation and yielding phosphorylation-dependent conformational changes.
In summary, the present work exploits a novel FRET donor/acceptor reporter system. The strategy entailed the use of BFP and TNP-ATP as a FRET pair, which have significant spectral overlap. Also, the small unobtrusive nature of TNP-ATP possessed a distinct advantage over the widely used dual modified-GFP FRET reporter pairs (such as cyan fluorescent protein and yellow fluorescent protein), since two relatively large protein modules are more likely to perturb the structure of the protein of interest. FRET analysis using this novel BFP/TNP-ATP donor/acceptor pair here allowed a characterization of the structural conformations of the EGFR C-terminal phosphorylation domain with respect to the kinase core, which provides molecular insight into the function of the C-terminal domain in kinase regulation and signaling.
Materials and methods
Materials
TNM-FH insect cell medium was purchased from Sigma. TNP-ATP was obtained from Molecular Probes. The Bac-to-Bac baculovirus expression system kit, including the pFastBac1 donor plasmid and CellFECTIN reagent, were purchased from Life Technologies. LAR protein tyrosine phosphatase was supplied by New England BioLabs.
Generation of recombinant baculoviruses
The baculovirus expression system was used to generate recombinant EGFR domains as hexahistidine-tagged proteins to be purified by metal ion chelation chromatography. All recombinant baculoviruses were constructed by using the Bac-to-Bac system (Life Technologies). A template vector for the expression of N-terminally hexahistidine-tagged EGFR ICD was constructed by a recombinant PCR method. Here, a methionine start codon followed by six histidine codons were fused upstream of the EGFR-ICD-encoding cDNA (encompassing amino acid residues 664–1186) and cloned behind the polyhedron promoter in the pFastBac1 plasmid. A vector containing the BFP sequence was restriction digested and C-terminally fused in frame with the EGFR-ICD coding sequence of the pFastBac1-EGFR-ICD. The C-terminally truncated forms EGFR-Δ976-BFP and EGFR-Δ1022-BFP were generated via subcloning of PCR amplified C-terminal segments of the EGFR cDNA sequence corresponding to truncations at amino acid residues 976 and 1022, respectively. EGFR-CT was generated by a similar method where the EGFR-CT-encoding cDNA (EGFR amino acids 972–1186) was PCR amplified and sub-cloned into and behind the hexahistidine codons incorporated into pFastBac1. Subsequent generation of recombinant baculoviruses from each recombinant pFastBac1 donor plasmid was performed according to manufacturer protocols. Purified recombinant viruses were amplified with three rounds of infection in Sf21 cells grown at 27°C using a multiplicity of infection (MOI) of 0.1. Viral supernatants were harvested 48–72 h post-infection.
Purification of recombinant EGFR proteins
Sf21 cells were infected with baculovirus at a MOI of 2. Forty-eight hours post-infection, cells were harvested by centrifugation at 1000g for 5 min and gently washed with suspension buffer (20 mM HEPES at pH 7.4, 0.5 M NaCl, 250 mM sucrose, protease inhibitors [5 μg/mL aprotinin, 5 μg/mL leupeptin, 2 μM pepstatin A, 1 mM PMSF]). Cells were again pelleted, resuspended with sucrose-free suspension buffer, and then lysed using a microsonicator (four 15-sec bursts). Sonication and all subsequent steps were performed at 4°C or on ice. After sonication, the cell lysate was centrifuged at 40,000g for 20 min, and the supernatant was collected and supplemented with 0.05% Triton X-100. The lysate was run through a Talon cobalt resin column (Clontech) equilibrated with 20 mM HEPES (pH 7.4), 0.5 M NaCl, and 0.05% Triton X-100 at a 0.5 mL/min flow rate. The column was then washed with 20 column volumes of wash buffer (20 mM HEPES at pH 7.4, 0.5 M NaCl, and 8 mM imidazole, 0.05% Triton X-100) and then washed with an additional 10 column volumes of Triton X-100-free wash buffer. Hexahistidine-tagged proteins were eluted with 20 mM HEPES (pH 7.4), 0.5 M NaCl, and 150 mM imidazole. Upon elution, the purified proteins were dialyzed exhaustively against 20 mM HEPES (pH 7.4), 100 mM NaCl, and 10% (v/v) glycerol.
EGFR-ICD phosphorylation and PTK assays
Kinase assays were performed at 25°C by preincubating a 0.5 μM concentration of the kinase in 1 mM MnCl2 for 5 min in buffer A (20 mM HEPES at pH 7.4, 50 mM NaCl) and then initiated by addition of 100 μM ATP. The reactions were quenched after 30 min with 3 mM EDTA. Proteins were resolved by SDS-PAGE and immunoblotted with EGFR (Ab12, Lab Vision) and phosphotyrosine (PY20, BD Transduction Laboratories) antibodies. In FRET experiments, the nonphosphorylated protein samples to be analyzed were each pretreated with LAR phosphatase (20 U/1.5 mL of 0.5 μM protein) for 30 min at 25°C to ensure full dephosphorylation of the proteins. Phosphorylated samples for FRET measurements were subjected to preincubation with 1 mM MnCl2 for 5 min and then a 30-min incubation at 25°C after addition of 100 μM ATP. Both phosphorylated and nonphosphorylated protein samples were treated with 3 mM EDTA and then exhaustively dialyzed against buffer A.
Steady-state fluorescence excitation and emission measurements
Steady-state excitation and emission spectra were recorded with an SLM4800C spectrofluorimeter. All measurements were made at 25°C with 8-nm slits for excitation and emission. Excitation spectra of the BFP-labeled proteins were recorded in the ratio mode with fixed emission at 450 nm, while the emission spectra were recorded with excitation at 380 nm. The fluorescence emission spectra of TNP-ATP were recorded with excitation at 418 nm.
Dynamic light scattering analysis of EGFR-ICD-BFP proteins
Light scattering measurements were made with a DynaPro Molecular Sizing Instrument with Dynamics software. The BFP-labeled EGFR-ICD proteins were analyzed in 20 mM HEPES (pH 7.4) and 100 mM NaCl at 4°C. Protein samples were measured four times with 20 counts per measurement. Data reflect the subtraction of solvent noise peaks present in the samples.
FRET studies
The efficiency of energy transfer (E) from donor to acceptor is dependent upon the distance of their separation (R) according to Förster’s theory: E = 1/[1 + (R/R0)6], where R0 corresponds to the distance at which energy transfer is 50% efficient. The R0 value is determined by the formula R0 = (9.79 × 10³ Å)(Jκ2Q0n−4)1/6 where J is the spectral overlap integral, κ2 is the donor-acceptor dipole orientation factor, Q0 is the normal quantum yield of the donor, and n is the refractive index of the medium. In the present work, a numerical integration method was used to calculate the spectral overlap integral J of BFP and TNP-ATP. The estimate for κ2 was 2/3, a value that assumes random orientation of the probes. A value of 1.33 was assigned for the refractive index, n, and the quantum yield, Q0, for BFP was determined previously (Patterson et al. 2001).
Acknowledgments
We thank Dr. S. Ramaswamy for his assistance with dynamic light scattering measurements and the University of Iowa Biochemistry Department for providing access to their SLM 4800C fluorimeter. This research was supported by NIH grant DK44684, the University of Iowa Biological Sciences Funding Program, and a predoctoral fellowship to N.Y.L. from the U.S. Army Breast Cancer Research Program (DAMD17-98-1-8199).
Abbreviations
PTK, protein tyrosine kinase
EGFR, epidermal growth factor receptor
SH2, Src homology-2
A-loop, activation loop
ICD, intracellular domain
FRET, fluorescence resonance energy transfer
Δ976, C-terminal truncation of EGFR at residue 976
Δ1022, C-terminal truncation of EGFR at residue 1022
TNP-ATP, 2′(3′)-O-(2,4,6-trinitrophenyl)-adenosine 5′-triphosphate
BFP, blue fluorescence protein
EGFR-CT, C-terminal domain of EGFR
Article published online ahead of print. Article and publication date are at http://www.proteinscience.org/cgi/doi/10.1110/ps.051630305.
References
- Bertics, P.J. and Gill, G.N. 1985. Self-phosphorylation enhances the protein-tyrosine kinase activity of the epidermal growth factor receptor. J. Biol. Chem. 260 14642–14647. [PubMed] [Google Scholar]
- Bertics, P.J., Chen, W.S., Hubler, L., Lazar, C.S., Rosenfeld, M.G., and Gill, G.N. 1988. Alteration of epidermal growth factor receptor activity by mutation of its primary carboxyl-terminal site of tyrosine self-phosphorylation. J. Biol. Chem. 263 3610–3617. [PubMed] [Google Scholar]
- Burgess, A.W., Cho, H.S., Eigenbrot, C., Ferguson, K.M., Garrett, T.P., Leahy, D.J., Lemmon, M.A., Sliwkowski, M.X., Ward, C.W., and Yokoyama, S. 2003. An open-and-shut case? Recent insights into the activation of EGF/ErbB receptors. Mol. Cell 12 541–552. [DOI] [PubMed] [Google Scholar]
- Cadena, D.L., Chan, C.L., and Gill, G.N. 1994. The intracellular tyrosine kinase domain of the epidermal growth factor receptor undergoes a conformational change upon autophosphorylation. J. Biol. Chem. 269 260–265. [PubMed] [Google Scholar]
- Cheng, K. and Koland, J.G. 1996. Nucleotide binding by the epidermal growth factor receptor protein-tyrosine kinase: Trinitrophenyl-ATP as a spectroscopic probe. J. Biol. Chem. 271 311–318. [DOI] [PubMed] [Google Scholar]
- Dancey, J.E. 2004. Predictive factors for epidermal growth factor receptor inhibitors: The bull’s-eye hits the arrow. Cancer Cell 5 411–415. [DOI] [PubMed] [Google Scholar]
- Honegger, A., Dull, T.J., Szapary, D., Komoriya, A., Kris, R., Ullrich, A., and Schlessinger, J. 1988. Kinetic parameters of the protein tyrosine kinase activity of EGF-receptor mutants with individually altered autophosphorylation sites. EMBO J. 7 3053–3060. [DOI] [PMC free article] [PubMed] [Google Scholar]
- Landau, M., Fleishman, S.J., and Ben-Tal, N. 2004. A putative mechanism for downregulation of the catalytic activity of the EGF receptor via direct contact between its kinase and C-terminal domains. Structure (Camb.) 12 2265–2275. [DOI] [PubMed] [Google Scholar]
- Margolis, B.L., Lax, I., Kris, R., Dombalagian, M., Honegger, A.M., Howk, R., Givol, D., Ullrich, A., and Schlessinger, J. 1989. All autophosphorylation sites of epidermal growth factor receptor and HER2/neu are located in their carboxyl-terminal tails: Identification of a novel site in EGF receptor. J. Biol. Chem. 264 10667–10671. [PubMed] [Google Scholar]
- Patterson, G., Day, R.N., and Piston, D. 2001. Fluorescent protein spectra. J. Cell Sci. 114 837–838. [DOI] [PubMed] [Google Scholar]
- Pawson, T. 1994. Signal transduction: Look at a tyrosine kinase. Nature 372 726–727. [DOI] [PubMed] [Google Scholar]
- ———. 1995. Protein-tyrosine kinases: Getting down to specifics. Nature 373 477–478. [DOI] [PubMed] [Google Scholar]
- Posner, I., Engel, M., and Levitzki, A. 1992. Kinetic model of the epidermal growth factor (EGF) receptor tyrosine kinase and a possible mechanism of its activation by EGF. J. Biol. Chem. 267 20638–20647. [PubMed] [Google Scholar]
- Posner, I., Engel, M., Gazit, A., and Levitzki, A. 1994. Kinetics of inhibition by tyrphostins of the tyrosine kinase activity of the epidermal growth factor receptor and analysis by a new computer program. Mol. Pharmacol. 45 673–683. [PubMed] [Google Scholar]
- Schlessinger, J. 2000. Cell signaling by receptor tyrosine kinases. Cell 103 211–225. [DOI] [PubMed] [Google Scholar]
- ———. 2002. Ligand-induced, receptor-mediated dimerization and activation of EGF receptor. Cell 110 669–672. [DOI] [PubMed] [Google Scholar]
- Stamos, J., Sliwkowski, M.X., and Eigenbrot, C. 2002. Structure of the epidermal growth factor receptor kinase domain alone and in complex with a 4-anilinoquinazoline inhibitor. J. Biol. Chem. 277 46265–46272. [DOI] [PubMed] [Google Scholar]
- Walton, G.M., Chen, W.S., Rosenfeld, M.G., and Gill, G.N. 1990. Analysis of deletions of the carboxyl terminus of the epidermal growth factor receptor reveals self-phosphorylation at tyrosine 992 and enhanced in vivo tyrosine phosphorylation of cell substrates. J. Biol. Chem. 265 1750–1754. [PubMed] [Google Scholar]
- Wedegaertner, P.B. and Gill, G.N. 1992. Effect of carboxyl terminal truncation on the tyrosine kinase activity of the epidermal growth factor receptor. Arch. Biochem. Biophys. 292 273–280. [DOI] [PubMed] [Google Scholar]
- Wood, E.R., Truesdale, A.T., McDonald, O.B., Yuan, D., Hassell, A., Dickerson, S.H., Ellis, B., Pennisi, C., Horne, E., Lackey, K., et al. 2004. A unique structure for epidermal growth factor receptor bound to GW572016 (Lapatinib): Relationships among protein conformation, inhibitor off-rate, and receptor activity in tumor cells. Cancer Res. 64 6652–6659. [DOI] [PubMed] [Google Scholar]
- Yu, X., Sharma, K.D., Takahashi, T., Iwamoto, R., and Mekada, E. 2002. Ligand-independent dimer formation of epidermal growth factor receptor (EGFR) is a step separable from ligand-induced EGFR signaling. Mol. Biol. Cell 13 2547–2557. [DOI] [PMC free article] [PubMed] [Google Scholar]