

Abstract
The solution structure of murine γS-crystallin (γS) has been determined by multidimensional triple resonance NMR spectroscopy, using restraints derived from two sets of dipolar couplings, recorded in different alignment media, and supplemented by a small number of NOE distance restraints. γS consists of two topologically similar domains, arranged with an approximate twofold symmetry, and each domain shows close structural homology to closely related (~50% sequence identity) domains found in other members of the γ-crystallin family. Each domain consists of two four-strand “Greek key” β-sheets. Although the domains are tightly anchored to one another by the hydrophobic surfaces of the two inner Greek key motifs, the N-arm, the interdomain linker and several turn regions show unexpected flexibility and disorder in solution. This may contribute entropic stabilization to the protein in solution, but may also indicate nucleation sites for unfolding or other structural transitions. The method used for solving the γS structure relies on the recently introduced molecular fragment replacement method, which capitalizes on the large database of protein structures previously solved by X-ray crystallography and NMR.
Keywords: alignment, deuteration, liquid crystal, Pf1, relaxation, RDC, residual dipolar coupling, structural proteins, NMR spectroscopy, heteronuclear NMR, new methods, database mining
Crystallins are the highly abundant soluble proteins of the eye lens, and are major contributors to its refractive index (Wistow and Piatigorsky 1988; Bloemendal et al. 2004). With no turnover, they must remain stable and soluble at high concentrations for the whole life of the organism. Three major classes make up most of the crystallins in mammals. The α-crystallins are members of the small heat-shock protein superfamily (Dejong et al. 1993). The β- and γ-crystallins are evolutionarily related; the βγ-crystallin superfamily also includes nonlens members in both prokaryotes and eukaryotes (Lubsen et al. 1988; Wistow 1995; Ray et al. 1997). The γ-crystallins seem to be particularly adapted for the highest concentration, central regions of the lens. However, one member of the family, γS-crystallin, is also expressed at high levels in cortical regions of the lens and even in epithelial cells (Wang et al. 2004). γS is one of the most abundantly expressed proteins of the adult lens, and it is highly conserved in evolution (Sinha et al. 1998; Wistow et al. 2002, 2005). A destabilizing F9S mutation in mouse γS leads to the Opj cataract in which the protein unfolds and forms plaques, severely disrupting the cells of the lens cortex (Sinha et al. 2001).
Several structures of members of the β- and γ-crystallin family previously have been solved by X-ray crystallography (Kumaraswamy et al. 1996; Norledge et al. 1997; Basak et al. 1998, 2003). They all display two structurally similar domains held together by hydrophobic interdomain interactions. Homology models based on these structures indicate that γS shares the two-domain pairing topology, but yet might differ significantly due to differences in amino acid sequence at the domain interface (Zarina et al. 1994). Despite extensive efforts, crystallization of full-length murine γS has remained elusive, which raises the question of intra- or interdomain flexibility. Interestingly, the C-terminal domains of both human and bovine γS have been crystallized, and their structures reveal remarkable homo-dimeric patterns, with two individual molecules arranged in a manner similar to the N- and C-terminal domains in other members of the γ-crystallin family (Basak et al. 1998; Purkiss et al. 2002).
In order to gain insight in potential differences between γS and its γ-crystallin family members, we have determined the solution structure of full-length murine γS by NMR spectroscopy. In order to evaluate recently developed technology, we did not follow the conventional NMR approach, which requires extensive analysis of NOE-based experiments for obtaining a sufficiently large number of distance restraints (Wüthrich 1986; Clore and Gronenborn 1989; Wagner 1993). Instead, we utilized the recently introduced molecular fragment replacement (MFR) method (Delaglio et al. 2000; Kontaxis et al. 2005), which is largely based on measurement of residual dipolar couplings (RDCs), measured under weakly aligning conditions (Tjandra and Bax 1997; Clore et al. 1998; Hansen et al. 1998; Prestegard et al. 2000). The present study represents the first application of this technology to a protein not previously solved by other methods. Also, the extensive presence of β-strands, turns, and loops presents a challenging test to the MFR technology, which previously has been shown to be best suited for proteins rich in α-helix. In our study, RDCs are measured in two different alignment media and supplemented by a modest number of backbone HN–HN and methyl–methyl NOEs. RDCs are directly related to the orientation of the corresponding internuclear vectors relative to the molecular alignment tensor. Together with HN–HN NOEs, they contain sufficient information to determine the backbone structure of the N- and C-terminal domains of γS at relatively high precision and accuracy, as well as their relative orientation. However, interdomain methyl–methyl NOEs are found to be essential for determining the relative position of the two domains.
Weak alignment of the protein is a prerequisite for measurement of RDCs and can be obtained by dissolving the protein in an anisotropic aqueous medium, with the anisotropy caused by a small volume fraction of particles that orient in a liquid crystalline manner relative to the magnetic field. Phospholipid bicelles (Sanders and Schwonek 1992; Tjandra and Bax 1997), filamentous phage (Clore et al. 1998; Hansen et al. 1998), or polyethyleneglycol analogs (Ruckert and Otting 2000) are commonly used for this purpose. More recently, strained hydrogels (Sass et al. 2000; Tycko et al. 2000; Chou et al. 2001; Ishii et al. 2001; Meier et al. 2002; Ulmer et al. 2003) have been added to this arsenal, and have proven to be particularly robust for aligning macromolecules that are incompatible with any of the common liquid crystalline alignment media (Chou et al. 2002; Cierpicki and Bushweller 2004). For our study of γS, both a stretched hydrogel and an unstrained hydrogel containing 3 mg/mL Pf1 were used to yield two separate alignment tensors. Measurement of RDCs under two different alignment conditions often greatly reduces the orientational degeneracy associated with dipolar couplings measured in a single medium (Ramirez and Bax 1998; Al-Hashimi et al. 2000).
To date, dipolar couplings have been mainly used for refining structures obtained with the conventional, NOE-based approach (Drohat et al. 1999; Kuszewski et al. 2001; Tugarinov and Kay 2003) or modeled on the basis of X-ray crystallographic data of homologous proteins (Chou et al. 2000b). Direct calculation of a structure from dipolar couplings, although feasible in favorable cases (Brenneman and Cross 1990; Andrec et al. 2001; Hus et al. 2001), has proven difficult, particularly when data are incomplete. Structural information contained in the chemical shifts often provides approximate information about the backbone torsion angles of a given residue (Cornilescu et al. 1999; Wishart and Case 2001) and can complement the RDC information. Unfortunately, for proteins rich in the β-sheet, where the structural degeneracy when interpreting dipolar couplings is often most severe, the chemical shift information is often less discriminating than for helical proteins.
MFR is a conceptually rather different approach to structure determination compared to the conventional, NOE-based method. It mimics the substructure approach of Thirup and Jones (Jones and Thirup 1986), widely used in X-ray crystallography, but utilizes a much larger database of model structures. MFR relies on a search of a large fraction of the Protein Data Bank (RCSB) (Berman et al. 2000) for protein backbone fragments that are structurally compatible with RDCs measured for any given fragment in the protein of interest, and at the same time have predicted chemical shifts that roughly agree with those observed experimentally (Kontaxis et al. 2005). Although for small systems and with relatively complete sets of dipolar couplings, such data suffice to assemble complete proteins, occasional errors can result in translation of different elements of the structure relative to one another (Kontaxis et al. 2005). For this reason, we here use a hybrid approach, which relies primarily on MFR for building of the protein backbone, but also uses a modest set of NOEs to prevent such translational errors. No HN–HN NOE interactions are observed between the N- and C-terminal domains, and the increased dynamics in the interdomain linker precludes accurate definition of this region of the structure. Therefore, one-bond RDCs cannot accurately position the residues following this flexible section relative to the N-terminal domain. To solve this problem, we resort to the measurement of CH3–CH3 NOEs, and only very few such interactions suffice to determine the relative position of the two domains, when the orientation of each domain is already uniquely defined by RDCs.
Results
This study represents the first application of the MFR approach based on measured residual dipolar couplings to the determination of a new structure. We therefore briefly describe the novel aspects of this approach at a qualitative level, with more details presented in Materials and Methods.
Selection of alignment media for γS
Imposing the required degree of weak alignment (~10−3) on the protein for facile NMR measurement of dipolar couplings proved challenging for γS. As a result of electrostatic interaction between γS and Pf1, initial attempts to align γS in regular Pf1 medium (Hansen et al. 1998) resulted in protein alignment that was too strong for permitting the measurement of RDCs in the usual fashion under conditions where Pf1 orients in a liquid crystalline manner. At the ionic strength (120 mM) required for monomeric behavior of γS, Pf1 loses liquid crystalline behavior below ~10 mg/mL, resulting in much weaker, field-dependent alignment of Pf1 and thereby of the protein (Zweckstetter and Bax 2001). In contrast, if a liquid crystalline, low ionic strength, dilute Pf1 sample is first “frozen” in its oriented state while inside a strong magnetic field, by initiation of acrylamide gel polymerization, γS at the desired ionic strength can subsequently be diffused into such an oriented sample. Alignment of γS in such a gelled Pf1 sample was found to be independent of magnetic field strength and remained constant for the entire duration over which the various spectra were recorded.
Four sets of one-bond dipolar couplings—1DHN, 1DNC′, 1DCαCβ, and 1DCαC′ —were measured for perdeuterated γS in each of two alignment media: 3 mg/ mL gelled Pf1, prepared in the manner above (see also Materials and Methods), and 6% (w/v), stretched poly-acrylamide gel.
The above used alignment conditions were close to optimal for perdeuterated γS, but alignment was found to be too strong for measurement of 1DCαHα couplings in a protonated form of the protein. Strong alignment results in large homonuclear 1H-1H couplings, especially for sequential Hα-HN interactions in β-strands, which as a result show severe broadening, increased overlap, and weaker 1H resonances. Furthermore, under the strong alignment conditions many 1DCαHα couplings exceed 50 Hz, and thereby adversely affect the uniformity in efficiency of the magnetization transfer steps. Therefore, a second set of samples with weaker alignment was generated for measurement of 1DCαHα couplings (see Experimental section). Although these couplings were of lower accuracy and found to be superfluous in the structure determination process, they provide a useful set of data to validate the correctness of the derived structures.
Experimental restraints used for γS structure determination
The solution structure of γS was determined using a total of 1709 experimental restraints, including 1376 RDCs (Table 1). Out of 170 nonproline residues, 158 yielded detectable 1H-15N HSQC correlations; conformational exchange on an intermediate timescale resulted in the disappearance of Y59 in the N-terminal domain, and K130, V131, T135, W136, and K152–Y156 in the C-terminal domain. The two N-terminal residues were unobservable due to rapid amide hydrogen exchange with solvent. 15N relaxation rates indicated an effective rotational correlation time of ~14 nsec at a concentration of 1 mM, resulting in relatively short transverse relaxation times and broad lines. Spectral quality was enhanced by perdeuteration of the protein, thereby also favoring the use of TROSY-based triple resonance experiments for backbone assignments (Salzmann et al. 1999). Backbone HN–HN NOEs in such a perdeuterated protein yield much improved sensitivity compared to such interactions in fully protonated proteins (Torchia et al. 1988). A total of 181 such interactions was obtained from a spectrum recorded with a relatively long mixing time of 120 msec. No HN–HN NOEs between the N- and C-terminal domains were detected however, and with uncertainty remaining regarding the precise translation of the N- versus the C-terminal domain, we found it necessary to also record a 13CH3–13CH3 3D NOE spectrum (Zwahlen et al. 1998a). The side-chain χ1 angles for most of the hydrophobic core residues and a smaller fraction of the surface-exposed residues were defined uniquely by 3JNCγ and 3JC′Cγ couplings.
Table 1.
Restraints used during γS structure calculation and agreement with final structures
| RMSD from experimental distance restraints (Å) | |
| HN-HN (181) | 0.041 ± 0.003 |
| CH3-CH3 (70) | 0.027 ± 0.003 |
| RMSD from χ1 (71) and χ2 (11) anglesa | 0 |
| RMSD from residual dipolar couplings (Hz) | |
| 1DNH (gelled pf1) (144) | 1.22 ± 0.03 |
| 1DCαC′ (gelled pf1) (150) | 0.81 ± 0.02 |
| 1DCαCβ (gelled pf1) (111) | 0.63 ± 0.02 |
| 1DNC′ (gelled pf1) (134) | 0.47 ± 0.03 |
| 1DNH (stretched gel) (147) | 1.11 ± 0.04 |
| 1DCαC′ (stretched gel) (153) | 0.66 ± 0.03 |
| 1DCαCβ (stretched gel) (135) | 0.59 ± 0.02 |
| 1DNC′ (stretched gel) (139) | 0.36 ± 0.02 |
a Torsion angles were defined as the ideal rotameric state, selected on the basis of 3JCγN and/or 3JCγC′ data (χ1) or 3JCγCδ (χ2), with tolerances of either ±30 ° or ±60 °.
Use of Protein Data Bank for NMR structure determination
As an individual dipolar coupling is compatible with multiple discrete orientations of the corresponding internuclear vector, deriving protein structures exclusively from dipolar couplings often presents a difficult multiple minima problem (Bax 2003). Instead, dipolar couplings are often used to refine models that are already reasonably close to the true structure. Commonly, such a starting model is obtained from a large number of NOE distance restraints, collection of which is often the time-limiting step in NMR structure determination. Alternatively, different procedures may be used to obtain the starting model. For example, the RCSB Protein Data Bank may be searched for proteins that fit the experimentally measured couplings (Annila et al. 1999). In practice, insertions and deletions between the protein of interest and the database protein often thwart such searches, even if they have very similar structures. So, this type of search is then most useful to evaluate how similar or dissimilar two homologous proteins are when the structure of one of these is known, and insertions or deletions can be accounted for. The case of γS and γB-crystallin, discussed above, is just one example of a pair of proteins whose backbone folds are proven to be similar on the basis of dipolar couplings. The structure of interest (γS) can then be refined by using a structure based on the homologous protein (γB-crystallin) as a starting structure, thereby alleviating the above-mentioned multiple minima problem (Chou et al. 2000b). As a note of caution, we mention that care must be taken when using the homology model rather than data derived from the original structure itself during the refinement process. For example, minor backbone rearrangements in the homology model, relative to the original experimental structure in the database, frequently result in a much poorer fit between experimental RDCs and the homology model than does fitting of the RDCs to corresponding residues in the experimental database structure. This problem can be mitigated by imposing torsion angle restraints on the homology model that, at least in early iterations, harmonically restrain its backbone torsion angles to the values found in the database structure while, for example, restraining the backbone Cα atoms to remain harmonically tied to their positions in the original homology model. Although such an approach is relatively straightforward for cases where an adequate homology model can be found, the method would not permit determination of a new protein fold. The latter is possible when using the same strategy described above for the homologous proteins, but applying it to small (typically 7–10 residues) fragments. Below, we illustrate this so-called MFR approach for the case of γS.
MFR selection of backbone fragments
In the MFR approach, the 177-residue sequence of γS is considered in terms of 171 overlapping seven-residue segments. For each seven-residue segment, a database containing about 800 nonhomologous, high-resolution crystal structures is searched for seven-residue fragments that are compatible with the backbone RDCs measured in the target segment. Full details of adjustable parameters and options for optimization of the MFR search have been provided previously (Kontaxis et al. 2005), and only a brief discussion of this procedure is presented here.
Although the entire database contains over 200,000 of these seven-residue fragments, the evaluation of whether a fragment is compatible with the experimental dipolar couplings is a linear problem that can be solved exceedingly rapidly by singular value decomposition or SVD (Losonczi et al. 1999; Sass et al. 1999), permitting the full database to be searched in a matter of minutes. Typically, the 10 fragments that best fit to the experimental RDCs are retained at the end of this search. In this first round of fragment searching, no prior knowledge about the alignment tensors, applicable for the two media, is used. However, prior to a second search, this alignment information is available from the results of the first search: The magnitudes and relative orientation of the corresponding alignment tensors are extracted from these search results, using a weighting factor that scales exponentially with the inverse of the backbone RMSD of the 10 best-fitting fragments. The magnitude, rhombicity, and relative orientation of the thus-obtained alignment tensors, together with their automatically derived uncertainties, are presented in Table 2. When separating the results obtained for fragments taken from the N- and C-terminal domains, the difference in alignment parameters is not statistically significant, already strongly suggesting that the two domains are rigidly anchored to one another.
Table 2.
Alignment tensor parameters estimated from the initial MFR search
| N-terminal domain | |
| DaNH (Pf1) (Hz) | 15.3 ± 0.3 |
| Rhombicity (Pf1) | 0.61 ± 0.02 |
| DaNH (gel) (Hz) | −11.4 ± 0.2 |
| Rhombicity (gel) | 0.38 ± 0.02 |
| Pf1 orientation versus gel (x,y,z Euler angles, degree) | 88 ± 2; 11 ± 2; 103 ± 3 |
| C-terminal domain | |
| DaNH (Pf1) (Hz) | 15.5 ± 0.4 |
| Rhombicity (Pf1) | 0.66 ± 0.03 |
| DaNH (gel) (Hz) | −11.5 ± 0.2 |
| Rhombicity (gel) | 0.42 ± 0.03 |
| Pf1 orientation vs. gel (x,y,z Euler angles, degree) | 88 ± 4; 13 ± 4; 102 ± 4 |
Due to the presence of “structural noise” in the database fragments, SVD fitting of the experimental RDCs to these fragments results in a small, systematic underestimate of the magnitude, DaNH, but not the rhombicity of the alignment tensor (Zweckstetter and Bax 2002).
In a second round, the same database is searched for fragments that simultaneously can be fit satisfactorily to the dipolar couplings measured in both alignment media, while constraining the magnitudes and relative orientation of the alignment tensors to the above determined values. A regular SVD fit of a fragment to dipolar couplings involves five adjustable parameters per tensor, corresponding to 10 variables when considering the fits to two sets of RDCs, acquired in different alignment media. However, in this second round only three variables remain, describing the orientation of one of the alignment tensors relative to the database fragment. Orientation of the fragment relative to the second alignment tensor is implicitly contained in the known relative orientation of the two alignment tensors. Therefore, with only three adjustable parameters and twice the number of experimental data, this second round of searching is more discriminating than the first, and decreases the number of “false hits.” The second round of searching requires use of a nonlinear algorithm, and therefore, is slower than the SVD routine. However, as the search only includes three variables instead of 10 if the search were unrestrained, such a search can be completed for the full protein in an overnight run on a regular PC. Figure 1, A and B ▶, compares the backbone angles resulting from the first round of SVD fitting for the fragments encompassing residues W46–F54, with those obtained for the second round. As can be seen from comparing the results shown in Figure 1, A and B ▶, the number of false hits (e.g., for E50) decreases while the spread in torsion angles also becomes smaller. A comparison for the full protein is available as Supplemental Material.
Figure 1.

Results from MFR search. Backbone torsion angles of database fragments that yield best fits to RDCs are displayed in a Ramachandran map format. Lines connect pairs of torsion angles in any given fragment. Only torsion angles for the center five residues (out of seven) are displayed for each fragment. Gray regions in the Ramachandran maps correspond to populated regions in φ/ψ space for the corresponding residue when searching a database of high-resolution X-ray structures. (A) Result of MFR search using SVD, with unconstrained alignment parameters. (B) Result of MFR search, using constrained magnitude and relative orientation of the two alignment tensors (cf. Table 2). (C) Accepted fragments, after simulated annealing refinement, that fit to the experimental data with an RMSD <1.5 Hz.
Further improvement of the selected fragments can be obtained by refining each of the top 10 best-fitting database fragments against the experimental dipolar couplings, using a brief simulated annealing protocol. To avoid fragments from jumping to a radically different conformation, weak harmonic angular restraints as well as weak backbone N, Cα and C′ coordinate restraints are used during this process in order to ensure that the refined fragment remains close to the starting fragment. Nevertheless, this refinement procedure often is very revealing since minor adjustment in backbone torsion angles can dramatically improve the fit in cases where the starting fragment is close to the true structure. In contrast, the improvement tends to be much smaller for incorrect fragments that, by chance, yield a better-than-random fit to the experimental couplings in the MFR search. Figure 1C ▶ shows the considerably tighter definition of φ/ψ angles obtained after the refinement.
Calculation of the protein structure
Previously, for relatively small model systems without extensive stretches in the protein for which structural information is missing, assembly of the protein backbone proceeded sequentially: Successive fragments were assembled in a stepwise manner by superimposing overlapping segments of the above selected fragments (Kontaxis et al. 2005). Accumulation of errors and the problem in bridging regions of ill-defined structure pose considerable challenges, however. Instead, here we use a minor variation to the regular NOE-based NMR protocol, starting from a single extended chain, and apply a three-stage simulated annealing scheme. In the first stage, with van der Waals radii scaled to zero, the NOE data are used together with tight backbone torsion restraints (300 kcal/rad2), extracted from the collection of refined MFR fragments. Note that the MFR results provide very tight and comprehensive torsion restraints; in this case 90% of the torsions (318 torsion angles) exhibit RMS uncertainties of < ~7 °. No unique angles could be defined for the N-terminal five residues, flexible residues in the interdomain linker region, and several of the above-mentioned sequential residues for which no amide signals were observable as a result of conformational exchange.
In the second stage, the dipolar couplings are reintroduced, and side-chain χ1 and χ2 restraints, obtained from 3JNCγ, 3JC′Cγ, and 3JCαCγ measurements, are added. In a subsequent, relatively long (100,000 time steps) third stage of simulated annealing, a hydrogen-bond potential of mean force (HB-PMF) is added as an empirical energy term (Grishaev and Bax 2004). The entire protocol is summarized in the flow chart of Figure 2 ▶. The HB-PMF automatically recognizes hydrogen bonds, provided that the starting structure is sufficiently close to the true structure. Indeed, for the N-terminal domain, all but one (R30O–L33HN) of the backbone–backbone hydrogen bonds seen in homologous crystal structures have also formed at the end of the final simulated annealing run. One additional H-bond (N37O–Y69HN) is present in 18 out of the 20 NMR structures but involves a water-mediated H-bond in the X-ray structure of γB-crystallin. In the absence of explicit waters in the NMR structure calculation, such a water-mediated H-bond cannot be detected with our approach, and the weak H-bond seen in most of the NMR structures is likely to also be indirect. For the C-terminal domain, the absence of amide resonances for two stretches of residues resulted in considerably lower resolution for the starting structure, and ~20% of the H-bonds seen in homologous crystal structures are not automatically recognized by the HB-PMF module. Interestingly, if H-bond restraints modeled on the basis of the γB X-ray structures are included as distance restraints during the final stage of simulated annealing, all other restraints are satisfied equally well as without these modeled restraints (Supplemental Material). This suggests that the H-bond network seen in the C-terminal domain of crystallin family members also prevails in solution, and that the missing H-bonds in the solution NMR structure result from the lack of experimental data, caused by conformational exchange broadening.
Figure 2.

Flow diagram of the procedure used for determination of the γS structure. Selection of backbone–backbone H-bonds after initial rounds of simulated annealing can either be done manually and then converted to pairwise distance restraints in the usual manner (a), or a H-bond potential of mean force (Grishaev and Bax 2004) can be used (b), which automatically detects and optimizes H-bonding, or both can be used simultaneously (c). Mode b was used in this work, with results from mode c reported in the Supplemental Material.
Structure of the individual domains
The N- and C-terminal domains of γS are topologically similar, and are connected by a six-residue linker. 15N relaxation data indicate that this linker, consisting of residues S88–A93, is subject to relatively large amplitude rapid internal dynamics, with the generalized order parameter (Lipari and Szabo 1982) S2 < 0.3 near its midpoint (Fig. 3 ▶). Considering the significant sequence identity (31%) between the N- and C-terminal halves of the protein and the lack of backbone–backbone NOE contacts between them, the two domains are clearly autonomous units that can be described separately. Each domain consists of two four-stranded Greek key β-sheets (Fig. 4 ▶), forming a wedge with a relative angle of ~45 ° between them, similar to what is seen in all other β- and γ-crystallins. Starting from G5, strand β1 (G5–Y10) is flanked by two anti-parallel strands β2 (R18–C22) and β4 (S37–G43). Strand β3 (D25–D28) arches away from the first sheet and crosses over to become the edge strand of the second sheet, where it pairs with β8 (G80–V84). Strand β3 is quite short with a bulge in the middle and only involves three hydrogen bonds (C26-HN–C82-O, C82-HN–C26-O, G80-O–F29-HN), and is therefore not recognized as a β-strand by the program Molmol (Koradi et al. 1996). Strand β4 pairs up with edge strand β7 (G64–P67), whereas the second sheet is completed by β5 (T45–E50) and β6 (H57–P62) (Fig. 4 ▶). The segment between β2 and β3 contains a conserved “DCDCDC” sequence, which is capable of forming intermolecular disulfide bonds (Skouri-Panet et al. 2001), and which appears to be specifically protected by S-methylation (Lapko et al. 2002). In the present study, a reducing environment is maintained by the presence of dithiotreitol, preventing γS oligomerization.
Figure 3.

Rigidity of the backbone of γS, expressed in terms of the generalized order parameter S2. The value of S2 can range from 1 (perfectly rigid) to 0 (completely disordered), and reflects mobility on a timescale faster than the overall rotational tumbling of the molecule (10−8 sec). S2 values have been derived from 15N NMR relaxation measurements at 600 MHz 1H frequency in the standard manner using the program TENSOR2 (Dosset et al. 2000), and individual relaxation rates are presented in the Supplemental Material.
Figure 4.
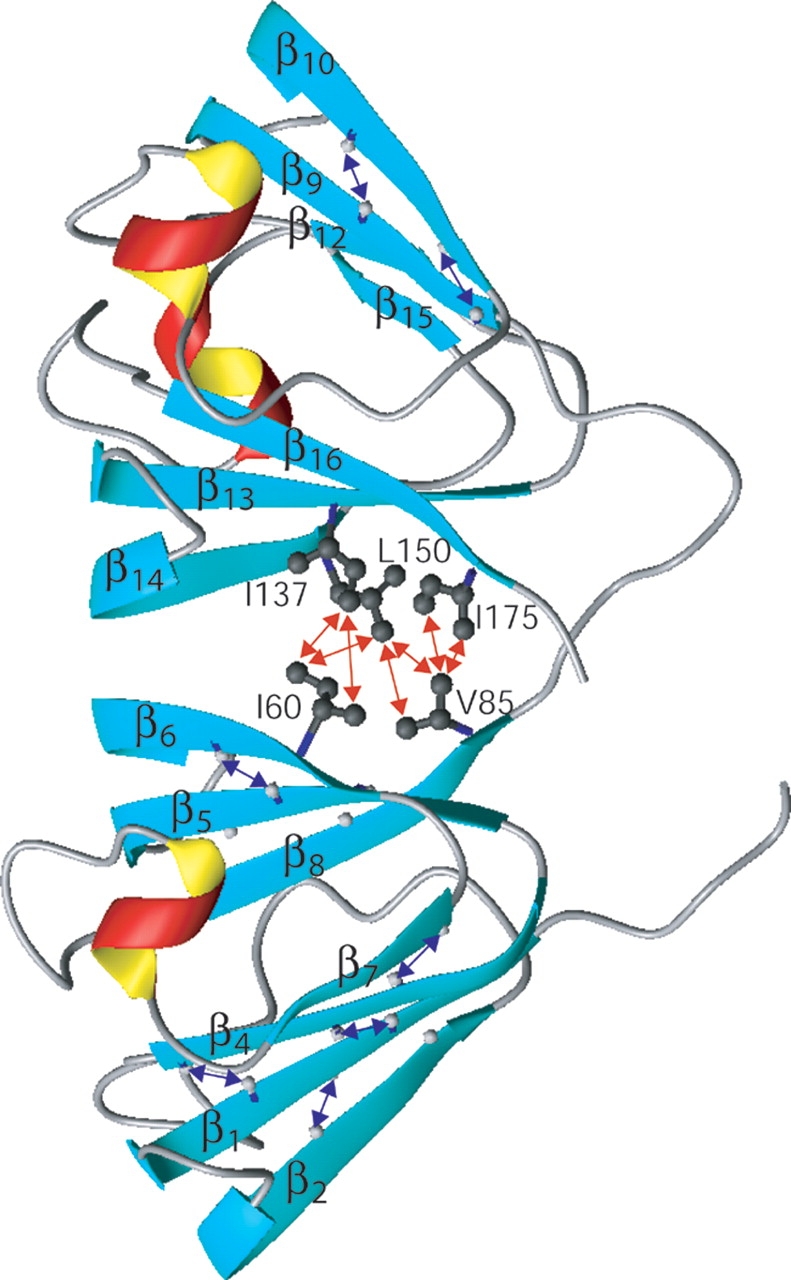
Ribbon diagram of the NMR structure of γS. Methyl-methyl NOEs at the domain interface are marked by red arrows. A subset of the long-range HN-HN NOEs is marked by blue arrows. Figure was prepared with the program Molmol (Koradi et al. 1996).
The β5/β6 pair exhibits a pronounced kink of ~90 ° at R51 and G56, resulting in a structural motif that, although also found in most other γ-crystallins, is relatively unusual in the Protein Data Bank. For example, no similar motif is found in any of the 80 structures that form the basis for the TALOS program (Cornilescu et al. 1999), which erroneously interprets the Y49–R51 chemical shifts as indicative of extended, β-sheet-like backbone angles for E50. However, all low-energy, refined fragments have E50 backbone torsion angles that cluster in the helical region of φ/ψ space (Fig. 1C ▶), similar to what is seen in the X-ray structure of γB-crystallin (Kumaraswamy et al. 1996). Interestingly, E50 is the last residue that interacts with both β6 and β8 simultaneously. The amide signal of M58 in strand β6 is very weak, and the 1H-15N correlation of Y59 is completely absent, indicative of a conformational exchange process on the μsec–msec timescale. Nevertheless, owing to the overlapping nature of segments in the MFR search, the backbone conformation of these residues remains well defined by dipolar couplings from the flanking residues.
The linker between β6 and β7 (L61–Y66) forms a motif known as the Δ5 “tyrosine corner” (Hemmingsen et al. 1994). In this motif, the Tyr residue adopts a −60 ° χ1 angle, pointing its ring toward the preceding residues, confirmed in the present study by a small (<0.5 Hz) 3JNCγ value. The presence of such a tyrosine corner is often seen in the connection between two Greek-key β-sheets, and has been proposed to play an important role in stabilizing a Greek key over a hairpin connection (Hemmingsen et al. 1994). A similar inter-Greek-key motif (V41–W46) is also located between strands β4 and β5. In this case, W46 replaces the Tyr, and again adopts a −60 ° χ1 angle (3JC′Cγ = 4.3 Hz), allowing formation of a H-bond from its Nɛ1 to the carbonyl of G43, and hydrophobic packing against V41.
The C-terminal domain closely resembles its N-terminal counterpart, reflecting the evolutionary history of successive gene duplications that characterizes the βγ-crystallin superfamily (Wistow et al. 2005). It also consists of two Greek-key β-sheets, connected by a Trp-corner. Compared to the β3–β4 linker in the N-terminal domain, the linker between homologous strands β11 and β12 contains two extra residues, allowing formation of a short 310-helix (I117–F121). Inter-Greek-key linkers between β7 and β8 and between β15 and β16 also adopt 310-helical structure, and these short helices partly cover the open ends of the wedge arrangement of each pair of Greek-key β-sheets. The amide signals of K130–V131, and T135–W136 are not observable, whereas others in this region are very weak, indicative again of the presence of conformational exchange on a μsec–msec timescale. Although the amide of W136 is not observable, a value of 3JC′Cγ = 4.9 Hz is measured for W136 via the amide of I137, indicating χ1 = −60 °. This is compatible with the same Trp-corner motif for V131–W136 as that found for the homologous region in the N-terminal domain (V41–W46). However, in the absence of more NMR data, this region remains ill-defined. N143 is located in the linker between β13 and β14, immediately adjacent to the interdomain interface. Deamidation of this Asn residue has been postulated to disturb the charge balance at the interface, and thereby contribute to cataract formation (Aswad et al. 2000).
The presence of conformational exchange in the region where a “tyrosine corner” is expected in the C-terminal domain (L151–Y156) on the basis of its homology to the N-terminal domain, makes it difficult to evaluate whether this motif is present in γS. Although the Tyr again adopts a −60 ° χ1 angle (3JC′Cγ = 3.8 Hz), the residue at the Y-2 position is Lys instead of the preferred Gly. The extended β-conformation (φ ≈+160 °, ψ ≈180 °), normally adopted by Gly in this position, is unfavorable for Lys. We speculate that the presence of Lys in this position destabilizes the Tyr corner, and may be responsible for the intermediate timescale conformational exchange in this region, which results in the absence of amide signals for residues D152–Y156. The calculated NMR structure suggests that the characteristic Tyr-corner Y156-Oη to D152-HN hydrogen bond is populated. Interestingly, the X-ray crystal structures of homodimers of the C-terminal domains of both human and bovine γS indicate the presence of a motif that is distinctly different, with the Y156-Oη hydrogen-bonding to K153–HN instead of D152–HN (Basak et al. 1998; Purkiss et al. 2002), a pattern incompatible with the average NMR structure.
Similar to its remotely related γA–F-crystallins, γS is made up of two structurally equivalent domains that pack against each other, mainly through hydrophobic side chains on the backside of the Greek key motifs 1 and 4. The two domains are arranged in a way similar to that seen in the homodimers of the C-terminal γS domain (Basak et al. 1998; Purkiss et al. 2002). In γS, numerous intermethyl NOE interactions (Fig. 4 ▶; Supplemental Material) indicate that hydrophobic interactions, between T45, A47, I60, and V85 in the N-terminal domain and T135, I137, L150, and V175 in the C-terminal domain, play an important role in stabilizing the two-domain structure. In the homodimeric crystal structure of the C-terminal domain, it is the latter set of residues that stabilizes interdomain contacts.
Validation of the structure
For structures refined with RDCs, a fraction of such couplings omitted from the refinement input is commonly used for validation purposes (Clore and Garrett 1999; Drohat et al. 1999), and allows for calculation of a quality factor, Q, in analogy to the free R-factor commonly used in X-ray crystallography. In the MFR approach, such cross-validation is less straightforward, as all couplings initially are used for fragment selection, and repeating the whole procedure from scratch, with a variable subset of dipolar couplings omitted, would be very time consuming. Instead, for validation purposes we here use a set of Cα-Hα RDCs that was not used in the MFR procedure. Although this set of couplings was measured under much weaker alignment conditions than the other RDCs, and consequently has larger experimental errors, these couplings are found to correlate well with those predicted by the structure (Pearson’s correlation coefficient, RP = 0.95; Q = 31%). For reference, the 1.8 Å X-ray structure of ubiquitin yields Q = 23% (Cornilescu et al. 1998).
In terms of Ramachandran statistics, the structures score remarkably high by NMR standards (Table 3), despite the fact that no database-derived potential of mean force (“rama” term in XPLOR-NIH) was used during structure refinement. Considering the small number of experimental observables used for defining side-chain conformation, mainly 3JCγN and 3JCγC′ for χ1, packing of the protein also is good by NMR standards, with only a moderate number of steric clashes reported by PROCHECK (Laskowski et al. 1993).
Table 3.
Characteristics of final γS NMR structures
| Coordinate precision (Å)a | |
| Backbone nonhydrogen atoms | |
| N-terminal backbone nonhydrogen atoms | 0.18 ± 0.04 |
| C-terminal backbone nonhydrogen atoms | 0.26 ± 0.10 |
| All backbone nonhydrogen atoms | 0.26 ± 0.07 |
| All nonhydrogen atoms | 0.83 ± 0.06 |
| Ramachandran φ,ψ distribution | |
| (Most favored/allowed/generous) (%)b | 89.7/9.7/0.6 |
| Steric clashes (per 100 residues)b | 2.0 ± 1.1 |
| Q(Cα–Hα) factor (%)c | 31.4 ± 1.1 |
a Note that for RDC-refined structures, the precision considerably underestimates the true uncertainty.
b As defined by the program PROCHECK (Laskowski et al. 1996).
c Average QCαHα factor calculated using 1DCαHα from measurements in gel and gelled Pf1 alignment media, using the normalization of Ottiger and Bax (1999). 1DCαHα were not used at any stage of the structure determination process due to their intrinsically higher experimental uncertainty; QCαHα therefore presents an upper limit for the true Q factor.
Discussion
The γS structure reported here is the first new protein structure to be determined largely by the MFR approach. However, for this protein rich in β-sheet, inclusion of a moderate number of relatively easily accessible HN–HN and CH3–CH3 NOEs is found to be most helpful. In particular, without the interdomain methyl–methyl NOEs the relative position of the N- and C-terminal domains remains undetermined, even though their relative orientation is tightly defined by the dipolar couplings. The individual domains of γS agree closely with the crystal structures (Table 4). In particular, the backbone RMSD of only 0.63 Å between the N-terminal domain of γS and γB-crystallin is among the lowest obtained when comparing previously solved NMR and X-ray structures for any protein, even in the absence of sequence differences. For the C-terminal domain, differences relative to γB-crystallin (1.09 Å) or relative to the crystal structure of the C-terminal domain of either bovine or human γS (1.07 Å) (Basak et al. 1998; Purkiss et al. 2002) is considerably higher, mainly resulting from the absence of several amide resonances from the NMR spectrum, which makes it impossible for the HB-PMF to identify the applicable hydrogen bonds. Absence of these H-bonds and other restraints in the corresponding regions of the structure results in substantial local uncertainty and increased differences relative to the X-ray structures. Interestingly, however, if the H-bonds observed in the homologous crystal structures are added as input restraints during the final stage of the structure calculation process, all experimental restraints are satisfied equally well as without these restraints, and agreement between the calculated structure and homologous X-ray structures drops to 0.75 Å (Supplemental Material).
Table 4.
Backbone RMSD (Å) of γS relative to previously solved structures
| γBa | γDb | γS-X ray (C-domain)c | |
| γS-NMR (N-domain) | 0.63 ± 0.05 | 0.70 ± 0.03 | — |
| γS-NMR (C-domain) | 1.09 ± 0.09 | 1.13 ± 0.08 | 1.07 ± 0.08 |
| γS-NMR (full) | 1.96 ± 0.07 | 1.89 ± 0.08 | — |
| γS-X ray (C-domain) | 0.54 | 0.61 | — |
Backbone coordinate RMSD for residues 6–85 and 94–175, relative to homologous residues 2–81 and 89–170 in γB, γD, and the C-terminal domain of homo-dimeric γS.
a PDB entry 1AMM (Kumaraswamy et al. 1996).
b PDB entry 1HK0 (Basak et al. 2003).
c PDB entry 1A7H (Basak et al. 1998).
Numerous X-ray crystal structures of γA–F-crystallin have been solved previously. Figure 5 ▶ compares our γS structure with the closest matches in the database, when superimposing the N-terminal domains. The interdomain angle differs somewhat between the γB and γD crystal structures, and considerably more when comparing γB with the X-ray structures of the homodimeric C-terminal domain of γS (Supplementary Fig. 7). Our γS structure adopts interdomain angles that are intermediate between those of the γB or γD structures, and those seen in the homodimeric C-domain of γS. However, unless the interdomain NOE restraints are artificially tightened (data not shown), the distance between the two domains remains considerably larger than in any of the crystal structures (Fig. 5 ▶). This is likely to be an artifact, caused by the poor packing at the interface, and the small number of interdomain NOEs. These NOEs represent the only relatively weak attractive forces between the two domains. The interdomain separation can also be decreased by adding a suitable “radius of gyration” term during the NMR refinement procedure (Kuszewski et al. 1999), at the expense of an increase in bad steric contacts (data not shown). However, in the absence of experimental information that the packing is tighter than shown in Figure 5 ▶, we feel that forcing the two domains together is not warranted. The homodimeric C-terminal domain of γS is found to be remarkably similar to the structure of the intact protein. This is compatible with the high degree of flexibility observed for residues 88–93 in the interdomain linker of γS (Fig. 3 ▶). Apparently, the linker merely serves to lower the entropic cost of a stable interaction between the N-and C-terminal domains, contributing little or nothing to the enthalpy.
Figure 5.
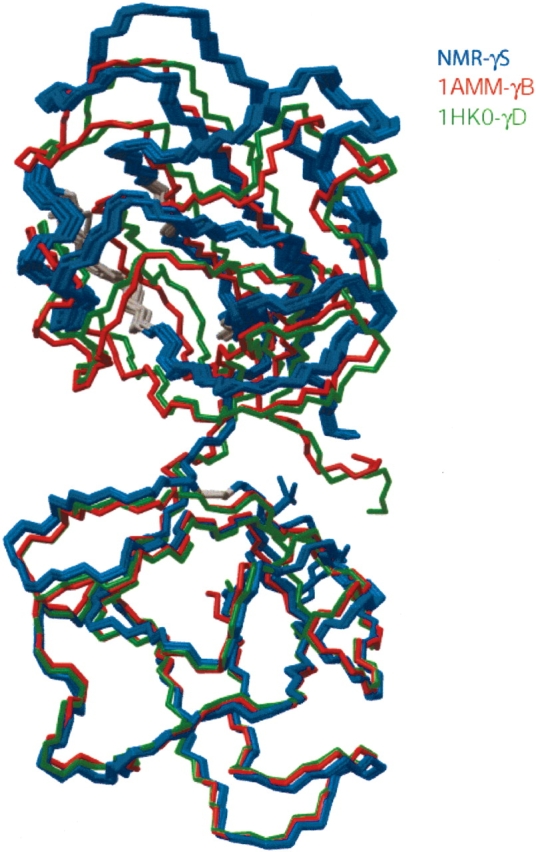
Backbone superposition of the 10 lowest energy γS NMR structures (blue), and the crystal structures of γB (red; PDB entry 1AMM) and γD (green; 1HK0). Superposition corresponds to a best fit for corresponding backbone atoms of the N-terminal domain (bottom of figure). Gray residues in the NMR structure correspond to those for which conformational exchange resulted in missing backbone amide signals. The increased distance between N- and C-terminal domains relative to the X-ray structures in all likelihood is an artifact resulting from insufficient interdomain NOEs.
Compared to its γ-crystallin homologs, γS has an extra four-residue segment at its N terminus. This is equivalent to the longer N-arms of β-crystallins and of the distantly related, one-domain protein spherulin 3a of the slime mold Physarum polycephalum (Rosinke et al. 1997). These segments are, at least in part, well ordered in X-ray structures. Although in γS the methyl of T3 exhibits a very weak NOE interaction to A84 CβH3, this interaction is most likely to be transient and the overall structure of this segment is poorly defined by the NMR data. Dynamic disorder for residues S1–G5 is supported by 15N relaxation measurements, which indicate rapid amide exchange for S1–K2 and strongly decreased 15N-{1H} heteronuclear NOE and transverse relaxation rates for T3–K5, resulting in low order parameters (Fig. 3 ▶). This indicates that the N-arm of γS is highly mobile, possibly contributing to the high solubility of the protein. If this is so, loss of the N-arm, perhaps with aging in the lens, could contribute to reduced solubility and possible aggregation.
Our results indicate that γS adopts a stable, two-domain structure, where the two domains are rigidly held together by hydrophobic interactions and, like the N-arm, the interdomain linker is highly dynamic. In X-ray structures of both γ- and β-crystallins, in which the interdomain linker can adopt very different conformations (bent in γ-crystallins, extended in β B2-crystallin (Bax et al. 1990), it is generally well ordered and clearly defined. However, the solution structure of γS suggests that these linker peptides in other members of the crystallin family may be quite mobile too.
Except for the N-arm and the linker region, the protein is generally well structured. The disappearance of amide resonances in the two linkers between the Greek-key β-sheets, which adopt a Trp-corner and variant of the Tyr-corner motif in the X-ray structure of the C-terminal γS domain, indicates conformational exchange on an intermediate timescale (μsec–msec) in this area. Unfortunately, the precise nature of this exchange process cannot be established from the available NMR data. Even after exchange of the protein into D2O solvent, many of the amide signals remain present for many weeks, both for residues in the N- and C-terminal domains (Supplemental Material), confirming that the protein is thermodynamically very stable.
The presence of conformational exchange on a μsec–msec timescale indicates that even the well-defined polypeptide backbone of both domains contains regions of considerable flexibility and movement. Since one of the most striking features about cataract formation is that normally well-folded proteins unfold and aggregate, producing light scattering centers, it is conceivable that these regions may be involved in relatively high barrier, first steps in such an unfolding cascade.
Materials and methods
Sample preparation
The DNA encoding γS was restricted with NdeI and HindIII, subcloned into the pET17b vector (Novagen) and transformed into Escherichia coli strain BL21(DE3)pLysS (Sinha et al. 2001). Starting with a single colony taken from a freshly streaked agar plate, a 5-mL LB medium was inoculated and subsequently grown to an OD600 of 0.8. Then a 25-mL minimal medium starter culture, containing 15N-NH4Cl and/or 13C-glucose as the sole sources of nitrogen and carbon, respectively, was inoculated with 500 μL of the above LB culture and grown until the OD600 reached 1.0. Next, 1 L of minimal medium containing 15N-NH4Cl and/or 13C-glucose was inoculated with 10 mL of the starter culture. The culture was incubated at 37 °C in a rotating shaker to an OD600 of 0.7, at which point protein expression was induced by addition of IPTG to a final concentration of 1 mM. The cells were harvested after 16 h by pelleting at 3500g for 25 min. Details regarding the purification procedure are described by Sinha et al. (2001). In the case of deuterated protein, D2O was used in the minimal medium instead of H2O, but protonated 13C-glucose was used. Isotropic NMR samples consisted of 0.3–1.5 mM γS, 25 mM imidazole (pH 6.0), 10 mM KCl, and 0.04% NaN3 (92% H2O/8% D2O), in 270-μL thin-wall Shigemi microcells.
NMR spectroscopy
All NMR experiments were carried out at 25 °C on Bruker DMX500 and DRX600 spectrometers, equipped with single-axis gradient, triple-resonance cryogenic probes, and DMX600 and DRX800 spectrometers equipped with self-shielded, three-axis gradient, triple resonance probes. Sequential backbone assignments were obtained from HNCA and HNCOCA, HNCO, CBCACONH, and CBCANH experiments, and aliphatic side-chain 13C and 1H were assigned from 3D 13C-edited HCCH-TOCSY (Bax and Grzesiek 1993). HN–HN interproton distance restraints were determined from 3D 15N-separated NOESY (120 msec mixing) recorded on perdeuterated 15N-labeled γS, and methyl–methyl interactions from 3D 13C-edited NOESY (120 msec) (Zwahlen et al. 1998b) on 15N/13C protein. Side-chain χ1 angles for aromatic and Cγ-methyl carrying residues were determined from 3JC′Cγ and 3JNCγ, measured by quantitative J correlation experiments (Grzesiek et al. 1993; Vuister et al. 1993; Hu et al. 1997), as well as 2D {13Cγ} spin-echo difference experiments (Hu and Bax 1997). All NMR data were processed with NMRPipe software (Delaglio et al. 1995) and analyzed with NMRView (Johnson and Blevins 1994) and NMRDraw (Delaglio et al. 1995).
HN–HN distances were calibrated according to the average HN–HN distance of 2.9 ± 0.2 Å for the following interactions in anti-parallel β-sheet: 7/22, 9/20, 8/40, 10/38, 41/64, 47/83, 49/ 81, and 26/82, using an empirical 1/r4 dependence of the intensity, which to a first approximation accounts for the effects of spin diffusion (Güntert et al. 1991). A 0.5 Å tolerance was added to both upper and lower bounds for the distances derived in this manner. Methyl–methyl distance restraints were obtained from a 3D 13C-edited NOESY spectrum in a similar manner, but using the intermethyl distance of 2.5 Å between two geminal methyl carbons in Leu and Val residues, with an error margin of −0.8 and +0.5 Å, respectively, for the lower limit and upper limit of the derived distance restraint.
RDCs were measured in several alignment media: axially stretched uncharged polyacrylamide gel, as well as filamentous Pf1, aligned either magnetically, or by stabilizing its orientation in a gel matrix. The stretched gel sample was prepared by soaking a premade gel (6% [w/v]), originally cast with a diameter of 5.4 mm, in the γS protein solution for 24 h, followed by radial compression using a funnel-type device to insert it into an open-ended NMR tube with an inner diameter of 4.2 mm (Chou et al. 2001). Experiments were collected within a 2-wk period, before any significant changes were noticeable in the protein’s alignment strength. Two filamentous Pf1 samples were prepared, each containing 3 mg/mL Pf1 phage. One such Pf1 sample was originally at very low ionic strength, with no added γS, but in the presence of 5% w/v acrylamide/bisacrylamide (40:1 molar ratio), whose polymerization was initiated in the standard manner immediately prior to insertion of the sample in an 800 MHz NMR magnet. Under the low ionic strength conditions, the Pf1 was ~50% aligned with the magnetic field (corresponding to a 2H quadrupole splitting of 1.4 Hz), and this alignment was maintained after polymerization of the acrylamide. The solidified gel was cleaned by two wash cycles in 20 mL H2O, and subsequently equilibrated in the γS protein solution at the regular buffer conditions. After reinsertion in the NMR tube, the 1.4 Hz 2H quadrupole splitting indicated the Pf1 alignment was maintained by the gel matrix during the entire handling process. A second 3 mg/mL Pf1 sample, whose orientation was not stabilized by gel and which was below the nematic Pf1 threshold, yielded a 0.46 Hz 2H quadrupole splitting, and this sample was used for measurement of the 1DHαCα couplings. 1DNH RDCs were obtained from 2D HSQC-TROSY spectra, recorded in an interleaved mode (Kontaxis et al. 2000). 1DNC′, 1DHαCα, and 1DCαCβ RDCs were measured from 3D-HNCO (Chou et al. 2000a), 3D-CBCACONH (Chou and Bax 2001), and 2D-HNCOCA (Evenas et al. 2001) experiments, respectively, utilizing quantitative J correlation. 1DCαC′ RDCs were obtained from Cα-coupled HNCO experiments recorded at 500 MHz (1H frequency), to minimize C′ relaxation, dominated by its large chemical shift anisotropy.
MFR selection
All molecular fragment selection was carried out using the program DYNAMO (Kontaxis et al. 2005). In a first iteration, seven-residue fragments out of the 800-protein library were searched on the basis of the backbone dipolar couplings, all normalized to the 1DNH interaction using previously reported scaling factors (Bax et al. 2001). 1DCαHα couplings were not used at any stage, except during structure validation. Results of this initial, SVD-based MFR search were only used to define the magnitudes and relative orientations of the two alignment tensors (Table 2), in the manner outlined previously (Kontaxis et al. 2005). In the second MFR search, the magnitude and relative orientation were kept fixed on the basis of the results of the first search, and the 10 database fragments exhibiting the best fit to the RDCs were retained for each of the 171 seven-residue fragments of γS. Subsequently, each of the database fragments was subjected to a brief simulated annealing protocol using the DYNAMO program, during which its N, Cα, and C′ atoms were harmonically restrained to remain close to those of the original database fragment, as were the backbone torsion angles, φ and ψ, using the RDCs as experimental input restraints. Only fragments for which the RMSD between experimental and calculated RDCs after refinement was lower than 1.5 Hz were retained. If no fragments refined to lower than 1.5 Hz, fragments refined to below 2.1 Hz were selected, provided they had all very similar backbone angles (Supplementary Fig. 6e,f). The terminal residues of each seven-residue fragment were discarded, and the average and standard deviation of the backbone torsion angles of the center five residues were retained for use as restraints during structure calculation.
Structure calculations
Structures were calculated by simulated annealing using XPLOR-NIH, starting from a fully extended strand (Schwieters et al. 2003). The protocol consisted of three stages. In the first stage, initially for 1000 1-fs steps at 1000 K, the protein was folded using zero van der Waals radii, 300 kcal/rad2 torsion angular restraints, and an NOE term that was ramped exponentially in 50 steps from 0.002 to 50 kcal/ Å2. Subsequently the temperature was lowered from 1000 to 300 K in 5-K decrements, using 285 time steps of 3 fs each, while keeping the torsion and NOE force constants unchanged, and ramping the van der Waals radii from 0 to 0.5 times their regular value. In the second stage, the temperature was lowered from 300 to 20 K, in 10-K decrements, while ramping the van der Waals radii from 0.002 to 0.8 times their regular value, and exponentially ramping the dipolar force constant from 5 × 10⁻⁴ to 0.5 kcal/Hz2 for DNH couplings. Dipolar force constants for DCC and DCN couplings were five- and eightfold higher, respectively. During the third stage, the temperature was initially started at 2000 K and then linearly decreased from 2000 to 1 K in 10-K decrements, using 500 time steps of 2 fs each. The force constant for the dipolar coupling restraints was ramped exponentially in the regular manner, up to a final value of 0.5 kcal/Hz2 (for couplings normalized to 1DNH), while the backbone and side-chain torsion angle force constants were kept fixed at 10 and 50 kcal mol−1 rad−2, with the NOE force constant unchanged at its full value. During this third stage, the H-bond PMF potential was turned on with a force constant of 0.6 kcal for the directional term and 0.1 kcal for the linearity term. Of the total of 20 structures used as input for the third stage, all converged and exhibited low energies, with no NOE violations larger than 0.3 Å and only one dipolar coupling violation (D161–1DHN in gel) larger than 5 Hz.
Coordinates have been deposited in the RCSB Protein Data Bank under accession numbers 1ZWM (experimental restraints only) and 1ZWO (experimental restraints plus homology-modeled H-bond restraints).
Acknowledgments
We thank Alex Grishaev for extensive help with structure refinement and H-bond evaluations, as well as numerous useful discussions. This work was supported by the Intramural Research Program of the NIDDK, NIH, and by the Intramural Antiviral Target Program of the Office of the Director, NIH.
Abbreviations
MFR, molecular fragment replacement
γS, murine γS-crystallin
Da, magnitude of the dipolar coupling tensor
R, rhombicity of the dipolar coupling tensor
Article published online ahead of print. Article and publication date are at http://www.proteinscience.org/cgi/doi/10.1110/ps.051635205.
Supplemental material: see www.proteinscience.org
References
- Al-Hashimi, H.M., Valafar, H., Terrell, M., Zartler, E.R., Eidsness, M.K., and Prestegard, J.H. 2000. Variation of molecular alignment as a means of resolving orientational ambiguities in protein structures from dipolar couplings. J. Magn. Reson. 143 402–406. [DOI] [PubMed] [Google Scholar]
- Andrec, M., Du, P.C., and Levy, R.M. 2001. Protein backbone structure determination using only residual dipolar couplings from one ordering medium. J. Biomol. NMR 21 335–347. [DOI] [PubMed] [Google Scholar]
- Annila, A., Aitio, H., Thulin, E., and Drakenberg, T. 1999. Recognition of protein folds via dipolar couplings. J. Biomol. NMR 14 223–230. [Google Scholar]
- Aswad, D.W., Paranandi, M.V., and Schurter, B.T. 2000. Isoaspartate in peptides and proteins: Formation, significance, and analysis. J. Pharm. Biomed. Anal. 21 1129–1136. [DOI] [PubMed] [Google Scholar]
- Basak, A.K., Kroone, R.C., Lubsen, N.H., Naylor, C.E., Jaenicke, R., and Slingsby, C. 1998. The C-terminal domains of γ S-crystallin pair about a distorted twofold axis. Protein Eng. 11 337–344. [DOI] [PubMed] [Google Scholar]
- Basak, A., Bateman, O., Slingsby, C., Pande, A., Asherie, N., Ogun, O., Benedek, G.B., and Pande, J. 2003. High-resolution X-ray crystal structures of human γ D crystallin (1.25 Å) and the R58H mutant (1.15 Å) associated with aculeiform cataract. J. Mol. Biol. 328 1137–1147. [DOI] [PubMed] [Google Scholar]
- Bax, A. 2003. Weak alignment offers new NMR opportunities to study protein structure and dynamics. Protein Sci. 12 1–16. [DOI] [PMC free article] [PubMed] [Google Scholar]
- Bax, A. and Grzesiek, S. 1993. Methodological advances in protein NMR. Acc. Chem. Res. 26 131–138. [Google Scholar]
- Bax, B., Lapatto, R., Nalini, V., Driessen, H., Lindley, P.F., Mahadevan, D., Blundell, T.L., and Slingsby, C. 1990. X-ray-analysis of β-B2-crystallin and evolution of oligomeric lens proteins. Nature 347 776–780. [DOI] [PubMed] [Google Scholar]
- Bax, A., Kontaxis, G., and Tjandra, N. 2001. Dipolar couplings in macro-molecular structure determination. Methods Enzymol. 339 127–174. [DOI] [PubMed] [Google Scholar]
- Berman, H.M., Westbrook, J., Feng, Z., Gilliland, G., Bhat, T.N., Weissig, H., Shindyalov, I.N., and Bourne, P.E. 2000. The Protein Data Bank. Nucleic Acids Res. 28 235–242. [DOI] [PMC free article] [PubMed] [Google Scholar]
- Bloemendal, H., de Jong, W., Jaenicke, R., Lubsen, N.H., Slingsby, C., and Tardieu, A. 2004. Ageing and vision: Structure, stability and function of lens crystallins. Prog. Biophys. Mol. Biol. 86 407–485. [DOI] [PubMed] [Google Scholar]
- Brenneman, M.T. and Cross, T.A. 1990. A method for the analytic determination of polypeptide structure using solid-state nuclear magnetic-resonance—The metric method. J. Chem. Phys. 92 1483–1494. [Google Scholar]
- Chou, J.J. and Bax, A. 2001. Protein sidechain rotamers from dipolar couplings in a liquid crystalline phase. J. Am. Chem. Soc. 123 3844–3845. [DOI] [PubMed] [Google Scholar]
- Chou, J.J., Delaglio, F., and Bax, A. 2000a. Measurement of 15N-13C′ dipolar couplings in medium sized proteins. J. Biomol. NMR 18 101–105. [DOI] [PubMed] [Google Scholar]
- Chou, J.J., Li, S., and Bax, A. 2000b. Study of conformational rearrangement and refinement of structural homology models by the use of heteronuclear dipolar couplings. J. Biomol. NMR 18 217–227. [DOI] [PubMed] [Google Scholar]
- Chou, J.J., Gaemers, S., Howder, B., Louis, J.M., and Bax, A. 2001. A simple apparatus for generating stretched polyacrylamide gels, yielding uniform alignment of proteins and detergent micelles. J. Biomol. NMR 21 377–382. [DOI] [PubMed] [Google Scholar]
- Chou, J.J., Kaufman, J.D., Stahl, S.J., Wingfield, P.T., and Bax, A. 2002. Micelle-induced curvature in a water-insoluble HIV-1 Env peptide revealed by NMR dipolar coupling measurement in a stretched polyacrylamide gel. J. Am. Chem. Soc. 124 2450–2451. [DOI] [PubMed] [Google Scholar]
- Cierpicki, T. and Bushweller, J.H. 2004. Charged gels as orienting media for measurement of residual dipolar couplings in soluble and integral membrane proteins. J. Am. Chem. Soc. 126 16259–16266. [DOI] [PubMed] [Google Scholar]
- Clore, G.M. and Garrett, D.S. 1999. R-factor, free R, and complete cross-validation for dipolar coupling refinement of NMR structures. J. Am. Chem. Soc. 121 9008–9012. [Google Scholar]
- Clore, G.M. and Gronenborn, A.M. 1989. Determination of three-dimensional structures of proteins and nucleic-acids in solution by nuclear magnetic-resonance spectroscopy. Crit. Rev. Biochem. Mol. Biol. 24 479–564. [DOI] [PubMed] [Google Scholar]
- Clore, G.M., Starich, M.R., and Gronenborn, A.M. 1998. Measurement of residual dipolar couplings of marcomolecules aligned in the nematic phase of a colloidal suspension of rod-shaped viruses. J. Am. Chem. Soc. 120 10571–10572. [Google Scholar]
- Cornilescu, G., Marquardt, J.L., Ottiger, M., and Bax, A. 1998. Validation of protein structure from anisotropic carbonyl chemical shifts in a dilute liquid crystalline phase. J. Am. Chem. Soc. 120 6836–6837. [Google Scholar]
- Cornilescu, G., Delaglio, F., and Bax, A. 1999. Protein backbone angle restraints from searching a database for chemical shift and sequence homology. J. Biomol. NMR 13 289–302. [DOI] [PubMed] [Google Scholar]
- Dejong, W.W., Leunissen, J.A.M., and Voorter, C.E.M. 1993. Evolution of the α-crystallin small heat-shock protein family. Mol. Biol. Evolut. 10 103–126. [DOI] [PubMed] [Google Scholar]
- Delaglio, F., Grzesiek, S., Vuister, G.W., Zhu, G., Pfeifer, J., and Bax, A. 1995. NMRpipe—A multidimensional spectral processing system based on Unix pipes. J. Biomol. NMR 6 277–293. [DOI] [PubMed] [Google Scholar]
- Delaglio, F., Kontaxis, G., and Bax, A. 2000. Protein structure determination using molecular fragment replacement and NMR dipolar couplings. J. Am. Chem. Soc. 122 2142–2143. [Google Scholar]
- Dosset, P., Hus, J.C., Blackledge, M., and Marion, D. 2000. Efficient analysis of macromolecular rotational diffusion from heteronuclear relaxation data. J. Biomol. NMR 16 23–28. [DOI] [PubMed] [Google Scholar]
- Drohat, A.C., Tjandra, N., Baldisseri, D.M., and Weber, D.J. 1999. The use of dipolar couplings for determining the solution structure of rat apo-S100B(ββ). Protein Sci. 8 800–809. [DOI] [PMC free article] [PubMed] [Google Scholar]
- Evenas, J., Mittermaier, A., Yang, D., and Kay, L. 2001. Measurement of 13Cα-13Cβ dipolar couplings in 15N,13C,2H-labeled proteins: Application to domain orientation in maltose binding protein. J. Am. Chem. Soc. 123 2858–2864. [DOI] [PubMed] [Google Scholar]
- Grishaev, A. and Bax, A. 2004. An empirical backbone–backbone hydrogen-bonding potential in proteins and its applications to NMR structure refinement and validation. J. Am. Chem. Soc. 126 7281–7292. [DOI] [PubMed] [Google Scholar]
- Grzesiek, S., Vuister, G.W., and Bax, A. 1993. A simple and sensitive experiment for measurement of JCC couplings between backbone carbonyl and methyl carbons in isotopically enriched proteins. J. Biomol. NMR 3 487–493. [DOI] [PubMed] [Google Scholar]
- Güntert, P., Braun, W., and Wüthrich, K. 1991. Efficient computation of three-dimensional protein structures in solution from nuclear magnetic resonance data using the program DIANA and the supporting programs CALIBA, HABAS and GLOMSA. J. Mol. Biol. 217 517–530. [DOI] [PubMed] [Google Scholar]
- Hansen, M.R., Mueller, L., and Pardi, A. 1998. Tunable alignment of macromolecules by filamentous phage yields dipolar coupling interactions. Nat. Struct. Biol. 5 1065–1074. [DOI] [PubMed] [Google Scholar]
- Hemmingsen, J.M., Gernert, K.M., Richardson, J.S., and Richardson, D.C. 1994. The tyrosine corner: A feature of most Greek key (β)-barrel proteins. Protein Sci. 3 1927–1937. [DOI] [PMC free article] [PubMed] [Google Scholar]
- Hu, J.S. and Bax, A. 1997. χ1 angle information from a simple two-dimensional NMR experiment that identifies trans 3JNC γ couplings in isotopically enriched proteins. J. Biomol. NMR 9 323–328. [DOI] [PubMed] [Google Scholar]
- Hu, J.S., Grzesiek, S., and Bax, A. 1997. Two-dimensional NMR methods for determining (χ1) angles of aromatic residues in proteins from three-bond J(C′Cγ) and J(NCγ) couplings. J. Am. Chem. Soc. 119 1803–1804. [Google Scholar]
- Hus, J.C., Marion, D., and Blackledge, M. 2001. Determination of protein backbone structure using only residual dipolar couplings. J. Am. Chem. Soc. 123 1541–1542. [DOI] [PubMed] [Google Scholar]
- Ishii, Y., Markus, M.A., and Tycko, R. 2001. Controlling residual dipolar couplings in high-resolution NMR of proteins by strain induced alignment in a gel. J. Biomol. NMR 21 141–151. [DOI] [PubMed] [Google Scholar]
- Johnson, B.A. and Blevins, R.A. 1994. NMRView: A computer program for the visualization and analysis of NMR data. J. Biomol. NMR 4 603–614. [DOI] [PubMed] [Google Scholar]
- Jones, T.A. and Thirup, S. 1986. Using known substructures in protein model-building and crystallography. EMBO J. 5 819–822. [DOI] [PMC free article] [PubMed] [Google Scholar]
- Kontaxis, G., Clore, G.M., and Bax, A. 2000. Evaluation of cross-correlation effects and measurement of one-bond couplings in proteins with short transverse relaxation times. J. Magn. Reson. 143 184–196. [DOI] [PubMed] [Google Scholar]
- Kontaxis, G., Delaglio, F., and Bax, A. 2005. Molecular fragment replacement approach to protein structure determination by chemical shift and dipolar homology database mining. Methods Enzymol. 394 42–78. [DOI] [PubMed] [Google Scholar]
- Koradi, R., Billeter, M., and Wuthrich, K. 1996. MOLMOL: A program for display and analysis of macromolecular structures. J. Mol. Graph. 14 51–55. [DOI] [PubMed] [Google Scholar]
- Kumaraswamy, V.S., Lindley, P.F., Slingsby, C., and Glover, I.D. 1996. An eye lens protein-water structure: 1.2 Å resolution structure of γ B-crystallin at 150K. Acta. Crystallogr. D. Biol. Crystallogr. 52 611–622. [DOI] [PubMed] [Google Scholar]
- Kuszewski, J., Gronenborn, A.M., and Clore, G.M. 1999. Improving the packing and accuracy of NMR structures with a pseudopotential for the radius of gyration. J. Am. Chem. Soc. 121 2337–2338. [Google Scholar]
- Kuszewski, J., Schwieters, C., and Clore, G.M. 2001. Improving the accuracy of NMR structures of DNA by means of a database potential of mean force describing base-base positional interactions. J. Am. Chem. Soc. 123 3903–3918. [DOI] [PubMed] [Google Scholar]
- Lapko, V.N., Smith, D.L., and Smith, J.B. 2002. S-methylated cysteines in human lens γS-crystallins. Biochemistry 41 14645–14651. [DOI] [PubMed] [Google Scholar]
- Laskowski, R.A., MacArthur, M.W., Moss, D.S., and Thornton, J.W. 1993. PROCHECK: A program to check the stereochemical quality of protein structures. J. Appl. Crystallogr. 26 283–291. [Google Scholar]
- Laskowski, R.A., Rullmann, J.A.C., MacArthur, M.W., Kaptein, R., and Thornton, J.M. 1996. AQUA and Procheck NMR: Programs for checking the quality of protein structures solved by NMR. J. Biomol. NMR 8 477–486. [DOI] [PubMed] [Google Scholar]
- Lipari, G. and Szabo, A. 1982. Model-free approach to the interpretation of nuclear magnetic resonance relaxation in macromolecules. 1. Theory and range of validity. J. Am. Chem. Soc. 104 4546–4559. [Google Scholar]
- Losonczi, J.A., Andrec, M., Fischer, M.W.F., and Prestegard, J.H. 1999. Order matrix analysis of residual dipolar couplings using singular value decomposition. J. Magn. Reson. 138 334–342. [DOI] [PubMed] [Google Scholar]
- Lubsen, N.H., Aarts, H.J.M., and Schoenmakers, J.G.G. 1988. The evolution of lenticular proteins—The β-crystallin and γ-crystallin super gene family. Prog. Biophys. Mol. Biol. 51 47–76. [DOI] [PubMed] [Google Scholar]
- Meier, S., Haussinger, D., and Grzesiek, S. 2002. Charged acrylamide copolymer gels as media for weak alignment. J. Biomol. NMR 24 351–356. [DOI] [PubMed] [Google Scholar]
- Norledge, B.V., Hay, R.E., Bateman, O.A., Slingsby, C., and Driessen, H.P.C. 1997. Towards a molecular understanding of phase separation in the lens: A comparison of the x-ray structures of two high T-c γ-crystallins, γ E and γ F, with two low T-c γ-crystallins, γ B and γ D. Exp. Eye Res. 65 609–630. [DOI] [PubMed] [Google Scholar]
- Ottiger, M. and Bax, A. 1999. Bicelle-based liquid crystals for NMR-measurement of dipolar couplings at acidic and basic pH values. J. Biomol. NMR 13 187–191. [DOI] [PubMed] [Google Scholar]
- Prestegard, J.H., Al-Hashimi, H.M., and Tolman, J.R. 2000. NMR structures of biomolecules using field oriented media and residual dipolar couplings. Q. Rev. Biophys. 33 371–424. [DOI] [PubMed] [Google Scholar]
- Purkiss, A.G., Bateman, O.A., Goodfellow, J.M., Lubsen, N.H., and Slingsby, C. 2002. The X-ray crystal structure of human γS-crystallin C-terminal domain. J. Biol. Chem. 277 4199–4205. [DOI] [PubMed] [Google Scholar]
- Ramirez, B.E. and Bax, A. 1998. Modulation of the alignment tensor of macromolecules dissolved in a dilute liquid crystalline medium. J. Am. Chem. Soc. 120 9106–9107. [Google Scholar]
- Ray, M.E., Wistow, G., Su, Y.A., Meltzer, P.S., and Trent, J.M. 1997. AIM1, a novel non-lens member of the β γ-crystallin superfamily, is associated with the control of tumorigenicity in human malignant melanoma. Proc. Natl. Acad. Sci. 94 3229–3234. [DOI] [PMC free article] [PubMed] [Google Scholar]
- Rosinke, B., Renner, C., Mayr, E.M., Jaenicke, R., and Holak, T.A. 1997. Ca2+-loaded spherulin 3a from Physarum polycephalum adopts the prototype γ-crystallin fold in aqueous solution. J. Mol. Biol. 271 645–655. [DOI] [PubMed] [Google Scholar]
- Ruckert, M. and Otting, G. 2000. Alignment of biological macromolecules in novel nonionic liquid crystalline media for NMR experiments. J. Am. Chem. Soc. 122 7793–7797. [Google Scholar]
- Salzmann, M., Wider, G., Pervushin, K., Senn, H., and Wuthrich, K. 1999. TROSY-type triple-resonance experiments for sequential NMR assignments of large proteins. J. Am. Chem. Soc. 121 844–848. [Google Scholar]
- Sanders, C.R. and Schwonek, J.P. 1992. Characterization of magnetically orientable bilayers in mixtures of dihexanoylphosphatidylcholine and dimyristoylphosphatidylcholine by solid-state NMR. Biochemistry 31 8898–8905. [DOI] [PubMed] [Google Scholar]
- Sass, J., Cordier, F., Hoffmann, A., Rogowski, M., Cousin, A., Omichinski, J.G., Lowen, H., and Grzesiek, S. 1999. Purple membrane induced alignment of biological macromolecules in the magnetic field. J. Am. Chem. Soc. 121 2047–2055. [Google Scholar]
- Sass, H.J., Musco, G., Stahl, S.J., Wingfield, P.T., and Grzesiek, S. 2000. Solution NMR of proteins within polyacrylamide gels: Diffusion properties and residual alignment by mechanical stress or embedding of oriented purple membranes. J. Biomol. NMR 18 303–309. [DOI] [PubMed] [Google Scholar]
- Schwieters, C.D., Kuszewski, J.J., Tjandra, N., and Clore, G.M. 2003. The Xplor-NIH NMR molecular structure determination package. J. Magn. Reson. 160 65–73. [DOI] [PubMed] [Google Scholar]
- Sinha, D., Esumi, N., Jaworski, C., Kozak, C.A., Pierce, E., and Wistow, G. 1998. Cloning and mapping the mouse Crygs gene and non-lens expression of [γ]S-crystallin. Mol. Vis. 4 8. [PubMed] [Google Scholar]
- Sinha, D., Wyatt, M.K., Sarra, R., Jaworski, C., Slingsby, C., Thaung, C., Pannell, L., Robison, W.G., Favor, J., Lyon, M., et al. 2001. A temperature-sensitive mutation of Crygs in the murine Opj cataract. J. Biol. Chem. 276 9308–9315. [DOI] [PubMed] [Google Scholar]
- Skouri-Panet, F., Bonnete, F., Prat, K., Bateman, O.A., Lubsen, N.H., and Tardieu, A. 2001. Lens crystallins and oxidation: The special case of γS. Biophys. Chem. 89 65–76. [DOI] [PubMed] [Google Scholar]
- Tjandra, N. and Bax, A. 1997. Direct measurement of distances and angles in biomolecules by NMR in a dilute liquid crystalline medium. Science 278 1111–1114. [DOI] [PubMed] [Google Scholar]
- Torchia, D.A., Sparks, S.W., and Bax, A. 1988. Delineation of α-helical domains in deuteriated staphylococcal nuclease by 2d NOE NMR-spectroscopy. J. Am. Chem. Soc. 110 2320–2321. [Google Scholar]
- Tugarinov, V. and Kay, L.E. 2003. Quantitative NMR studies of high molecular weight proteins: Application to domain orientation and ligand binding in the 723 residue enzyme malate synthase G. J. Mol. Biol. 327 1121–1133. [DOI] [PubMed] [Google Scholar]
- Tycko, R., Blanco, F.J., and Ishii, Y. 2000. Alignment of biopolymers in strained gels: A new way to create detectable dipole–dipole couuplings in high-resolution biomolecular NMR. J. Am. Chem. Soc. 122 9340–9341. [Google Scholar]
- Ulmer, T.S., Ramirez, B.E., Delaglio, F., and Bax, A. 2003. Evaluation of backbone proton positions and dynamics in a small protein by liquid crystal NMR spectroscopy. J. Am. Chem. Soc. 125 9179–9191. [DOI] [PubMed] [Google Scholar]
- Vuister, G.W., Wang, A.C., and Bax, A. 1993. Measurement of three-bond nitrogen carbon-J couplings in proteins uniformly enriched in N-15 and C-13. J. Am. Chem. Soc. 115 5334–5335. [Google Scholar]
- Wagner, G. 1993. Prospects for NMR of large proteins. J. Biomol. NMR 3 375–385. [DOI] [PubMed] [Google Scholar]
- Wang, X., Garcia, C.M., Shui, Y.B., Wistow, G., and Beebe, D.C. 2004. Expression of crystalline in the mammalian lens epithelium. Invest. Ophthalmol. Vis. Sci. 45 U343. [DOI] [PubMed] [Google Scholar]
- Wishart, D.S. and Case, D.A. 2001. Use of chemical shifts in macromolecular structure determination. Nuclear Magn. Reson. Biol. Macromol. A 338 3–34. [DOI] [PubMed] [Google Scholar]
- Wistow, G. 1995. Molecular biology and evolution of crystallins: Gene recruitment and multifunctional proteins in the eye lens. In Molecular biology intelligence series, p. 1. R.G. Landes Co., Austin, TX.
- Wistow, G.J. and Piatigorsky, J. 1988. Lens crystallins—The evolution and expression of proteins for a highly specialized tissue. Annu. Rev. Biochem. 57 479–504. [DOI] [PubMed] [Google Scholar]
- Wistow, G., Berstein, S.L., Wyatt, M.K., Farriss, R.N., Behal, A., Touchman, J., Bouffard, G., Smith, D., and Peterson, K. 2002. Expressed sequence tag analysis of human RPE/choroid for the NEIBank project: Over 6000 non-redundant transcripts, novel genes and splice variants. Mol. Vis. 8205–220. [PubMed] [Google Scholar]
- Wistow, G., Wyatt, K., David, L., Gao, C., Bateman, O., Bernstein, S., Tomarev, S., Segovia, L., Slingsby, C., and Vihtelic, T. 2005. γ N-crystallin and the evolution of the β γ-crystallin superfamily in vertebrates. FEBS J. 272 2276–2291. [DOI] [PubMed] [Google Scholar]
- Wüthrich, K. 1986. NMR of proteins and nucleic acids. John Wiley & Sons, New York.
- Zarina, S., Slingsby, C., Jaenicke, R., Zaidi, Z.H., Driessen, H., and Srinivasan, N. 1994. Three-dimensional model and quaternary structure of the human eye lens protein γS-crystallin based on β- and γ-crystallin X-ray coordinates and ultracentrifugation. Protein Sci. 3 1840–1846. [DOI] [PMC free article] [PubMed] [Google Scholar]
- Zwahlen, C., Gardner, K.H., Sarma, S.P., Horita, D.A., Byrd, R.A., and Kay, L.E. 1998a. An NMR experiment for measuring methyl-methyl NOEs in C-13-labeled proteins with high resolution. J. Am. Chem. Soc. 120 7617–7625. [Google Scholar]
- Zwahlen, C., Vincent, S.J.F., Gardner, K.H., and Kay, L.E. 1998b. Significantly improved resolution for NOE correlations from valine and isoleucine (Cg2) methyl groups in 15N,13C- and 15N,13C,2H-labeled proteins. J. Am. Chem. Soc. 120 4825–4831. [Google Scholar]
- Zweckstetter, M. and Bax, A. 2001. Characterization of molecular alignment in aqueous suspensions of Pf1 bacteriophage. J. Biomol. NMR 20 365–377. [DOI] [PubMed] [Google Scholar]
- ———. 2002. Evaluation of uncertainty in alignment tensors obtained from dipolar couplings. J. Biomol. NMR 23 127–137. [DOI] [PubMed] [Google Scholar]