

Abstract
AT-rich interaction domains (ARIDs) are found in a large number of eukaryotic transcription factors that regulate cell proliferation, differentiation, and development. Previously we elucidated how ARIDs recognize DNA by determining the solution structure of the Drosophila melanogaster Dead ringer protein in both its DNA-free and -bound states. In order to quantitatively determine how ARIDs alter their mobility to recognize DNA, we have measured the relaxation parameters of the backbone nitrogen-15 nuclei of Dead ringer in its free and bound forms, and interpreted these data using the model-free approach. We show that Dead ringer undergoes significant changes in its mobility upon binding, with residues in the loop connecting helices H5 and H6 becoming immobilized in the major groove and contacts to the minor groove slowing down the motion of residues at the C terminus. A DNA-induced rotation and displacement of the N-terminal subdomain of the protein increases the mobility of helix H1 located distal to the DNA interface and may partially negate the entropic cost of immobilizing interfacial residues. Elevated motions on the micro- to millisecond timescale in the N-terminal domain prior to DNA binding appear to foreshadow the DNA-induced conformation change.
Keywords: AT-rich interaction domain, ARID, protein–DNA interaction, NMR, backbone dynamics, 15N-relaxation, Dead ringer protein
Protein–nucleic acid recognition plays a central role in the transcription, replication, repair, and recombination of DNA. Most DNA-binding transcription factors have evolved to recognize specific nucleotide sequences with dissociation constants ranging from ~10−9 to 10−12 M (Jen-Jacobson 1997). This level of affinity enables their reversible binding in vivo, but is strong enough to facilitate high occupancy and selective binding to regulatory elements within the genome. The three-dimensional structures of numerous protein–DNA complexes and thermodynamic studies have revealed highly complementary binding surfaces that are primarily stabilized by enthalpic effects associated with hydrogen bonding and salt-bridge formation, and the entropically favorable release of water and counterions (Patikoglou and Burley 1997; Nadassy et al. 1999; Garvie and Wolberger 2001). Counterbalancing these interactions is the entropic cost associated with complex formation (the loss of six degrees of freedom, three translational and three rotational), and any unfavorable enthalpic effects (for example, DNA or protein distortions that occur in the complex). Beginning with the pioneering work of Pabo and Sauer on the λ repressor, it was realized that flexible regions within proteins could undergo local folding upon DNA binding (Pabo et al. 1982). Although entropically unfavorable, immobilization contributes to binding specificity by enabling proteins to adaptively recognize their DNA ligands (Spolar and Record 1994; Wright and Dyson 1999).
In this work we studied how the AT-rich interaction domain (ARID) from the Dead ringer protein adapts its backbone dynamics to recognize DNA. The ARID is a novel DNA-binding module found in a large number of eukaryotic transcription factors that regulate cell proliferation, differentiation, and development (for review, see Kortschak et al. 2000 and Wilsker et al. 2002). ARIDs were originally named based on the propensity of the ARID containing Bright, Dead ringer and Mrf-2 proteins to sequence-specifically bind to AT-rich DNA (Herrscher et al. 1995; Gregory et al. 1996; Valentine et al. 1998; Whitson et al. 1999), but more recently ARID containing proteins such as Osa and Swi1 have been shown to bind DNA nonsequence specifically (Collins et al. 1999; Dallas et al. 2000). Previous NMR studies of the Mrf-2, Swi1, and Dead ringer proteins have revealed that ARIDs adopt a uniqueα–helical fold, but that they are structurally diverse (Yuan et al. 1998; Iwahara and Clubb 1999b; Iwahara et al. 2002; Kim et al. 2004). All ARIDs contain an ~80-amino-acid conserved core region, but can be partitioned into three distinct structural subfamilies because of differences outside the core region: (1) minimal-ARIDs like Mrf-2 consist of a conserved core domain formed by six α-helices (H2–H7 in the ARID) (Yuan et al. 1998); (2) extended-ARIDs, like the Dead-ringer protein described in this study, contain the core domain and additional α-helices at their N and C termini (Iwahara and Clubb 1999b); and (3) N-terminal extended-ARIDs, which supplement the core domain with an amino-terminal α-helix. This subfamily was originally predicted based on primary sequence homology (Iwahara and Clubb 1999b) and has recently been visualized in the structure of the Swi1 protein (Kim et al. 2004). Both the conserved core and nonconserved C-terminal regions of ARIDs interact with DNA, while the role of the N-terminal helix specific to proteins in subfamilies 2 and 3 remains unknown. In addition to their structural heterogeneity, ARIDs appear to adaptively recognize their binding sites, since nitrogen-15 relaxation studies of the Mrf-2 protein indicates that its mobility is quenched upon DNA binding (Zhu et al. 2001) and the structure of the Dead ringer–DNA complex has highlighted significant DNA-induced structural changes in the protein (Iwahara et al. 2002). In this paper we have used nitrogen-15 relaxation measurements to quantitatively determine how the Dead ringer ARID alters its mobility to recognize DNA. Because the Dead ringer protein belongs to the extended-ARID subfamily and it is the only ARID for which both the structures of the free and DNA complex are known, this work provides valuable insights in the structural and dynamic mechanisms through which ARID transcription factors recognize DNA using both well-conserved and less-conserved protein components.
Results
Backbone 15N relaxation measurements of the free and DNA-bound forms of ARIDPhe355Leu
We studied the NMR relaxation properties of a single amino acid mutant of the Dead ringer ARID (ARIDPhe355Leu, amino acids Gly262–Gly398 of Dead ringer with leucine substituted for phenylalanine at position 355). This mutant protein was used because the NMR structure of its complex with DNA has been determined previously (the ARIDPhe355Leu–DNA complex containing ARIDPhe355Leu bound to the sequence 5′-CCTGTATTGATGTGG-3′; 5′-CCACATCAATACAGG-3′) (Iwahara et al. 2002). The amide 15N T1, T1ρ, and {1H-}15N NOE values of nitrogen-15 enriched ARIDPhe355Leu in the DNA-free state and the ARIDPhe355Leu–DNA complex were measured at 500 and 600 MHz. The spectra of ARIDPhe355Leu and the ARIDPhe355Leu-DNA complex are well resolved (Iwahara and Clubb 1999a), enabling the measurement of relaxation parameters for 111 and 105 residues, respectively. Relaxation data were acquired at different temperatures, 303 K and 310 K for the free ARIDPhe355Leu and the ARIDPhe355Leu–DNA complex, respectively. This was required because the DNA free protein is unstable at 310 K and the 26 kDa ARIDPhe355Leu–DNA complex exhibits increased line broadening at 303 K.
Consistent with its larger molecular size, the protein when bound to DNA exhibits longer T1 and shorter T2 values. Figure 1 ▶ shows representative {1H-}15N NOE, T1 and T2 data for the protein backbone amide nitrogen-15 atoms in the complex as a function of residue number. The median values of the T1, T2, and {1H-}15N NOEs for residues located in helices H1 to H8 in the ARIDPhe355Leu–DNA complex are respectively, 713 ± 49 msec, 62.4 ± 6.6 msec, and 0.75 ± 0.09 at 500 MHz and 941 ± 61 msec, 58.1 ± 6.3 msec, and 0.79 ± 0.07 at 600 MHz. On the other hand, in the free protein the average values are 612 ± 37 msec, 73.7 ± 9.1 msec, and 0.76 ± 0.10 at 500 MHz and 800 ± 50 msec, 67.7 ± 8.5 msec, and 0.74 ± 0.09 at 600 MHz, respectively.
Figure 1.
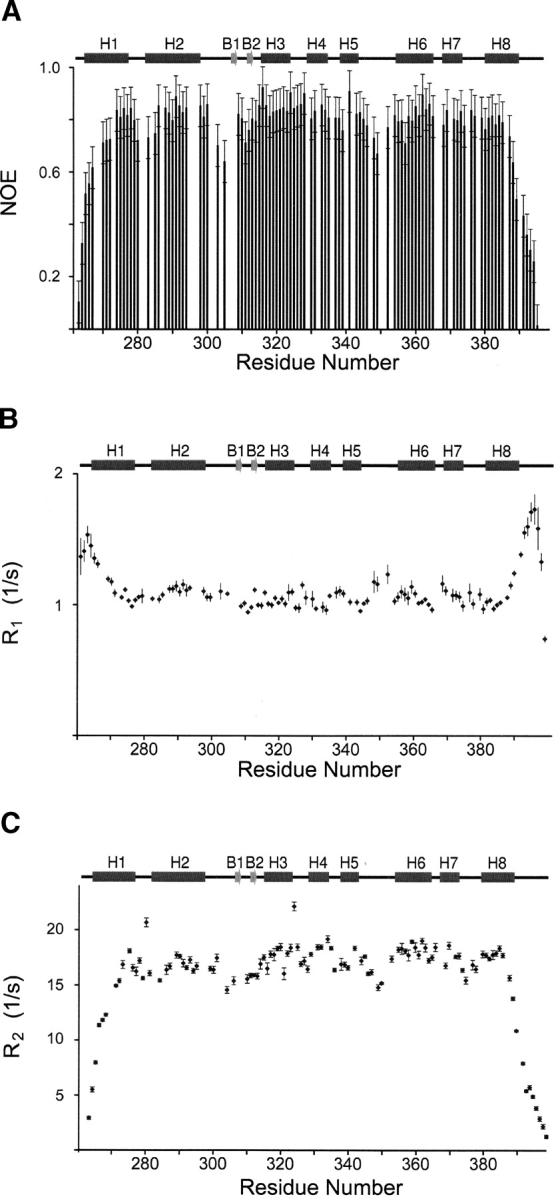
Representative 15N relaxation data of the Dead ringer ARIDPhe355Leu-DNA complex collected at 600 MHz. (A) {1H-}15N NOE, (B) 15N R1, and (C) 15N R2 values as a function of residue number. Sample temperatures were 310 K and a schematic of the secondary structure of the protein is shown. The R2 values were calculated from T1 and T1ρ values as described in the text. Errors are based on the standard deviations of the noise level present in the NMR spectra. Residues Gly262, Ser396, Tyr397, and Gly398 are not shown in panel A because they have {1H-}15N NOE values less than zero.
Determining the anisotropy of rotational diffusion
In order to accurately extract the order parameters and correlation times of internal motions, we first determined the rotational diffusion anisotropy of the ARIDPhe355Leu and the ARIDPhe355Leu–DNA complex using the T1/T2 ratios and the NMR solution structures. This was done because erroneous values for internal dynamics parameters can be obtained even if the anisotropy is as small as D||/D⊥ ~1.2 (Tjandra et al. 1995; Luginbuhl et al. 1997; Osborne et al. 2001). To obtain a rough estimate of the rotational diffusion anisotropy, the inertia tensors were calculated with the 20-structure ensembles of the free protein (Iwahara and Clubb 1999b) (PDB 1C20) and the ARIDPhe355Leu–DNA complex (Iwahara et al. 2002) (PDB 1KQQ). The ratio of inertia moments around the principal axes of the inertia tensors (Ixx:Iyy:Izz) are 0.55 ± 0.04:0.84 ± 0.03:1.00 for the free protein and 0.61 ± 0.01:0.72 ± 0.01:1.00 for the complex. In both structures, two of three moments are relatively close to one another, indicating that their rotational diffusion is axially symmetric. Moreover, judging from the ratios of the inertia moments, ellipsoids of the diffusion tensors are expected to be “prolate” (Ixx < Iyy ≈ Izz; Dzz > Dyy ≈ Dxx; D||/D⊥ > 1.0) for the complex and “oblate” (Ixx ≈ Iyy < Izz; Dzz ≈ Dyy > Dxx ; D||/D⊥ < 1.0) for the free protein. Using empirical relationship, D||/D⊥ ≈ (I⊥/I||)(1/√2) (Copie et al. 1998), the diffusion anisotropy values of the free protein and the complex are estimated to be ~1.4 and ~0.8, respectively. However, it should be noted that the calculated inertial axes from the static structures do not necessarily have to agree well with the principle axes of the actual rotational diffusion tensor, due to lack of information on the hydrodynamics of the macromolecule. We therefore used the experimental data to gain insights into the diffusion tensor (see below).
The diagonal elements and the principle axes of the rotational diffusion tensor were determined by nonlinear least square fitting of the experimental T1/T2 ratios determined at 500 and 600 MHz (Tjandra et al. 1995). In this procedure, data from residues that exhibited significant exchange contribution to T2 in our subsequent analyses, and/or {1H-}15N NOE values smaller than 0.6 were excluded. In the final analysis, only ~70% of the available data was used (73 and 75 residues for the free and complexed proteins, respectively). Because the rotational diffusion anisotropy characterized by D||/D⊥ was estimated to be relatively small (see above), the effect of noncollinearity of the 15N-1H dipolar and 15N CSA tensors on the relaxation data was neglected (Fushman and Cowburn 1999). As pointed out previously (Blackledge et al. 1998), the χ2 function defined as χ2 = ∑ [(T1/T2)calc − (T1/T2)obs]2/σ2, could show two minima with similar magnitudes: one at D||/D⊥ > 1.0 (prolate ellipsoid) and the other at D||/D⊥ < 1.0 (oblate ellipsoid). Since the inertia tensors of the free and bound proteins had previously been determined from their overall molecular shapes, the nonlinear least square fitting procedure was performed constraining D||/D⊥ (D||/D⊥ > 1.0 for the free protein and D||/D⊥ < 1.0 for the complex). This fitting procedure produced D||/D⊥ values of 1.41 for the free protein and 0.84 for the complex, which are in close agreement to the values predicted using the inertia moments. Note that the D|| symmetry axis of the rotational diffusion tensor should theoretically correspond to the X-axis of the inertia tensor for the prolate ellipsoid (Ixx < Iyy = Izz) and the Z-axis for the oblate ellipsoid model (Ixx = Iyy < Izz). In fact, despite the lack of information on the hydrodynamics of the free protein and the complex, the symmetry axes of the diffusion tensors were roughly parallel with the corresponding inertial axes calculated from the static structures; the angle differences were 19° for the free protein and 7° for the complex. Residuals of the χ2 functions divided by the number of data points (χ2/N) were 16.7 and 3.4 for the free protein and the complex, respectively. The higher χ2/N value for the free protein is mainly due to the smaller experimental errors in T1/T2 and may also be due to lower quality of the structure of the free protein; residual dipolar coupling constraints were used for the complex, but not for the free protein, and a larger number of long-range NOE restraints define the structure of the protein in the complex (Iwahara and Clubb 1999b; Iwahara et al. 2002). A fully asymmetric diffusion tensor (Dzz > Dxx > Dyy) was also examined. Although the number of fitted parameters is larger (six as opposed to four for the axially symmetric model), calculations with the fully asymmetric diffusion tensor resulted in only a slight reduction of χ2/N (the values were 16.7 for free and 2.9 for the complex). This suggests that it is meaningless to use the fully asymmetric model for both systems. Thus, an axially symmetric diffusion model was employed in the subsequent model-free analysis, using D||/D⊥ = 1.43 for the free protein and 0.83 for the complex.
Effective overall correlation times
The above analyses predicted effective correlation times of 10.4 nsec for the 16 kDa ARIDPhe355Leu protein at 303 K, and 12.7 nsec for the 26 kDa ARIDPhe355Leu–DNA complex at 310 K. In order to cross-validate these numbers we used nitrogen-15 relaxation data to determine the effective correlation time of the complex at the same temperature as that used for the free protein (data not shown). The sensitivity of the NMR data acquired on the complex at 303 K was significantly lower, and only 43 residues could be used for the same analysis of the rotational diffusion tensor. The complex has an effective correlation time of 14.6 nsec at 303 K and the ratio of correlation times of the complex to the free protein is 1.4 (τc,effcomplex/τc,efffree = 14.6/10.4). This value is in good agreement with the structural data, which predict a ratio of 1.36; the rotational correlation time is proportional to the cubic of the radius of gyration, which is 16.6 (±0.4) Å and 18.4 (±0.2) Å in the structures of the free protein and the complex, respectively. Because of the generally higher quality of the data collected at 310 K, it was used to characterize the dynamics of the complex.
Model-free analysis
The model-free approach was used to determine the generalized order parameter (S2) and internal correlation time (τe) of backbone amide motion, and the exchange–contribution (Rex) to 15N transverse relaxation rates. Five model functions were used to fit the relaxation data; the functions contained either (1) S2; (2) S2 and Rex; (3) S2 and τe; (4) S2, Sf2, τe; or (5) S2, τe, Rex (Clore et al. 1990; Mandel et al. 1995). For each residue the method proposed by Ishima and colleagues was used to select the best model function to fit the relaxation data acquired at the two magnetic fields (Ishima and Nagayama 1995; Ishima et al. 1995). The values of S2, τe, and Rex for individual residues in the free protein and complex are shown in Figures 2 ▶ and 3 ▶, respectively. The mean values of S2 value for residues Trp263–Glu391 is 0.87 and 0.89, for the free ARIDPhe355Leu and the ARIDPhe355Leu–DNA complex, respectively. As observed in other proteins, residues within regular secondary structure exhibit larger order parameters, while residues within loops have smaller values (Goodman et al. 2000); residues in helices in the free and the bound proteins have mean S2 values 0.94 and 0.93, respectively. In both binding states, the largest degree of mobility in regular secondary structural elements is observed in the N-terminal portion of helix H1, the β-hairpin, and the C-terminal portion of helix H8. Large internal motions in the pico- to nanosecond timescale are also observed in all protein loops and 15 residues in the free protein and seven residues in the complex exhibit Rex values larger than 1 Hz. Of these residues, only Asn279 and Ile323 in both the free and DNA-bound states, and residue Val272 in the free protein, exhibit Rex values larger than 3 Hz. A detailed discussion of the relaxation data is provided below.
Figure 2.
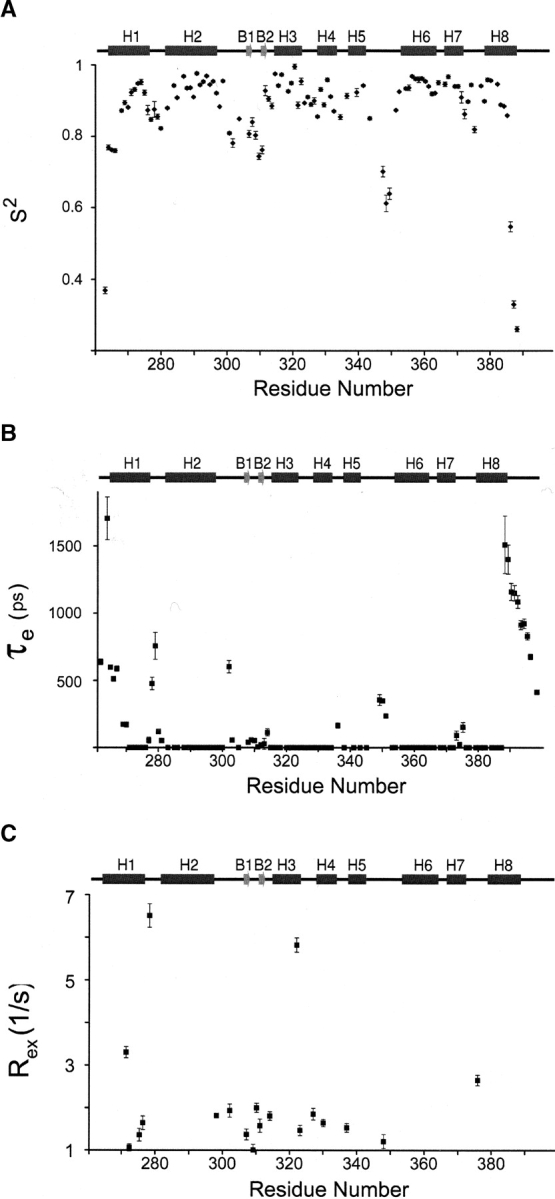
Model-free parameters for the Dead ringer protein (ARIDPhe355Leu) in the DNA-free state. (A) Order parameters S2 as function of residue number. (B) Correlation times of internal motions (τe) as a function of residue number. (C) Exchange contributions (Rex) to the 15N relaxation data as a function of residue number. The secondary structure of ARIDPhe355Leu is drawn above each panel and the standard deviations of each parameter are represented by error bars.
Figure 3.
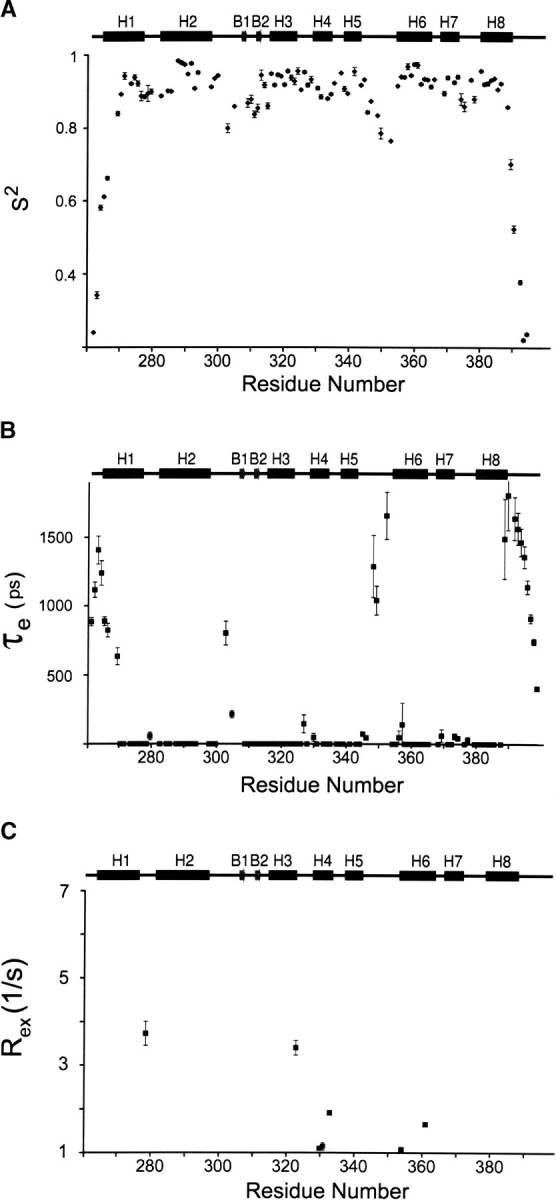
Model-free parameters for the Dead ringer ARIDPhe355Leu-DNA complex. (A) Order parameters S2 as function of residue number. (B) Correlation times of internal motions (τe) as a function of residue number. (C) Exchange contributions (Rex) to the 15N relaxation data as a function of residue number. The secondary structure of ARIDPhe355Leu is drawn above each panel and the standard deviations of each parameter are represented by error bars.
Discussion
The Dead ringer ARID can be envisioned as consisting of two subdomains (Fig. 4 ▶). A C-terminal helical subdomain is formed by helices H3 to H8, and interacts with the phosphodiester backbone and the major and minor grooves, while an N-terminal subdomain consisting of helices H1, H2 and a short β-hairpin, rotates upon DNA binding to form stabilizing interactions with the phosphodiester backbone of the duplex. In order to aid in the discussion of the dynamics data, the interface can be divided into four regions: (1) the loop connecting helices H5 and H6 (the H5/H6 loop; residues Leu344–Ser352), which is inserted into the major groove (Fig. 6A ▶, below); (2) the β-hairpin region that contacts the phosphodiester backbone on the 5′ side of the major groove interface (Fig. 6A ▶, below); (3) the concave surface formed by residues within helices H4 to H6 and H8, which contacts the phosphodiester backbone on the 3′ side of the major groove interface (Fig. 6B ▶, below); and (4) the C-terminal tail that contacts the minor groove (Fig. 6B ▶, below). A comparison of the backbone atom coordinate precision in the DNA free and bound forms of the protein suggests that the H5/H6 loop, the β-hairpin, and the C terminus undergo a disordered to ordered transition upon binding DNA, since the coordinates of atoms in these regions are more precisely defined in the complex (Fig. 5 ▶). However, this structural argument for changes in protein dynamics is weak, since the interfacial amino acids protrude into the solvent in the DNA free protein (e.g., the H5/H6 loop, β-hairpin, and C terminus) and are thus defined by fewer NOE restraints as compared to the complex. In order to determine the magnitude and timescales of motion, we therefore performed a nitrogen-15 relaxation study.
Figure 4.
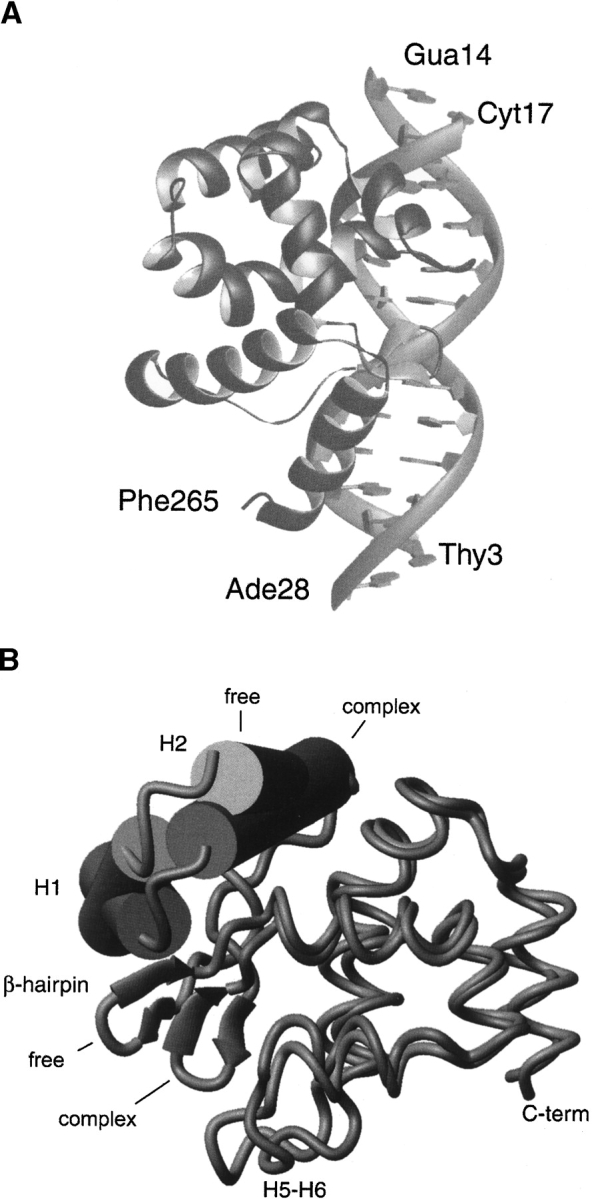
Structure of the ARIDPhe355Leu-DNA complex. (A) Ribbon schematic of the Dead ringer ARIDPhe355Leu-DNA complex. The figure displays the lowest energy structure (PDB 1KQQ) (Iwahara et al. 2002). The N and C termini of the protein and the 5′ and 3′ ends of the DNA are labeled. (B) Overlay of the backbone structure of ARIDPhe355Leu in the DNA-free and -bound states (Iwahara and Clubb 1999b; Iwahara et al. 2002). The overlay was constructed by superimposing helices H3 to H8 of each structure (rmsd for the backbone atoms of residues 315–388 is 1.5 Å). For clarity, helices H1 and H2 are represented as cylinders and the β-hairpin is represented with arrows. DNA binding causes a large rotation of the two subdomains with respect to one another; in the energy minimized structures, helices H1 and H2 of the N-terminal subdomain are shifted by ~31° and ~17° relative to the C-terminal subdomain upon binding DNA, respectively.
Figure 6.
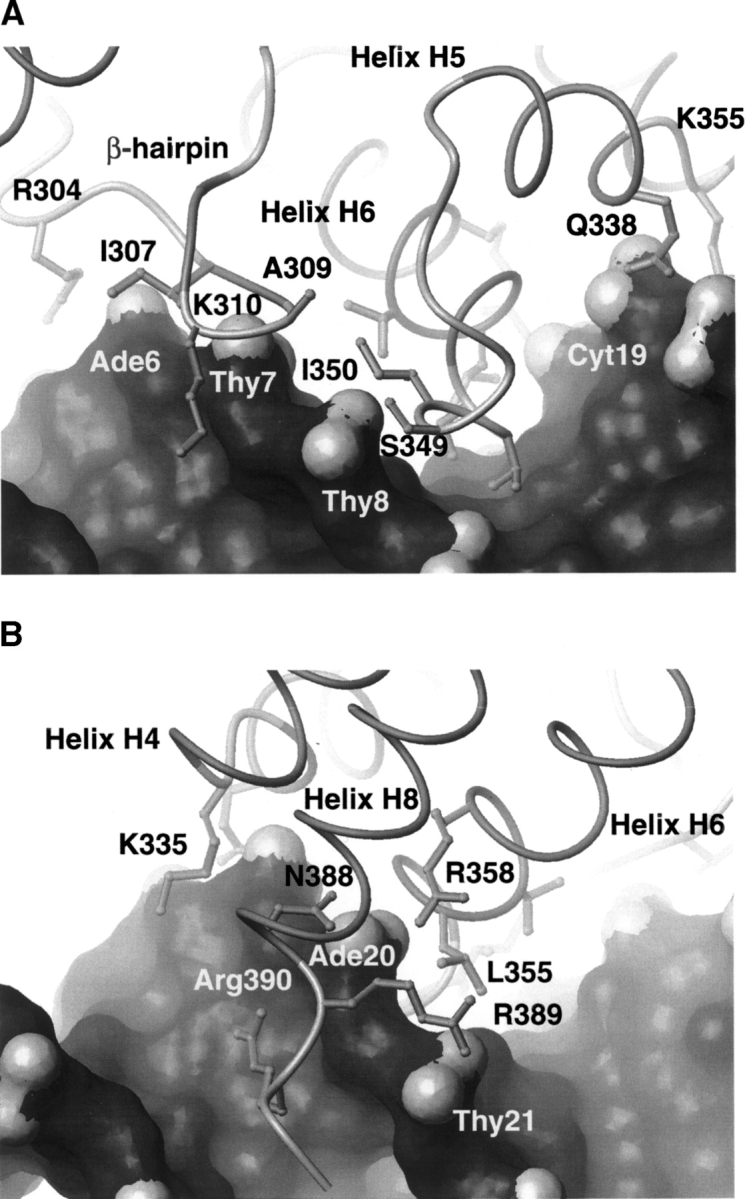
Isolated views of the protein–DNA interface. (A) View of the major groove and adjacent β-hairpin interface. Contacts between residues in the H5/H6 loop and β-hairpin are indicated. (B) View of the minor groove interface containing residues from the C-terminal tail. The figure also shows residues in helices H4 to H6 and H8, which form a pocket that contacts the phosphodiester backbone. Details of the contacts in the complex have been described elsewhere (Iwahara et al. 2002). In both panels the surface of the DNA is displayed with the oxygen atoms of the backbone shaded light gray.
Figure 5.

Coordinate precision in the DNA and free bound forms of the Dead ringer protein. Plot of the root mean square deviation (rmsd) of the backbone atom coordinates in the ensemble of conformers to the mean structure as a function of residues number for the DNA free (PDB 1C20; Iwahara and Clubb 1999b) (open circles) and bound structures (PDB 1KQQ; Iwahara et al. 2002) (black diamonds). A schematic of the secondary structure of the protein is drawn above the figure.
The flexible turn in the helix-turn-helix motif becomes partially immobilized
Binding specificity is achieved by inserting the H5/H6 loop into the major groove. The loop can be considered to be the “turn” of a noncanonical helix-turn-helix (HTH) motif and contributes hydroxyl-bearing side chains that make base-specific hydrogen bonds. Figure 7 ▶ shows a plot of the differences between the S2 values of the DNA-free and -bound proteins. The data indicate that motions in the loop are quenched upon DNA binding, since the average value of the available order parameters in this region increases from 0.70 to 0.82 upon DNA-binding (His345, Ser349, Ile350, and Thr351 in the free protein, and Leu346, Ser348, Ser349, and Ser352 in the DNA-bound state could be measured). Because of distinct patterns of resonance overlap, the backbone amide of Ser349 is the only residue whose relaxation could be analyzed in both states and it experiences a 0.09 increase in its order parameter. The mobility of the loop in the complex is reduced because several residues form new hydrogen bonds and hydrophobic interactions with the duplex (Fig. 6A ▶). For example, in the complex the hydrophobic side chains of Thr351 and Ile350 pack against the methyl group of Thy21 and the H8 atom of Gua9, respectively. These hydrophobic contacts position the side chains of Thr351 and Ser352 above the Ade10-Thy11 base-step for a series of intermolecular hydrogen bonds. In particular, in 100% and 85% of the 20 conformers in the ensemble, the hydroxyl groups of Thr351 and Ser352 accept a hydrogen bond from the Ade20 N6 amine, respectively. Further anchoring the loop in the groove are an array of less frequently observed interfacial direct and water mediated hydrogen bonds from the hydroxyls of Thr351 and Ser352 to bases near Ade20 (Iwahara et al. 2002).
Figure 7.

Plot of the differences between the S2 values of the DNA-free and -bound forms of the protein. S2 (Dead ringer ARIDPhe355Leu-DNA complex)-S2 (free Dead ringer ARIDPhe355Leu) is plotted as a function of residue number. A schematic of the secondary structure of the protein is drawn above the figure.
Micro- to millisecond timescale motions foreshadow a DNA-dependent conformational change
A conformational change in the protein is coupled to DNA binding and helps to immobilize the H5/H6 loop. As shown in Figure 4B ▶, DNA binding drives the rotation of the N-terminal subdomain (composed of helices H1 and H2 and the β-hairpin) relative to the remainder of the polypeptide. This results in an ~10 Å shift of the hairpin towards the H5/H6 loop enabling the side chains of Met308 and Ala309 within the hairpin to insert into the hydrophobic pocket formed by the side chains of Thr356 and Ile357 within helix H6 and Pro347 and Ile350 within the H5/H6 loop (Fig. 6A ▶). Interestingly, in addition to stabilizing the H5/H6 loop, DNA-binding induced rotation also immobilizes residues within the β-hairpin, since in the free protein the average S2 for these residues is 0.80, which increases to 0.86 upon complex formation. The most pronounced DNA-binding dependent increases in S2 occur in residues Lys310 and Ser311, which increase by 0.09 (Fig. 7 ▶). These changes would seem to result from contacts to the 5′ portion of the major groove interface, since the backbone amide atoms of Ala309 and Lys310 donate hydrogen bonds to the phosphate oxygens of Thy408 in over 90% of the conformers and salt-bridges to the adjacent phosphate groups are formed through the side chains of Arg304 and Lys310.
An inspection of the Rex data reveals that the DNA-free ARID is more dynamic on the micro- to millisecond time-scale as compared to the DNA-bound protein (cf. Figs. 2C ▶, 3C ▶). Excluding the termini, most of the residues in the free protein exhibiting dynamics on this timescale either reside in the N-terminal subdomain (helices H1, H2, or the β-hairpin) or the surface on the C-terminal domain contacted by the N-terminal subdomain (helix H3) (Fig. 2C ▶). This suggests that slow conformational dynamics that occur prior to binding may facilitate the DNA dependent rotation of the N-terminal subdomain. It is unclear why residues within the H5/H6 do not exhibit micro- to millisecond time scale motions, since this region of the protein forms a contact surface with β-hairpin after rotation of the N-terminal domain. Interestingly, motions in the H5/H6 loop slow down upon binding DNA, increasing from ~300 psec to 1.1 nsec. Although we did not directly measure Rex, it should be mentioned that slow dynamics on the micro-to-millisecond time scale can be characterized more accurately by applying experiments that can directly determine the Rex values (Kroenke et al. 1998; Loria et al. 1999).
The C-terminal tail is partially immobilized in the complex
An analysis of the relaxation data indicates that the C-terminal tail is partially immobilized in the complex (Fig. 7 ▶). Residues in the C terminus are very mobile on the picosecond timescale in the absence of DNA. For example, residues Asn388, Arg389, and Arg390 have S2 values 0.55, 0.33, and 0.26, respectively. These residues are only partially immobilized in the complex, since the S2 values of Asn388 and Arg389 in the complex are 0.70 and 0.52, respectively (Fig. 3A ▶). The decrease in mobility can be attributed to the formation of a salt-bridge between the side chain of Arg389 and the phosphate of Thy21, which helps to position the side chain of Arg390 for an array of contacts to the minor groove (Fig. 6B ▶). Arg390 is poised for a variety of favorable contacts to the O2 atoms of Thy13 and Cyt19, and the adjacent phosphodiester backbone. Further limiting the mobility of the tail are hydrogen-bonding contacts between Arg358 and Asn388, which link the HTH unit to helix H8. These residues also favorably contact the phosphate group of Ade20. In contrast to the C-terminal tail, the pocket formed by residues in helices H4 to H6 and H8 appears to act as a rigid scaffold to engulf the phosphodiester backbone of nucleotides Ade18 to Thy21 (Fig. 6B ▶), since their order parameters change only slightly. Interestingly, nitrogen-15 relaxation studies of the free and bound forms of the ARID from the Mrf protein reveal that the loop analogous to the H5/H6 loop in Dead ringer is immobilized in its complex with DNA (Zhu et al. 2001). Moreover, Mrf replaces helix H8 in Dead ringer with a disordered C-terminal that is also substantially immobilized. Although the structure of the Mrf–DNA complex has not yet been determined, these data suggest that all members of the structurally diverse ARID family undergo significant changes in their mobility upon binding DNA.
The interface retains flexibility after binding DNA
Although residues in the interfacial H5/H6 loop, β-hairpin, and C terminus are immobilized upon binding, in the complex they remain more mobile than residues located in regions of regular secondary structure (Fig. 3A ▶). Elevated mobility within the major groove is compatible with the structure, since the H5/H6 loop–DNA interaction surface is largely exposed to the solvent and thus presumably not restricted in its motion. This suggests that in addition to the primary hydrogen bonding contacts to the Ade20 N6 amine, flexibility may enable the formation of additional hydrogen bonds to nearby bases from the hydroxyls of Thr351 and Ser352; these contacts are present in the ensemble of structures, but occur less frequently than contacts to the Ade20 N6 amine. The C-terminal tail is especially mobile in the complex, with the DNA contacting residues of Asn388 and Arg389 exhibiting order parameters of 0.55 and 0.33, respectively. Compatible with its elevated mobility, few NOEs define the positioning of these residues and the structure of the tail is poorly defined (Fig. 5 ▶).
The effect of the Phe355Leu mutation on protein dynamics
Previously we demonstrated that the NMR spectrum of the DNA in the ARIDPhe355Leu–DNA complex has narrower line widths as compared to the DNA spectrum of the wild-type protein–DNA complex, a phenomenon that was critical for solving the NMR structure of the complex. In order to gain insights into the beneficial properties of the Phe355Leu mutation we measured the 15N T1, T2, and {1H-}15N NOEs of the wild-type ARID–DNA complex and interpreted these data using the model free formalism. A comparison of the T2 values of the wild-type and ARIDPhe355Leu–DNA complexes reveals no major differences, consistent with our previous finding that the mutation primarily affects the line-widths of the DNA. Intriguingly, a comparison of the S2 parameters of the mutant and wild-type complexes reveals that the backbone amide groups at the C-terminal interface are more rigid in the wild-type complex (Asn388, 0.85 [wild-type] and 0.70 [mutant]; Arg389, 0.73 [wild-type] and 0.52 [mutant]). This finding is compatible with the three-dimensional structure of the Dead ringer ARIDPhe355Leu–DNA complex, since the side chain of Leu355 makes hydrophobic contacts with a thymine base near the C-terminal interface (Iwahara et al. 2002). It is possible that the mutation introduces unfavorable contacts at this thymine, which makes the C-tail less stable; a conclusion that is consistent with the lower affinity of the mutant protein for the target site as compared to the wild-type protein (Iwahara et al. 2002).
DNA binding increases the mobility of helix H1
As shown in Figure 7 ▶, the S2 parameters of the N-terminal portion of the helix H1 (residues Phe265, Glu266, Glu267, Lys270) decrease upon DNA-binding, indicating that it becomes more mobile in the DNA-bound state on the picosecond timescale. In principle, the decrease might be caused by the higher temperature used to collect the relaxation data of the complex (310 K for the complex; 303 K for the free protein). However, this seems unlikely, since judging from the recent publications on the temperature-dependence of S2 (Mandel et al. 1996), the temperature difference of 7 K can not fully account for the observed S2 changes that are as large as ~0.2 in this region (Fig. 7 ▶). These changes likely result from the conformational change in the protein that occurs when it binds DNA (Fig. 4B ▶) (Iwahara et al. 2002). Presumably, the DNA-induced rotation and displacement of the N-terminal subdomain breaks protein–protein contacts between residues in helix H1 and the body of the protein, thereby increasing helix H1 mobility. This would seem to have a favorable effect of the energetics of binding, partially negating the entropic cost of immobilizing residues at the interface.
It is also conceivable that helix H1 serves a regulatory role in DNA binding that is analogous to the inhibitory helix of the Ets DNA-binding domain. In Ets, the energetic cost associated with unfolding its inhibitory helix reduces the affinity of the domain for DNA (Petersen et al. 1995). Interestingly, the helix serves a regulatory role, since binding of GABPβ displaces it from an inhibitory position, thereby increasing the binding affinity of Ets (Batchelor et al. 1998). Helix H1 may play a similar role, since modeling studies using the structure of the protein solved in the absence of DNA indicate that the N-terminal portion of helix H1 must be moved through the aforementioned conformational change in order for Dead ringer to bind B-form DNA. Helices analogous to H1 are found in the extended and N-terminally extended members of the ARID family, and similar to the Ets domain, could potentially be sites of interaction with other proteins that stabilize protein conformations better suited for DNA binding.
Material and methods
Backbone 15N relaxation measurements
The NMR samples of free proteins of 15N-labeled Dead ringer ARIDPhe355Leu and its complex with the 15-bp DNA fragment (dCCTGTATTGATGTGG/dCCACATCAATACAGG; unlabeled) were prepared in the same method as described previously (Iwahara and Clubb 1999a,b; Iwahara et al. 2002). The NMR buffer contained 20 mM Tris HCl (pH 6.7), 2 mM DTT, 0.5 mM EDTA, 0.01% NaN3, 7% D2O. For the sample of the free protein, 100 mM NaCl was also included for the sample stability. The sample concentrations of the free protein and the protein–DNA complex were 1.5 mM. The DNA fragment in the complex was unlabeled.
NMR measurements were performed with Bruker DRX-500 and DRX-600 spectrometers operated at 1H frequencies of 500.09 MHz and 600.13 MHz, respectively. Backbone amide 15N T1, T2, and {1H-}15N NOE were measured at both magnetic fields. The temperatures during NMR measurements were 303 K for the free protein and 310 K for the complex. The temperature at the probe head was determined using the temperature-dependence of the difference between the methyl and hydroxyl 1H chemical shifts of methanol. Backbone 15N T1 relaxation times were measured with 2D 1H-15N experiments according to Farrow and colleagues (Farrow et al. 1994). To gain sensitivity and better resolution, the “semi-constant time” technique (Grzesiek and Bax 1993) was implemented in the 15N dimension. Typically, seven time points in the range of 0.01–1.8 sec for T1 relaxation were recorded. Because it has been noted that off-resonance effects in CPMG experiments can introduce errors in the measured T2 values (Ross et al. 1997; Korzhnev et al. 2000), the T2 relaxation times were calculated using the equation
 |
where the tilt angle λ of the effective field is calculated for each resonance based on the r.f. strength of the spin-lock and 15N chemical shift (Davis et al. 1994; Tjandra et al. 1996b). T1ρ relaxation times under a 2 kHz 15N spin-lock field were measured with 2D 1H-15N experiments (Palmer 2001; Peng et al. 2001). During the 15N-spin-lock, 1H 180 pulses were applied with an interval of 4 msec to prevent cross-correlation between dipolar-interaction and CSA relaxation mechanisms (Kay et al. 1992; Palmer et al. 1992; Palmer 2001). Typically, seven different spin-lock lengths from 4 msec to 152 msec were used. T1 and T1ρ relaxation times were determined with two-parameter fitting to an exponential function using peak heights. Errors in the T1 and T1ρ values were estimated from the noise levels in the spectra {1H-}15N NOE values were measured with the water-flip back 2D 1H-15N experiment (Grzesiek and Bax 1993). The errors of the NOE values were estimated from the noise levels of the spectra and were set to no less than 0.08 because of the relatively low accuracy of the standard {1H-}15N NOE measurements (Idiyatullin et al. 2001). Spectra were processed using NMRPipe. The program NMRView (version 4.1.3) was utilized for peak intensity quantification and to calculate the T1 and T1ρ values.
Calculation of inertia tensor and radius of gyration of the free protein and the complex
The inertia tensor and radius of gyration of the free protein and the complex were calculated from the structures of the free protein and protein–DNA complex (Iwahara and Clubb 1999b; Iwahara et al. 2002). The inertia tensors were calculated according to Browner et al. (1992). The inertia tensor I is defined as:
 |
where ri is the position vector of the i th atom from the center of the mass of the molecule; xi, yi, zi, are the x, y, and z components of the vector ri; mi is the mass of the i th atom. The eigenvectors and eigenvalues of I were calculated, which correspond to principle axis of inertia and inertial moments around them, respectively. The mass of each nitrogen atom in the protein was assumed to be 15, since the NMR samples were labeled with 15N. The radius of gyration of the free protein and the complex were calculated as an atomic RMS difference between the centroid and individual atoms (Kuszewski et al. 1999):
 |
where rc is the position vector of the centroid and N is the total number of atoms. Disordered regions at the N and C termini were included in the calculation, because they also affect the inertia moments and the radius of gyration (Clubb et al. 1995).
Calculation of rotational diffusion tensor
Calculations of the rotational anisotropy were performed by nonlinear least square fitting of the χ2 function defined as:
 |
where the σ values are experimental errors in T1/T2. Two anisotropy models were used, full asymmetric diffusion (Dzz > Dxx > Dyy) and axially symmetric diffusion (Dzz > Dxx = Dyy or Dzz = Dxx > Dyy). Nonlinear least square fitting was performed using the Levenberg-Marquardt algorithm. The Jacobian matrix in the fitting procedure was calculated with numerical differentiation rather than the derivative of the fitting function. In-house programs were used to calculate the inertia tensor, radius of gyration, and the diffusion tensor.
Calculation of order parameters, internal correlation times, and exchange contributions
The program Modelfree version 4.0 (A.G. Palmer 3rd, Columbia University) was used to calculate the order parameters S2, the internal correlation times τe, and the exchange contributions to the transverse relaxation rates. Calculations were performed assuming axially symmetric rotational diffusion with D||/D⊥, the effective correlation time τc,eff, and the polar angles about the symmetric axis obtained using the methods described above. Five model functions were used: (1) S2; (2) S2 and Rex; (3) S2 and τe; (4) S2, Sf2, τe; and (5) S2, τe, Rex (Clore et al. 1990; Mandel et al. 1995). Model selection was based on an analysis of the J(ω) profiles according to Ishima et al. (Ishima and Nagayama 1995). Uniform 15N CSA values of −172 ppm and rNH = 1.02 Å were assumed (Tjandra et al. 1996a; Palmer 2001).
Acknowledgments
We thank Dr. Mandar Naik for useful discussions. This work was supported by grants from the U.S. Department of Energy (DE-FC-03-87ER60615) and the NIH (R01 GM57487).
Article published online ahead of print. Article and publication date are at http://www.proteinscience.org/cgi/doi/10.1110/ps.041154405.
References
- Batchelor, A.H., Piper, D.E., de la Brousse, F.C., McKnight, S.L., and Wolberger, C. 1998. The structure of GABPα/β: An ETS domain-ankyrin repeat heterodimer bound to DNA. Science 279 1037–1041. [DOI] [PubMed] [Google Scholar]
- Blackledge, M., Cordier, F., Dosset, P., and Marion, D. 1998. Precision and uncertainty in the characterization of anisotropic rotational diffusion by 15N relaxation. J. Am. Chem. Soc. 120 4538–4539. [Google Scholar]
- Browner, M.F., Fauman, E.B., and Fletterick, R.J. 1992. Tracking conformational states in allosteric transitions of phosphorylase. Biochemistry 31 11297–11304. [DOI] [PubMed] [Google Scholar]
- Clore, G.M., Driscoll, P.C., Wingfield, P.T., and Gronenborn, A.M. 1990. Analysis of the backbone dynamics of interleukin-1 β using two-dimensional inverse detected heteronuclear 15N-1H NMR spectroscopy. Biochemistry 29 7387–7401. [DOI] [PubMed] [Google Scholar]
- Clubb, R.T., Omichinski, J.G., Sakaguchi, K., Appella, E., Gronenborn, A.M., and Clore, G.M. 1995. Backbone dynamics of the oligomerization domain of p53 determined from 15N NMR relaxation measurements. Protein Sci. 4 855–862. [DOI] [PMC free article] [PubMed] [Google Scholar]
- Collins, R.T., Furukawa, T., Tanese, N., and Treisman, J.E. 1999. Osa associates with the Brahma chromatin remodeling complex and promotes the activation of some target genes. EMBO J. 18 7029–7040. [DOI] [PMC free article] [PubMed] [Google Scholar]
- Copie, V., Tomita, Y., Akiyama, S.K., Aota, S., Yamada, K.M., Venable, R.M., Pastor, R.W., Krueger, S., and Torchia, D.A. 1998. Solution structure and dynamics of linked cell attachment modules of mouse fibronectin containing the RGD and synergy regions: comparison with the human fibronectin crystal structure. J. Mol. Biol. 277 663–682. [DOI] [PubMed] [Google Scholar]
- Dallas, P.B., Pacchione, S., Wilsker, D., Bowrin, V., Kobayashi, R., and Moran, E. 2000. The human SWI-SNF complex protein p270 is an ARID family member with non-sequence-specific DNA binding activity. Mol. Cell. Biol. 20 3137–3146. [DOI] [PMC free article] [PubMed] [Google Scholar]
- Davis, D.G., Perlman, M.E., and London, R.E. 1994. Direct measurements of the dissociation-rate constant for inhibitor-enzyme complexes via the T1 ρ and T2 (CPMG) methods. J. Magn. Reson. B 104 266–275. [DOI] [PubMed] [Google Scholar]
- Farrow, N.A., Zhang, O., Forman-Kay, J.D., and Kay, L.E. 1994. A heteronuclear correlation experiment for simultaneous determination of 15N longitudinal decay and chemical exchange rates of systems in slow equilibrium. J. Biomol. NMR 4 727–734. [DOI] [PubMed] [Google Scholar]
- Fushman, D. and Cowburn, D. 1999. The effect of noncollinearity of 15N-1H dipolar and 15N CSA tensors and rotational anisotropy on 15N relaxation, CSA/dipolar cross correlation, and TROSY. J. Biomol. NMR 13 139–147. [DOI] [PubMed] [Google Scholar]
- Garvie, C.W. and Wolberger, C. 2001. Recognition of specific DNA sequences. Mol. Cell 8 937–946. [DOI] [PubMed] [Google Scholar]
- Goodman, J.L., Pagel, M.D., and Stone, M.J. 2000. Relationship between protein structure and dynamics from a database of NMR-derived backbone order parameters. J. Mol. Biol. 295 963–978. [DOI] [PubMed] [Google Scholar]
- Gregory, S.L., Kortschak, R.D., Kalionis, B., and Saint, R. 1996. Characterization of the dead ringer gene identifies a novel, highly conserved family of sequence-specific DNA-binding proteins. Mol. Cell. Biol. 16 792–799. [DOI] [PMC free article] [PubMed] [Google Scholar]
- Grzesiek, S. and Bax, A. 1993. The importance of not saturating H2O in protein Nmr—application to sensitivity enhancement and Noe measurements. J. Am. Chem. Soc. 115 12593–12594. [Google Scholar]
- Herrscher, R.F., Kaplan, M.H., Lelsz, D.L., Das, C., Scheuermann, R., and Tucker, P.W. 1995. The immunoglobulin heavy-chain matrix-associating regions are bound by Bright: A B cell-specific trans-activator that describes a new DNA-binding protein family. Genes Dev. 9 3067–3082. [DOI] [PubMed] [Google Scholar]
- Idiyatullin, D., Daragan, V.A., and Mayo, K.H. 2001. Improved measurement of (15)N-[(1)H] NOEs in the presence of H(N)-water proton chemical exchange. J. Magn. Reson. 153 138–143. [DOI] [PubMed] [Google Scholar]
- Ishima, R. and Nagayama, K. 1995. Protein backbone dynamics revealed by quasi spectral density function analysis of amide N-15 nuclei. Biochemistry 34 3162–3171. [DOI] [PubMed] [Google Scholar]
- Ishima, R., Yamasaki, K., Saito, M., and Nagayama, K. 1995. Spectral densities of nitrogen nuclei in Escherichia coli ribonuclease HI obtained by 15N NMR relaxation and molecular dynamics. J. Biomol. NMR 6 217–220. [DOI] [PubMed] [Google Scholar]
- Iwahara, J. and Clubb, R.T. 1999a. Letter to the Editor: H-1, C-13 and N-15 resonance assignments of the AT-rich interaction domain from the Dead Ringer protein. J. Biomol. NMR 15 85–86. [DOI] [PubMed] [Google Scholar]
- ———. 1999b. Solution structure of the DNA binding domain from Dead ringer, a sequence-specific AT-rich interaction domain (ARID). EMBO J. 18 6084–6094. [DOI] [PMC free article] [PubMed] [Google Scholar]
- Iwahara, J., Iwahara, M., Daughdrill, G.W., Ford, J., and Clubb, R.T. 2002. The structure of the Dead ringer-DNA complex reveals how AT-rich interaction domains (ARIDs) recognize DNA. EMBO J. 21 1197–1209. [DOI] [PMC free article] [PubMed] [Google Scholar]
- Jen-Jacobson, L. 1997. Protein-DNA recognition complexes: Conservation of structure and binding energy in the transition state. Biopolymers 44 153–180. [DOI] [PubMed] [Google Scholar]
- Kay, L.E., Nicholson, L.K., Delaglio, F., Bax, A., and Torchia, D. 1992. Pulse sequences for the effects of cross correlation between dipolar and chemical shift anisotropy relaxation mechanisms on the measurement of heteronuclear T1 and T2 values in proteins. J. Magn. Reson. 97 359–375. [Google Scholar]
- Kim, S., Zhang, Z., Upchurch, S., Isern, N., and Chen, Y. 2004. Structure and DNA-binding sites of the SWI1 AT-rich interaction domain (ARID) suggest determinants for sequence-specific DNA recognition. J. Biol. Chem. 279 16670–16676. [DOI] [PubMed] [Google Scholar]
- Kortschak, R.D., Tucker, P.W., and Saint, R. 2000. ARID proteins come in from the desert. Trends Biochem. Sci. 25 294–299. [DOI] [PubMed] [Google Scholar]
- Korzhnev, D.M., Tischenko, E.V., and Arseniev, A.S. 2000. Off-resonance effects in 15N T2 CPMG measurements. J. Biomol. NMR 17 231–237. [DOI] [PubMed] [Google Scholar]
- Kroenke, C.D., Loria, J.P., Lee, L.K., Rance, M., and Palmer 3rd, A.G. 1998. Longitudinal and transverse 1H-15N dipolar/15N chemical shift anisotropy relaxation interference: Unambiguous determination of rotational diffusion tensors and chemical exchange effects in biological macromolecules. J. Am. Chem. Soc. 120 7905–7915. [Google Scholar]
- Kuszewski, J., Gronenborn, A.M., and Clore, G.M. 1999. Improving the packing and accuracy of NMR structures with a pseudopotential for the radius of gyration. J. Am. Chem. Soc. 121 2337–2338. [Google Scholar]
- Loria, J.P., Rance, M., and Palmer 3rd, A.G. 1999. A relaxation-compensated Carr-Purcell-Meiboom-Gill sequence for characterizing chemical exchange by NMR spectroscopy. J. Am. Chem. Soc. 121 2331–2332. [Google Scholar]
- Luginbuhl, P., Pervushin, K.V., Iwai, H., and Wuthrich, K. 1997. Anisotropic molecular rotational diffusion in 15N spin relaxation studies of protein mobility. Biochemistry 36 7305–7312. [DOI] [PubMed] [Google Scholar]
- Mandel, A.M., Akke, M., and Palmer 3rd, A.G. 1995. Backbone dynamics of Escherichia coli ribonuclease HI: Correlations with structure and function in an active enzyme. J. Mol. Biol. 246 144–163. [DOI] [PubMed] [Google Scholar]
- ———. 1996. Dynamics of ribonuclease H: Temperature dependence of motions on multiple time scales. Biochemistry 35 16009–16023. [DOI] [PubMed] [Google Scholar]
- Nadassy, K., Wodak, S.J., and Janin, J. 1999. Structural features of protein-nucleic acid recognition sites. Biochemistry 38 1999–2017. [DOI] [PubMed] [Google Scholar]
- Osborne, M.J., Schnell, J., Benkovic, S.J., Dyson, H.J., and Wright, P.E. 2001. Backbone dynamics in dihydrofolate reductase complexes: Role of loop flexibility in the catalytic mechanism. Biochemistry 40 9846–9859. [DOI] [PubMed] [Google Scholar]
- Pabo, C.O., Krovatin, W., Jeffrey, A., and Sauer, R.T. 1982. The N-terminal arms of λ repressor wrap around the operator DNA. Nature 298 441–443. [DOI] [PubMed] [Google Scholar]
- Palmer 3rd, A.G. 2001. NMR probes of molecular dynamics: Overview and comparison with other techniques. Annu. Rev. Biophys. Biomol. Struct. 30 129–155. [DOI] [PubMed] [Google Scholar]
- Palmer 3rd, A.G., Skelton, N.J., Chazin, W.J., Wright, P.E., and Rance, M. 1992. Suppression of the effects of cross-correlation between dipolar and anisotropic chemical shift relaxation mechanisms in the measurement of spin-spin relaxation rates. Mol. Phys. 75 699–711. [Google Scholar]
- Patikoglou, G. and Burley, S.K. 1997. Eukaryotic transcription factor-DNA complexes. Annu. Rev. Biophys. Biomol. Struct. 26 289–325. [DOI] [PubMed] [Google Scholar]
- Peng, J.W., Thanabal, V., and Wagner, G. 2001. Improved accuracy of heteronuclear transverse relaxation time measurements in macromolecules, elimination of antiphase contributions. J. Magn. Reson. 95 421–427. [Google Scholar]
- Petersen, J.M., Skalicky, J.J., Donaldson, L.W., McIntosh, L.P., Alber, T., and Graves, B.J. 1995. Modulation of transcription factor Ets-1 DNA binding: DNA-induced unfolding of an α helix. Science 269 1866–1869. [DOI] [PubMed] [Google Scholar]
- Ross, A., Czisch, M., and King, G.C. 1997. Systematic errors associated with the CPMG pulse sequence and their effect on motional analysis of biomolecules. J. Magn. Reson. 124 355–365. [Google Scholar]
- Spolar, R.S. and Record Jr., M.T. 1994. Coupling of local folding to site-specific binding of proteins to DNA. Science 263 777–784. [DOI] [PubMed] [Google Scholar]
- Tjandra, N., Feller, S.E., Pastor, R.W., and Bax, A. 1995. Rotational diffusion anisotropy of human ubiquitin from 15N NMR relaxation. J. Am. Chem. Soc. 117 12562–12566. [Google Scholar]
- Tjandra, N., Grzesiek, S., and Bax, A. 1996a. Magnetic field dependence of nitrogen-proton J splittings in N-15-enriched human ubiquitin resulting from relaxation interference and residual dipolar coupling. J. Am. Chem. Soc. 118 6264–6272. [Google Scholar]
- Tjandra, N., Wingfield, P., Stahl, S., and Bax, A. 1996b. Anisotropic rotational diffusion of perdeuterated HIV protease from 15N NMR relaxation measurements at two magnetic fields. J. Biomol. NMR 8 273–284. [DOI] [PubMed] [Google Scholar]
- Valentine, S.A., Chen, G., Shandala, T., Fernandez, J., Mische, S., Saint, R., and Courey, A.J. 1998. Dorsal-mediated repression requires the formation of a multiprotein repression complex at the ventral silencer. Mol. Cell. Biol. 18 6584–6594. [DOI] [PMC free article] [PubMed] [Google Scholar]
- Whitson, R.H., Huang, T., and Itakura, K. 1999. The novel Mrf-2 DNA-binding domain recognizes a five-base core sequence through major and minor-groove contacts. Biochem. Biophys. Res. Commun. 258 326–331. [DOI] [PubMed] [Google Scholar]
- Wilsker, D., Patsialou, A., Dallas, P.B., and Moran, E. 2002. ARID proteins: A diverse family of DNA binding proteins implicated in the control of cell growth, differentiation, and development. Cell Growth Differ. 13 95–106. [PubMed] [Google Scholar]
- Wright, P.E. and Dyson, H.J. 1999. Intrinsically unstructured proteins: Reassessing the protein structure-function paradigm. J. Mol. Biol. 293 321–331. [DOI] [PubMed] [Google Scholar]
- Yuan, Y.C., Whitson, R.H., Liu, Q., Itakura, K., and Chen, Y. 1998. A novel DNA-binding motif shares structural homology to DNA replication and repair nucleases and polymerases. Nat. Struct. Biol. 5 959–964. [DOI] [PubMed] [Google Scholar]
- Zhu, L., Hu, J., Lin, D., Whitson, R., Itakura, K., and Chen, Y. 2001. Dynamics of the mrf-2 DNA-binding domain free and in complex with DNA. Biochemistry 40 9142–9150. [DOI] [PubMed] [Google Scholar]