

Abstract
We report the three-dimensional structure of a late embryogenesis abundant (LEA) protein from Arabidopsis thaliana gene At1g01470.1. This protein is a member of Pfam cluster PF03168, and has been classified as a LEA14 protein. LEA proteins are expressed under conditions of cellular stress, such as desiccation, cold, osmotic stress, and heat. The structure, which was determined by NMR spectroscopy, revealed that the At1g01470.1 protein has an αβ-fold consisting of one α-helix and seven β-strands that form two antiparallel β-sheets. The closest structural homologs were discovered to be fibronectin Type III domains, which have <7% sequence identity. Because fibronectins from animal cells have been shown to be involved in cell adhesion, cell motility, wound healing, and maintenance of cell shape, it is interesting to note that in plants wounding or stress results in the overexpression of a protein with fibronectin Type III structural features.
Keywords: LEA, LEA14, NMR spectroscopy, structural genomics, fibronectin Type III fold
The late embryogenesis abundant (LEA) proteins are a group of heterogeneous proteins originally found in plants but subsequently in other species. These proteins are thought to play a role in the stress response of various organisms, including algae, bacteria, yeast, and plants. In higher plants, LEA proteins are expressed at different stages of late embryogenesis, in seed embryos, and under various conditions of stress including desiccation. Seed maturation is characterized by the expression and accumulation of LEA proteins in the embryo. In general, expression of LEA proteins has been associated with water deficiency in plant tissues and dehydration in seeds. LEA proteins are found in different tissues and in all cell types; they have been found to accumulate in cytoplasm and plastids. The very nature of this wide cellular distribution infers a protective function (Schneider et al. 1993; Wolkers et al. 1998; Bartels and Salamini 2001). Furthermore, LEA proteins and heat-shock proteins have been shown to be involved in protecting macromolecules, such as enzymes and lipids (Shinozaki and Yamaguchi-Shinozaki 2000; Seki et al. 2002). Although extensive studies have been carried out documenting the responses of various types of LEA proteins to different abiotic as well as biotic conditions, the true biochemical functions of these loosely related proteins are not fully understood.
Recently, several putative LEA genes have been found in nonplant species, such as bacteria, Bacillus subtilis (Stacy and Aalen 1998) and Deinococcus radiodurans (Battista et al. 2001; Makarova et al. 2001); yeast, Saccharomyces cerevisiae (Sales et al. 2000); green algae, Chlorella vulgaris (Honjoh et al. 2000); and nematode, Aphelenchus avenae (Browne et al. 2002, 2004; Goyal et al. 2003), Steinernema feltiae (Gal et al. 2003), and Caenorhabditis elegans (Gal et al. 2004). It appears that the functional role that LEA protein plays across all species is related to the response to stress conditions from desiccation, osmotic stress, and/or cold.
The classification and grouping of LEA proteins generally is based on their similarity to prototypical LEA proteins from the cotton plant, Gossypium hirsutum. However, alternative classifications by different laboratories have resulted in inconsistent groupings and designations. Recently, a comprehensive computational reanalysis of LEA proteins has been carried out. In this analysis, 112 LEA protein sequences were analyzed and grouped into several different classifications (Wise 2003).
The target selection algorithm at the Center for Eukaryotic Structural Genomics (CESG) chose Arabidopsis thaliana protein At1g01470.1 (151 amino acid residues) in part because no structure in the Protein Data Bank showed >30% sequence identity. At1g01470.1 has been annotated as a member of a relatively small family within the LEA protein superfamily (Pfam cluster PF03168, LEA_2). The three-dimensional structure of this protein, which we report here, represents the first for a LEA protein. Because members of the larger Group 1 and Group 2 LEA protein families have been shown to be largely unstructured (Eom et al. 1996; Lisse et al. 1996; Soulages et al. 2002, 2003), this report of a stable three-dimensional structure for a LEA14 protein suggests an important distinction in the classification of these proteins.
Results
Resonance assignments and secondary structure
NMR spectra of At1g01470.1 in 10 mM NaPO4 (pH 6.5) were recorded at 25°C. The 1H-15N HSQC spectrum of 1 mM At1g01470.1 revealed peaks of uniform shape and intensity indicative of a well-folded protein (Fig. 1 ▶). At1g01470.1 is a 17.5-kDa protein consisting of 151 residues (11 prolines). Measurement of amide backbone 15N T2 relaxation values (data not shown) gave an average value of 60 ± 10 msec; this indicated that At1g01470.1 is monomeric under these solution conditions. Nearly complete 1H, 15N, and 13C assignments were obtained by using standard resonance assignment procedures (see Materials and Methods).
Figure 1.
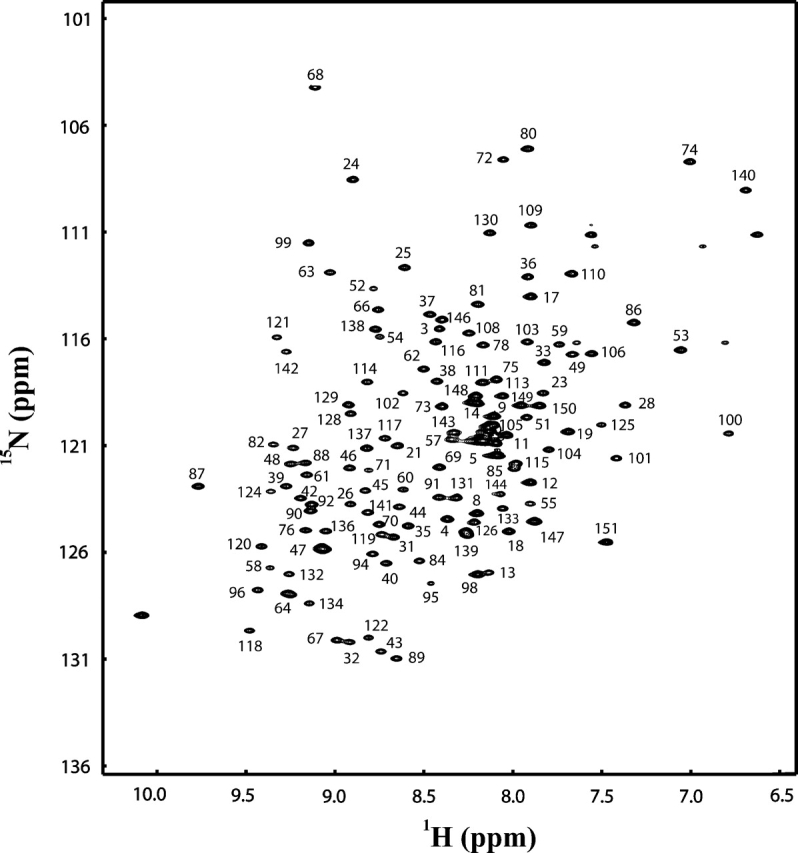
2D 15N-1H HSQC spectrum of At1g01470.1 protein. Resonance assignments are indicated by the residue number.
Elements of secondary structure within At1g01470.1 were identified by chemical shift index (CSI) analysis (Wishart and Sykes 1994) as well as through analysis of 15N-edited and 13C-edited NOESY-HSQC spectra. The protein contains seven β-strands (residues 28–31, 38–48, 58–65, 71–78, 87–97, 113–124, and 132–143) and one α-helix (residues 98–111). Strands 1, 2, and 5 form one antiparallel β-sheet, and strands 3, 4, 6, and 7 form a second antiparallel β-sheet. The long α-helix lies almost perpendicular to the two β-sheets.
Three-dimensional structure
The short-range sequential NOE values and backbone carbon chemical shifts (Fig. 2 ▶) served to define the secondary structural elements, which were confirmed by analysis of TALOS results. The global fold was established on the basis of unambiguously assigned long-range NOEs obtained from a 3D-NOESY-(13C,1H)-HSQC and 3D-NOESY-(15N,1H)-HSQC spectra. Most of the NOEs in the 3D-NOESY-(15N,1H)-HSQC and in the 3D-NOESY-(13C,1H)-HSQC were manually assigned as unambiguous constraints. Unassigned NOEs with multiple possible assignments were used in ARIA (Habeck et al. 2004) as ambiguous constraints.
Figure 2.

Summary of backbone 13Cα and 13Cβ secondary shifts and local NOE connectivities plotted as a function of the amino acid sequence of the At1g01470.1 protein.
The ensemble of conformers representing the structure was calculated with the program ARIA by simulated annealing. The input data consisted of 3099 unambiguous and 170 ambiguous distance constraints, 142 TALOS (Cornilescu et al. 1999) derived dihedral angle constraints, and 112 inferred H-bond distance constraints. The residual dipolar couplings used for structure refinement were calculated as differences between coupling measurements for protein in anisotropic and isotropic phases. The PALES program (Zweckstetter and Bax 2000) was used to determine the axial and the rhombic components of the alignment tensor. Owing to spectral overlap, only 68 NH dipolar couplings were used in the structure refinement. Inclusion of RDC constraints in the final structure calculations increased the coordinate precision from 1.75 ± 0.36 Å to 0.59 ± 0.1 Å for the backbone atoms, and from 2.59 ± 0.41 Å to 1.2 ± 0.17 Å (Fig. 3C ▶) for all heavy atoms (residues 24–145). A summary of the experimental constraints and structural statistics is provided in Table 1. PROCHECK analysis of the ensemble of 20 conformers revealed that 75% of the residues lie in the most favored regions, 18.3% of the residues lie in allowed regions, 5.8% of the residues lie in the generously allowed regions, and 1% of the residues lie in the disallowed regions. A superposition of the final ensemble of 20 simulated annealing structures out of 100 calculated structures selected based on low total energy is shown in Figure 3A ▶ and a stereo view of the representative (closest to average) structure in Figure 3B ▶.
Figure 3.

The NMR solution structure of At1g01470.1 protein. (A) Backbone stereoview (residues 1–101) of the NMR ensemble (20 structures); the β-strands are colored in blue, α-helix in red, and the rest in gray. (B) Ribbon view of representative At1g01470.1 structure (closest to average) for residues 1–101. Numbers represent the order of β-strands, and the N and C termini of the protein are labeled. The structures were generated with the molecular graphics program MOLMOL (Koradi et al. 1996). (C) Backbone (N, Cα, C′) atomic RMSD values plotted as a function of residue number.
Table 1.
Structure statistics for LEA Protein (At1g01470.1)
| RMSD (Å) with respect to mean: | |
| Heavy backbone atoms (residues 24–145) | 0.59 ± 0.1 |
| All heavy atoms (residues 24–145) | 1.20 ± 0.17 |
| Number of experimental restraints | |
| Intraresidue NOEs | 1181 |
| Interresidue sequential NOEs (|i–j| = 1) | 46 |
| Interresidue medium range NOEs (1<|i–j|<5) | 1147 |
| Interresidue long range NOEs (|i–j|>4) | 395 |
| Total NOEs | 3269 |
| Dihedral angle restraints | 142 |
| H-bond restraints | 112 |
| RDC restraints | 68 |
| Restraint violationsa | |
| NOE distances with violations >0.3 Å | 5.85 ± 2.4 |
| Dihedrals with violations >3° | 4.63 ± 1.3 |
| RMSD for experimental restraintsb | |
| RDC (1DNH) | 3.65 ± 0.02 |
| All distance restraints (3381) (Å) | 0.09 ± 0.03 |
| Torsion angles (96) (degrees) | 1.73 ± 0.19 |
| CNS energies from SAc | |
| FvdW (kcal mol−1) | −264 ± 32 |
| Felec (kcal mol−1)d | −5224 ± 102 |
| RMSD (Å) from idealized covalent geometry | |
| Bonds (°) | 0.0054 ± 0.00 |
| Angles (°) | 0.75 ± 0.02 |
| Impropers (°) | 2.47 ± 0.07 |
| Ramachandran analysis (residues 24–145) | |
| Residues in the favored region (%) | 75.0 |
| Residues in additional allowed regions (%) | 18.3 |
| Residues in generously allowed regions (%) | 5.8 |
| Residues in disallowed regions (%) | 1.0 |
Based on the 20 conformers obtained by simulated annealing in CNS followed by refinement in explicit water using NOE distance restraints, RDC restraints, hbonds restraints, dihedral angle restraints, bonds, angles, impropers, dihedral angle, van der Waals, and electrostatic energy terms.
a No distances were violated by>0.5 Å, and no dihedral angle restraints were violated by>5°.
b The number of each class of experimental restraints is given in parentheses.
c Force constants as described in the text.
d Lennard-Jones 6–12 and Coulomb energy terms were calculated within CNS by using the OPLS nonbonded parameters (as described in the text).
Discussion
Sequence homologs
This work represents the first three-dimensional structure of a LEA protein and signifies an important step toward understanding structure–function relationships in the protein family. At1g01470.1 from A. thaliana is classified as a “LEA14 protein,” a class of LEA proteins found in many plant species. At1g01470.1 belongs to Pfam cluster PF03168, which contains 25 sequences of domains known as “LEA_2,” all found only in plants. Of these, 15 are nonredundant sequences derived from 12 diverse species of plant ranging from a common weed to commercially important crops such as rice, soybeans, tomatoes, and apricots: A. thaliana, Brassica napus (rape), Capsicum annuum (bell pepper), Lycopersicon esculentum (tomato), Craterostigma plantagineum (resurrection plant), Euphorbia esula (leafy spurge), Glycine max (soybean), Gossypium hirsutum (upland cotton), Oryza sativa (japonica cultivar-group), Prunus armeniaca (apricot), Pseudotsuga menziesii (Douglas fir), and Pyrus communis (pear).
LEA14 proteins may be atypical with regard to the larger classification. Group 1 and Group 2 LEA proteins have considerable low complexity and appear to be dynamically disordered (Eom et al. 1996; Soulages et al. 2002, 2003). For example, a Group 1 LEA protein from soybean showed no detectable unfolding transition by differential scanning calorimetry (Russouw et al. 1997). In addition, a recombinant dehydrin-like desiccation stress protein from the resurrection plant (C. plantagineum) displayed no defined three-dimensional structure by NMR spectroscopy (Lisse et al. 1996). Although Group 1 and 2 LEA proteins appeared to become more structured at low temperatures or in the presence of sodium dodecyl sulfate or trifluoroethanol, they did not develop a stable tertiary structure (Lisse et al. 1996; Ismail et al. 1999; Soulages et al. 2002, 2003).
Fold classification
Structural homologs identified by the DALI server (Holm and Sander 1993) had minimal sequence identity (4%–6%) with At1g01470.1. The closest structure homolog to At1g01470.1 (Fig. 4 ▶) was a fragment from the human blood coagulation factor XIII zymogen (PDB 1F13), which showed a 119-residue equivalence with 6% sequence identity and 3.8 Å RMSD to At1g01470.1. Factor XIII zymogen is activated by thrombin to factor XIIIa, a highly specific transglutaminase that cross-links the amide nitrogen of glutamines and ɛ-amino group of lysines in the fibrin monomers to form a stable blood clot (Yee et al. 1994). A second structural homolog was a bacterial protein of unknown function Shewanella oneidensis (PDB 1TZA), which showed a 107-residue equivalence with 6% sequence identity and 3.2 Å RMSD. The next three structural homologs were two cytokine related proteins from human (1C8P, 91-residue equivalence, 4% identity, and 3.4 Å RMSA; 1UC6 with 91-residue equivalence, 5% identity, and 3.2 Å RMSD) and one cell adhesion protein from the rat (1LWR, 87-residue equivalence, 6% identity, and 2.9 Å RMSD). Although the rankings were different, VAST (Gibrat et al. 1996) analysis yielded a similar outcome.
Figure 4.

The two closest structural homologs to the LEA protein (At1g01470.1): (Left) A bacterial protein of unknown function from Shewanella oneidensis (PDB 1TZA), which showed a 107-residue equivalence with 6% sequence identity and 3.2 Å RMSD to At1g01470.1. (Middle) At1g01470.1 (PDB 1XO8) for comparison. (Right) The third transglutaminase domain of factor XIII zymogen (PDB 1F13), which showed a 119-residue equivalence (over residues 515–630) with 6% sequence identity and 3.8 Å RMSD to At1g01470.1.
Functional implications
A common thread associating all these proteins is that these homologous structures belong to fibronectin Type III domains. Fibronectins are a group of related adhesive glycoproteins of high molecular mass found on the surface of animal cells, in connective tissue matrices, and in extracellular fluids. They bind to cell surfaces and are involved in cell adhesion, cell motility, wound healing, and maintenance of cell shape. It is interesting to note that in plants wounding or stress results in the over-expression of a protein with fibronectin Type III structural features. The overproduction of At1g01470.1 and similar proteins may serve to stop or slow the process of fluid loss. Thus, the At1g01470.1 protein may represent a ubiquitous structural motif that plays a role in adhesion and/or signal mechanisms as part of a cell’s response to fluid loss so as to alleviate potential damage.
Full-length cDNA microarrays have been widely applied to the functional analysis of the Arabidopsis genome. Shinozaki and coworkers have monitored the temporal expression profiles of Arabidopsis genes under conditions of drought, cold, and high-salinity stress (Seki et al. 2001, 2002). Their study of 7000 Arabidopsis genes identified a total of 277 drought-inducible, 53 cold-inducible, and 194 high-salinity-inducible genes. For the At1g01470.1 gene, the expression ratio (stress/nonstress) was more than fivefold for each of the three stresses.
Light is another source of stress. Light is the energy source for photosynthesis, and is a morphogenic signal for plants, but in addition, it is the major source of stress damage in the plant cell. Under light stress conditions, leaves exposed to high irradiation become dehydrated, and water deficiency and desiccation, in concert with a decrease in intracellular CO2 concentration as a result of closing of stomata, lead to the inhibition of carbon assimilation and ultimately the loss of photosynthetic capacity (Dunaeva and Adamska 2001; Kimura et al. 2003). Dunaeva and Adamska (2001) have shown that At1g01470.1 (LEA14) is one of five genes whose mRNA levels increased drastically in response to light stress in mature green leaves of A. thaliana. They made a further physiological connection between light stress and desiccation by showing that all five genes responded to both stimuli. More recently, a microarray consisting of 7000 full-length cDNAs from Arabidopsis was used to monitor responses to high light stress (Kimura et al. 2003). This experiment showed that 110 genes responded to high light stress. A parallel experiment for drought response using the same microarray system resulted in about 70% of the high light–induced genes being induced by drought stress. This overlap between light stress and drought stress clearly demonstrates cross-talk between the two abiotic stress mechanisms. At1g01470.1 (LEA14) is one of 10 genes that is upregulated by high light, drought, cold, and salt stresses (Kimura et al. 2003).
Many genes in Arabidopsis have been shown to be induced by mechanical wounding, which can stem from damage resulting from one or more forms of environmental stress, such as wind, rain, hail, or insect feeding. An open wound is a potential site for infection by pathogens. Thus, the expression of defense genes at the site of the wound may serve as a barrier against opportunistic microorganisms and may contribute to the survival of the organism. Responses in Arabidopsis to mechanical wounding and insect feeding have been studied in detail (Reymond and Farmer 1998; Reymond et al. 2000; Schenk et al. 2000; Cheong et al. 2002). In particular, it was found that the At1g01470.1 gene is induced after wounding, dehydration, or insect feeding (by larvae of the cabbage butterfly, Pieris rapae) at stress/nonstress ratios of 6.6, 11.2, and 2.4, respectively (Reymond et al. 2000). The fact that the At1g01470.1 gene is induced by wounding and dehydration suggests that it plays a common role in alleviating the effects of both. Since a common feature is dehydration, the induction of At1g01470.1 may somehow inhibit fluid loss.
In contrast, At1g01470.1 has been shown not to be induced by pathogens, such as the fungus Alternaria brassicicola, or by defense-related signaling molecules (salicylic acid, methyl jasmonate, and ethylene) (Schenk et al. 2000). Similar results were reported by Zhu and coworkers (Cheong et al. 2002) on the basis of their transcriptional profiling of 8200 genes in a cDNA micro-array experiment designed to investigate effects of wounding, pathogen, abiotic stress, and hormonal responses.
In summary, the functional genomics studies discussed above indicate that At1g01470.1 is not expressed as a part of signal transduction pathways involved in plant defense responses. Instead, At1g01470.1 is induced in response to abiotic stress, mechanical wounding, and, to a lesser degree, insect feeding. We speculate that this protein serves in some way to prevent cellular desiccation. It is hoped that the three-dimensional structure of At1g01470.1 will stimulate investigations aimed at determining the mechanistic function of this important class of proteins.
Materials and methods
The Center for Eukaryotic Structural Genomics uses the “Sesame” data management system (Zolnai et al. 2003) for organizing and tracking all its activities. Unless otherwise stated, bacterial growth reagents, antibiotics, routine laboratory chemicals, and disposable lab ware were from Sigma-Aldrich, Fisher, or other major distributors. The 2-L polyethylene terephthalate (PET) beverage bottles used for bacterial cell growth were from the Ball Corporation.
Protein production
The protocols used for gene cloning (Thao et al. 2004) cell growth, isotope labeling, and protein purification of target proteins have been described in detail elsewhere (Tyler et al. 2005).
Plasmids
The pVP13-GW expression vector used for these studies was derived from pQE80 (Qiagen). This vector produces the target protein as a C-terminal fusion with a protein consisting of an S-tag, maltose binding protein, and His6, followed by a linker region containing a TEV protease site contiguous with the second residue of the target protein. The plasmid sequence contains Gateway attB recombination sites (Invitrogen) used for incorporation of the target protein. The codon adaptation plasmid pLacI RARE was from Novagen.
Bacterial strain
Escherichia coli B834 (Novagen) was used as the expression host for isotopic labeling. This strain likely has a mutation in metE, and thus requires either methionine or vitamin B12 for growth. The cells were made competent by the Z-Competent (Geno Technology, Inc.) method and then transformed with pLacI RARE. The pLacI RARE transformants were also made competent by the same method.
Protein purification
Cells (~15 g) were thawed and suspended in ~75 mL of 20 mM NaH2PO4 (pH 7.5) containing 0.5 M NaCl, 20% (w/v) ethylene glycol, and 35 mM imidazole. The cells were lysed by sonication. The sonicated cell suspension was clarified by centrifugation. The recombinant fusion protein was purified in a linear 0–500 mM imidazole gradient using Ni2+-IMAC chromatography. The purified fusion protein was desalted into 20 mM NaH2PO4 (pH 7.5) containing 100 mM NaCl, and reacted with tobacco etch virus (TEV) protease overnight at 25°C. The proteolyzed target was subjected to subtractive Ni2+-IMAC chromatography, and the pure target was desalted into 5 mM HEPES (pH 7.0) containing 50 mM NaCl and concentrated. For final NMR experiments, the protein was exchanged with NaPO4 buffer (pH 6.5). The protein produced had the native full-length sequence with the exception of Ser replacing Met at the N terminus.
NMR measurements
NMR samples contained ~1.0 mM At1g01470.1 protein in 10 mM NaPO4 (combination of NaH2PO4 and Na2HPO4) at pH 6.5. NMR spectra were collected at 25°C on Varian UNITY INOVA 600 MHz instruments equipped with a 5-mm triple-resonance cold probe with a shielded Z-axis gradient. For the backbone resonance assignments, 3D HNCO, CBCANH, CBCA(CO)NH, NOESY-(15N,1H)-HSQC (Cavanagh et al. 1996) spectra were recorded, and for the side-chain resonance assignments, HBHA(CO)NH, HC(CO)NH, C(CO)NH, 3D-H(C)CH TOCSY, and (H)CCH TOCSY were recorded. NOE distance constraints were obtained from 3D NOESY-(15N,1H)-HSQC, and 3D NOESY-(13C,1H)-HSQC spectra with mixing times of 75 msec and 100 msec. All NMR spectra were processed using the software package NMRPipe (Delaglio et al. 1995) and analyzed using NMRView (Johnson and Blevins 1994).
NMR experiments for measuring residual dipolar couplings (RDCs) were recorded at 25°C on a Bruker Avance DMX600 spectrometer equipped with a cryogenic triple-resonance probe. The aligned sample contained ~17 mg/mL Pf1 phage (ASLA Ltd.) in 10 mM NaPO4 (pH 6.5) solution. The one-bond 15N-1H splittings were measured using 2D IPAP (15N-1H)-HSQC experiments (Ottiger et al. 1998). Spectra were processed with NMRPipe (Delaglio et al. 1995) and analyzed with PIPP/STAPP (Garrett et al. 1991).
Structural constraints
The chemical shifts of 97% of the nuclei were identified and assigned. The Cα, Cβ, C′, Hα, and N chemical shifts served as input for the TALOS program (Cornilescu et al. 1999). TALOS derives constraints for backbone dihedral angles from a comparison of secondary chemical shift patterns of amino acid triplets against a database of secondary chemical shifts corresponding to known conformations. A conservative approach was chosen that required the agreement of all 10 best matches for the prediction to be accepted. The TALOS predictions were converted into dihedral angle constraints as the average φ and ψ angles ± two times the standard deviation or a minimum of ±20 degrees. For better convergence, a number of hydrogen bond constraints were introduced for the backbone amide protons using standard criteria on the basis of 13Cα/13Cβ secondary shifts and NOE data. Hydrogen bonding was enforced using the following constraints. 1.8–2.3 Å for d(N–H, O) and 2.7–3.3 Å for d(N, O). The hydrogen bonds between N–Hi and O–Cj in the β-sheet structures were included as constraints only if the β-sheet interstrand dNN (i, j) and dαN (i, j) NOE cross-peaks were observed. Hydrogen bond constraints for α-helices were included when NOEs corresponding to the secondary structure dαN (i, i + 3) for α-helices were observed.
Structure calculations
All calculations were performed with CNS (Brunger et al. 1998) using the ARIA setup and protocols (Nilges and O’Donoghue 1998; Linge and Nilges 1999). The TALOS-derived dihedral angles were restrained with a harmonic potential using a force constant of 200 kcal mol−1 rad−2. Covalent interactions were calculated with a modified version (A. Willems, pers. comm.) of the PARALLHDG 5.3 parameter file (Linge and Nilges 1999) based on the CSDX parameter set (Engh and Huber 1991). In addition to the bonded energy terms typically used in NMR structure calculations (bond, angle, and improper energy terms), the dihedral angle energy term describing torsions around rotatable bonds (“dihe” flag in CNS) was turned on. This energy term greatly improved the quality of side-chain χ1 and χ2 rotamers as assessed by PRO-CHECK (Laskowski et al. 1993). Nonbonded interactions were calculated with the repel function using the PROLSQ parameters as implemented in the PARALLHDG parameter file. The OPLS nonbonded parameters (Jorgensen and Tirado-Rives 1988) were used for the final water refinement including full van der Waals and electrostatic energy terms. The non-bonded pair list was generated with a 9.5 Å cutoff, and the nonbonded interaction was calculated with an 8.5 Å cutoff using a shifting function.
A simulated annealing protocol in Cartesian space was used starting from an extended conformation. Force constants were scaled throughout the protocol following the default ARIA/CNS setup. The atomic masses were set uniformly to 100 amu, and the friction coefficient fβ for the coupling to the external temperature bath was set to 20 psec−1. The simulated annealing protocol, which is similar to the one described in Linge and Nilges (1999), consisted of four stages: (1) high-temperature SA stage (10,000 steps, 2000 K), (2) a first cooling phase from 2000 to 1000 K in 10,000 steps, (3) a second cooling phase from 1000 to 50 K in 5000 steps, followed by (4) 200 steps of energy minimization. The time step for the integration was set to 0.003 psec.
The structures were subjected to a final refinement protocol in explicit water by solvating them with an 8 Å layer of TIP3P waters. The water refinement consisted of a heating period (50 MD steps at 100, 200, 300, 400, and 500 K, time step 0.005 fsec) with harmonic position constraints on the Cα atoms (kharm = 10 kcal mol−1 Å2) followed by 2500 MD steps at 500 K without any position constraints, and a final cooling stage from 500 to 100 K in 100 K steps (1000 MD steps per temperature step). The resulting structures were energy minimized with 100 steps of Powell steepest descent minimization. The quality of the final ensemble of conformers was assessed using the PROCHECK. The visual displays were performed with either the program MOLMOL (Koradi et al. 1996) or RASMOL (Sayle and Milner-White 1995).
Accession numbers
The structure reported here was determined under the National Institutes of Health, NIGMS Protein Structure Initiative; coordinates and related data have been deposited at PDB (1XO8) and NMR data at BMRB (accession no. 6339).
Acknowledgments
This work was supported by the National Institutes of Health, Protein Structure Initiative through Grant P50 GM64598; NMR data were collected at the National Magnetic Resonance Facility at Madison, which is supported in part by grants P41 RR02301 and P41 GM66326. The authors thank other CESG team members who contributed to the success of this work.
Article published online ahead of print. Article and publication date are at http://www.proteinscience.org/cgi/doi/10.1110/ps.051579205.
References
- Bartels, D. and Salamini, F. 2001. Desiccation tolerance in the resurrection plant Craterostigma plantagineum. A contribution to the study of drought tolerance at the molecular level. Plant Physiol. 127 1346–1353. [PMC free article] [PubMed] [Google Scholar]
- Battista, J.R., Park, M.J., and McLemore, A.E. 2001. Inactivation of two homologues of proteins presumed to be involved in the desiccation tolerance of plants sensitizes Deinococcus radiodurans R1 to desiccation. Cryobiology 43 133–139. [DOI] [PubMed] [Google Scholar]
- Browne, J., Tunnacliffe, A., and Burnell, A. 2002. Anhydrobiosis: Plant desiccation gene found in a nematode. Nature 416 38. [DOI] [PubMed] [Google Scholar]
- Browne, J.A., Dolan, K.M., Tyson, T., Goyal, K., Tunnacliffe, A., and Burnell, A.M. 2004. Dehydration-specific induction of hydrophilic protein genes in the anhydrobiotic nematode Aphelenchus avenae. Eukaryotic Cell 3 966–975. [DOI] [PMC free article] [PubMed] [Google Scholar]
- Brunger, A.T., Adams, P.D., Clore, G.M., Delano, W.L., Gros, P., Grossekunstleve, R.W., Jiang, J.S., Kuszewski, J., Nilges, M., Pannu, N.S., et al. 1998. Crystallography and NMR system—A new software suite for macromolecular structure determination. Acta Crystallogr. D Biol. Crystallogr. 54 905–921. [DOI] [PubMed] [Google Scholar]
- Cavanagh, J., Palmer III, A.G., Fairbrother, W., and Skelton, N. 1996. Protein NMR spectroscopy: Principles and practice. Academic Press, San Diego, CA.
- Cheong, Y.H., Chang, H.S., Gupta, R., Wang, X., Zhu, T., and Luan, S. 2002. Transcriptional profiling reveals novel interactions between wounding, pathogen, abiotic stress, and hormonal responses in Arabidopsis. Plant Physiol. 129 661–677. [DOI] [PMC free article] [PubMed] [Google Scholar]
- Cornilescu, G., Delaglio, F., and Bax, A. 1999. Protein backbone angle restraints from searching a database for chemical shift and sequence homology. J. Biomol. NMR 13 289–302. [DOI] [PubMed] [Google Scholar]
- Delaglio, F., Grzesiek, S., Vuister, G.W., Zhu, G., Pfeifer, J., and Bax, A. 1995. NMRPipe: A multidimensional spectral processing system based on UNIX pipes. J. Biomol. NMR 6 277–293. [DOI] [PubMed] [Google Scholar]
- Dunaeva, M. and Adamska, I. 2001. Identification of genes expressed in response to light stress in leaves of Arabidopsis thaliana using RNA differential display. Eur. J. Biochem. 268 5521–5529. [DOI] [PubMed] [Google Scholar]
- Engh, R.A. and Huber, R. 1991. Accurate bond and angle parameters for X-ray protein structure refinement. Acta Crystallogr. A47 392–400. [Google Scholar]
- Eom, J., Baker, W., Kintanar, A., and Wurtele, E. 1996. The embryo-specific EMB-1 protein of Daucus carota is flexible and unstructured in solution. Plant Sci. 115 24. [Google Scholar]
- Gal, T.Z., Glazer, I., and Koltai, H. 2003. Differential gene expression during desiccation stress in the insect-killing nematode Steinernema feltiae IS-6. J. Parasitol. 89 761–766. [DOI] [PubMed] [Google Scholar]
- ———. 2004. An LEA group 3 family member is involved in survival of C. elegans during exposure to stress. FEBS Lett. 577 21–26. [DOI] [PubMed] [Google Scholar]
- Garrett, D.S., Powers, R., Gronenborn, A.M., and Clore, G.M. 1991. A common sense approach to peak picking in two-, three- and four-dimensional spectra using automatic computer analysis of contour diagrams. J. Magn. Reson. 95 214–220. [DOI] [PubMed] [Google Scholar]
- Gibrat, J.F., Madej, T., and Bryant, S.H. 1996. Surprising similarities in structure comparison. Curr. Opin. Struct. Biol. 6 377–385. [DOI] [PubMed] [Google Scholar]
- Goyal, K., Tisi, L., Basran, A., Browne, J., Burnell, A., Zurdo, J., and Tunnacliffe, A. 2003. Transition from natively unfolded to folded state induced by desiccation in an anhydrobiotic nematode protein. J. Biol. Chem. 278 12977–12984. [DOI] [PubMed] [Google Scholar]
- Habeck, M., Rieping, W., Linge, J.P., and Nilges, M. 2004. NOE assignment with ARIA 2.0: The nuts and bolts. Methods Mol. Biol. 278 379–402. [DOI] [PubMed] [Google Scholar]
- Holm, L. and Sander, C. 1993. Protein structure comparison by alignment of distance matrices. J. Mol. Biol. 233 123–138. [DOI] [PubMed] [Google Scholar]
- Honjoh, K., Matsumoto, H., Shimizu, H., Ooyama, K., Tanaka, K., Oda, Y., Takata, R., Joh, T., Suga, K., Miyamoto, T., et al. 2000. Cryoprotective activities of group 3 late embryogenesis abundant proteins from Chlorella vulgaris C-27. Biosci. Biotechnol. Biochem. 64 1656–1663. [DOI] [PubMed] [Google Scholar]
- Ismail, A.M., Hall, A.E., and Close, T.J. 1999. Purification and partial characterization of a dehydrin involved in chilling tolerance during seedling emergence of cowpea. Plant Physiol. 120 237–244. [DOI] [PMC free article] [PubMed] [Google Scholar]
- Johnson, B.A. and Blevins, R.A. 1994. NMR view—A computer program for the visualization and analysis of NMR data. J. Biomol. NMR 4 603–614. [DOI] [PubMed] [Google Scholar]
- Jorgensen, W.L. and Tirado-Rives, J. 1988. The OPLS potential functions for proteins energy minimization for crystals of cyclic peptides and crambin. J. Am. Chem. Soc. 110 1666. [DOI] [PubMed] [Google Scholar]
- Kimura, M., Yamamoto, Y.Y., Seki, M., Sakurai, T., Abe, T., Yoshida, S., Manabe, K., Shinozaki, K., and Matsui, M. 2003. Identification of Arabidopsis genes regulated by high light-stress using cDNA microarray. Photochem. Photobiol. 77 226–233. [DOI] [PubMed] [Google Scholar]
- Koradi, R., Billeter, M., and Wuthrich, K. 1996. MOLMOL: A program for display and analysis of macromolecular structures. J. Mol. Graph. 14 51–55. [DOI] [PubMed] [Google Scholar]
- Laskowski, R.A., MacArthur, M.W., Moss, D.S., and Thornton, J.M. 1993. PROCHECK: A program to check the stereochemical quality of protein structures. J. Appl. Crystallogr. 26 283–291. [Google Scholar]
- Linge, J.P. and Nilges, M. 1999. Influence of non-bonded parameters on the quality of NMR structures: A new force field for NMR structure calculation. J. Biomol. NMR 13 51–59. [DOI] [PubMed] [Google Scholar]
- Lisse, T., Bartels, D., Kalbitzer, H., and Jaenicke, R. 1996. The recombinant dehydrin-like desiccation stress protein from the resurrection plant Craterostigma plantagineum displays no defined three-dimensional structure in its native state. Biol. Chem. 377 555–561. [DOI] [PubMed] [Google Scholar]
- Makarova, K.S., Aravind, L., Wolf, Y.I., Tatusov, R.L., Minton, K.W., Koonin, E.V., and Daly, M.J. 2001. Genome of the extremely radiation-resistant bacterium Deinococcus radiodurans viewed from the perspective of comparative genomics. Microbiol. Mol. Biol. Rev. 65 44–79. [DOI] [PMC free article] [PubMed] [Google Scholar]
- Nilges, M. and O’Donoghue, S.I. 1998. Ambiguous NOEs and automated NOE assignment. Prog. NMR Spectrosc. 32 108–139. [Google Scholar]
- Ottiger, M., Delaglio, F., and Bax, A. 1998. Measurement of J and dipolar couplings from simplified two-dimensional NMR spectra. J. Magn. Reson. 131 373–378. [DOI] [PubMed] [Google Scholar]
- Reymond, P. and Farmer, E.E. 1998. Jasmonate and salicylate as global signals for defense gene expression. Curr. Opin. Plant Biol. 1 404–411. [DOI] [PubMed] [Google Scholar]
- Reymond, P., Weber, H., Damond, M., and Farmer, E.E. 2000. Differential gene expression in response to mechanical wounding and insect feeding in Arabidopsis. Plant Cell 12 707–720. [DOI] [PMC free article] [PubMed] [Google Scholar]
- Russouw, P., Farrant, J., Brandt, W., and Lindsey, G.G. 1997. The most prevalent protein in a heat-treated extract of pea (Pisum sativum) embroyos is a LEA group I protein: Its conformation is not affected by exposure to high temperature. Seed Sci. Res. 7 117–123. [Google Scholar]
- Sales, K., Brandt, W., Rumbak, E., and Lindsey, G. 2000. The LEA-like protein HSP 12 in Saccharomyces cerevisiae has a plasma membrane location and protects membranes against desiccation and ethanol-induced stress. Biochim. Biophys. Acta 1463 267–278. [DOI] [PubMed] [Google Scholar]
- Sayle, R.A. and Milner-White, E.J. 1995. RASMOL: Biomolecular graphics for all. Trends Biochem. Sci. 20 374–376. [DOI] [PubMed] [Google Scholar]
- Schenk, P.M., Kazan, K., Wilson, I., Anderson, J.P., Richmond, T., Somerville, S.C., and Manners, J.M. 2000. Coordinated plant defense responses in Arabidopsis revealed by microarray analysis. Proc. Natl. Acad. Sci. 97 11655–11660. [DOI] [PMC free article] [PubMed] [Google Scholar]
- Schneider, K., Wells, B., Schmelzer, E., Salamini, F., and Bartels, D. 1993. Desiccation leads to the rapid accumulation of both cytosolic and chloroplastic proteins in the resurrection plant Craterostigma plantagineum Hochst. Planta 189 120–131. [Google Scholar]
- Seki, M., Narusaka, M., Abe, H., Kasuga, M., Yamaguchi-Shinozaki, K., Carninci, P., Hayashizaki, Y., and Shinozaki, K. 2001. Monitoring the expression pattern of 1300 Arabidopsis genes under drought and cold stresses by using a full-length cDNA microarray. Plant Cell 13 61–72. [DOI] [PMC free article] [PubMed] [Google Scholar]
- Seki, M., Narusaka, M., Ishida, J., Nanjo, T., Fujita, M., Oono, Y., Kamiya, A., Nakajima, M., Enju, A., Sakurai, T., et al. 2002. Monitoring the expression profiles of 7000 Arabidopsis genes under drought, cold and high-salinity stresses using a full-length cDNA microarray. Plant J. 31 279–292. [DOI] [PubMed] [Google Scholar]
- Shinozaki, K. and Yamaguchi-Shinozaki, K. 2000. Molecular responses to dehydration and low temperature: Differences and cross-talk between two stress signaling pathways. Curr. Opin. Plant Biol. 3 217–223. [PubMed] [Google Scholar]
- Soulages, J.L., Kim, K., Walters, C., and Cushman, J.C. 2002. Temperature-induced extended helix/randomcoil transitions in a group 1 late embryogenesis-abundant protein from soybean. Plant Physiol. 128 822–832. [DOI] [PMC free article] [PubMed] [Google Scholar]
- Soulages, J.L., Kim, K., Arrese, E.L., Walters, C., and Cushman, J.C. 2003. Conformation of a group 2 late embryogenesis abundant protein from soybean. Evidence of poly (L-proline)-type II structure. Plant Physiol. 131 963–975. [DOI] [PMC free article] [PubMed] [Google Scholar]
- Stacy, R. and Aalen, R. 1998. Identification of sequence homology between the internal hydrophilic repeated motifs of group 1 late-embryogenesis-abundant proteins in plants and hydrophilic repeats of the general stress protein GsiB of Bacillus subtilis. Planta 206 476–478. [DOI] [PubMed] [Google Scholar]
- Thao, S., Zhao, Q., Kimball, T.L., Steffen, E., Blommel, P.G., Riters, M., Newman, C.S., Fox, B.G., and Wrobel, R.L. 2004. Results from high-throughput DNA cloning of Arabidopsis thaliana target genes using site-specific recombination. J. Struct. Funct. Genom. 5 267–276. [DOI] [PubMed] [Google Scholar]
- Tyler, R.C., Sreenath, H., Aceti, D.J., Bingman, C.A., Singh, S., Markley, J.L., and Fox, B.G. 2005. Auto-induction medium for the production of [U-15N]- and [U-13C, U-15N]-labeled proteins for NMR screening and structure determination. Protein Expr. Purif. 40 268–278 [DOI] [PubMed] [Google Scholar]
- Wise, M. 2003. LEAping to conclusions: A computational reanalysis of late embryogenesis abundant proteins and their possible roles. BMC Bioinformatics 4 52. [DOI] [PMC free article] [PubMed] [Google Scholar]
- Wishart, D.S. and Sykes, B.D. 1994. The 13C chemical shift index: A simple method for the identification of protein secondary structure using 13C chemical-shift data. J. Biomol. NMR 4 171–180. [DOI] [PubMed] [Google Scholar]
- Wolkers, W.F., van Kilsdonk, M.G., and Hoekstra, F.A. 1998. Dehydration-induced conformational changes of polylysine as influenced by drying rate and carbohydrates. Biochim. Biophys. Acta 1425 127–136. [DOI] [PubMed] [Google Scholar]
- Yee, V.C., Pedersen, L.C., Trong, I.L., Bishop, P.D., Stenkamp, R.E., and Teller, D.C. 1994. Three-dimensional structure of a transglutaminase: Human blood coagulation factor XIII. Proc. Natl. Acad. Sci. 91 7296–7300. [DOI] [PMC free article] [PubMed] [Google Scholar]
- Zolnai, Z., Lee, P.T., Li, J., Chapman, M.R., Newman, C.S., Phillips, Jr., G.N., Rayment, I., Ulrich, E.L., Volkman, B.F., and Markley, J.L. 2003. Project management system for structural and functional proteomics: Sesame. J. Struct. Funct. Genom. 4 11–23. [DOI] [PubMed] [Google Scholar]
- Zweckstetter, M. and Bax, A. 2000. Prediction of sterically induced alignment in a dilute liquid crystalline phase: Aid to protein structure determination by NMR. J. Am. Chem. Soc. 122 3791–3792. [Google Scholar]