

Abstract
The reliable identification of β-aggregating stretches in protein sequences is essential for the development of therapeutic agents for Alzheimer’s and Parkinson’s diseases, as well as other pathological conditions associated with protein deposition. Here, a model based on physicochemical properties and computational design of β-aggregating peptide sequences is shown to be able to predict the aggregation rate over a large set of natural polypeptide sequences. Furthermore, the model identifies aggregation-prone fragments within proteins and predicts the parallel or anti-parallel β-sheet organization in fibrils. The model recognizes different β-aggregating segments in mammalian and nonmammalian prion proteins, providing insights into the species barrier for the transmission of the prion disease.
Keywords: Alzheimer’s disease, amyloid, protein aggregation rate, prion protein, species barrier, genetic algorithm, molecular dynamics
Amyloid fibrils are associated with a number of pathologies including Alzheimer’s, Parkinson’s, Huntington’s, prion disease, and type II diabetes (Horwich and Weissman 1997; Kelly 1998; Dobson 1999; Rochet and Lansbury 2000). Therefore it is of fundamental medical interest to understand the mechanisms of fibrillogenesis, with the ultimate goal of designing inhibitors. One important and still unanswered question regarding amyloid fibril formation is the specificity with which the amino acid sequence determines β-aggregation propensity and the atomic details of the fibril structure. Because of the difficulties in obtaining detailed structural information by X-ray crystallography or solution phase NMR spectroscopy, computational approaches are needed to guide experiments, e.g., to determine short segments of amyloid-like proteins that share the same biophysical properties of the full-length proteins (Balbirnie et al. 2001) and identify those elements which are essential for the formation of protein fibrils (Tenidis et al. 2000; von Bergen et al. 2000). As aggregation conditions vary sensibly with the composition and especially the sequence of the polypeptide, single amino acid substitutions have been used to investigate the fibril formation (Chiti et al. 1999), and complementary theoretical studies proposed relative rate equations to predict the change of aggregation rate upon mutation (Chiti et al. 2003; Tartaglia et al. 2004). Although the application of relative rate equations shows high correlation with experimental data, these models require the a priori knowledge of wild-type aggregation rates.
We report here an absolute rate equation derived from both first principles and analysis of aggregating sequences designed by a computational approach. The latter is based on a genetic algorithm optimization in sequence space and molecular dynamics sampling of conformation space. The equation does not need any information except the amino acid sequence and two environmental factors (i.e., temperature and concentration). Our model gives both the aggregation rate and the “amyloid spectrum” of a protein, identifying those segments involved in β-aggregation. In addition, the model distinguishes between the parallel and anti-parallel β-sheet organization within the fibrils and shows that mammalian and nonmammalian prion proteins have different amyloid spectra.
Results and Discussion
Absolute rate prediction
Predicted and experimentally measured rates are shown in logarithmic scale in Figure 1 ▶. The correlation is 95% and extends over 90 data points and about 15 natural logarithmic units. This is a remarkable result considering that the rate is calculated solely from the primary structure with the addition of two external factors, i.e., temperature and concentration. Interestingly, the correlation is good for different proteins and also within mutants of the same protein. For single-point mutants of long sequences (Acylphosphatase and Titin), the error is rather large because of the poor signal-to-noise ratio due to the average over the entire sequence. The model was subjected to statistical tests to assess the chance correlation. In Figure 2A ▶, the experimentally measured rates were randomly permutated to generate about 107 “scrambled” data sets. The calculated rates were fitted to each scrambled set, giving an extremely small likelihood for high correlations. In Figure 2B ▶, ~107 data sets were randomly generated within the range of experimental rates. The predictive ability andcorrelation of the modelare much higher than the corresponding values obtained upon randomization of the experimental rates. These statistical tests show that chance correlation is not present.
Figure 1.

Calculated (Equation 4; see Materials and Methods) vs. observed aggregation rates for heterogeneous groups of peptide and protein systems (Litvinovich et al. 1998; Konno et al. 1999; Chiti et al. 2003; Ferguson et al. 2003; DuBay et al. 2004). A t-student test on the correlation shows the high significance in the prediction (in the present study P < 0.0001, while P ≃ 1 indicates no significance).
Figure 2.

Statistical tests to assess chance correlation. (A) Permutations of experimental rates: Probability distribution p of the correlation coefficient r between rates calculated with Equation 4 (see Materials and Methods) and scrambled experimental rates. The likelihood of obtaining high correlations (r > 50%) with scrambled experimental rates is extremely small (p < 10−9). (B) Randomization of experimental rates (within the same range of values): Cross-validated leave-one-out correlation coefficient q = 1−PRESS/σ2 (PRESS = predicted residual sum of squares, i.e., sum of squared differences between predicted and observed values [Zoete et al. 2003]) vs. the correlation coefficient r. The predictive ability and correlation of the model (thick circle on the top right) are significantly separated from the corresponding values obtained upon randomization of the experimental rates (thin points). In both tests, 107 data sets were generated.
Prediction of β-aggregating segments
There is in vivo evidence that amyloid fibrils originate from misfunctions of the degradation machinery and cleavage of fragments that have high propensity for β-aggregation (Stefani and Dobson 2003). Moreover, even proteins not implicated in amyloid diseases were recently found to form amyloid fibrils in vitro under denaturing conditions, indicating that fibrillogenesis is a common feature of proteins (Chiti et al. 1999; Dobson 1999; Stefani and Dobson 2003). Our approach to estimate aggregation rates can be also used to identify segments with high aggregation propensity. The method is tested on the following proteins: α-synuclein, apolipoprotein, amyloid precursor protein (APP), gelsolin, islet amyloid precursor protein (IAPP), lactadherin, prion, serum amyloid A, transthyretin, ABri, ADan, fibrinogen, β2-microglobulin, insulin, Sup35, and tau. The former nine proteins represent all hits of a combined search for “amyloid” and “human” at http://www.expasy.org (Gasteiger et al. 2003) in September 2004; the latter seven proteins result from a literature search (references are reported in Table 1). As indicated in Figure 3 ▶, the data set contains
Table 1.
Analysis of experimentally known β-aggregating segments
| Protein | 1st Stretcha | Rankb | 2nd Stretcha | Rankb | 3rd Stretcha | Rankb | Segment | Total length | Ref. |
| ABri | 22{CSRTV}a | 5 | 21{ICRST}a | 8 | 20{LICSR}a | 10 | 1–34 | 34 | El-Agnaf et al. 2001 |
| ADan | 22{CFLNF}p | 1 | 23{FNLFL}p | 2 | 24{NLFLN}p | 3 | 1–34 | 34 | El-Agnaf et al. 2004 |
| α-Synuclein | 41{EQVTN}a | 6 | 67[;SIAAA];p | 12 | 71[;ATGFV];p | 15 | 41–74 | 120 | Ueda et al. 1993 |
| Apolipoprotein A–I | 18[;YVDVL];p | 1 | 28{DYVSQ}a | 2 | 85[;EMSKD];a | 3 | 1–83 | 242 | Nichols et al. 1988 |
| APP | 671{LVFFA}p | 1 | 670{KLVFF}p | 2 | 672{VFFAE}p | 3 | 655–696 | 750 | Weidemann et al. 1989 |
| β-Microglobulin | 61{SFYLL}p | 1 | 63{TLLYY}p | 2 | 66{YYTEF}p | 3 | 59–79 | 99 | Jones et al. 2003 |
| Fibrinogen | 494[;FPGFF];p | 7 | 493[;TFPGF];p | 13 | 482[;AAFFD];p | 32 | 482–504 | 623 | Asl et al. 1997 |
| Gelsolin | 187{DCFIL}p | 15 | 188{CFILD}p | 23 | 189{FILDL}p | 31 | 173–243 | 755 | Kangas et al. 1996 |
| IAPP | 22{FGAIL}p | 1 | 21{NFGAI}p | 2 | 28[;SNTYG];a | 4 | 1–38 | 38 | Westermark et al. 1987 |
| Insulin | 78{ENYCN}a | 1 | 23{RGFFY}p | 3 | 15{ALYLV}p | 4 | 1–38 | 86 | Jimenez et al. 2002 |
| Lactadherin | 260{YGNDQ}a | 3 | 259{SYGND}a | 4 | 289[;SVQFV];p | 5 | 245–294 | 364 | Haggqvist et al. 1999 |
| Prion | 116{IIHFG}p | 1 | 115{PIIHF}p | 2 | 99[;VVGGL];p | 3 | 1–121 | 208 | Vanik et al. 2004 |
| Serum amyloid A | 3{FFSFL}p | 2 | 4{FSFLG}p | 3 | 5{SFLGE}p | 4 | 2–12 | 104 | Westermark et al. 1992 |
| Sup35 | 77[;YQQYN];a | 1 | 44[;YQNYQ];a | 2 | 67[;YQQQY];a | 3 | 1–112 | 683 | King et al. 1997 |
| Tau | 621{SVQIV}p | 23 | 632{SKVTS}a | 24 | 627{KPVDL}p | 25 | 617–636 | 757 | Margittai and Langen 2004 |
| Transthyretin | 107[;IAALL];p | 1 | 114{YSYST}a | 2 | 106[;TIAAL];p | 4 | 105–115 | 127 | Jaroniec et al. 2002 |
a The three five-residue stretches with the highest π, within the segments listed in the third to last column, are reported with the predicted parallel (p) or anti-parallel (a) arrangement. The braces { } indicate stretches that are close to the peak found in the experimental regions using the windows’ consensus (Figure 3 ▶), while the brackets [; ]; mark sequences that are distant from the peak. The integer before the brackets refers to the position of the stretch in the processed protein (initial signal- and propeptides are omitted in the notation as in other works; see, for instance Kangas et al. 1996; Jones et al. 2003).
b The rank of the stretches refers to the entire precursor protein and can in principle vary from 1 (i.e., the stretch has the highest π among all the stretches in the precursor protein) to the total length of the precursor protein (i.e., the stretch has the lowest π among all the stretches in the precursor protein).
Figure 3.

Windows’ consensus. Different window sizes (3–25 amino acids) are used to scan proteins. Positions of stretches with highest aggregation propensity π are used to build the histogram. Except for fibrinogen and prion, the highest peak is located in segments that are known to form amyloid fibrils and/or contribute to protein aggregation (gray regions). The letter “p” labels regions that are known to promote fibrillogenesis (“p” standing for “promoting”). The letter “f” indicates segments that are found to aggregate in vivo (“f” standing for “fragment”) after degradation. The letter “e” refers to stretches that are shown to aggregate in vitro (“e” standing for “extracted”). We stress that Equation 1 (see Materials and Methods) was used to identify β-aggregating stretches and not to predict amino acid deletions or insertions involved in amyloidosis. Positions refer to proteins without signal- and propeptides. References for all the experiments are reported in Table 1.
regions known to promote aggregation
segments found to aggregate in vivo (often after degradation)
stretches extracted from the precursors and shown to aggregate in vitro
Each sequence in the data set is scanned by shifting a window of fixed size one residue at a time starting from the N terminus. The extracted stretches are ranked using the aggregation propensity π (see Materials and Methods). The procedure is repeated for different window sizes (3–25 amino acids), each time storing the positions of the three stretches having the highest π. These positions are then used to build the histogram of Figure 3 ▶. Peaks of the histogram represent positions of stretches with the highest β-aggregation propensity (“windows’ consensus”). All the sequences except fibrinogen and prion show main peaks in segments known to promote aggregation. For prion, amyloidogenic areas are—up to now—not known and few experiments have been performed and on limited portions of the protein (Vanik et al. 2004). Following the protein-only hypothesis (Prusiner 1988; Soto and Castilla 2004), we suggest that the peak found at position 150 may be determinant for prion transmissions (in the subsection Prions, the same peak is numbered with 175 because of the alignment with other prion sequences). For transthyretin, only one of the two experimentally known β-aggregating fragments has been found with our analysis. We speculate that the corresponding area promotes the aggregation of the entire protein, which is consistent with NMR data (Jaroniec et al. 2002).
To furthertest the sensitivity of our model, we focused on the segments that are experimentally known to aggregate. For this purpose, we used a window size of five consecutive residues, as in a previous work (Fernandez Escamilla et al. 2004) (Table 1). Interestingly, several five-residue stretches are found in segments that were shown to aggregate, e.g., FGAIL contained in IAPP NFGAILSS, FILDL in gelsolin’s SFNNGDCFILD, SVQFV in lacthaderin’s NFGSVQFV, and YQQYN in Sup35’s PQGGYQQYN (Azriel and Gazit 2001). For APP, three stretches are found in correspondence of the segment LVFFA, which is known to be involved in the aggregation of Aβ40 (Williams et al. 2004) (see subsection Amyloid Protein Precursor). Importantly, all the stretches are ranked among those having the highest π in the respective precursor proteins (see Table 1), which suggests that a small window size is sufficient for the identification of amyloidogenic regions. In Table 1, we also list β-aggregating segments that have not yet been investigated with experiments in vitro (e.g., YVDVL in apolipo-protein A–I and ENYCN in insulin) and indicate the predicted parallel or anti-parallel arrangement of the individual segments in the fibril.
Amyloid protein precursor
Using a window size of five residues, the amyloid spectrum of the 750-residue APP (Fig. 4 ▶) shows a predominant peak at position 671 for the stretch LVFFA. Furthermore, the predicted β-aggregating stretches AIIGL and IGLMV are consistent with solid-state NMR (Antzutkin et al. 2002; Bond et al. 2003) and scanning proline mutagenesis (Williams et al. 2004). The stretches with the highest rate for each window size in the range 3–25 are shown in Table 2 for Aβ42. Most of the high-aggregation stretches contain the segment LVFFA and are parallel. As in experiments (Gordon et al. 2004), the segment KLVFFAE has a preferential anti-parallel arrangement, while Aβ42 is parallel(Antzutkin et al. 2000; Torok et al. 2002). As shown in clinical reports and oligomerization experiments performed with photo-induced cross-linking of unmodified proteins (Bitan et al. 2003), we found that Aβ42 has a higher aggregation propensity than Aβ40 (ln πAβ42 = −7, ln πAβ40 = −). Interestingly, the experimental evidence indicates that the Ile41–Ala42 extension of the 1–40 segment affects the rate of amyloid formation rather than the fibril stability (Jarrett et al. 1993).
Figure 4.

Amyloid protein precursor. The aggregation propensity π is averaged over a window of five amino acids. The entire sequence is scanned by shifting the window by one residue at a time starting from the N terminus (“amyloid spectrum”). The analysis shows a major peak corresponding to the segment LVFFA at position 671. The bottom plot focuses on the most amyloidogenic region, which is highlighted in gray in the top plot. Windows of different sizes (5, 7, and 10 amino acids), shifted to the central amino acid, give similar results, indicating the robustness of the model. Furthermore, with longer window sizes, peaks in the C terminus of Aβ40 become comparable to the one at position 671 (see also Table 2). In both plots, the effective height of the peak is compressed by the logarithm scale.
Table 2.
Stretches of Aβ42 with the highest rate at each window size in the range 3–25
| Sequence | ln π | p/a |
| VFF {IGL} | 5.3 {−2.6} | p |
| LVFF {GAII} | 2.5 {−6.7} | p |
| LVFFA {AIIGL} | 0.2 {−7.5} | p |
| LVFFAE {GAIIGL} | −3.9 {−8.0} | p |
| KLVFFAE {AIIGLMV} | −5.9 {−10.0} | a |
| LVFFAEDV {IGLMVGGM} | −7.3 {−10.1} | p |
| LVFFAEDVG {GLMVGGVVI} | −7.6 {−10.0} | p |
| QKLVFFAEDV {IGLMVGGVVI} | −9.3 {−9.7} | a |
| {QKLVFFAEDVG} IGLMVGGVVIA | −10.1 {−11.0} | p |
| {HQKLVFFAEDVG} AIIGLMVGGVVI | −10.5 {−11.1} | p |
| {FFAEDV . . . } GAIIGLMVGGVVI | −10.5 {−10.7} | p |
| FFAEDVGSNKGAII | −10.1 | p |
| VFFAEDVGSNKGAII | −9.3 | p |
| VFFAEDVGSNKGAIIG | −9.7 | p |
| LVFFAEDVGSNKGAIIG | −8.8 | p |
| LVFFAEDVGSNKGAIIGL | −8.2 | p |
| KLVFFAEDVGSNKGAIIGL | −9.3 | p |
| KLVFFAEDVGSNKGAIIGLM | −9.4 | p |
| QKLVFFAEDVGSNKGAIIGLM | −10.5 | p |
| QKLVFFAEDVGSNKGAIIGLMV | −10.1 | p |
| LVFFAEDVGSNKGAIIGLMVGGV | −10.7 | p |
| LVFFAEDVGSNKGAIIGLMVGGVV | −10.4 | p |
| LVFFAEDVGSNKGAIIGLMVGGVVI | −7.1 | p |
In braces are reported stretches that ranked after the highest rate ones and do not overlap with them. The last column contains the preferred β-sheet arrangement, i.e., parallel (p) or anti-parallel (a).
Prions
To further investigate the usefulness of our model, the amyloidogenic propensities of the prion protein from different organisms were evaluated using a moving window of five residues along the entire sequence. To compare the amyloid spectra, prion sequences have been aligned using ClustalW (Thompson et al. 1994). It is remarkable that prion sequences in mammals show a peak at position 175 corresponding to the segment SNQNN in human prion (Fig. 5 ▶; Table 3; all the notations used to number stretches refer to the major prion proteins, i.e., signal- and/or propeptides are omitted). Such a peak is absent in the chicken and the turtle. Interestingly, the peak is located in a glutamine/asparagine-rich region, which shows high propensity to self-propagate in amyloid fibrils (Michelitsch and Weissman 2000). Other peaks correspond to β-strand 2 (segment NQVYY, conserved in mammals and nonmammals and mutated in NRVYY in chicken) and helix 1 of human prion (segment YEDRY in mammals, WNENS in turtle, and WSENS in chicken), which are known to form ordered aggregates in vitro (Nguyen et al. 1995; Kozin et al. 2001). Furthermore, the amyloid profiles are similar within mammals (e.g., 97% correlation between man and cow) and different between mammals and nonmammals (e.g., 55% correlation between man and turtle).
Figure 5.

Prion proteins from turtle to human. The plot shows an evolutionary differentiation of the aggregation peaks. Prions of cow and mouse, as well as prions of sheep and pig, show similar amyloid spectra (data not shown). The highest peak at position 175 for mammals (segment a, i.e., SNQNN) is not present in nonmammals. Peak b (segment NQVYY, conserved in mammals and nonmammals, and mutated to NRVYY in chicken) appears in correspondence of β-strand 2 in human prion. Nonmammals show a peak c (segment WNENS in turtle and WSENS in chicken) in correspondence of the first helix of human prion that is weaker in mammals (YEDRY). Sequences have been aligned using ClustalW (Thompson et al. 1994) at http://www.expasy.org/cgi-bin/hub (Gasteiger et al. 2003). Horizontal traits in the plots represent gaps and are meant to help the eye. For all the species, no significant peak is found in the N-terminal tandem repeats. The secondary structural elements of the human prion are labeled with Greek letters and the stretches corresponding to the three α-helices are emphasized by shadowed rectangles.
Table 3.
Peak at position 175. Prion compatibilies of animals with respect to human
| Animal | Δπ/π |
| Turtle | 9.52 |
| Chicken | 8.72 |
| Sheep | 1.66 |
| Pig | 1.13 |
| Cow | 0.76 |
| Mouse | 0.76 |
| Hamster | 0.15 |
The distance with respect to the human prion sequence is measured as Δπ/π = (πanimal – πhuman)/πhuman using a window size of five amino acids for the rate calculation and summing over the segment 165–185 to better sample the variability around the peak.
To compare with experiments in vitro (Vanik et al. 2004), we analyzed the unstructured region of the prion protein (residues 1–122) in human, mouse, and hamster prion peptides. We found thathuman and mouse prions share similar amyloid spectra (i.e., 98% correlation), while the hamster prion diverges from them at position 143 (position 116 in the nonaligned human sequence). More specifically, the stretch 143–148 of hamster prion (position 116–121 in the nonaligned human sequence) is found to be less amyloidogenic than the corresponding segment in mouse and human (ln πhamster = −16, ln πmouse = −12, and ln πhuman = −12), which is consistent with the prion 1–122 species barrier observed in vitro (Vanik et al. 2004).
Huntingtin
The gene for Huntington’s disease consists of 67 hexons and contains an open reading frame for a polypeptide of > 3140 residues. Using a window size of five residues, our model identifies the N-terminal poly(Gln) repeat and the stretch IFFFL in the middle of the sequence as the two most prone to induce ordered aggregates. With window sizes larger than 20, the N-terminal poly(Gln) repeat dominates and the peak in the middle of the sequence disappears.
Our model is not sensitive enough to discriminate repeats of fewer than 38 glutamine residues from those with > 41 glutamine residues; the former are harmless, whereas the latter are responsible for toxic aggregates (Perutz et al. 1994; Perutz 1999). Alternatively, the dramatic difference in toxicity observed at a repeat length of ~40 might require the context of a much longer polypeptide sequence.
Conclusions
The model presented here was motivated by the challenging tasks of predicting aggregation propensity and identifying β-aggregating stretches in polypeptide sequences. An essential element in the derivation of the equation was the analysis of a large pool of β-aggregating peptide sequences designed by a computational approach based on molecular dynamics and genetic algorithm optimization in sequence space (G.G. Tartaglia and A. Caflisch, in prep.). The very good correlation between calculated and experimental rates for a large and heterogeneous set of polypeptide chains has allowed us to use the model to successfully identify β-aggregating segments and predict the parallel or anti-parallel arrangement. Fibrils formed by short segments of a protein might have a different molecular structure than the fibril of the full-length protein. Yet our results, as well as previous experimental (Chiti et al. 1999, 2003; Balbirnie et al. 2001) and computational (Fernandez Escamilla et al. 2004) works by others, indicate that the amyloid-forming part of a protein could be only a short segment of the entire chain. That a function based on simple physicochemical principles is able to predict aggregation ratesand identify β-aggregating fragments in proteins might be a consequence of the essential role of side-chain interactions in β-sheet aggregates (Gazit 2002; Gsponer et al. 2003; Linding et al. 2004).
Although some of the physicochemical properties in our model are similar to those used in previous works by others, it is important to distinguish approaches based on parameter optimization for a multiterm equation (Chiti et al. 2003; DuBay et al. 2004) from first-principle models like the one of this work and that of Tartaglia et al. (2004). On a very similar test set of peptides and proteins, the multi-parameter approach gives results comparable to those obtained with our model, but it is likely to have a lower predictive ability. As an example, positional effects are taken into account in our model, whereas they are neglected in the multiparameter approach (DuBay et al. 2004), which is mainly based on amino acid composition and alternation of hydrophobic–hydrophilic residues (Broome and Hecht 2000). Recent scanning proline mutagenesis, combined with critical concentration analysis and NMR hydrogen–deuterium exchange, indicate a strong positional effect on both the aggregation kinetics and structural properties of the Aβ40 fibril (Williams et al. 2004). Most importantly, the multiparameter approach cannot be used to identify β-aggregating segments as explicitly mentioned by the investigators (DuBay et al. 2004).
Recently, an approach based on secondary structure propensity and estimation of desolvation penalty (TANGO) has been shown to accurately predict the sequence-dependent and mutational effects on the aggregation of a large data set of peptides and proteins (Fernandez Escamilla et al. 2004). TANGO is based on the assumption that the probability of finding > 2 ordered segments in the same polypeptide is negligible. The investigators report that TANGO allows quantitative comparison within the same polypeptide chain or mutants. On the other hand, only qualitative comparison between different polypeptide chains is possible with TANGO (Fernandez Escamilla et al. 2004), whereas our model allows for the prediction of absolute rates (Fig. 1 ▶).
In conclusion, we have identified the physicochemical properties of amino acids that are essential for ordered aggregation and proposed a model that takes into account sequence effects for aromatic and charged residues, as well as composition. Compared with the models previously published by others, our equation is the only one that takes explicitly into account π-stacking. Very recent high-resolution structural data (electron and X-ray diffraction) have provided strong evidence for the importance of aromatic side chains for amyloid formation (Makin et al. 2005).
Our model derived from first principles and analysis of in silico designed sequences is able to predict aggregation rates and identify β-aggregating segments with high accuracy, suggesting possible biological implications as in the prion protein case. For nonmammalian prions, the absence of the peak at position 175 observed in mammals decreases the overall aggregation propensity, indicating a species-specific behavior consistent with experiments (Marcotte and Eisenberg 1999; Matthews and Cooke 2003) and supporting the hypothesis of a species barrier in the transmission of the prion disease (Hill et al. 2000).
In the accompanying article we present a bioinformatics application of our model that reveals an anti-correlation between organism complexity and proteomic β-aggregation propensity (Tartaglia et al. 2005).
Materials and methods
Absolute rate equation
An equation based on physicochemical properties of natural amino acids is introduced to estimate the aggregation rate of proteins and identify β-aggregating segments. Aromaticity, β-propensity, and formal charges play a major role in our model, as they are known in the literature to be determinant for fibrillization (Gazit 2002; Tjernberg et al. 2002; Chiti et al. 2003). Polar and nonpolar surfaces, as well as solubility, are also taken into account following an analysis of sequences designed to aggregate into β-sheets. The design of β-aggregating sequences was performed by structural sampling using molecular dynamics and peptide sequence optimization by a genetic algorithm (Tartaglia et al. 2004; G.G. Tartaglia and A. Caflisch, in prep.) (see subsection Derivation of the Equation). The aggregation propensity πil of an l-residue segment starting at position i in the sequence is evaluated as:
 |
(1) |
The factor Φil contains exponential functions and is position-dependent
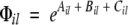 |
(2) |
where Ail, Bil, and Cil are functionals related to the aromaticity, β-propensity, and charge, respectively. The factor φil depends almost exclusively on the amino acid composition
 |
(3) |
where Sai, Spi, Sti, and σi—weighted by their average over the 20 standard amino acids (hatted values)—are the side-chain apolar, polar, total water-accessible surface area, and solubility, respectively (see subsection Parallel and Anti-Parallel Configuration). The functionals θ↑↑ and θ↑↓ include positional effects and reflect the parallel or anti-parallel tendency to aggregate if the majority of residues is apolar or polar, respectively. Considering the high correlation between measured and predicted changes in aggregation rate upon single point mutations (Chiti et al. 2003; DuBay et al. 2004; Tartaglia et al. 2004), it is possible to utilize the propensity πil to predict the absolute rate νil
 |
(4) |
where α(c,T) is introduced to take into account concentration and temperature (see subsection Concentration and Temperature).
Parallel and anti-parallel configuration
The functional for the parallel or anti-parallel configuration was introduced following the analysis of sequences designed by genetic algorithm optimization (see subsection Derivation of the Equation; Fig. 6 ▶):
Figure 6.

Computational design: A genetic algorithm approach was developed to search the space of peptide sequences for those with the best match to a given three-dimensional target conformation, i.e., an in-register parallel or anti-parallel aggregate of three heptapeptides (Gsponer et al. 2003). For each peptide sequence, three replicas were submitted to a 330 K molecular dynamics simulation, starting from the β-aggregated conformation using CHARMM parameter 19 and a solvent-accessible surface-based solvation model (Brooks et al. 1983; Ferrara et al. 2002). The sequence optimization was performed by evolutionary cycles. A total of 1728 sequences was sampled after 18 cycles. In sequences selected for the parallel aggregation, the number of aliphatic and aromatic residues increases almost monotonically, while the number of charged and polar residues decreases. The opposite is observed in sequences selected for the anti-parallel aggregation. In the plots, the number of aliphatic, aromatic, charged, and polar residues is normalized by the length of the peptide and averaged over the population (48 peptides per cycle).
The parallel in-register β-sheet organization within fibrils is favored by the number of side chains involved in π-stacking (Tyr, Phe, and Trp) and apolar interactions (Ala, Gly, Ile, Leu, Met, Pro, and Val) (McGaughey et al. 1998; Azriel and Gazit 2001; Jenkins and Pickersgill 2001; Makin et al. 2005). The number of aromatic and apolar residues is indicated with naromatic and napolar, respectively. Hydrogen bonds between polar residues are not considered for the parallel aggregation because the number of polar residues decreases significantly during the optimization of parallel aggregated sequences (Fig. 6 ▶).
The anti-parallel configuration is mainly determined by the electric dipole moment of the polypeptide (Hwang et al. 2004). Sequences abounding in polar residues show a small tendency for the parallel in-register aggregation because of unfavorable dipole–dipole interactions between side chains. Hence, the anti-parallel organization is promoted by the number of polar residues (Arg, Asn, Asp, Cys, Gln, Glu, His, Lys, Ser, and Thr), which is indicated with npolar. In some specific positions, charged (Arg, Lys, Asp, and Glu) and aromatic amino acids contribute to the anti-parallel aggregation. “Specific positions” means that one or more couples of opposite charged residues or one or more aromatic residues are symmetrically placed with respect to the center of the sequence (Balbach et al. 2000; Hwang et al. 2004; Makin et al. 2005). In this specific case, the number of charged and aromatic residues is labeled as nscharge and nsaromatic, respectively.
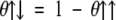
In Equation 3, a parallel configuration is preferred if napolar + naromatic > npolar + nscharge + nsaromatic. Since the number of aromatic residues in symmetric position is always smaller than the total amount of aromatic residues, naromatic ≥ nsaromatic (e.g., in the APP stretch: LVFFA naromatic = 2, nsaromatic = 1), we used a stricter condition for the parallel arrangement napolar > npolar + nscharge. The stricter condition allows the factorization of aromatic contributions in Equation 1. In the φil factor of Equation 3, θ↑↑ and θ↑↓ are
 |
 |
It is useful to explain the effect of the θ↑↑ and θ↑↓ functional by some examples. The segment LVFFA at position 671–676 of the APP is predicted to be parallel because it satisfies the parallel condition napolar > npolar + nscharge with napolar = 3 and npolar = nscharge = 0 (θ↑↑ = 1). The segment KLVFFAE (at position 670–677 of the APP), with two opposite charged residues, has anti-parallel propensity because it satisfies the anti-parallel condition napolar < npolar + nscharge with napolar = 3 and npolar = nscharge = 2 (θ↑↓ = 1).
The IAPP stretch FGAIL at position 22–26 is predicted to be parallel (napolar = 4 and npolar = nscharge = 0, i.e., θ↑↑ = 1), in agreement with experimental results (Kayed et al. 1999a; Azriel and Gazit 2001; Gazit 2002). As in Azriel and Gazit (2001), the following stretches are predicted to be parallel: SVQFV at position 289–292 of lactadherin; DCFIL, CFILD, and FILDL at position 187–191, 188–192, and 189–193 of gelsolin, respectively; FFSFL, FSFLG, and SFLGE at position 3–7, 4–8, and 5–9 of serum amyloid, respectively.
Poly(Gln), poly(Asn), and poly(Lys) homopolymers are predicted to be in an anti-parallel arrangement, as proposed in Perutz et al. (1994), Scherzinger et al. (1997), and Michelitsch and Weissman (2000) and observed by Tanaka et al. (2001) and Dzwolak et al. (2004). Moreover, it is likely that completely aliphatic sequences result in amorphous aggregates if N and C termini are capped, while a tendency to the anti-parallel arrangement is expected for short stretches with charged termini (e.g., transthyretin’s stretch IAALL). Capping groups are neglected in the present version of the model.
The fragment GNNQQNY from the Sup35 yeast prion is predicted to be anti-parallel (napolar = 1, npolar = 5, and nscharge = 0, i.e., θ↑↓ = 1), in contrast with the parallel packing suggested on the basis of X-ray diffraction and Fourier transform infrared (FTIR) data (Balbirnie et al. 2001). On one hand, it is important to note that the experimental data supporting a parallel arrangement are not conclusive, and, in particular, FTIR can be misleading on this point. In fact, in the unit cell of the microcrystals, the parallel β-sheets are proposed to be in anti-parallel contact along the fibril axis. On the other hand, a possible reason for the parallel configuration is that the π-interactions between the Tyr side chains are much less favorable in the anti-parallel configuration.
Aromatic residues
Aromatic side chains contribute to the parallel aggregation with π-interactions (McGaughey et al. 1998; Azriel and Gazit 2001; Makin et al. 2005). The density of aromatic residues naromatic/l is used to distinguish two regimes for the aromatic contribution Ail of Equation 2:
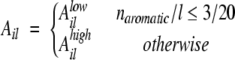 |
where 3/20 is the aromatic density averaged over the 20 standard amino acids and naromatic was defined in the previous subsection. In the case of low aromatic density (naromatic/l≤3/20), Aillow takes into account the polar/apolar environment. Following the results obtained by the genetic algorithm optimization of β-aggregation-prone sequences (see Fig. 6 ▶), Aillow has a positive effect for mainly apolar sequences and a negative contribution for mainly polar sequences:
 |
The variables napolar, npolar, and nscharge are defined in the previous subsection.
As an example, the APP stretch LVFFAEDVGSNKGAIIGLMVGGVVI shows low aromatic density (naromatic/l = 2/25 < 3/20). Since i = 671, l = 25, napolar = 17, npolar = 6, and nscharge = 0, the aromatic contribution for LVFFAEDVGSNKGAIIGLMVGGVVI is Alow671 25 = 2 [17 − 6] 25−1 = 0.88.
In the case of a high aromatic density (naromatic/l > 3/20), the model takes into account the number of aromatic residues:
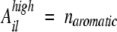 |
As an example, the APP stretch LVFFA shows high aromatic density (naromatic/l = 2/5 > 3/20). Since i = 671 and l = 5, the aromatic contribution for LVFFA is Ahigh6715 = 2.
Besides the total amount of aromatic residues and the position dependence, which enters Equation 2 through Aillow, the different polar and apolar side-chain surfaces, solubility, and β-propensity of Phe, Tyr, and Trp are taken into account in the factor φil. Hence, the mutation F22Y for the IAPP (islet β-amyloid protein precursor) stretch NFGAILSS produces a sensible change of rate (ln πwt = −6,ln πF22Y = −7), compatible with experiments in vitro (Porat et al. 2003).
β-Propensity
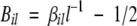
The β-propensity is evaluated as the fraction of residues that stabilize the β-sheet more than the α-helix:
 |
The function βil is defined as:
 |
where
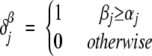 |
The variables αj and βj correspond to the α-helix and β-sheet stabilizing effects of the amino acid at position j (Fersht 1999). Values of αj and βj are normalized from 0 (low stabilization) to 1 (high stabilization) to have the same range of variability. In the function Bil, the offset value of 1/2 is introduced so that Bil > 0 if at least one-half of the residues in the sequence is more stable in a β-sheet rather than in an β-helix conformation (i.e., βil > l−1/2).
In the case of the APP stretch LVFFA, values are i = 671, l = 5, β672 = β673 = β674 = 1, and β671 = β675 = 0. The predicted β-propensity for LVFFA is β671 5 = 3/5 − 1/2 = 0.1.
Charged residues
As in other models, we consider that the electrostatic repulsion of charged sequences penalizes the aggregation (Chiti et al. 2003; Tartaglia et al. 2004). In addition, our model takes into account the fact that side-chain pairs with opposite charges and positioned symmetrically with respect to the center of the segment contribute to the anti-parallel aggregation, as found in experiments (Gordon et al. 2004). In Equation 2, the charge contribution Cil is
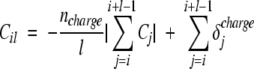 |
where Cj is the charge of the side chain and ncharge is the number of charged residues. The first term of the functional Cil takes into account the electrostatic repulsion between polypeptides with net charge different from zero. The second term counts the number of pairs of opposite charged side chains that are symmetrically placed with respect to the central residue of the sequence:
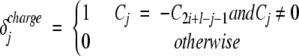 |
In the case of the APP stretch KLVFFAE, the residues K670 and E676 have opposite charges and are symmetrically placed with respect to the central amino acid F673. Since i = 670, l = 7, C670 = +1, and C1340 + 7 − 670 − 1 = C676 = −1, the net charge for KLVFFAE is |∑i+l−1j=i Cj| = 0 and the oppositely charged K670 and E676 give C670 7 = δcharge670 + δcharge676 = 2.
Surfaces and solubility
For sequences that are predominantly apolar (θ↑↑ = 1; see subsection Parallel and Anti-Parallel Configuration), the apolar water-accessible surface Saj measures the contribution of hydrophobic side chains to aggregation. For mostly polar sequences (θ↑↓ = 1), the polar water-accessible surface S pj takes into account the propensity to form hydrogen bonds between polar residues. The total surface Sjt = Saj + Spj is used to weight polar and apolar surfaces by the total area. Values of apolar and polar side-chain surfaces are given in our previous work (Tartaglia et al. 2004) and span the intervals 44–195 Å2 and 27–107 Å2, respectively. Averaged values are Ŝa = 108 Å2 and Ŝp = 54 Å2. In the case of poly(Gln), values of surfaces are Sa = 53 Å2 and Sp = 91 Å2. Since Gln is polar and θ↑↓ = 1, the surface contribution is Sp/Ŝp•Ŝt/St = (91/54)(162/144) = 1.9.
The variable σj takes into account the water solubility of the side chain at position j. In our model, aggregation propensity and solubility are inversely proportional to introduce a penalty for highly soluble polypeptides. Most of the solubility values are available at http://acrux.igh.cnrs.fr/proteomics/densities_pi.html (Nahway 1989). The missing values (Cys, Lys, and Thr) were taken from http://www.formedium.com/Europe/amino_acids_and_vitamins.htm. The variable σj spans the interval 0.04–162 g/100 g, with average σ̂ = 3.95 g/100 g. In the case of poly(Gln), σ̂/σ = 3.95/2.5 = 1.5, which indicates low solubility in agreement with experiments of β-aggregation (Perutz et al. 1994; Perutz 1999).
Concentration and temperature
The function α(c,T) captures the effects of concentration (c) and temperature (T) in Equation 4:
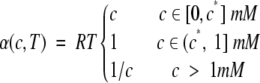 |
The aggregation rate ν is approximated to be proportional to the temperature because the probability of collision and elongation of peptides increases with temperature (Kusumoto et al. 1998). Although aggregation rate and temperature are not expected to correlate above physiological values (Massi and Straub 2001), we used a simple linear dependence, which is preferable for the small extent of experimentally accessible values of the temperature. In fact, the temperature ranges from 298 K to 310 K in the data set of Figure 1 ▶.
In agreement with quasielastic light-scattering experiments of fibrillogenesis of Aβ40, the aggregation rate ν is assumed to be proportional to the concentration for c < c* mM (c* = 0.1 mM) and to be independent of concentration above the critical value c = c* (Lomakin et al. 1996, 1997) (see also subsection-Derivation of the Equation). The hyperbolic function 1/c was introduced to decrease the aggregation rate ν for c > 1 mM, as there is experimental evidence that a very high concentration opposes formation of ordered aggregates (Munishkina et al. 2004). The concentration ranges from 0.01 mM to 20 mM in the data set of Figure 1 ▶.
Derivation of the equation
Functionals for aromaticity, β-propensity, and charge were taken from our relative rate equation (Tartaglia et al. 2004). The aromatic term was modified according to the results obtained by the genetic algorithm optimization of aggregating sequences (Fig. 6 ▶) (G.G. Tartaglia and A. Caflisch, in prep.). The functional for β-propensity, previously based on a single scale (Tartaglia et al. 2004), now takes into account β-versus α-propensity. Scales for β- and α-propensity are taken from Fersht (1999) and normalized in the range 0–1. The term used for the β-propensity was tested on 100 globular proteins: 82% of the β-sheet content is successfully recognized (data not shown). The functional for charged residues was modified with the addition of a term for symmetrically placed charges of opposite signs, which is consistent with experimental data (Gordon et al. 2004). The function ncharge/l replaces the constant factor in the relative rate (Tartaglia et al. 2004) and is introduced to weight the overall charge by the charge density. The three functionals for aromaticity, charge, and β-propensity can be zero. Exponential functions were introduced so that their product is different from zero.
The product of the three functionals was plotted versus available experimental rates (see next subsection), obtaining a correlation of 80%, while the individual correlations for aromaticity, charge, and β-propensity are 76%, 81%, and 70%, respectively.
The dependence on concentration and temperature was introduced to derive aggregationrates from propensities (Lomakin et al. 1997; Kusumoto et al. 1998; Massi and Straub 2001; Munishkina et al. 2004). With the concentration alone, the correlation improves to 85%. The correlation is 82% without the hyperbolic function for high concentrations (c > 1 mM). With the temperature function, the correlation improves to 88%.
The factor for polar/apolar contributions φil in Equation 1 was added upon the analysis of sequences produced by computational design (Fig. 6 ▶). The term is a linear combination of normalized surfaces and has a nonzero minimum. The correlation improves to 92%. The solubility dependence was added at the very end and introduces a penalty for highly soluble sequences. The correlation improves to 95%.
Experimental data
Most of the experimental rates were kindly provided by Dr. F. Chiti and Dr. M. Vendruscolo (Chiti et al. 2003; DuBay et al. 2004). The remainder data set was taken from previous experimental studies (Litvinovich et al. 1998; Konno et al. 1999; Ferguson et al. 2003). The absolute aggregation rates were determined from in vitro experiments of denaturated polypeptide chains without taking into account the presence of cellular components as chaperones and proteases. Aggregation rates were obtained from kinetic traces in different ways: thioflavin T fluorescence, turbidity, CD, sedimentation, size exclusion chromatography, and filtration. Lag phases were not considered in the analysis, as they were not reported or difficult to extract from published data (DuBay et al. 2004). Since a comprehensive understanding of lag phases in protein aggregation is lacking (Kayed et al. 1999b; Padrick and Miranker 2002) (e.g., it is not known whether fibrils form by addition of monomers or oligomers and how growth conditions influence the amyloid formation), the aggregation kinetics was analyzed after the lag phase. The elongation phase showing an exponential behavior is fitted to the function z = α (1 − e−νt) where ν is the rate measured in sec−1.
Acknowledgments
We thank Prof. C. Dobson, Prof. F. Chiti, Dr. M. Vendruscolo, and Dr. J. Zurdo for providing rates of several proteins. The molecular dynamics simulations were performed on the Matterhorn Beowulf cluster at the Informatikdienste at the University of Zurich. We thank C. Bolliger, Dr. T. Steenbock, and Dr. A. Godknecht for setting up and maintaining the cluster. This work was supported by the Swiss National Science Foundation and the NCCR “Neural Plasticity and Repair.”
The program for the calculation of aggregation rates is available from the corresponding author upon request.
Article and publication are at http://www.proteinscience.org/cgi/doi/10.1110/ps.051471205.
References
- Antzutkin, O.N., Balbach, J.J., Leapman, R.D., Rizzo, N.W., Reed, J., and Tycko, R. 2000. Multiple quantum solid-state NMR indicates a parallel, not antiparallel, organization of β-sheets in Alzheimer’s β-amyloid fibrils. Proc. Natl. Acad. Sci. 97 13045–13050. [DOI] [PMC free article] [PubMed] [Google Scholar]
- Antzutkin, O.N., Leapman, R.D., Balbach, J.J., and Tycko, R. 2002. Supramolecular structural constraints on Alzheimer’s-amyloid fibrils from electron microscopy and solid-state nuclear magnetic resonance. Biochemistry 41 15436–15450. [DOI] [PubMed] [Google Scholar]
- Asl, L.H., Liepnieks, J.J., Uemichi, T., Rebibou, J.M., Justrabo, E., Droz, D., Mousson, J.M.C., Benson, M.D., Delpech, M., and Grateau, G. 1997. Renal amyloidosis with a frame shift mutation in fibrinogen α-chain gene producing a novel amyloid protein. Blood 90 4799–4805. [PubMed] [Google Scholar]
- Azriel, R. and Gazit, E. 2001. Analysis of the minimal amyloid-forming fragment of the Islet amyloid polypeptide. J. Biol. Chem. 276 34156–34161. [DOI] [PubMed] [Google Scholar]
- Balbach, J.J., Ishii, Y., Antzutkin, O.N., Leapman, R.D., Rizzo, N.W., Dyda, F., Reed, J., and Tycko, R. 2000. Amyloid fibril formation by a β16–22, a seven-residue fragment of the Alzheimer’s β-amyloid peptide, and structural characterization by solid state NMR. Biochemistry 39 13748–13759. [DOI] [PubMed] [Google Scholar]
- Balbirnie, M., Grothe, R., and Eisenberg, D. 2001. An amyloid-forming peptide from the yeast prion Sup35 reveals a dehydrated β-sheet structure for amyloid. Proc. Natl. Acad. Sci. 98 2375–2380. [DOI] [PMC free article] [PubMed] [Google Scholar]
- Bitan, G., Kirkitadze, M.D., Lomakin, A., Vollers, S.S., Benedek, G.B., and Teplow, B.D. 2003. Amyloid Aβ-protein Aβ assembly: Aβ40 and Aβ42 oligomerize through distinct pathways. Proc. Natl. Acad. Sci. 100 330–335. [DOI] [PMC free article] [PubMed] [Google Scholar]
- Bond, J.P., Deverin, S.P., Inouye, H., El-Agnaf, O.M.A, Teeter, M.M., and Kirschnera, D.A. 2003. Assemblies of Alzheimer’s peptides Aβ25–35 and Aβ31–35: Reverse-turn conformation and side-chain interactions revealed by x-ray diffraction. J. Struct. Biol. 141 156–170. [DOI] [PubMed] [Google Scholar]
- Brooks, B.R., Bruccoleri, R.E., Olafson, B.D., States, D.J., Swaminathan, S., and Karplus, M. 1983. CHARMM:A program for macromolecular energy, minimization, and dynamics calculations. J. Comput. Chem. 4 187–217. [Google Scholar]
- Broome, B.M. and Hecht, M.H. 2000. Nature disfavors sequences of alternating polar and non-polar amino acids: Implications for amyloidogenesis. J. Mol. Biol. 296 961–968. [DOI] [PubMed] [Google Scholar]
- Chiti, F., Calamai, M., Taddei, N., Stefani, M., Ramponi, G., and Dobson, C.M. 1999. Studies of the aggregation of mutant proteins in vitro provide insights into the genetics of amyloid diseases. Proc. Natl. Acad. Sci. 99 16419–16426. [DOI] [PMC free article] [PubMed] [Google Scholar]
- Chiti, F., Stefani, M., Taddei, N., Ramponi, G., and Dobson, C.M. 2003. Rationalization of the effects of mutations on peptide and protein aggregation rates. Nature 424 805–808. [DOI] [PubMed] [Google Scholar]
- Dobson, C.M. 1999. Protein misfolding, evolution and disease. Trends Biochem. Sci. 24 329–332. [DOI] [PubMed] [Google Scholar]
- DuBay, K.F., Pawar, A.P., Chiti, F., Zurdo, J., Dobson, C.M., and Vendruscolo, M. 2004. Predicting absolute aggregation rates of amyloidogenic polypeptide chains. J. Mol. Biol. 341 1317–1326. [DOI] [PubMed] [Google Scholar]
- Dzwolak, W., Muraki, T., Kato, M., and Taniguchi, Y. 2004. Chain-length dependence of α-helix to β-sheet transition in polylysine: Model of protein aggregation studied by temperature-tuned FTIR spectroscopy. Biopolymers 73 463–469. [DOI] [PubMed] [Google Scholar]
- El-Agnaf, O.M.A., Sheridan, J.M., Sidera, C., Siligardi, G., Hussain, R., Haris, P.I., and Austen, B.M. 2001. Effect of the disulfide bridge and the C-terminal extension on the oligomerization of the amyloid peptide ABri implicated in familial British dementia. Biochemistry 40 3449–3457. [DOI] [PubMed] [Google Scholar]
- El-Agnaf, O.M.A., Gibson, G., Lee, M., Wright, A., and Austen, B.M. 2004. Properties of neurotoxic peptides related to the Bri gene. Protein Pept. Lett. 11 202–212. [DOI] [PubMed] [Google Scholar]
- Ferguson, N., Berriman, J., Petrovich, M., Sharpe, T.D., Finch, J.T., and Fersht, A.R. 2003. Rapid amyloid fibril formation from the fast-folding WW domain FBP28. Proc. Natl. Acad. Sci. 100 9814–9819. [DOI] [PMC free article] [PubMed] [Google Scholar]
- Fernandez Escamilla, A.M., Rousseau, F., Schymkowitz, J., and Serrano, L. 2004. Prediction of sequence-dependent and mutational effects on the aggregation of peptides and proteins. Nat. Biotech. 22 1302–1306. [DOI] [PubMed] [Google Scholar]
- Ferrara, P., Apostolakis, J., and Caflisch, A. 2002. Evaluation of a fast implicit solvent model for molecular dynamics simulations. Proteins 46 24–33. [DOI] [PubMed] [Google Scholar]
- Fersht, A.R. 1999. Structure and mechanism in protein science. Freeman and Co., New York.
- Gasteiger, E., Gattiker, A., Hoogland, C., Ivanyi, I., Appel, R.D., and Bairoch, A. 2003. Expasy: The proteomics server for in depth protein knowledge and analysis. Nucleic Acids Res. 31 3784–3788. [DOI] [PMC free article] [PubMed] [Google Scholar]
- Gazit, E. 2002. A possible role for π-stacking in the self-assembly of amyloid fibrils. FASEB J. 16 77–83. [DOI] [PubMed] [Google Scholar]
- Gordon, D.J., Balbach, J.J., Tycko, R., and Meredith, S.C. 2004. Increasing the amphiphilicity of an amyloidogenic peptide changes the β-sheet structure in the fibrils from antiparallel to parallel. Biophys. J. 86 428–434. [DOI] [PMC free article] [PubMed] [Google Scholar]
- Gsponer, J., Habertuer, U., and Caflisch, A. 2003. The role of side-chain interactions in the early steps of aggregation: Molecular dynamics simulations of an amyloid-forming peptide from the yeast prion Sup35. Proc. Natl. Acad. Sci. 100 5154–5159. [DOI] [PMC free article] [PubMed] [Google Scholar]
- Haggqvist, B., Naeslund, J., Sletten, K., Westermark, G.T., Mucchiano, G., Tjernberg, L.O., Nordstedt, C., Engstroem, U., and Westermark, P. 1999. Medin: An integral fragment of aortic smooth muscle cell-produced lactadherin forms the most common human amyloid. Proc. Natl. Acad. Sci. 96 8669–8674. [DOI] [PMC free article] [PubMed] [Google Scholar]
- Hill, A.F., Joiner, S., Linehan, J., Desbruslais, M., Lantos, P.L., and Collinge, J. 2000. Species-barrier-independent prion replicates in apparently resistant species. Proc. Natl. Acad. Sci. 97 10248–10253. [DOI] [PMC free article] [PubMed] [Google Scholar]
- Horwich, A.L. and Weissman, J.S. 1997. Deadly conformations-protein misfolding disease. Cell 89 499–510. [DOI] [PubMed] [Google Scholar]
- Hwang, W., Zhang, S., Kamm, R.D., and Karplus, M. 2004. Kinetic control of dimer structure formation in amyloid fibrillogenesis. Proc. Natl. Acad. Sci. 101 12916–12921. [DOI] [PMC free article] [PubMed] [Google Scholar]
- Jaroniec, C.P., MacPhee, C.E., Astrof, N.S., Dobson, C.M., and Griffin, R.G. 2002. Molecular conformation of a peptide fragment of transthyretin in an amyloid fibril. Proc. Natl. Acad. Sci. 99 16748–16753. [DOI] [PMC free article] [PubMed] [Google Scholar]
- Jarrett, J., Berger, E.P., and Lansbury Jr., P.T. 1993. The carboxyl terminus of the β amyloid protein critical for the seeding of amyloid formation: Implications for the pathogenesis of Alzheimer’s disease. Biochemistry 32 4693–4697. [DOI] [PubMed] [Google Scholar]
- Jenkins, J. and Pickersgill, R. 2001. The architecture of parallel β-helices and related folds. Prog. Biophys. Mol. Biol. 77 111–115. [DOI] [PubMed] [Google Scholar]
- Jimenez, J.L., Nettleton, E.J., Bouchard, M., Robinson, C.V., Dobson, C.M., and Saibil, H.R. 2002. The protofilament structure of insulin amyloid fibrils. Proc. Natl. Acad. Sci. 99 9196–9201. [DOI] [PMC free article] [PubMed] [Google Scholar]
- Jones, S., Manning, J., Kad, N.M., and Radford, S.E. 2003. Amyloid-forming peptides from b2 microglobulin—Insights into the mechanism of fibril formation in vitro. J. Mol. Biol. 325 249–257. [DOI] [PubMed] [Google Scholar]
- Kangas, H., Paunio, T., Kalkkinen, N., Jalanko, A., and Peltonen, L. 1996. In vitro expression analysis shows that the secretory form of Gelsolin is the sole source of amyloid in Gelsolin-related amyloidosis. Hum. Mol. Genet. 5 1237–1244. [DOI] [PubMed] [Google Scholar]
- Kayed, R., Bernhagen, J., Greenfield, N., Sweimeh, K., Brummer, H., Voelter, W., and Kapurniotu, A. 1999a. Conformational transitions of islet amyloid polypeptide (IAPP) in amyloid formation in vitro. J. Mol. Biol. 287 781–796. [DOI] [PubMed] [Google Scholar]
- ———. 1999b. Partial molar volume, surface area, and hydration changes for equilibrium unfolding and formation of aggregation transition state: High-pressure and cosolute studies on recombinant human IFN-γ. J. Mol. Biol. 287 781–796. [DOI] [PMC free article] [PubMed] [Google Scholar]
- Kelly, J. 1998. The alternative conformations of amyloidogenic proteins and their multi-step assembly pathways. Curr. Opin. Struct. Biol. 8 101–106. [DOI] [PubMed] [Google Scholar]
- King, C.Y., Tittmann, P., Gross, H., Gebert, R., Aebi, M., and Wuethrich, K. 1997. Prion-inducing domain 2–114 of yeast Sup35 protein transforms in vitro into amyloid-like filaments. Proc. Natl. Acad. Sci. 94 6618–6622. [DOI] [PMC free article] [PubMed] [Google Scholar]
- Konno, T., Murata, K., and Nagayama, K. 1999. Amyloid-like aggregates of a plant protein: A case of sweet tasting protein, monellin. FEBS Lett. 454 122–126. [DOI] [PubMed] [Google Scholar]
- Kozin, S.A., Bertho, G., Mazur, A.K., Rabesona, H., Girault, J.P., Haerlthé, T., Takahashi, M., Debey, P., and Hui Bon Hoa, G. 2001. Sheep prion protein synthetic peptide spanning helix 1 and β-strand 2 residues 142–166 shows β-hairpin structure in solution. J. Biol. Chem. 49 46364–46370. [DOI] [PubMed] [Google Scholar]
- Kusumoto, Y., Lomakin, A., Teplow, D.B., and Benedek, G.B. 1998. Temperature dependence of amyloid β-protein fibrillization. Proc. Natl. Acad. Sci. 95 12277–12282. [DOI] [PMC free article] [PubMed] [Google Scholar]
- Linding, R., Schymkowitz, J., Rousseau, J., Diella, F., and Serrano, L. 2004. A comparative study of the relationship between protein structure and β-aggregation in globular and intrinsically disordered proteins. J. Mol. Biol. 342 345–353. [DOI] [PubMed] [Google Scholar]
- Litvinovich, S.V., Brew, S.A., Aota, S., Akiyama, S.K., Haudenschild, C., and Ingham, K.C. 1998. Formation of amyloid like fibrils by self-association of a partially unfolded fibronectin type III module. J. Mol. Biol. 280 245–258. [DOI] [PubMed] [Google Scholar]
- Lomakin, A., Chung, D.S., Benedek, G.B., Kirschner, D.A., and Teplow, D.B. 1996. On the nucleation and growth of amyloid β-protein fibrils: Detection of nuclei and quantitation of rate constants. Proc. Natl. Acad. Sci. 93 1125–1129. [DOI] [PMC free article] [PubMed] [Google Scholar]
- Lomakin, A., Teplow, D.B., Kirschner, D.A., and Benedek, G.B. 1997. Kinetic theory of fibrillogenesis of amyloid β-protein. Proc. Natl. Acad. Sci. 94 7942–7947. [DOI] [PMC free article] [PubMed] [Google Scholar]
- Makin, O.S., Atkins, E., Sikorski, P., Johansson, J., and Serpell, L.C. 2005. Molecular basis for amyloid fibril formation and stability. Proc. Natl. Acad. Sci. 102 315–320. [DOI] [PMC free article] [PubMed] [Google Scholar]
- Marcotte, E.M. and Eisenberg, D. 1999. Chicken prion tandem repeats form a stable, protease-resistant domain. Biochemistry 38 667–676. [DOI] [PubMed] [Google Scholar]
- Margittai, M. and Langen, R. 2004. Template-assisted filament growth by parallel stacking of τ. Proc. Natl. Acad. Sci. 101 10279–10283. [DOI] [PMC free article] [PubMed] [Google Scholar]
- Massi, F. and Straub, J.E. 2001. Energy landscape theory for Alzheimer’s amyloid β-peptide fibril elongation. Proteins 42 217–229. [DOI] [PubMed] [Google Scholar]
- Matthews, D. and Cooke, B. 2003. The potential for transmissible spongiform encephalopathies in non-ruminant livestock and fish. Rev. Sci. Tech. 22 283–296. [DOI] [PubMed] [Google Scholar]
- McGaughey, G.B., Gagné, M., and Rappé, A.K. 1998. π-Stacking interaction. J. Biol. Chem. 273 15458–15463. [DOI] [PubMed] [Google Scholar]
- Michelitsch, M.D. and Weissman, J.S. 2000. A census of glutamine/asparagine-rich regions: Implications for their conserved function and the prediction of novel prions. Proc. Natl. Acad. Sci. 97 11910–11915. [DOI] [PMC free article] [PubMed] [Google Scholar]
- Munishkina, L.A., Fink, A.L., and Uversky, V.U. 2004. Conformational prerequisites for formation of amyloid fibrils from histones. J. Mol. Biol. 342 1305–1324. [DOI] [PubMed] [Google Scholar]
- Nahway, N. 1989. The Merck index. Merck and Co., Inc., Whitehouse Station, NJ.
- Nguyen, J., Baldwin, M.A., Cohen, F.E., and Prusiner, S.B. 1995. Prion protein peptides induce α-helix to β-sheet conformational transitions. Biochemistry 34 4186–4192. [DOI] [PubMed] [Google Scholar]
- Nichols, W.C., Dwulet, F.E., Liepnieks, J., and Benson, M.D. 1988. Variant apolipoprotein AI as a major constituent of a human hereditary amyloid. Biochem. Biophys. Res. Commun. 156 762–768. [DOI] [PubMed] [Google Scholar]
- Padrick, S.B. and Miranker, A.D. 2002. Islet amyloid: Phase partitioning and secondary nucleation are central to the mechanism of fibrillogenesis. Biochemistry 41 4694–4703. [DOI] [PubMed] [Google Scholar]
- Perutz, M.F. 1999. Glutamine repeats and neurodegenerative diseases: Molecular aspects. Trends Biochem. Sci. 24 58–64. [DOI] [PubMed] [Google Scholar]
- Perutz, M.F., Johnson, T., Suzuki, M., and Finch, J.T. 1994. Glutamine repeats as polar zippers: Their possible role in inherited neurodegenerative diseases. Proc. Natl. Acad. Sci. 91 5355–5358. [DOI] [PMC free article] [PubMed] [Google Scholar]
- Porat, Y., Stepensky, A., Ding, F.X., Naider, F., and Gazit, E. 2003. Completely different amyloidogenic potential of nearly identical peptide fragments. Biopolymers 69 161–163. [DOI] [PubMed] [Google Scholar]
- Prusiner, S.B. 1988. Prions. Proc. Natl. Acad. Sci. 95 13363–13383. [DOI] [PMC free article] [PubMed] [Google Scholar]
- Rochet, J.C. and Lansbury Jr., P.T. 2000. Amyloid fibrillogenesis: Themes and variations. Curr. Opin. Struct. Biol. 10 60–68. [DOI] [PubMed] [Google Scholar]
- Scherzinger, E., Lurz, R., Turmaine, M., Mangiarini, L., Hollenback, B., Hasenbank, R., Bates, G.P., Davies, S.W., Lehrack, H., and Wanker, E. 1997. Huntingtin-encoded polyglutamine expansions form amyloid-like protein aggregates in vitro and in vivo. Cell 90 549–558. [DOI] [PubMed] [Google Scholar]
- Soto, C. and Castilla, J. 2004. The controversial protein-only hypothesis of prion propagation. Nat. Med. 10 S63–S67. [DOI] [PubMed] [Google Scholar]
- Stefani, M. and Dobson, C.M. 2003. Protein aggregation and aggregate toxicity: New insights into protein folding, misfolding diseases and biological evolution. J. Mol. Med. 81 678–699. [DOI] [PubMed] [Google Scholar]
- Tanaka, M., Morishima, I., Akagi, T., Hashikawa, T., and Nukina, N. 2001. Intra and intermolecular β-pleated sheet formation in glutamine-repeat inserted myoglobin as a model for polyglutamine diseases. J. Biol. Chem. 276 45470–45475. [DOI] [PubMed] [Google Scholar]
- Tartaglia, G.G., Cavalli, A., Pellarin, R., and Caflisch, A. 2004. The role of aromaticity, exposed surface, and dipole moment in determining protein aggregation rates. Protein Sci. 13 1939–1941. [DOI] [PMC free article] [PubMed] [Google Scholar]
- Tartaglia, G.G., Pellarin, R., Cavalli, A., and Caflisch, A. 2005. Organism complexity anti-correlates with proteomic β-aggregation propensity. Protein Sci. (this issue). [DOI] [PMC free article] [PubMed]
- Tenidis, K., Waldner, M., Bernhagen, J., Fischle, W., Bermann, M., Weber, M., Merkle, M., Voelter, W., Brunner, H., and Kapurniotu, A. 2000. Identification of a penta- and hexapeptide of Islet amyloid polypeptide IAPP with amyloidogenic and cytotoxic properties. J. Mol. Biol. 295 1055–1071. [DOI] [PubMed] [Google Scholar]
- Thompson, J.D., Higgins, D.G., and Gibson, T.J. 1994. Clustal W: Improving the sensitivity of progressive multiple sequence alignment through sequence weighting, positions-specific gap penalties and weight matrix choice. Nucleic Acids Res. 22 4673–4680. [DOI] [PMC free article] [PubMed] [Google Scholar]
- Tjernberg, L., Hosia, W., Bark, N., Thyberg, J., and Johansson, J. 2002. Charge attraction and β-propensity are necessary for amyloid fibril formation from tetrapeptides. J. Biol. Chem. 277 43243–43246. [DOI] [PubMed] [Google Scholar]
- Torok, M., Milton, S., Kayed, R., Wu, P., Intire, T.M., Glabe, C., and Langen, R. 2002. Structural and dynamic features of Alzheimer Aβ peptide in amyloid fibrils studied by site-directed spin labeling. J. Biol. Chem. 277 40810–40815. [DOI] [PubMed] [Google Scholar]
- Ueda, K., Fukushima, H., Masliah, E., Xia, Y., Iwai, A., Yoshimoto, M., Otero, D.A., Kondo, J., Ihara, Y., and Saitoh, T. 1993. Molecular cloning of cDNA encoding an unrecognized component of amyloid in Alzheimer disease. Proc. Natl. Acad. Sci. 90 11282–11286. [DOI] [PMC free article] [PubMed] [Google Scholar]
- Vanik, D.L., Surewicz, K.A., and Surewicz, W.K. 2004. Molecular basis of barriers for intraspecies transmissibility of mammalian prions. Mol. Cell 14 139–145. [DOI] [PubMed] [Google Scholar]
- von Bergen, M., Friedhoff, P., Biernat, J., Heberle, J., Mandelkow, E.M., and Mandelkow, E. 2000. Assembly of τ protein into Alzheimer paired helical filaments depends on a local sequence motif (306VQIVYK311) forming β-structure. Proc. Natl. Acad. Sci. 97 5129–5134. [DOI] [PMC free article] [PubMed] [Google Scholar]
- Weidemann, A., Konig, G., Bunke, D., Fisher, P., Salbaum, J.M., Masters, C.L., and Beyreuther, K. 1989. Identification, biogenesis and localization of precursors of Alzheimer’s disease A4 amyloid protein. Cell 57 115–126. [DOI] [PubMed] [Google Scholar]
- Westermark, P., Wernstedt, C., Wilander, E., Hayden, D.W., O’Brien, T.D., and Johnson, K.H. 1987. Amyloid fibrils in human insulinoma and islets of Langerhans of the diabetic cat are derived from a neuro-peptide-like protein also present in normal islet cells. Proc. Natl. Acad. Sci. 84 3881–3885. [DOI] [PMC free article] [PubMed] [Google Scholar]
- Westermark, G.T., Engstrom, U., and Westermark, P. 1992. The N-terminal segment of protein AA determines its fibrillogenic propensity. Biochem. Biophys. Res. Commun. 182 27–32. [DOI] [PubMed] [Google Scholar]
- Williams, A.D., Portelius, E., Kheterpal, I., Guo, J.T., Cook, K.D., Xu, Y., and Wetzel, R. 2004. Mapping Aβ amyloid fibril secondary structure using scanning proline mutagenesis. J. Mol. Biol. 335 833–842. [DOI] [PubMed] [Google Scholar]
- Zoete, V., Michielin, O., and Karplus, M. 2003. Protein-ligand binding free energy estimation using molecular mechanics and continuum electrostatics. Application to HIV-1 protease inhibitors. J. Comput. Aided Mol. Des. 17 861–880. [DOI] [PubMed] [Google Scholar]