

Abstract
Glutathione S-transferases catalyze the conjugation of glutathione with endogenous and exogenous xenobiotics. Hu and Colman (1995) proposed that there are two distinct substrate sites in rat GST M1-1, a 1-chloro-2,4-dintrobenzene (CDNB) substrate site located in the vicinity of tyrosine-115, and a monobromobimane (mBBr) substrate site. To determine whether the mBBr substrate site is distinguishable from the CDNB substrate site, we tested S-(hydroxyethyl)bimane, a nonreactive derivative of mBBr, for its ability to compete kinetically with the substrates. We find that S-(hydroxyethyl)bimane is a competitive inhibitor (KI = 0.36 μM) when mBBr is used as substrate, but not when CDNB is used as substrate, demonstrating that these two sites are distinct. Using site-directed mutagenesis, we have localized the mBBr substrate site to an area midway through α-helix 4 (residues 90–114) and have identified residues that are important in the enzymatic reaction. Substitution of alanine at positions along α-helix 4 reveals that mutations at positions 103, 104, and 109 exhibit a greater perturbation of the enzymatic reaction with mBBr than with CDNB as substrate. Various other substitutions at positions 103 and 104 reveal that a hydrophobic residue is necessary at each of these positions to maintain optimal affinity of the enzyme for mBBr and preserve the secondary structure of the enzyme. Substitutions at position 109 indicate that this residue is important in the enzyme’s affinity for mBBr but has a minimal effect on Vmax. These results demonstrate that the promiscuity of rat GST M1-1 is in part due to at least two distinct substrate sites.
Keywords: glutathione S-transferase M1-1, monobromobimane, substrate site, site-directed mutagenesis
Glutathione S-transferases (EC 2.5.1.18) constitute a family of enzymes involved in Phase II detoxification of endogenous and exogenous xenobiotics (Jakoby and Habig 1980). These enzymes detoxify xenobiotics by catalyzing the nucleophilic addition of the thiolate of glutathione (GSH) to substrates bearing an electrophilic functional group. The conjugate is rendered more water-soluble, which is advantageous for excretion, usually as part of the mercapturic pathway (Mannervik and Danielson 1988; Boyer 1989; Pickett and Lu 1989; Coles and Ketterer 1990; Armstrong 1991). Physiologically, GSTs have been implicated in the protection against carcinogenesis as well as in drug resistance (Soberman and Austen 1989; Waxman 1990).
The GSTs are classified into three superfamilies: (1) dimeric soluble enzymes; (2) membrane-associated proteins involved in eicosanoid and GSH metabolism; and (3) bacterial plasmid-encoded, fosfomycin-resistant enzymes (Armstrong 1998). The dimeric soluble GSTs are further subdivided into at least eight classes based on their physical properties, sequence identity, and substrate specificity (Mannervik et al. 1985; Meyer et al. 1991; Pemble et al. 1996; Board et al. 1997, 2000; Rossjohn et al. 1998; Pettigrew et al. 2001). GSTs are ubiquitous in mammalian tissues but are particularly abundant in hepatic tissue, comprising ~4% of the cytosolic hepatocyte protein content (Eaton and Bammler 1999). Isozymes within a class exhibit at least 60% sequence identity, while the identity between classes is less than 30%, despite the generally conserved tertiary structure (Sheenan et al. 2001).
GST M1-1 belongs to the μ class of GSTs and has been crystallized as a dimer with a molecular mass of ~51.5 kDa (Ji et al. 1992, 1993). Each monomer has one complete active site consisting of a GSH site and one or more hydrophobic substrate sites.
In 1995, Hu and Colman demonstrated that mBBr was a substrate for rat GST M1-1 in the presence of GSH. Their work also showed that mBBr acts as an affinity label of rat GST M1-1 in the presence of the GSH derivative, S-methylglutathione, modifying Cys 114 and Tyr 115 (Hu and Colman 1995). Affinity labeling of Tyr 115 occurred parallel with the loss of activity as monitored by the CDNB assay, while labeling of Cys 114 was slower. Since the modified enzyme retained full catalytic activity toward the substrate mBBr, yet exhibited only 9% residual activity toward the substrate CDNB, it was proposed that there are two sites for mBBr in GST M1-1: an affinity-labeled site that is identical or overlapping with the CDNB substrate site, and a mBBr substrate site. Although a location for the mBBr substrate site was proposed based on molecular modeling, it was not evaluated experimentally.
This study is focused on determining whether the mBBr substrate site is distinguishable from the CDNB substrate site and identifying amino acid residues involved in the mBBr substrate site. The identification of a second xenobiotic substrate site in GST M1-1 would help to account for the broad substrate specificity of this class of GSTs. A preliminary version of this work has been presented (Hearne and Colman 2004).
Results
Evaluation of S-(hydroxyethyl)bimane as an inhibitor of the catalytic reactions of GST M1-1
To determine whether the mBBr substrate site is distinguishable from the CDNB substrate site, a nonreactive mBBr derivative was synthesized and then tested for its ability to compete kinetically with the substrates, CDNB and mBBr. Measurement of the wild-type enzyme’s kinetic parameters in the presence of S-(hydroxyethyl)bimane reveals it is a competitive inhibitor with respect to the substrate mBBr: Over the 1–4 μM concentration range of S-(hydroxyethyl)bimane, it has no effect on the Vmax but increases the Km of the wild-type enzyme for mBBr, yielding an average KI value of 0.36 μM (Table 1). In contrast, when tested in the enzyme-catalyzed reaction of CDNB, S-(hydroxyethyl)bimane has no effect on the Km or Vmax for CDNB of the wild-type enzyme (Table 1). Therefore, the mBBr substrate site is a distinct xenobiotic substrate site, independent of the CDNB substrate site.
Table 1.
S-(hydroxyethyl)bimane is a competitive inhibitor of the mBBr reaction, but not of the CDNB reaction, catalyzed by GST M1–1
| mBBr | CDNB | |||
| S-(hydroxyethyl) bimane (μM) | Km (μM) | Vmax (μ mol/min/mg) | Km (μM) | Vmax (μmol/min/mg) |
| 0 | 0.5 ± 0.1 | 3.3 ± 0.3 | 18.7 ± 2.1 | 26.4 ± 2.7 |
| 1 | 2.4 ± 0.3 | 3.6 ± 0.1 | — | — |
| 2 | 4.0 ± 0.7 | 3.3 ± 0.2 | 26.9 ± 1.8 | 25.7 ± 0.3 |
| 4 | 4.2 ± 1.1 | 3.7 ± 0.2 | 26.3 ± 3.4 | 28.2 ± 0.8 |
The Km values were determined under saturating conditions, and the Vmax values were determined by an extrapolation of the Km kinetic data to infinite concentrations of monobromobimane (mBBr) or 1-chloro-2,4-dinitrobenzene (CDNB) using SigmaPlot for data analysis.
Expression and purification
The plasmids encoding wild-type or mutant rat GST M1-1 were expressed in JM105 Escherichia coli cells and purified using chromatography on S-hexylglutathione agarose, as discussed in Materials and Methods. In each case, N-terminal sequencing indicated the presence of one protein with the sequence PMIL-GYWNVRGL, which is unique to rat GST M1-1. Enzyme yield varied with the mutation; typically, 15 mg/L cell culture of wild-type enzyme and 3–12 mg/L cell culture of mutant enzyme were obtained.
Molecular mass determination
Crystal structures of rat GST M1-1 reveal the enzyme as a dimer (Ji et al. 1992, 1993). In this study, sedimentation equilibrium experiments, conducted with 0.06 mg/mL of GST M1-1 in 0.1 M potassium phosphate buffer (pH 6.5) containing 1 mM EDTA indicate the enzyme is predominantly present as a dimer in this solution. The weight average molecular mass of the wild-type and each mutant enzyme (Table 2), was determined by use of the analytical ultracentrifuge. Each of the mutant enzymes has a molecular mass comparable to that of wild-type GST M1-1, demonstrating that the normal subunit interaction has not been affected by these mutations.
Table 2.
Weight average molecular mass of the wild-type and each GST M1–1 mutant enzyme as determined by sedimentation equilibrium experiments using an analytical ultracentrifuge
| Enzymea | Weight average molecular mass (kDa) | Enzyme | Weight average molecular mass (kDa) |
| WTb | 46.0 ± 0.3 | M104W | 44.2 ± 0.6 |
| V103A | 46.6 ± 0.3 | M108A | 46.6 ± 0.3 |
| V103L | 47.4 ± 0.5 | Q109A | 49.1 ± 0.5 |
| V103T | 46.0 ± 0.4 | Q109E | 45.6 ± 0.3 |
| V103D | 48.3 ± 0.1 | Q109L | 47.3 ± 0.1 |
| V103M | 47.4 ± 0.2 | I111A | 42.0 ± 0.1 |
| M104A | 42.2 ± 1.1 | M112A | 47.6 ± 0.1 |
| M104E | 45.0 ± 0.3 | C114A | 47.8 ± 0.1 |
| M104K | 50.4 ± 0.2 | Y115F | 46.6 ± 0.5 |
a In all cases, the enzyme (0.06 mg/mL) was in 0.1 M potassium phosphate buffer pH 6.5 containing 1 mM EDTA at 10°C.
b WT, wild-type.
Alanine scanning
Amino acid residues along α-helix 4 of rat GST M1-1 were individually replaced by alanine to localize the region in which mBBr binds. The wild-type enzyme exhibits a VCDNBmax of 26.4 ± 2.7 μmol substrate/min/mg enzyme and KCDNBm of 18.7 ± 2.1 μM for the conjugation of CDNB and GSH. As for the mBBr and GSH conjugation reaction, the enzyme exhibits a Vmax mBBr of 3.3 ± 0.3 μmol substrate/min/mg enzyme and KmmBBr of 0.5 ± 0.1 μM. The enzyme exhibits for mBBr as substrate a Vmax that is only 1/8 that of the CDNB reaction; however, the affinity of this enzyme for mBBr is 37-fold greater than for CDNB. The criteria used to recognize amino acid residues involved in the mBBr substrate site were a change in Vmax and/or Km for the mutant enzyme for mBBr (either increased or decreased) relative to the corresponding values for wild-type GST M1-1. Furthermore, we sought mutations in which the effect on the Vmax and/or Km for mBBr as the substrate was greater than the effect on the Vmax and/or Km for CDNB as the substrate. Figure 1 ▶ shows that substitutions at positions 103, 104, and 109 perturb the mBBr reaction more than the CDNB reaction, as evidenced by a fourfold increase in KmBBrm for V103A and an increase of ninefold for both M104A and Q109A (Fig. 1B ▶). The Vmax-mutant/Vmax-wild type also increases for the V103A and M104A mutant enzymes, with the effect on mBBr being greater than that on CDNB (Fig. 1A ▶). These three residues warranted further investigation by substitution of amino acid residues of various sizes and functionalities to determine their effect on the enzyme’s affinity for mBBr and catalysis of the mBBr reaction. The M108A mutant enzyme exhibits small effects on the kinetic parameters; the effects are greater on CDNB than on mBBr as substrate. The I111A and M112A mutant enzymes exhibit a minimal effect on the mBBr kinetic parameters, suggesting that the mBBr site does not extend along α-helix 4 as far as position 111 and is located closer to the start of α-helix 4. The circular dichroism (CD) spectra of the alanine mutant enzymes (data not shown) reveal that the changes in the kinetic parameters are not due to major perturbations in secondary structure.
Figure 1.

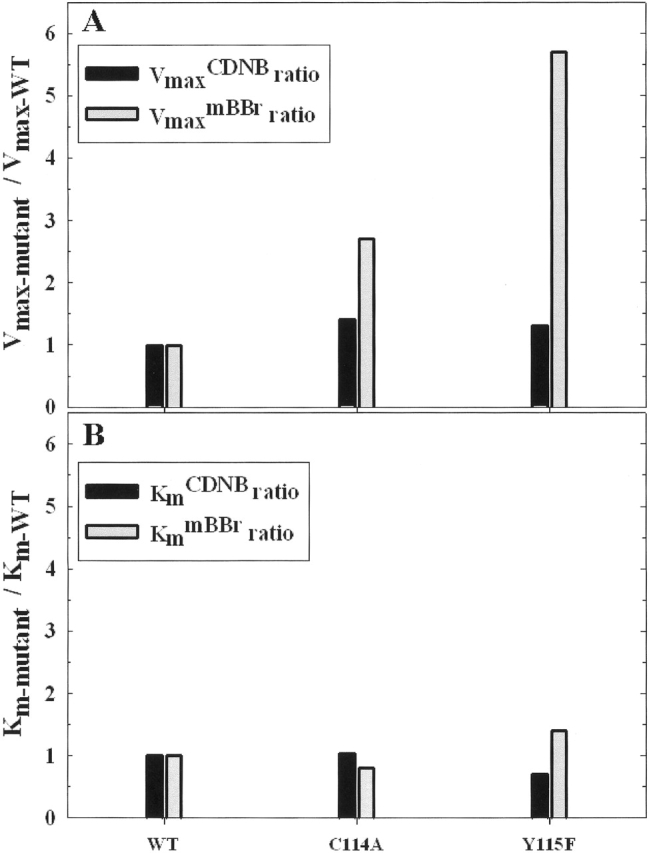
A comparison of the alanine mutant enzymes’ kinetic parameters. The CDNB kinetic parameters are represented by black vertical bars, and the mBBr kinetic parameters are represented by gray vertical bars. (A) Ratio of mutant GST M1-1 Vmax to wild-type GST M1-1 Vmax. (B) Ratio of mutant GST M1-1 Km to wild-type GST M1-1 Km.
Evaluation of Met 104
Methionine 104 was mutated to alanine (M104A), tryptophan (M104W), glutamate (M104E), and lysine (M104K). The ratios of the mutant enzyme kinetic parameters to the wild-type enzyme kinetic parameters are shown in Figure 2 ▶ for the M104A and M104W mutant enzymes. Replacement of methionine by either alanine or tryptophan causes a ~12-fold increase in Vmax for the mBBr reaction (Fig. 2A ▶) with little change in secondary structure, as indicated by CD spectroscopy (data not shown). These results implicate position 104 as a contributor to the mBBr substrate site.
Figure 2.

A comparison of the M104 mutant enzymes’ kinetic parameters. The CDNB kinetic parameters are represented by black vertical bars, and the mBBr kinetic parameters are represented by gray vertical bars. (A) Ratio of mutant GST M1-1 Vmax to wild-type GST M1-1 Vmax. (B) Ratio of mutant GST M1-1 Km to wild-type GST M1-1 Km. Please note that the magnitude of the Y-axis is different from that of Figure 1 ▶.
A charged residue substituted at position 104 decreases the affinity of the enzyme for mBBr, as observed by the greatest increases in KmmBBr for the M104E mutant enzyme (~50-fold), followed by the M104K mutant enzyme (~21-fold). The KmCDNB increase was not as appreciable, increasing approximately sevenfold for both of the mutant enzymes. The M104E mutant enzyme’s VmaxmBBr value increases 23-fold, while the increase in VmaxCDNB is only threefold. Interestingly, for the M104K mutant enzyme, the Vmax value for both substrates did not change. The largest changes in secondary structure, as determined by CD spectroscopy (data not shown), are observed for these two mutant enzymes, M104E and M104K, although they are changed in an opposite manner; the magnitude of the molar ellipticity at 220 nm is greater for the M104K mutant enzyme (−18,100) but is lower for the M104E mutant enzyme (−8580), as compared with the wild-type enzyme (−12,700). Thus, the charged mutations perturb the secondary structure and this perturbation probably contributes to the elevated KmmBBr values.
Evaluation of Gln 109
Glutamine 109 was mutated to alanine (Q109A), glutamate (Q109E), and leucine (Q109L), with the resultant changes in kinetic parameters shown in Figure 3 ▶. The size and polarity of the amino acid residue substituted for glutamine is important in the enzyme’s affinity for mBBr, as evidenced by the eight- to ninefold increases in the KmmBBr values for the Q109A and Q109L mutant enzymes (Fig. 3B ▶). Lack of hydrogen bonding potential and decreased polarity is apparently responsible for the large increase in the KmBBrm. In contrast, the KmCDNB is minimally altered in these three mutant enzymes. The CD spectra (data not shown) of the Q109 mutant enzymes reveal that the changes in kinetic parameters are not due to a perturbation of secondary structure.
Figure 3.

A comparison of the Q109 mutant enzymes’ kinetic parameters. The CDNB kinetic parameters are represented by black vertical bars, and the mBBr kinetic parameters are represented by gray vertical bars. (A) Ratio of mutant GST M1-1 Vmax to wild-type GST M1-1 Vmax. (B) Ratio of mutant GST M1-1 Km to wild-type GST M1-1 Km. Please note that the magnitude of the Y-axis is different from that of Figures 1 ▶ and 2 ▶.
Evaluation of Val 103
Valine 103 was mutated to alanine (V103A), leucine (V103L), threonine (V103T), methionine (V103M), and aspartate (V103D). The ratios of the mutant enzyme kinetic parameters to the wild-type enzyme kinetic parameters are shown in Figure 4 ▶ for those mutant enzymes that are not structurally compromised (i.e., excludes V103D). The V103A, V103L, V103T, and V103M mutant enzymes exhibit elevated mBBr kinetic parameters, while the kinetic parameters for CDNB are not appreciably changed. The largest increase in the mBBr kinetic parameters is for the V103M mutant enzyme. The biophysical properties of these four V103 mutant enzymes are similar to those of the wild-type enzyme. In contrast, the V103D mutant enzyme exhibits a negative molar ellipticity at 220 nm (−15,800) of greater magnitude than that of the wild-type enzyme (−12,700). The V103D mutant enzyme exhibits an increased Km value for both substrates (23-fold for mBBr and 13-fold for CDNB), while the Vmax is not appreciably changed for either substrate. The elevated Km values of the V103D mutant enzyme for both CDNB and mBBr can be attributed in part to the perturbation in its secondary structure.
Figure 4.

A comparison of the V103 mutant enzymes’ kinetic parameters. The CDNB kinetic parameters are represented by black vertical bars, and the mBBr kinetic parameters are represented by gray vertical bars. (A) Ratio of mutant GST M1-1 Vmax to wild-type GST M1-1 Vmax. (B) Ratio of mutant GST M1-1 Km to wild-type GST M1-1 Km. Please note that the magnitude of the Y-axis is different from those of Figures 1 ▶–3 ▶ ▶.
Site-directed mutagenesis of Cys 114 and Tyr 115
The previous study by Hu and Colman (1995) demonstrated that affinity labeling of Cys 114 and Tyr 115 of GST M1-1 led to extensive loss of enzymatic activity toward the substrate CDNB without loss of enzymatic activity toward the substrate mBBr. To evaluate further the relative importance of these two amino acid residues toward the substrates CDNB and mBBr, we constructed the mutant enzymes C114A and Y115F. If either of these amino acid residues were essential in either of the substrate sites, an appreciable change in Km would be expected (Fig. 5B ▶). The Km changes for CDNB and mBBr are about the same and both are only 0.7 to 1.4 times that of the wild-type enzyme values. These results, together with the earlier affinity labeling study (Hu and Colman 1995), suggest that Cys 114 and Tyr 115 are in the vicinity of the CDNB substrate binding site, although they are not directly involved in binding. The effect of these mutations is most prominently seen in the VmaxmBBr value for the Y115F mutant enzyme, which increases sixfold (Fig. 5A ▶). The CD spectra for these mutant enzymes are similar to that of the wild-type enzyme (data not shown).
Figure 5.
A comparison of the C114A and Y115F mutant enzymes’ kinetic parameters. The CDNB kinetic parameters are represented by black vertical bars, and the mBBr kinetic parameters are represented by gray vertical bars. (A) Ratio of mutant GST M1-1 Vmax to wild-type GST M1-1 Vmax. (B) Ratio of mutant GST M1-1 Km to wild-type GST M1-1 Km. Please note that the magnitude of the Y-axis is different from those of Figures 1 ▶–4 ▶ ▶ ▶.
Discussion
This study demonstrates the existence of at least two independent hydrophobic substrate sites in rat GST M1-1. With S-(hydroxyethyl)bimane acting as a competitive inhibitor of mBBr, but not of CDNB, we have shown that the mBBr substrate site is independent of the CDNB substrate site.
Alanine scanning of α-helix 4 enabled us to identify Val 103, Met 104, and Gln 109 as participants in the mBBr substrate site, which were worthy of more extensive examination. Kinetic analysis shows that Met 108, Ile 111, and Met 112 are not involved in the mBBr substrate site since there was minimal perturbation of the kinetic parameters of the mBBr reaction; thus, these residues did not warrant further investigation. The M108A mutant enzyme only slightly affects the CDNB kinetic parameters as indicated by a small elevation in Km and Vmax. The large size and hydrophobic character of the amino acid at position 108 is more important for the enzyme’s activity with and affinity for CDNB than for mBBr. Substitution of alanine at position 111 has only a minimal effect on the enzyme’s affinity for the hydrophobic substrate. Ile 111 does not physically contribute to the reaction of GST M1-1 with either substrate, although it has been shown to be important in determining the stereoselectivity of the hydrophobic substrate for μ class GSTs (Shan and Armstrong 1994). The M112A mutant enzyme displays kinetic parameters for both hydrophobic substrates that are similar to those of wild-type GST M1-1, an indication that this residue is not involved in reactions at either site. In contrast, amino acid residue replacements at positions 103, 104, and 109 exhibit a much greater perturbation of the mBBr kinetic parameters than of the corresponding CDNB values, indicating that these residues are localized in the mBBr substrate site, where they are important in the enzyme’s affinity for mBBr.
Amino acid residues numbered lower than 103 in the primary sequence were not probed because of their potential interaction with residues known to be involved in subunit–subunit interactions (Combet et al. 2000; Pettigrew and Colman 2001). The remaining amino acid residues along α-helix 4 (Asp 105, Asn 106, Arg 107, and Leu 110) were not probed for various reasons. Asp 105 and Arg 107 have been proposed to be involved in GSH binding and activation, respectively (Adang et al. 1990; Wilce and Parker 1994). Mutation of these residues would most likely result in an enzyme with a greatly decreased affinity for GSH, thereby complicating interpretation of the enzyme’s affinity for the xenobiotic substrates. Asn 106 and Leu 110 were not investigated because they were on the opposite face of α-helix 4 with distances too far from the mBBr molecule for interaction. It was evident after mutating the residues around Leu 110 that it was most likely not participating in the mBBr substrate site since those amino acid residues numbered higher in the primary sequence had only a minimal effect on the mBBr kinetic parameters.
The model proposed by Hu and Colman (1995) was only an approximation. We have now adjusted the docked mBBr molecule within the GST structure and refined its orientation in accordance with the results and analysis of the mutant enzymes’ kinetic parameters. As shown in Figure 6A ▶, the mBBr molecule has been docked at the mBBr substrate site in accordance with the results of our kinetic studies and is shown positioned for reaction, with the bromomethyl group of mBBr located 4.09 Å from the sulfur of S-methyglutathione.
Figure 6.


(A) Model of GST M1-1 with the monobromobimane molecule docked in the experimentally defined monobromobimane substrate site. The mBBr molecule is colored by atom (red for oxygen, blue for nitrogen). Amino acid residues (A) V103, (A) M104, (B) Q109, and (A) Y115 (seen on edge) as well as the S-methylglutathione molecule (yellow) are colored in a solid color. The amino acid residues shown are: Val 103 (green), Met 104 (red), Gln 109 (purple), and Tyr 115 (gray). Subunit A is shown as a cyan ribbon with α-helix 4 accentuated in royal blue. Subunit B is shown as a pink ribbon with α-helix 4 accentuated in gray. (B) In silico model of the M104A mutant enzyme. (C) In silico model of the M104W mutant enzyme.
The large size and hydrophobic character of Met 104 (Fig. 6A ▶) make it a likely candidate to participate in the mBBr substrate site. Substitutions at position 104 have a small effect on the CDNB kinetic parameters; the effects are much greater on the mBBr kinetic parameters. The methyl groups of mBBr are only 3.5–4.3 Å away from Met 104 (Fig. 6A ▶), enabling hydrophobic interactions between the mBBr molecule and the substituted amino acid residue at position 104. In silico modeling of the M104A (Fig. 6B ▶) and M104W (Fig. 6C ▶) mutant enzymes shows that there is a decrease in the hydrophobic interactions between the amino acid residue at position 104 and the mBBr molecule. The M104A and M104W mutant enzymes have approximately the same effect on the kinetic parameters; although tryptophan is a much larger and more hydrophobic amino acid residue than alanine, the indole ring of tryptophan is not positioned to promote hydrophobic interaction with mBBr. The M104E mutation eliminates the hydrophobic interactions and has a greater effect on the mBBr kinetics than do the M104A or M104W mutations. The decreased hydrophobic interactions, as well as the perturbation of the secondary structure of the M104E mutant enzyme, are associated with an increased KmmBBr. The enzymes’ (M104A, M104E, M104W) decreased affinity for mBBr and the opening up of the mBBr substrate site correlate with the increased values of VmaxmBBr. In contrast, the M104K mutation, which preserves some of the hydrophobic interactions between the amino acid residue at position 104 and the mBBr molecule, has a minimal affect on VmaxmBBr. In silico modeling shows that the position of lysine is similar to that of the methionine in the wild-type enzyme. The large size of the lysine residue does not allow for the opening of the site. The increase in Km may be due to an unfavorable charge interaction with Arg 107 (3.39 Å) or the perturbation in secondary structure.
The nitrogen of Gln 109 of Subunit B has the potential to hydrogen bond with the carbonyl groups of mBBr (bound to Subunit A). Although they are too far apart (4.5 Å) for direct hydrogen bonding (Fig. 6A ▶), this interaction is likely facilitated through a water molecule (w206) (Ji et al. 1993). It is notable that Gln 109 is contributed by the opposite subunit (Subunit B) of the dimer to mBBr bound to subunit A.1
Replacement of glutamine 109 with alanine or leucine not only eliminates the hydrogen bonding potential and polar interactions but also decreases the size of the amino acid residue side chain. In silico modeling shows that these mutations result in the bromomethyl carbon of mBBr shifting away from the sulfur of S-methylglutathione toward the amino acid residue at position 109. In the model of the Q109A mutant enzyme, the carbonyl groups of mBBr are within hydrogen bonding distance (2.99 Å) of the peptide backbone at position 109 of Subunit B. Replacing glutamine with alanine or leucine also causes the affinity of the enzyme for mBBr to decrease eight- to ninefold, without affecting the Vmax. These results suggest that the polarity of the amino acid residue at this position, not the size of the residue, is important for the enzyme’s affinity for mBBr. To test this hypothesis, Gln 109 was replaced by the polar glutamate amino acid residue. The mBBr kinetic parameters of the Q109E mutant enzyme resemble those of the wild-type GST M1-1. It is clear that Gln 109 plays a notable role in maintaining the enzyme’s affinity for mBBr.
The effects of the Val 103 mutations are reflected in the changes of the mBBr kinetic parameters. Replacing Val 103 (Fig. 6A ▶) generally did not affect the CDNB kinetic parameters: The V103D mutant enzyme is the exception, with an increased KmCDNB. This increase may be an indirect effect of the perturbation in the secondary structure as shown by CD spectroscopy or the greatly decreased affinity of the enzyme for GSH (~45-fold),2 which contrasts with the observations for all of the other mutant enzymes. The other V103 mutant enzymes do not show such a large change in affinity for GSH (data not shown). Of these mutant enzymes, V103M exhibits the largest increase in mBBr kinetic parameters. The crystal structure of wild-type GST M1-1 reveals that Val 103 is oriented so that its methyl groups are a minimum of 10.1 Å from the mBBr molecule, indicating that Val 103 is almost certainly a second-sphere amino acid residue in the mBBr substrate site. Therefore, the increase in KmmBBr of the V103M mutant enzyme is probably due to the methionine residue crowding first-sphere amino acid residues involved in the mBBr substrate site. This crowding is not enough to perturb the global secondary structure as reflected in the CD spectra, but it may modify the structure locally. While the increase in KmmBBr for the V103A mutant enzyme is presumably due to the loss of hydrophobic interactions with amino acid residues nearby, the increase in KmmBBr for the V103L and V103M mutant enzymes is probably due to the adverse size of the substituted amino acid residue. Although threonine is approximately the same size as valine, a hydrophobic residue is favored at this position, hence the increase in KmBBrm for the V103T mutant enzyme. The increase in VmaxmBBr for the Val 103 mutant enzymes is likely a reflection of the enzymes’ decreased affinities for mBBr. Of the mutant enzymes studied, an increase in Km is generally accompanied by an increase in Vmax for the mBBr reaction. This increase in Vmax is probably a result of the enzymes’ less than optimal affinities for the hydrophobic substrate, which is reflected in enhanced product release.
The results of site-directed mutagenesis of Cys 114 and Tyr 115 confirm that these two amino acid residues are not direct participants in either the mBBr substrate site or the CDNB substrate site (Fig. 6A ▶). These residues may mediate product release from the enzyme’s active site (Fig. 6A ▶, Y115). The Y115F mutant enzyme, known to remain active with respect to the CDNB assay (Johnson et al. 1993), lacks the hydroxyl functional group of tyrosine. The loss of this hydroxyl group eliminates the hydrogen bonds between Tyr 115 and the main chain amide nitrogen of Ser 209, as well as the side chain hydroxyl of Ser 209, interactions that are known to block the channel to the CDNB substrate site and limit segmental motion of the protein during catalysis (Johnson et al. 1993). This loss of hydrogen bonding allows for an enhanced rate of product (GS-DNB) release from the active site (Johnson et al. 1993). The observed increase in the VCDNB max and VmBBr max for the Y115F mutant enzyme occurs concurrently with the loss of hydrogen bonding. As in the CDNB catalytic reaction, in the monobromobimane reaction the loss of hydrogen bonding likely increases the rate of the physical step of product dissociation, suggesting that it may be the rate-determining step in the mBBr catalytic reaction. We assume that the kinetic mechanism for GST M1-1 using mBBr as the hydrophobic substrate is similar to the kinetic mechanism obeyed by GST M1-1 in catalyzing nucleophilic aromatic substitution reactions in which the addition of the substrates to the enzyme is random (Armstrong 1991). However, when the physiological state of a cell is considered, the addition of the substrates is ordered with GSH binding first (Pickett and Lu 1989; Armstrong 1991), because the concentration of GSH in a cell (1–5 mM) is much higher than the concentration of the xenobiotic compound in the cell (Armstrong 1991). These mutant enzymes demonstrate that the loss of interaction of Cys 114 and Tyr 115 with the substrate CDNB cannot be the basis of inactivation of the enzyme in the mBBr affinity labeling experiments; rather, the loss of activity can be attributed to the bulky affinity label blocking CDNB from entering the substrate site. It has been proposed that Cys 114 and Tyr 115 (Fig. 6A ▶) are located at or in the close vicinity of the CDNB substrate site (Liu et al. 1993; Ploemen et al. 1994).
The α, π, and μ classes of rat GST have previously been investigated for catalytic activity with mBBr and GSH as co-substrates (Hu and Colman 1995; Hu et al. 1997; Ralat and Colman 2003). These three classes catalyze the conjugation of mBBr and GSH, and have also been probed using the affinity label mBBr (Hu and Colman 1995; Hu et al. 1997; Ralat and Colman 2004). mBBr was found to be an affinity label of the μ class of GSTs (Hu and Colman 1995; Hu et al. 1997); in that case it was proposed that the substrates CDNB and mBBr occupy two distinct sites in GST M1-1 during the catalytic reaction (Hu and Colman 1995), and this proposal is consistent with the results of our present study. In 1997, Hu, Borleske, and Colman found that mBBr is an affinity label of GST A1-1; in that study it was found that CDNB and mBBr share the same substrate site in GST A1-1, since the modification of Cys 17 and Cys 111 parallel the loss of enzymatic activity toward both CDNB and mBBr. The π class has previously been shown to have distinctive substrate sites for CDNB and mBBr (Ralat and Colman 2003, 2004). Here, we demonstrate experimentally that GST M1-1 has at least two distinct xenobiotic substrate sites.
This, as well as other reports, support the fact that more than one xenobiotic substrate site exists in many classes of soluble mammalian GSTs (Bhargava et al. 1978; Vander Jagt et al. 1985; Barycki and Colman 1993; Hu and Colman 1995; Hu et al. 1997; Ralat and Colman 2003, 2004). Identification of a second independent xenobiotic substrate site is biologically relevant since this family of enzymes plays a key role in Phase II detoxification. A second independent substrate site allows for specific inhibition of the enzyme at one site without affecting the catalytic capability of the enzyme at the other site, providing additional protection to an organism from endogenous or exogenous xenobiotics. The identification of this site supports the proposal that the promiscuity of the enzyme is due to multiple xenobiotic substrate sites.
Materials and methods
Materials
GSH, S-hexylglutathione immobilized on cross-linked 4% agarose beads, CDNB, and ampicillin were purchased from Sigma Chemical Company. mBBr was purchased from Molecular Probes. The oligonucleotides for mutagenesis and the primers for DNA sequencing were purchased from Biosynthesis, Inc. The Quikchange XL Site-Directed Mutagenesis Kit was obtained from Stratagene, and the QIAprep Spin Miniprep Kit was supplied by QIAGEN. All other reagents were purchased from Fisher and were of reagent grade.
Synthesis of S-(hydroxyethyl)bimane
mBBr and β-mercaptoethanol were mixed in a ratio of 1:15.5 equivalents in a solution of 100 mM BTP (pH 8.5) containing 50% acetonitrile. The reaction was allowed to proceed under nitrogen for 20 min; the vessel was then sealed and the solution stirred for an additional hour. A sample was applied to a Hewlett Packard 1100 RP-HPLC (5 μm, 4.6 mmID, 250 mmL, Vydac C18) employing a linear gradient from 0% to 43% solvent B over 43 min (where solvent A is 0.1% TFA in water, and solvent B is 90% acetonitrile, 10% water, and 0.1% TFA). The spectrum, monitored at 220 nm and 390 nm, revealed one dominant peak at 20% solvent B. The peak was collected for ESI-MS. The reaction mixture containing the product was diluted 1:3 in water and applied to a RP-HPLC equipped with a Waters 2487 dual absorbance detector, Waters 600 pump, and a Linseis L250E recorder (10 μm, 22 mm ID, 250 mm L, Vydac C18), employing a linear gradient from 0% to 100% solvent B. The product eluted at 20% solvent B was monitored at wavelengths of 340 nm and 220 nm. The TFA was exchanged with 0.1 N HCl by solubilizing the product in 0.1 N HCl, then lyophilizing to dryness. This was repeated three times to ensure exchange. S-(hydroxyethyl)bimane (molecular weight 268.33), ESI:291.3 (molecular weight of sodium adduct).
Plasmid and mutagenesis
The complete DNA encoding rat (Rattus norvegicus) GST M1-1, as well as the 3′-untranslated region of rat GST M1-1, inserted into a pBR322 vector via the NdeI and EcoRI restriction sites, was a generous gift from Ming F. Tam at the Institute of Molecular Biology, Academia Sinica, Nankang, Taipei. This plasmid was used with the permission of Dr. M. Rosenberg of Smith Kline Beecham, by whom the expression vector pMG27N (of which this is a derivative) was developed. Site-directed mutagenesis was performed using the Stratagene Quikchange XL Site-Directed Mutagenesis Kit. The mutation codon was chosen based on the percent frequency of occurrence in E. coli as well as the fewest number of base changes. The following oligonucleotides and their complementary sequences were used to incorporate the point mutations into the DNA, according to the Stratagene Quikchange XL Site-Directed Mutagenesis kit instruction manual. The mutated amino acid residue and number are marked in bold and the replacement codon is underlined: V103A, GGAGAACCAGGCCATGGACAACCG; V103D, GGAGAACCAGGATATGGACAACCG; V103L, GGAGA ACCA GCTGATGGACAACCG; V103M, GGAGAACCAG ATG ATGGACAACCG; V103T, GGAGAACCAGACCATG GAC AACCG; M104A, GGAGAACCAGGTCGCGGA CAA CCG; M104E, GGAGAACCAGGTCGAAGACAACCG; M104K, GGAGAACCAGGTCAAAGACAACCG; M104W, GGAGAACCAGGTCTGGGACAACCG; M108A, GGACA ACCGCGCGCAGCTCATCATGC; Q109A, GGACAACCG CATGGCGCTCATCATG; Q109E, GGACAACCGCATGG AACTCATCATG; Q109L, GGACAACCGCATGCTGCTCA TCATG; I111A, CCGCATGCAGCTCGCCATGCTTTGT TAC; M112A, GCAGCTCATCGCGCTTTGTTAC; C114A, CATCATGCTTGCTTACAACCCCGAC; Y115F, CATCAT GCTTTGTTTCAACCCC GAC.
DNA extraction and purification was completed using the QIAprep Spin Miniprep Kit. DNA sequencing confirmed site-directed codon mutation incorporation. Sequencing was performed at the University of Delaware Biology Core Facility using a Long Readir 4200 DNA Sequencer (LiCor, Inc.) or the University of Delaware Center for Agricultural Biotechnology using an ABI Prism model 377 DNA sequencer (PE Biosystems) or an Applied Biosystems 3130 XL Genetic Analyzer. The forward sequencing primer is 5′-ATGCCTATGATACTGGGATA-3′ and the reverse primer is 5′-CATTGGGCCAACTTCGAAAA-3′. Mutated DNA was transformed into competent JM105 E. coli cells for expression (Sambrook et al. 1989).
Protein purification
Rat GST M1-1, both wild-type and mutant enzymes, were expressed in JM105 E. coli cells. The cells were grown at 37°C in LB containing 270 μM ampicillin until A600nm was 0.4–0.6, at which time the cells were induced with a final concentration of 1 mM IPTG. The cells were grown for 24 h at 25°C , after which they were harvested by centrifugation at 10,444g for 25 min at 4°C. The resulting pellets were frozen at −80°C. The cell pellet from 6 L of culture was defrosted in a 25°C water bath and resuspended in 50 mL of 10 mM Tris-HCl buffer (pH 7.8) at 25°C. The cells were ruptured by 6 min of sonication (three 2-min intervals of sonication, separated by 30-sec intervals) at 20 kHz and 475 W with a sonicator from Ultrasonic, Inc. The cell suspension was kept on ice during sonication.
After sonication, the suspension was centrifuged at 10,886g for 25 min at 4°C. The supernatant was decanted and loaded onto a 0.7 × 20-cm column packed with 10 mL of S-hexylglutathione immobilized on cross-linked 4% agarose beads, for purification. All column purification procedures were performed at 4°C. Succinctly, the column was equilibrated with 1 L of 10 mM Tris-HCl buffer (pH 7.8), and the enzyme suspension was loaded onto the column. The column was first eluted with 1 L of 10 mM Tris-HCl buffer (pH 7.8) followed by 0.25 L of 10 mM Tris-HCl buffer (pH 7.8) containing 0.2 M NaCl to wash the nonspecifically bound proteins from the column. GST M1-1 was eluted with 0.2 L of 10 mM Tris-HCl buffer (pH 7.8) containing 2.5 mM S-hexylglutathione and 0.2 M NaCl. The enzyme was dialyzed and concentrated in 0.1 M potassium phosphate (pH 6.5) containing 1 mM EDTA by use of Amicon Ultra Centrifugal Filter Devices (Millipore Corp.), which were spun at 2611g for 15 min at 4°C. Enzyme concentration was determined using a Hewlett Packard 8453 UV-VIS spectrophotometer and the extinction coefficient at 270 nm (Δɛ= 37,700 M−1 cm−1). Enzyme purity was assessed by N-terminal sequencing (Applied Biosystems Procise Sequencing System).
Molecular mass determination
The weight average molecular mass of each enzyme was determined using a Beckman Optima XL-A or Beckman Coulter XL-I analytical ultracentrifuge. Sedimentation equilibrium experiments were performed at speeds of 15,000 rpm, 17,000 rpm, and 20,000 rpm running at 10°C using an An-60 Ti rotor (XL-A) or an An-50 Ti rotor (XL-I). Enzyme samples (0.06 mg/mL) were in 0.1 M potassium phosphate buffer (pH 6.5) containing 1 mM EDTA. Stepwise radial scans at 235 nm and 270 nm were performed, after equilibrium was reached, using a step size of 0.001 cm (Vargo et al. 2004). The resulting data were fit using the software package IgorPro (Wavemetrics, Inc.) as previously described (Schneider et al. 1997; Kretsinger and Schneider 2003).
CD spectroscopy
CD spectroscopy was performed on a Jasco J-710 spectropolarimeter as previously described (Vargo and Colman 2004). Concisely, the ellipticity of the enzyme sample (~0.15 mg/mL in 0.1 M potassium phosphate buffer at pH 6.5 containing 1 mM EDTA) was measured as a function of wavelength between 200 nm and 250 nm at 0.1-nm increments. The average of five measurements was recorded as the spectrum. Each sample spectrum was corrected for the contribution from 0.1 M potassium phosphate buffer (pH 6.5) containing 1 mM EDTA.
Enzymatic assays
The conjugation of CDNB (1 mM) and GSH (2.5 mM) in 0.1 M potassium phosphate buffer (pH 6.5) containing 1 mM EDTA and 2.5% ethanol was monitored at 340 nm (Δɛ= 9.6 mM−1 cm−1) using a Hewlett Packard 8453 UV-VIS spectrophotometer (Habig et al. 1974). The conjugation of mBBr (30 μM) and GSH (600 μM) in 0.1 M potassium phosphate buffer (pH 6.5) containing 1 mM EDTA and 20% DMF was monitored using a Perkin-Elmer MPF-3 fluorescence spectrophotometer (emission at 480 nm, excitation at 395 nm) (Hulbert and Yakubu 1983). The activity of the enzymes is expressed as specific activity (μmol substrate per minute per milligram enzyme). The specific activity is corrected for the rate of the spontaneous nonenzymatic conjugation reaction between the hydrophobic substrate and GSH. For all rate determinations the reactions were maintained at 25°C.
To determine the KmCDNB a range of CDNB concentrations was used (5 μM–1 mM), while the GSH concentration was fixed at 2.5 mM. For those mutant enzymes that exhibited a high KmCDNB value relative to 1 mM, the CDNB concentration range was extended to 3 mM. Determination of the KmGSH for the CDNB–GSH conjugation reaction was accomplished using a range of GSH concentrations (generally 10 μM–2.5 mM), while the CDNB concentration was kept constant at 1 mM. For the enzyme with an unusually high KGSHm value, the range of GSH concentrations was extended to 20 mM. To determine, the KmmBBr a range of mBBr concentrations was used (0.25 μM–60 μM), while the GSH concentration was constant at 600 μM. For those mutant enzymes that exhibited a high KmBBrm value relative to 30 μM, the mBBr concentration was held constant at 90 μM in determining the KmGSH for the mBBr–GSH conjugation reaction, generally using a GSH concentration range of 5 μM–2400 μM. To determine the kinetic parameters of the hydrophobic substrates in the presence of S-(hydroxyethyl)bimane, a nonreactive mBBr derivative, a final concentration of 1, 2, or 4 μM of S-(hydroxyethyl)bimane was included in the enzymatic assays mentioned above. For all kinetic parameter determinations, the temperature was maintained at 25°C and the conditions were generally saturating for the invariable substrate. The data were fitted to the Michaelis-Menten rectangular hyperbola using SigmaPlot. The Vmax and standard error were calculated from an extrapolation of the data.
Molecular modeling
Molecular modeling was conducted using the Insight II (1997) software package from Molecular Simulations, Inc., on a Silicon Graphics Indigo 2 workstation. The atomic coordinates for the rat GST M1-1 isozyme were obtained from the Brookhaven Protein Databank, PDB entry 1GST (Ji et al. 1993). The mBBr molecule was manually docked into the mBBr substrate site based on the results of the kinetic studies. Consideration of the distance between the thiol of S-methylglutathione and the bromomethyl group of mBBr was instrumental in the correct placement of the manually docked mBBr molecule. Optimal positioning of the mBBr molecule was achieved by three-dimensional rotation and translation of the molecule. The mutant enzymes were modeled by replacing the individual amino acids at positions 103, 104, and 109 with the amino acids corresponding to the mutations made at each position. In all cases, the enzyme–substrate complex was energy minimized by the Discover module of Biosym to optimize the global enzyme–substrate structure (Steepest Gradient, 100 Iterations, 0.001 Derivative). The intermolecular energy was monitored for rational values and distances.
Acknowledgments
This work was funded by NIH R01-CA66561 (R.F.C). The Beckman Optima XL-I analytical ultracentrifuge used in this study was obtained and supported by NIH 2P20 RR016472. We thank Dr. Ming Tam and Dr. M. Rosenberg for the plasmid and its use, Dr. Joel Schneider for the use of the XL-A analytical ultracentrifuge and the data analysis software, Dr. Yu-Chu Huang for obtaining the N-terminal sequences, and Dr. Melissa A. Vargo for useful discussions. We also thank Lisa A. Haines for her help with the synthesis of S-(hydroxy-ethyl)bimane.
Abbreviations
GST, glutathione S-transferase
GSH, glutathione
CDNB, 1-chloro-2,4-dinitrobenzene
mBBr, monobromobimane, 4-bromo-methyl-3,6,7-trimethyl-1,5-diazabicyclo-[3.3.0]octa-3,6-diene-2,8-dione;Tris, Tris(hydroxymethyl)aminomethane
LB, Luria-Bertani
EDTA, disodium ethylenediamine tetraacetate
DMF, N,N′-dimethylformamide
IPTG, isopropyl-β-D-thiogalactoside
CD, circular dichroism
TFA, trifluoro-acetic acid
BTP, 1,3-Bis [tris (hydroxymethyl) methylamino] propane
ESI-MS, electrospray ionization mass spectrometry
rpm, revolutions per minute
Article and publication are at http://www.proteinscience.org/cgi/doi/10.1110/ps.051651905.
Footnotes
Gln 109, belonging to the same subunit as the one to which mBBr binds, is 12.1 Å away from the mBBr molecule. Gln 109 is 3.2 Å from Lys 133, presenting the possibility of hydrogen bonding between these two residues. However, it is not clear if this interaction is a requirement for the optimal positioning of α-helix 4.
The KmCDNB of the V103D mutant enzyme was determined under saturating GSH conditions (20 mM).
References
- Adang, A.E.P., Brussee, J., Gen, A.V.D., and Mulder, G.J. 1990. The glutathione-binding site in glutathione S-transferases. Biochem. J. 269 47–54. [DOI] [PMC free article] [PubMed] [Google Scholar]
- Armstrong, R.N. 1991. Glutathione S-transferases: Reaction mechanism, structure, and function. Chem. Res. Toxicol. 4 131–140. [DOI] [PubMed] [Google Scholar]
- ———. 1998. Mechanistic imperative for the evolution of glutathione transferases. Curr. Opin. Chem. Biol. 2 618–623. [DOI] [PubMed] [Google Scholar]
- Barycki, J.J. and Colman, R.F. 1993. Affinity labeling of glutathione S-transferase, isozyme 4-4, by 4-(fluorosulfonyl)benzoic acid reveals Tyr 115 to be an important determinant of xenobiotic substrate specificity. Biochemistry 32 13002–13011. [DOI] [PubMed] [Google Scholar]
- Bhargava, M.M., Listowsky, I., and Arias, I.M. 1978. Studies on subunit structure and evidence that ligandin is a heterodimer. J. Biol. Chem. 253 4116–4119. [PubMed] [Google Scholar]
- Board, P.G., Baker, R.T., Chelvanayagam, G., and Jermiin, L.S. 1997. Zeta, a novel class of glutathione transferases in a range of species from plants to humans. Biochem. J. 328 929–935. [DOI] [PMC free article] [PubMed] [Google Scholar]
- Board, P.G., Coggan, M., Chelvanayagam, G., Easteal, S., Jermiin, L.S., Schulte, G.K., Danley, D.E., Hoth, L.R., Griffor, M.C., Kamath, A.V., et al. 2000. Identification, characterization, and crystal structure of the ω class glutathione transferases. J. Biol. Chem. 275 24798– 24806. [DOI] [PubMed] [Google Scholar]
- Boyer, T.D. 1989. The glutathione S-transferases: An update. Hepatology 9 486–496. [DOI] [PubMed] [Google Scholar]
- Coles, B. and Ketterer, B. 1990. The role of glutathione and glutathione transferases in chemical carcinogenesis. Crit. Rev. Biochem. Mol. Biol. 25 47–70. [DOI] [PubMed] [Google Scholar]
- Combet, C., Blanchet, C., Geourjon, C., and Deleage, G. 2000. NPS@: Network Protein Sequence analysis (CLUSTALW multiple alignment). TIBS 291 147–150. [DOI] [PubMed] [Google Scholar]
- Eaton, D.L. and Bammler, T.K. 1999. Concise review of the glutathione S-transferases and their significance in toxicology. Toxicol. Sci. 49 156– 164. [DOI] [PubMed] [Google Scholar]
- Habig, W.H., Pabst, M.J., and Jakoby, W.B. 1974. Glutathione S-transferases. The first enzymatic step in mercapturic acid formation. J. Biol. Chem. 249 7130–7139. [PubMed] [Google Scholar]
- Hearne, J.L. and Colman, R.F. 2004. Delineation of xenobiotic substrate site in glutathione S-transferase M1-1 (GST M1-1) by mutagenesis. In Abstracts of Papers, 228th ACS National Meeting, Philadelphia, PA, USA, August 22–26, p. BIOL-095.
- Hu, L. and Colman, R.F. 1995. Monobromobimane as an affinity label of the xenobiotic binding site of rat glutathione S-transferase 3-3. J. Biol. Chem. 270 21875–21883. [DOI] [PubMed] [Google Scholar]
- Hu, L., Borleske, B.L., and Colman, R.F. 1997. Probing the active site of α-class rat liver glutatione S-transferases using affinity labeling by monobromobimane. Protein Sci. 6 43–52. [DOI] [PMC free article] [PubMed] [Google Scholar]
- Hulbert, P.B. and Yakubu, S.I. 1983. Monobromobimane: A substrate for the fluorimetric assay of glutathione transferase. J. Pharm. Pharmacol. 35 384–386. [DOI] [PubMed] [Google Scholar]
- Jakoby, W.B. and Habig, W.H. 1980. Enzymatic basis of detoxification (ed. W.B. Jakoby), pp. 63–94. Academic Press, New York.
- Ji, X., Zhang, P., Armstrong, R.N., and Gilliland, G.L. 1992. The three-dimensional structure of a glutathione S-transferase from the μ gene class. Structural analysis of the binary complex of isoenzyme 3-3 and glutathione at 2.2-Å resolution. Biochemistry 31 10169–10184. [DOI] [PubMed] [Google Scholar]
- Ji, X., Armstrong, R.N., and Gilliland, G.L. 1993. Snapshots along the reaction coordinate of an SNAr reaction catalyzed by glutathione transferase. Biochemistry 32 12949–12954. [DOI] [PubMed] [Google Scholar]
- Johnson, W.W., Liu, S., Ji, X., Gilliland, G.L., and Armstrong, R.N. 1993. Tyrosine 115 participates both in chemical and physical steps of the catalytic mechanism of a glutathione S-transferase. J. Biol. Chem. 268 11508–11511. [PubMed] [Google Scholar]
- Kretsinger, J.K. and Schneider, J.P. 2003. Design and application of basic amino acids displaying enhanced hydrophobicity. J. Am. Chem. Soc. 125 7907–7913. [DOI] [PubMed] [Google Scholar]
- Liu, L.F., Hong, J.L., Tsai, S.P., Hsieh, J.C., and Tam, M.F. 1993. Reversible modification of rat liver glutathione S-transferase 3-3 with 1-chloro-2, 4-dinitrobenzene: Specific labeling of Tyr-115. Biochem. J. 296 189–197. [DOI] [PMC free article] [PubMed] [Google Scholar]
- Mannervik, B. and Danielson, U.H. 1988. Glutathione transferases-structure and catalytic activity. CRC Crit. Rev. Biochem. 23 283–337. [DOI] [PubMed] [Google Scholar]
- Mannervik, B., Alin, P., Guthenberg, C., Jensson, H., Tahir M.K., Warholm, M., and Jornvall, H. 1985. Identification of three classes of cytosolic glutathione transferase common to several mammalian species: Correlation between structural data and enzymatic properties. Proc. Natl. Acad. Sci. 82 7202–7206. [DOI] [PMC free article] [PubMed] [Google Scholar]
- Meyer, D.J., Coles, B., Pemble, S.E., Gilmore, K.S., Fraser, G.M., and Ketterer, B. 1991. Theta, a new class of glutathione transferases purified from rat and man. Biochem. J. 274 409–414. [DOI] [PMC free article] [PubMed] [Google Scholar]
- Pemble, S.E., Wardle, A.F., and Taylor, J.B. 1996. Glutathione S-transferase class κ: Characterization by the cloning of rat mitochondrial GST and identification of a human homologue. Biochem. J. 319 749–754. [DOI] [PMC free article] [PubMed] [Google Scholar]
- Pettigrew, N.E. and Colman, R.F. 2001. Heterodimers of glutathione S-transferase can form between isoenzyme classes π and μ. Arch. Biochem. Biophys. 396 225–230. [DOI] [PubMed] [Google Scholar]
- Pettigrew, N.E., Brush, E.J., and Colman, R.F. 2001. 3-Methyleneoxindole: An affinity label of glutathione S-transferase π which targets tryptophan 38. Biochemistry 40 7549–7558. [DOI] [PubMed] [Google Scholar]
- Pickett, C.B. and Lu, A.Y. 1989. Glutathione S-transferases: Gene structure, regulation, and biological function. Annu. Rev. Biochem. 58 743– 764. [DOI] [PubMed] [Google Scholar]
- Ploemen, J.H.T.M., Johnson, W.W., Jespersen, S., Vanderwall, D., van Ommen, B., van der Greef, J., van Bladeren, P.J., and Armstrong, R.A. 1994. Active-site tyrosyl residues are targets in the irreversible inhibition of a class μ glutathione transferase by 2-(S-glutathionyl)- 3, 5, 6,-trichloro-1, 4-benzoquinone. J. Biol. Chem. 269 26890– 26897. [PubMed] [Google Scholar]
- Ralat, L.A. and Colman, R.F. 2003. Monobromobimane occupies a distinct xenobiotic substrate site in glutathione S-transferase π. Protein Sci. 12 2575–2587. [DOI] [PMC free article] [PubMed] [Google Scholar]
- ———. 2004. Glutathione S-transferase π has at least three distinguishable xenobiotic substrate sites close to its glutathione-binding site. J. Biol. Chem. 279 50204–50213. [DOI] [PubMed] [Google Scholar]
- Rossjohn, J., Polekhina, G., Feil, S.C., Allocati, N., Masulli, M., De Illio, C., and Parker, M.W. 1998. A mixed disulfide bond in bacterial glutathione transferase: Functional and evolutionary implications. Structure 6 721–734. [DOI] [PubMed] [Google Scholar]
- Sambrook, J., Fritsch, E.F., and Maniatis, T. 1989. Molecular cloning: A laboratory manual, 2nd ed. Cold Spring Harbor Laboratory Press, Cold Spring Harbor, NY.
- Schneider, J.P., Lear, J.D., and DeGrado, W.F. 1997. A designed buried salt bridge in a heterodimeric coiled coil. J. Am. Chem. Soc. 119 5742– 5743. [Google Scholar]
- Shan, S. and Armstrong, R.N. 1994. Rational reconstruction of the active site of a class μ GST. J. Biol. Chem. 269 32373–32379. [PubMed] [Google Scholar]
- Sheenan, D., Meade, G., Foley, V.M., and Dowd, C.A. 2001. Structure, function and evolution of glutathione transferases: Implications for classification of non-mammalian member of an ancient enzyme superfamily. Biochem. J. 360 1–16. [DOI] [PMC free article] [PubMed] [Google Scholar]
- Soberman, R.J. and Austen, K.F. 1989. The cell biology and biochemistry of leukotriene C4 biosynthesis. Adv. Prostaglandin Thromboxane Leukot Res. 19 21–25. [PubMed] [Google Scholar]
- Vander Jagt, D.L., Hunsaker, L.A., Garcia, K.B., and Royer, R.E. 1985. Isolation and characterization of the multiple glutathione S-transferases from human liver. Evidence for unique heme-binding sites. J. Biol. Chem. 260 11603–11610. [PubMed] [Google Scholar]
- Vargo, M.A. and Colman, R.F. 2004. Heterodimers of wild-type and subunit interface mutant enzymes of glutathione S-transferase A1- 1: Interactive or independent active sites? Protein Sci. 13 1586– 1593. [DOI] [PMC free article] [PubMed] [Google Scholar]
- Vargo, M.A., Nguyen, L., and Colman, R.F. 2004. Subunit interface residues of glutathione S-transferase A1-1 that are important in the monomer–dimer equilibrium. Biochemistry 43 3327–3335. [DOI] [PubMed] [Google Scholar]
- Waxman, D.J. 1990. Glutathione S-transferases: Role in alkylating agent resistance and possible target for modulation chemotherapy—A review. Cancer Res. 50 6449–6454. [PubMed] [Google Scholar]
- Wilce, M.C. and Parker, M.W. 1994. Structure and function of glutathione S-transferases. Biochim. Biophys. Acta 1205 1–18. [DOI] [PubMed] [Google Scholar]