

Abstract
pH-dependent conformational changes are known to occur in dimeric procaspase-3, and they have been shown to affect the rate of automaturation. We studied the equilibrium unfolding of procaspase-3(C163S) as a function of pH (between pH 8.5 and pH 4) in order to examine these changes in the context of folding and stability. The data show that the procaspase dimer undergoes a pH-dependent dissociation below pH 5, so that the protein is mostly monomeric at pH 4. Consistent with this, the dimer unfolds via a four-state process between pH 8.5 and pH 4.75, in which the native dimer isomerizes to a dimeric intermediate, and the dimeric intermediate dissociates to a monomer, which then unfolds. In contrast, a small protein concentration dependence was observed by circular dichroism, but not by fluorescence emission, at pH 4.5 and pH 4.2. There was no protein-concentration dependence to the data collected at pH 4. Overall, the results are consistent with the redistribution of the population of native dimer (N2) to dimeric intermediate (I2) to monomeric intermediate (I), as the pH is lowered so that at pH 4, the “native” ensemble resembles the monomeric intermediate (I) observed during unfolding at higher pH. An emerging picture of the monomeric procaspase is discussed. Procaspase-3 is most stable at pH ~7 (24–26 kcal/mol), and while the stability decreased with pH, it was observed that dimerization contributes the majority (>70%) of the conformational free energy.
Keywords: caspase, dimerization, apoptosis, protein folding, fluorescence spectroscopy, circular dichroism
Caspases exist in normal cells as inactive zymogens and are activated by proteolytic processing. For some caspases, such as the initiator caspase-8, it has been shown that procaspase dimer formation is a critical event in maturation because the caspase monomers are enzymatically inactive (Stennicke and Salvesen 1998; Renatus et al. 2001). Dimerization of the initiator caspases is facilitated by protein–protein interactions of the caspase recruitment domain (CARD) or death effector domain (DED), located within the prodomain, and cognate-adapter proteins. This scaffold is sufficient to allow autolytic processing, which separates the subunits and removes the prodomain (Boatright et al. 2003). In contrast, executioner caspases, such as caspase-3 and caspase-7, are known to be dimers, even though they do not contain a CARD or DED (Cain et al. 1999; Chai et al. 2001; Pop et al. 2001; Riedl et al. 2001).
A major unanswered question in apoptosis research is why is the large pool of procaspase-3 found in the cell not enzymatically active? Until recently, it was thought that all procaspase zymogens were inactive, with the exception of procaspase-9 (Stennicke et al. 1999), and that they must be activated by scaffold-mediated dimerization or proteolysis (Earnshaw et al. 1999; Boatright et al. 2003). For executioner caspases, the answer appears to lie in the orientations of the active-site loops in the zymogen. Recent structures of procaspase-7 (Chai et al. 2001; Riedl et al. 2001) show that the active site is incompatible with substrate binding, because a loop that forms the base of the catalytic groove is extended away from the active site and is exposed to solvent. In addition, the catalytic cysteine (C163) is rotated 90° from its active position and is inaccessible to solvent. Upon maturation, the active-site loops undergo reorientations that result in formation of the catalytic groove, rotation of the C163 side chain, formation of the oxyanion hole, and stabilization of the active site through formation of new hydrogen bonds among several active-site loops. Maturation, that is, chain cleavage, can increase activity by several orders of magnitude (Bose et al. 2003). It has been suggested that this mechanism is conserved for other caspases (Shi 2002).
Nicholson and coworkers showed, however, that procaspase-3 is catalytically competent (Roy et al. 2001). Using an uncleavable mutant of procaspase-3, we further showed that the activity is about 200-fold lower than that of the mature enzyme (Bose et al. 2003). The lower activity is due to a decrease in kcat, while Km values were the same in the two forms of the protein. In related experiments, we demonstrated that mutations in the dimer interface affect the activity of the procaspase, and one mutation, V266E, resulted in pseudo-activation of the zymogen (Pop et al. 2003). This showed that for caspase-3, it is possible to activate the zymogen without proteolysis. The V266E mutant likely increases the conformational flexibility in the inter-subunit linker that allows the L2 loop, containing C163, to move to its productive conformation (see Fig. 1A ▶). Our studies suggest that, while the substrate binding pocket is preformed in the caspase-3 zymogen, the increase in activity upon maturation is due to opening of the active site and rearrangement of three of the four active-site loops that ultimately allows C163 to rotate toward the S1 subsite. These rearrangements also are consistent with those observed by crystallography (Chai et al. 2001; Riedl et al. 2001).
Figure 1.

(A) Structure of mature caspase-3. The positions of helices 1, 4, and 5, and of the active site tryptophanyl residues (W206 and W214) are indicated. Active-site loops L1, L2, L2′, and L4 are indicated. For clarity, only one active site is labeled. (B) Residues involved in charge–charge interactions across the dimer interface. The prime (′) indicates residues from the second heterodimer. The structures were generated using PDB entry 1CP3 and PyMOL (Delano Scientific). (C) Average emission wavelength versus pH for procaspase-3(C163S). The solid line represents a fit of the data as described (Bose and Clark 2001). The pKa values obtained from the fits are described in the text. (D) Size exclusion chromatography of procaspase-3(C163S) at pH 5 (solid line) or pH 4 (dashed line). The BSA monomer (66 kDa) eluted at 13.4 mL.
The intracellular pH decreases from 7.4 to ~6.8 during apoptosis (Gottlieb et al. 1996), and cytosolic acidification has been shown to affect the activation of caspase-3 through the intrinsic or mitochondrial pathway (Matsuyama et al. 2000). Because of the changes in intracellular pH, studies of the effects of pH on caspase structure are important for several reasons. First, the crystals of procaspase-7 were grown at lower pH (pH 5.6 and pH 5.8) (Chai et al. 2001; Riedl et al. 2001), and pH-dependent effects on the structure of procaspase-7 have not been examined. Second, Nicholson and coworkers showed that there was an increase in the rate of autoactivation of procaspase-3 when the protein was preincubated at lower pH, with the maximum rate occurring upon preincubation at pH 5.5 (Roy et al. 2001). This was attributed to the breaking of a salt-bridge afforded by a triaspartate “safety catch” (179DDD181) located in the intersubunit linker and just C-terminal to the D175 processing site. We also have described a pH-dependent conformational change that occurs between pH 7 and pH 5 that affects both the binding of the prodomain to the protease and the orientation of one active-site loop, L4 (Bose et al. 2003; Fig. 1A ▶). Thus, it still is not entirely clear why the rate of automaturation increases upon preincubation at lower pH. Using limited V8 proteolysis experiments, we showed that an additional conformational change occurs between pH 5 and pH 4 that renders the protein more resistant to digestion, although the active-site loop L4 remains accessible (Bose et al. 2003). These results correlate with pH-dependent changes in the fluorescence emission of the protein (Bose et al. 2003; see also Fig. 1C ▶), which are described by three transitions with pKa values of 4.7, 3.7, and <3. The first two transitions result in a blue-shifted fluorescence average emission wavelength as the pH is decreased. Whereas the data suggest that the titration of one or more acidic groups results in the fluorescence changes, the mechanisms for these transitions are unclear. Collectively, the data show pH-dependent conformational changes in procaspase-3 that affect the rate of automaturation.
Elucidation of protein conformational changes and stability is a key to understanding protein function. Because of this, pH-dependent unfolding studies have become a popular tool to gain insight into the conformational states that are generally undetectable under native solution conditions. Here, we have investigated the effect of pH on the stability of procaspase-3. We showed previously that at pH 7.2 and 25°C, procaspase-3 unfolds at equilibrium via a four-state process in which the native dimer (N2) isomerizes to a dimeric intermediate (I2) (Bose and Clark 2001). The dimeric intermediate dissociates to a monomeric intermediate (I), which then unfolds to the unfolded ensemble (U). The data show that dimerization occurs as a result of association of the monomeric folding intermediate; thus, dimerization is a folding event. The dimer contributes significantly to the overall stability of the protein (~19 of 26 kcal/mol). We show here that the protein is maximally stable at pH ~7. Between pH 8.5 and pH 4.75, the native dimer (N2) and dimeric intermediate (I2) are destabilized, such that at pH <4.75, the native state of the protein appears to be a mixture of the dimer and of the monomer. At pH 4, the data are best described by a two-state folding mechanism, in which the monomer unfolds to the unfolded monomeric ensemble. We further show that the procaspase-3 monomer is populated to ~90% at pH 4, whereas the protein is exclusively dimeric at pH >5.
Results
We used the catalytically inactive mutant of procaspase-3, C163S, in these studies because this mutation prevents autolysis during heterologous expression, but is not structurally perturbing (Gu et al. 1995; Van Criekinge et al. 1996; Stennicke et al. 1999). This procaspase-3 mutant has been the subject of our previous investigations (Pop et al. 2001; Bose et al. 2003), including stability measurements (Bose and Clark 2001). Overall, monomeric procaspase-3(C163S) has 285 amino acids (Mr = 32,642), including the LEH6 C-terminal sequence used for purification, and contains two tryptophans located in the active site (Fig. 1A ▶), as well as 10 tyrosines that are well distributed in the primary sequence.
We showed previously that the fluorescence emission of procaspase-3(C163S) is blue-shifted at pH <5 (Bose et al. 2003; see also Fig. 1C ▶). The data can be described by three transitions with pKa values of 4.7, 3.7, and <3, respectively, and the final transition results in a red-shift in fluorescence emission. In addition, we have shown that the transitions are completely reversible (Bose et al. 2003). In an attempt to explain the changes in fluorescence emission, we analyzed the protein by size-exclusion chromatography in order to determine whether the oligomeric properties changed over the pH range in which the major fluorescence transition occurs. As shown in Figure 1D ▶, at pH 5, the protein elutes as a single peak at a volume similar to that of the BSA monomer (66 kDa) (14 mL). The results were the same at pH 6 and pH 7 (data not shown), demonstrating that the protein is a dimer at pH >5. This correlates with our previous results using analytical ultracentrifugation, in which we estimated the Kd for dimer dissociation at pH 7.2 to be <50 nM (Pop et al. 2001). In contrast, at pH 4, two peaks are observed during elution from the sizing column (Fig. 1D ▶). The first peak is consistent with that of the dimer (64 kDa), and the second peak is consistent with that of the procaspase-3 monomer (32 kDa). Based on the areas under the peaks, we estimate that ~90% of procaspase-3(C163S) is monomeric at pH 4. Unfortunately, it has not been possible to examine the equilibrium quantitatively using sedimentation equilibrium experiments, as the protein precipitates slowly under the conditions of this experiment (pH 4.0, >20 μM protein, 20°C). However, the data shown in Figure 1D ▶, as well as our previous data (Bose and Clark 2001), demonstrate that the equilibrium dissociation constant changes from the low nanomolar range at pH 7.2 to the low micro-molar range, or higher, at pH 4. As described below, this is consistent with a lack of protein-concentration dependence in the equilibrium-unfolding profiles at pH 4. Overall, the data suggest that the titration of one or more acidic groups results in the dissociation of the procaspase-3 dimer between pH 5 and pH 4, and this is accompanied by a blue-shift in fluorescence emission.
Equilibrium unfolding of procaspase-3(C163S)
We examined the equilibrium unfolding of procaspase-3(C163S) as a function of urea concentration (0–8 M) between pH 8.5 and pH 4, as described in Materials and Methods. In these experiments, we monitored changes in the secondary structure by circular dichroism at 228 nm and changes in the tertiary structure by fluorescence emission following excitation at 280 or 295 nm. Excitation at 295 nm follows the tryptophanyl fluorescence emission, whereas excitation at 280 nm follows the emission of tyrosinyl and tryptophanyl residues. Changes in the fluorescence emission and circular dichroism properties of procaspase-3(C163S) as a function of urea concentration have been described previously (Bose and Clark 2001; Pop et al. 2001). Representative data are shown in Figure 2 ▶ for samples at pH 7.2 and 1 μM protein concentration. The data are characterized by two transitions. A pretransition occurs between 0 and ~1.5 M urea, then there is a cooperative change in signal between 1.5 M and ~3 M urea that is followed by a plateau between ~3 M and 5 M urea. The second cooperative transition occurs at urea concentrations greater than 5 M. Within the plateau region, the relative signal was significantly higher when the samples were excited at 295 nm compared to either the CD or the fluorescence emission with excitation at 280 nm. Overall, the data suggest a minimum three-state folding process, in which a well-populated intermediate is in equilibrium with the native and unfolded protein. As we have described previously (Bose and Clark 2001) and show below, the plateau corresponds to the dissociation of the dimer.
Figure 2.

Equilibrium unfolding of procaspase-3(C163S) at pH 7.2. Unfolding was measured by circular dichroism at 228 nm (▵) and by fluorescence average emission wavelength with excitation at 280 nm (○) or at 295 nm (□). For all experiments, the protein concentration was 1 μM. The data were fit simultaneously (solid lines) as described in Materials and Methods using Igor Pro (WaveMetrics, Inc.), and the conformational free energies and m-values obtained from the fits are shown in Figure 6 ▶.
pH effects on equilibrium unfolding: pH 8.5–4.75
We performed urea-induced equilibrium unfolding experiments at 12 different pH values (between pH 8.5 and pH 4), and because procaspase-3 is a homodimer, we examined the effect of protein concentration on equilibrium unfolding using a protein concentration range of 0.25–2 μM. As described in Materials and Methods, this experimental protocol provides 11 data sets at each pH that are fit globally to determine the free energy and m-values. In addition, refolding data are shown by the solid triangles in the figures, demonstrating that folding is reversible over the entire pH range. Representative data for pH 8.5, pH 6.5, and pH 4.75 are shown in Figure 3 ▶. These data are described first because the four-state equilibrium model shown in equations 2 and 5 adequately describes the data over this pH range. The free energies and m-values obtained from the fits are described below (Fig. 6 ▶, below), but the following comparisons are made here. First, a protein concentration dependence is observed in all three spectroscopic probes over the entire pH range (that is, pH 8.5–4.75), demonstrating that the native protein remains dimeric under these conditions. This is in agreement with the data shown in Figure 1D ▶ from size exclusion chromatography. The protein concentration dependence is observed over a broad range of urea concentrations (~2 M to ~7 M, in some cases). As described previously (Bose and Clark 2001), this broad transition is due to the low m-value associated with dimer dissociation (I2 ⇆ 2I, see equation 2) as well as to the stability of the monomer. As a result, the dimeric intermediate (I2) and the monomeric intermediate (I) are both populated over the urea concentration range of ~2 M to 7 M (see also Fig. 5 ▶, below). Second, the relative signals versus urea at 1 μM protein concentration are shown in Figure 3, D, H, and L ▶. At pH 8.5 and pH 6.5, the relative signals of the intermediates are greater when fluorescence emission is measured following excitation at 295 nm than when the samples are excited at 280 nm, or when CD is measured at 228 nm. One should note that these signals are relative to those of the native (1) and unfolded ensembles (0). However, this is not true at pH 4.75. The relative signals of the intermediates obtained by circular dichroism are either similar to or slightly larger than that of the native ensemble, whereas their relative signals are lower when monitored by fluorescence emission. This is consistent with changes in the fluorescence emission between pH 8.5 and pH 4.75, shown in Figure 1C ▶, where the emission is blue-shifted at the lower pH. That is, the fluorescence emission of the native ensemble is blue-shifted at pH 4.75 relative to that at pH 8.5. As described below, this is likely due to the presence of the folding intermediates, I2 and possibly I, in the native ensemble at lower pH and in the absence of urea. Third, changes in the midpoint of the first and third transitions are readily observed in the data shown in Figure 3 ▶. The midpoint, or urea1/2, of the first transition (N2 ⇆ I2, see equation 2) decreases from ~2.7 M urea at higher pH to about 0.4 M urea at pH 4.75 (see also Fig. 6C ▶, below). This is reflected in a decrease in the free energy of the first transition from ~6 kcal/mol to ~1 kcal/mol (discussed below). Because of the low urea1/2 at pH 4.75, there is a consequential increase in error associated with the m-value and free energy, m1 and Δ G1H2O, of the first transition. As a result, the slope of the pretransition (equation 6) was assumed to be zero at this pH and was not allowed to vary in the fits. The midpoint of the third transition (I ⇆U, see equation 2) decreases from ~6 M urea at pH 8.5 to ~4.4 M urea at pH 6, where it remains constant until pH 4.2 (see Fig. 6C ▶, below). The changes in the midpoints also are reflected in the changes in free energy (see Fig. 6A ▶, below) for unfolding of the monomer, where it is observed that the stability of the monomer decreases from ~7 kcal/mol at higher pH to ~5 kcal/mol at pH 4.75. As described previously (Bose and Clark 2001), the free energies associated with dimerization and the subsequent isomerization contribute >70% of the total free energy. Thus the changes in Δ G3 H2O (I ⇆U) make relatively small changes in the total free energy at higher pH (see Fig. 6A ▶, below). Fourth, when unfolding is monitored by CD, the relative signal of the intermediates appears to increase relative to that of the native ensemble as the pH is lowered (cf. Fig. 3C, G, and K ▶). This is due to a destabilized native conformation and a consequential shift in the populations of I2 and of I to lower urea concentrations (see also Fig, 5A–C ▶, below). As the intermediates are populated at urea concentrations approaching zero molar, the relative signal of the “intermediate” ensemble moves closer to that of the “native” ensemble.
Figure 3.

Equilibrium unfolding vs. urea of procaspase-3(C163S) from pH 8.5 to pH 4.75. The pH is indicated at the top of each column. The protein concentrations are as follows: 0.25 μM (⋄), 0.5 μM (▵), 1 μM (□) and 2 μM (○). The solid triangles (▴) represent refolding data for 0.5 μM protein concentration to show reversibility. (A,E,I) Unfolding was monitored by fluorescence emission with excitation at 280 nm; (B,F,J) unfolding was monitored by fluorescence emission with excitation at 295 nm; (C,G,K) unfolding was monitored by circular dichroism at 228 nm. (D,H,L) An overlay of data for 1 μM protein concentration and fluorescence emission with excitation at 280 nm (○) or 295 nm (□) and CD at 228 nm (▵). The solid lines represent global fits of the data as described in Materials and Methods.
Figure 6.
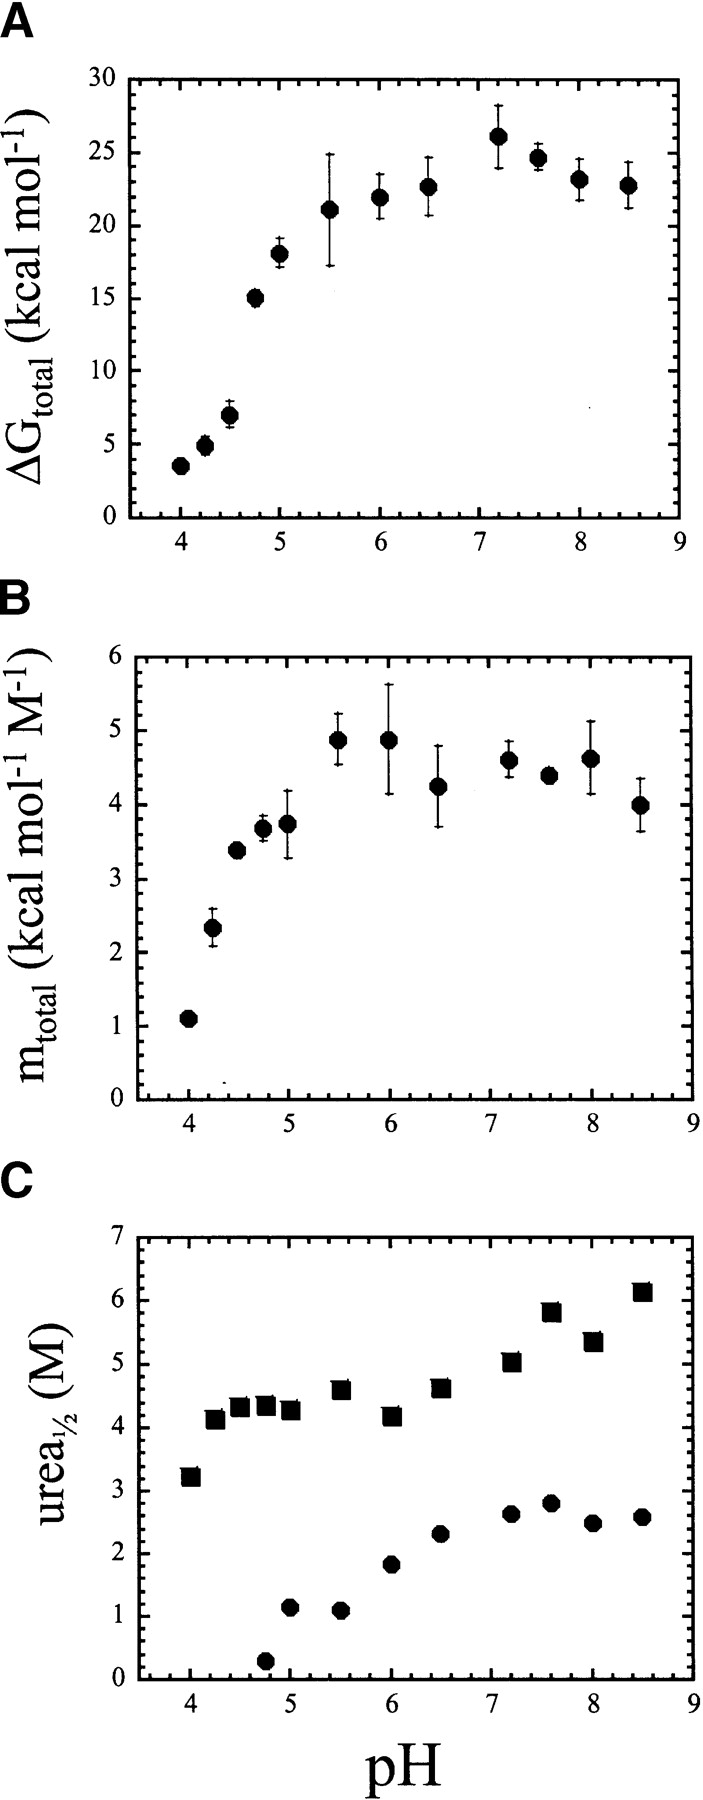
(A) Plot of total free energy (°Gtotal) versus pH. (B) Plot of total cooperativity index (mtotal) versus pH. The error bars show the standard error obtained from the global fits of 11 unfolding curves at each pH (four each from two sets of fluorescence data and three from CD data). (C) Mid-point of the unfolding transition (urea1/2) for the N2 ⇆I2 transition (•) and the I ⇆U transition (▪).
Figure 5.

Fraction of species as a function of urea concentration at pH 8.5 (A), pH 6.5 (B), pH 4.75 (C), pH 4.5 (D), pH 4.2 (E), and pH 4.0 (F). The fractions of native, dimeric intermediate, monomeric intermediate, and the unfolded protein were calculated as a function of urea concentration from fits of the data shown in Figures 3 ▶ and 4 ▶, and the parameters shown in Figure 6 ▶ for protein concentrations of 0.25, 0.5, 1, or 2 μM. N2 and N refer to the dimeric and monomeric native procaspase-3(C163S), I2 and I are the dimeric and monomeric intermediates, and U refers to the unfolded species. (○) fraction of I2; (□) fraction of I. The data for 0.25 μM are represented by the dashed lines, and the data for 2 μM are represented by the solid symbols.
Overall, the data shown in Figure 3 ▶ demonstrate that procaspase-3(C163S) is a dimer from pH 8.5 to pH 4.75. The stability of the monomeric intermediate (I) decreases between pH 8.5 and pH ~6, where it then remains constant to pH 4.2. The native dimer (N2) is destabilized relative to the dimeric intermediate (I2) at pH <~6.5, so that at pH 4.75, the “native” ensemble appears to be a combination of the native dimer and of the dimeric intermediate.
pH effects on equilibrium unfolding: pH 4.5–4.0
The equilibrium unfolding experiments performed at pH 4.5, pH 4.2, and pH 4.0 also were examined at several protein concentrations. As shown in Figure 4 ▶, there is little to no protein concentration dependence to unfolding when monitored by fluorescence emission. This is consistent with the results of the sizing column in which we showed that the protein was mostly monomeric (~90%) at pH 4 (Fig. 1D ▶). When monitored by CD, a small protein concentration dependence was observed at pH 4.5, which diminished further at pH 4.2 and pH 4.0 (Fig. 4 ▶, cf. C, G, and K). For the experiments at pH 4.5 and pH 4.2, the data were fit globally to a three-state equilibrium model for a monomeric protein (equations 3 and 8) in which a well-populated intermediate conformation is in equilibrium with the native and unfolded ensembles. The total free energy and m-value obtained from the fits are shown in Figure 6 ▶, below. At pH 4.5, the free energy of the first transition, Δ G1H20, was 1.7 ± 0.5 kcal/mol and that of the second transition, Δ G2H2O, was 5.3 ± 0.5 kcal/mol, for a total free energy of 7.0 kcal/mol. However, it is likely that this model underestimates the free energy, because the protein is not completely monomeric at pH 4.5. This is observed by the concentration dependence in unfolding monitored by CD (Fig. 4C ▶). Indeed, the CD data were equally well fit to a model in which the native dimer dissociates to a monomeric folding intermediate, which then unfolds (N2 ⇆2I ⇆2U) (data not shown). We consider this model to be equivalent to the latter two transitions of the four-state equilibrium model described in equation 2 (I2 ⇆ 2I ⇆2U), suggesting that the “native” ensemble at pH 4.5 is a combination of the two intermediate conformations observed at higher pH. From fits of the CD data to this model, the free energy of the first transition was determined to be 4.5 ± 0.4 kcal/mol, and that of the second transition was 5.1 ± 0.4 kcal/mol, giving a total free energy of 9.6 kcal/mol. We consider the values of 9.6 kcal/mol (three-state dimer) and 7.0 kcal/mol (three-state monomer) to represent the upper and lower limits for the conformational free energy at pH 4.5. While both models obtain the same conformational free energy for unfolding of the monomer (5.3 kcal/mol), the difference between the two models is observed in the free energies of the first transition.
Figure 4.

Equilibrium unfolding versus urea of procaspase-3(C163S) from pH 4.5 to pH 4.0. The pH is indicated at the top of each column. The protein concentrations are as follows: 0.25 μM (⋄), 0.5 μM (▵), 1 μM (□) and 2 μM (○). (▴) Refolding data for 0.5 μM protein concentration to show reversibility. (A,E,I) Unfolding was monitored by fluorescence emission with excitation at 280 nm; (B,F,J) unfolding was monitored by fluorescence emission with excitation at 295 nm; (C,G,K) unfolding was monitored by circular dichroism at 228 nm. (D,H,L) An overlay of data for 1 μM protein concentration and fluorescence emission with excitation at 280 nm (○) or 295 nm (□) and CD at 228 nm (▵). The solid lines represent global fits of the data as described in Materials and Methods.
At pH 4.2, there also was no protein concentration dependence when unfolding was monitored by fluorescence emission (Fig. 4E,F ▶). Although a small protein concentration dependence was observed for the CD data, it was less than that observed at pH 4.5 (Fig. 4 ▶, cf. C and G). The data were fit globally to a three-state monomer model, the same as described for the data at pH 4.5 above, and the total free energy and m-value obtained from the fits are shown in Figure 6 ▶, below, but are summarized here. At pH 4.2, the free energy of the first transition, Δ G1H2O, was 1.3 ± 0.3 kcal/mol and that of the second transition, ΔG2H2O, was 3.7 ± 0.5 kcal/mol, for a total free energy of 5.0 kcal/mol. The CD data were not fit better to the three-state dimeric model described above for pH 4.5, but were equally well described by a two-state dimeric model, in which the native dimer is in equilibrium with the unfolded ensemble (N2 ⇆ 2U) (data not shown). From this model, the conformational free energy was determined to be 3.4 ± 0.4 kcal/mol. Again, these values—5.0 kcal/mol (three-state monomer) and 3.4 kcal/mol (two-state dimer)—likely represent the upper and lower limits for the conformational free energy at pH 4.2.
No protein concentration dependence was observed for equilibrium unfolding at pH 4, demonstrating that the protein is a monomer at this pH. This is in agreement with the data from the sizing column (Fig. 1D ▶), which showed that ~90% of the protein was monomeric at pH 4. While there is a small protein concentration dependence to the CD data (Fig. 4K ▶), the data are not well described by the models mentioned above for pH 4.5 or pH 4.2. At pH 4, the fluorescence emission and CD data were fit globally to a two-state equilibrium model for a monomer (see equations 4 and 9), and the free energy and m-value obtained from the fits are shown in Figure 6 ▶, below. An overlay of the three spectroscopic probes (Fig. 4L ▶) shows that the data are not coincident, where it was observed that the CD data have a lower midpoint than do the fluorescence emission data. This suggests that the secondary structure of the monomer unfolds prior to the tertiary structure. This also demonstrates that a simple two-state folding model is not sufficient to describe the data, which is not completely unexpected, since the sizing column data (Fig. 1D ▶) showed the presence of a small amount (~10%) of dimer at pH 4. As a consequence, the free energy shown in Figure 6A ▶, below, is likely an underestimate. However,based on the limits determined at pH 4.5 and pH 4.2 described above, we suggest that the free energy estimate at pH 4 is likely to be within ~1 kcal/mol of the actual value. Finally, when the samples are excited at 295 nm, one obtains a large slope to the baseline of the unfolded ensemble in the fits to the two-state model (in equation 7) (Fig. 4J,L ▶). This is not true of samples excited at 280 nm (Fig. 4I ▶) or the CD data (Fig. 4K ▶). The results suggest that there may be an intermediate present at urea concentrations of ~5–7 M urea, and that the intermediate has little secondary structure, but may contain residual tertiary contacts. As a result of the putative intermediate, the unfolded ensemble baselines are not well determined by the two-state folding model when unfolding is monitored by tryptophanyl fluorescence emission.
Fraction of species versus urea concentration
For each pH, we calculated the equilibrium distribution of species over the urea concentration range of 0–8 M by using the values of the free energies and of the cooperativity indices determined for each transition. In addition, the fraction of species was calculated for four protein concentrations (0.25, 0.5, 1, and 2 μM). Representative data for pH 8.5, pH 6.5, pH 4.75, pH 4.5, pH 4.2, and pH 4, corresponding to the data from Figures 3 ▶ and 4 ▶, are shown in Figure 5 ▶ (A–F, respectively). At higher pH (8.5–4.75), there is a cooperative decrease in native protein with a concomitant increase in the population of the dimeric (I2) and of the monomeric intermediate (I) between 0 M and ~3 M urea. The midpoint of the first transition decreases from ~2.7 M urea at higher pH to ~0.4 M urea at pH 4.75 (see Fig. 6C ▶), consistent with the unfolding data shown in Figure 3 ▶. In addition, the data demonstrate that at pH 4.75 (Fig. 6C ▶), the “native” ensemble (in the absence of urea) consists of a mixture of the native dimer (N2), the dimeric intermediate (I2), and the monomeric intermediate (I). The latter two species comprise about 30% of the total population in the absence of urea.
As shown in this figure, the relative populations of the dimeric and the monomeric intermediate species are dependent on the protein concentration. At pH 8.5, the population of I2 reaches a maximum at ~3.2 M urea, whereas the population of I reaches a maximum at ~5 M urea. As described previously (Bose and Clark 2001), both species are present simultaneously because of the low m-value associated with dimer dissociation (~0.4 kcal mol−1 M−1), as well as the formation of a stable monomeric species upon dimer dissociation. The data suggest that upon dissociation, the monomeric intermediate has different fluorescence emission and CD properties compared to those of the dimeric intermediate. The simultaneous population of both species explains both the protein concentration dependence to the midpoint of the second transition and the dependence of the amplitude of the plateau region on protein concentration (see Fig. 3A ▶ for example). The transition of I to the unfolded species (U) has a midpoint of ~6.2 M urea (pH 8.5) (see also Fig. 6C ▶), although this decreases to ~4.4 M urea at pH 4.75 (Figs. 5C ▶, 6C ▶).
The population of species is similar at pH 4.5 and pH 4.2 (Fig. 5D,E ▶). The transition of the “native” ensemble to the monomeric intermediate occurs with a midpoint of ~1 M urea, whereas the midpoint of unfolding the monomer is ~4.3 M urea at pH 4.5 and ~4 M urea at pH 4.2 (see also Fig. 6C ▶). As described above, however, the “native” ensemble at pH 4.5 and pH 4.2 is likely to be a combination of the two intermediate conformations observed at higher pH, I2 and I. Thus the “N” and “I” species labeled in Figure 5, D and E ▶, may contain a mixture of dimeric and monomeric intermediates, which explains the small protein concentration dependence to unfolding observed at these pH values (Fig. 4C,G ▶). However, as shown above (Fig. 1D ▶), the protein is almost completely monomeric at pH 4, so the procaspase-3 monomer is mostly represented by the population of “N” shown in Figure 5F ▶.
Conformational stability versus pH
The free energies (ΔGH2O) and cooperativity indices (m-values) were determined for the data shown in Figures 3 ▶ and 4 ▶. As described above, and with the caveats mentioned, the data for pH 8.5–4.75 were fit globally to a four-state equilibrium model for a dimeric protein (equation 2), the data for pH 4.5 and pH 4.2 were fit to a three-state model for a monomeric protein (equation 3), and the data for pH 4 were fit to a two-state model for a monomeric protein (equation 4). In the case of the four-state model, three free energies and three m-values are determined from the fits, whereas two free energies and m-values are determined from the three-state model, and one free energy and one m-value are determined from the two-state model. The total conformational free energy of the protein and the total m-values are plotted versus pH in Figure 6, A and B ▶, respectively. As shown in Figure 6A ▶, the total free energy at higher pH is ~23–25 kcal/mol, with a maximum stability observed at pH ~7. The free energy decreases dramatically at pH <5.5, where the protein stability is only ~4 kcal/mol at pH 4. As shown above, over this pH range, the procaspase-3 dimer dissociates to the monomer, and this results in a dramatic decrease in stability (about 18 kcal/mol between pH 5.5 and pH 4). This also agrees with our previous data that showed that the dimer contributes significantly to the overall stability of the protein (~19 of 26 kcal/mol at pH 7.2) (Bose and Clark 2001).
The cooperativity indices, or m-values, also were determined from the fits, and it was observed that for each transition, the m-value was constant over the entire pH range in which the corresponding species was observed (data not shown). For example, the average value of m1, corresponding to the transition of N2 to I2, was 2.8 ± 0.3 kcal mol−1 M−1 over the pH range of 8.5–4.75. Also, from pH 8.5 to pH 4.75, the average value of m2, corresponding to the transition of I2 to 2I, was 0.43 ± 0.13 kcal mol −1 M−1. Below pH 4.75, those transitions were no longer observed. This results in a constant value for mtotal (the sum of all m-values at each pH), as shown in Figure 6B ▶, from pH 8.0 to pH 4.75. Below pH ~5, the total m-value decreased due to the redistribution of populations from the native dimer to the dimeric intermediate to the monomeric intermediate as the pH was decreased from 5 to 4. For example, the native dimer, N2, was no longer observed below pH 4.75, and consequently, the total m-value decreased with the loss of the transition. The fits were characterized by two transitions, thus two m-values, rather than three. The same was true at pH 4.2, where the dissociation of the dimer was no longer observed. The value of mtotal decreased further between pH 4.5 and pH 4.2, although the midpoint of the transition for unfolding the monomer (I ⇆U) remained constant, and this is due to the change in population of dimer. That is, the low concentration of the dimer decreased further at pH 4.2 relative to that at pH 4.5, and this is reflected in a decrease of m1 using the three-state model for unfolding of a monomer. This results in the differences observed in the population distribution of “I” in Figure 5, D and E ▶ because, as described above, the residual concentrations of the dimer contribute to the “N” and “I” populations. The value of the cooperativity index associated with the second transition (I ⇆U) was the same as that for unfolding of the monomer at higher pH, 1.2 kcal mol−1 M−1. At pH 4, the single m-value was determined to be 1.1 kcal mol−1 M−1, which is consistent with the unfolding of the monomer (I ⇆U). From the 12 data sets (pH 8.5–4), the average cooperativity index of this transition was 1.2 ± 0.17 kcal mol−1 M−1. Because the m-value is constant over the entire pH range, we suggest that the monomeric ensemble at pH 4 is likely a similar conformation as the monomeric intermediate, I, observed at higher pH.
The changes in the midpoints of two transitions, those of N2 ⇆I2 and of I ⇆U, are shown in Figure 6C ▶. The midpoint is calculated as Δ GxH2O ÷ mx, where x refers to the transition of interest. As described above, the midpoint of the transition of N2 to I2 is ~2.7 M urea at higher pH. Below pH ~7, the midpoint decreases to ~0.4 M urea at pH 4.75. The midpoint of the transition of I to U is ~6 M urea at higher pH and decreases to ~4.4 M urea at pH 6, where it then remains constant until pH 4.
Overall, the data show that the changes in free energy observed at higher pH are due to the destabilization of the native dimer, N2, relative to the dimeric intermediate, I2, as well as the destabilization of the monomer. This is reflected in the decrease of the midpoints for these two transitions. Below pH 4.75, there is very little dimeric species remaining, and at pH 4, the measured free energy is primarily that of the monomer.
Discussion
Understanding the process of protein folding and elucidating the physical determinants of protein stability is central to understanding protein structure, function, and control of diseases. Not only have a number of diseases been attributed to protein folding defects, but the biophysical characterizations of the folding properties suggest therapeutic strategies for treatment. For example, the ΔF508 mutation of the cystic fibrosis transmembrane conductance regulator (CFTR) has been shown to be a functional chloride channel, but structural alterations prevent its release from the ER (Brown et al. 1997). As a result, developing ways to facilitate removal from the ER has important clinical applications. Likewise, caspases play a key role in apoptosis, where proper caspase function is required to maintain homeostasis in eumetazoans. Dysregulation of apoptosis, on the other hand, may lead to autoimmune diseases, neurodegenerative disorders, or cancer (Kumar 1999). Learning to selectively manipulate the level of apoptosis may well lead to therapeutic strategies for these diseases. As a result, a close examination of the folding, dimerization, maturation, and inhibition of caspases becomes necessary.
It has been shown that several pH-dependent conformational changes occur in procaspase-3 between pH 7 and pH 5. Using limited V8 proteolysis studies, we showed that the propeptide binds more weakly to the protease domain at the lower pH and that active-site loop L4 (Fig. 1A ▶) is more accessible to the protease as the pH is lowered (Bose et al. 2003). Nicholson and coworkers showed that protein pre-incubated at pH 5.5 underwent a more rapid automaturation (Roy et al. 2001). This suggested that conformational changes occur in the intersubunit linker that affect the rate of autolysis. While the nature of these conformational changes remains unknown, we show here that they result in relatively modest changes in the protein stability, about 4 kcal/mol between pH 7 and pH 5.5. As we showed previously, the dimerization of two monomeric folding intermediates accounts for the majority of the protein stability (~19 kcal/mol of 26 kcal/mol) (Bose and Clark 2001). Below pH 5, the dimer dissociates, such that the protein is almost exclusively monomeric at pH 4. This transition is accompanied by a large decrease in conformational free energy and is correlated to a blue-shift in fluorescence average emission wavelength. We suggest that the pKa that describes the transition in fluorescence emission (pKa = 4.7) also describes the dimer dissociation. While the groups responsible for the pH-dependent dissociation of the dimer are not known, the data suggest that one or more acidic groups are responsible. In caspase-3, there are several ion pairs at the amino terminus of helix 5 that interact across the dimer interface (Fig. 1B ▶). Residues E231, H234, R238, and E272 form a network of charge–charge interactions with the same residues from the second monomer (Rotonda et al. 1996; Mittl et al. 1997) and are predicted to stabilize the dimer. Thus, E231 and E272 are likely candidates for the pH-dependent dissociation.
In contrast to the executioner caspases, zymogens of the activator caspases are monomeric until they are activated by a scaffold-mediated dimerization mechanism (Earnshaw et al. 1999; Boatright et al. 2003). Thus, for these caspases, the procaspase monomer is populated at physiological pH. For executioner caspases, such as caspase-3, the zymogens exist as dimers at physiological pH and are activated by cleavage of the polypeptide chain, allowing rearrangement of the active site. We show here that the monomer of procaspase-3 is not populated unless the pH is lowered or the protein is incubated in high concentrations of denaturant. As a result, there has been no description of the monomer of executioner caspases or the conformational changes that occur upon dimerization. The data presented here and elsewhere (Bose and Clark 2001; Bose et al. 2003) allow for a preliminary description of the procaspase-3 monomer. The monomer is characterized by a blue-shift in fluorescence emission relative to the native dimer. This suggests that the environment of the tryptophans in the active site is more hydrophobic relative to that of the dimer, although it is not yet clear how this is reflected in movements of the active-site loops. A more hydrophobic environment could result from a decreased exposure to solvent or by removal of negative charges in the active site by protonation. The caspase-3 active site generally is positively charged, since it binds two aspartyl side chains in the substrate, and the closest negative charge (D211) is 7.4 Å from W214 (Rotonda et al. 1996; Mittl et al. 1997) and would not be predicted to affect the fluorescence emission. In addition to changes in fluorescence emission, the monomer is significantly less sensitive to V8 protease than is the dimer, as cleavage was observed only in active-site loop L4 (Bose et al. 2003). The cleavages observed at higher pH in active-site loop L2′ and in the propeptide were absent in the procaspase-3 monomer. This is consistent with conformational changes that render the active site less accessible to solvent, and result in a blue-shifted fluorescence emission. Overall, the data suggest that dimerization is coupled to conformational changes in the monomer rather than the association of two pre-formed native-like monomers.
For procaspase-3(C163S), the total m-value (mtotal) is constant between pH 8 and pH 5 (~4.6 kcal mol−1 M−1) and then decreases between pH 5 and pH 4 (1.1 kcal mol−1 M−1 at pH 4). In other proteins, generally small monomeric proteins, m-values have been shown to increase or to decrease as the pH is decreased (Pace et al. 1990, 1992; Barrick and Baldwin 1993; Shortle 1995; Whitten et al. 2001; Sato and Raleigh 2002). This is generally interpreted in two ways. A population of a non-native folding intermediate may be stabilized relative to the population of native protein, or the unfolded ensemble becomes less compact at lower pH because of an increase in positive charge. The first model is particularly satisfying because it accounts for either an increase or a decrease in m-value with a change in pH, since the population of the intermediate depends on the pH range in which the intermediate is stabilized (Whitten et al. 2001). Here, we show an alternate explanation for changes in m-value with pH for larger dimeric proteins. The decrease in m-value at lower pH is due to the dissociation of the dimer and subsequent loss of burial of hydrophobic surface area in the dimer interface. In native caspase-3, ~2000 Å2 are buried in the dimer interface (Rotonda et al. 1996; Mittl et al. 1997). While the structure of procaspase-3 is not known, we used the equations of Scholtz and coworkers (Myers et al. 1995) and the m-value of dimer association (m2 = 0.4 kcal mol−1 M −1) to estimate that ~1200 Å2 of hydrophobic surface area are buried as a result of dimerization (I2 ⇆2I) (Bose and Clark 2001), suggesting that the dimer interface is mostly intact in the reaction of I2 to 2I. Since mtotal is the sum of the individual m-values, the observed decrease in mtotal below pH 5 reflects the absence of one or more states during unfolding, dimerization in this case.
Materials and methods
Reagents
Ampicillin, antifoam-C, DEAE-Sepharose, IPTG, nickel sulfate, PMSF, potassium phosphate (KH2PO4 and K2HPO4), citric acid, sodium citrate (dihydrate), dithiothreitol (DTT), Trizma base, and siliconized microcentrifuge tubes were obtained from Sigma Chemicals. Imidazole was from ICN. Tryptone and yeast extract were from Difco. His-bind resin was from Novagen. Ultra-pure urea was purchased from Nacalai Tesque Inc. Procaspase-3(C163S) was isolated from an Escherichia coli expression system as described previously (Pop et al. 2001; Bose et al. 2003).
Stock solutions
Urea stock solutions (10 M) were prepared as described previously (Pace et al. 1989) in citrate buffer (30 mM sodium citrate/citric acid at pH 4–6.5, 1 mM DTT) and Tris buffer (30 mM Tris-HCl at pH 7–9, 1 mM DTT). All solutions were prepared fresh for each experiment and were filtered (0.22 μm pore size) prior to use. The urea concentration of each stock solution was calculated by weight and by refractive index (Pace et al. 1989), and solutions were used only if the two values were within ±1%.
Fluorescence emission versus pH
The average emission wavelength of procaspase-3(C163S) was measured over the pH range of 2.4–9 as described (Bose et al. 2003).
Size exclusion chromatography
In separate experiments, procaspase-3(C163S) was dialyzed for >8 h at 25°C in 5 mM phosphate buffer (pH 7.0 or pH 6.0), or in 5 mM citrate buffer (pH 5.0 or pH 4.0). The protein was then diluted to a concentration of 10 μM, and 5 μL was loaded onto an Agilent G250 sephacryl HPLC sizing column using an Agilent bioanalyzer (model 8423) coupled to an Essense HPLC work station (Lab Alliance). The column had been pre-equilibrated with the dialysis buffer. Absorbance was measured at 214 nm. The column was standardized using Biorad broad range standards and using BSA (132-kDa dimer, 66 kDa monomer). The elution volume of BSA (13.4 mL) did not change over the pH range of 4–7.
Equilibrium unfolding
Procaspase-3(C163S) was dialyzed in citrate buffer (30 mM) for experiments from pH 4 to pH 6.5 and Tris-HCl buffer (30 mM) from pH 7 to pH 9. All buffers contained 1 mM DTT. Equilibrium unfolding experiments were performed as described previously (Bose and Clark 2001). In separate experiments, the protein concentration was varied from 0.25 to 2 μM. All samples were incubated for a minimum of 16 h at 25°C to allow for equilibration. For each sample, fluorescence emission was acquired from 305–400 nm following excitation at 280 or 295 nm (PTI C-61 spectrofluorometer, Photon Technology International). Circular dichroism was measured at 228 nm with a Jasco J600A spectropolarimeter as described previously (Bose and Clark 2001).
Data analysis
For equilibrium folding/unfolding studies at different pH values, the average emission wavelength was calculated for each fluorescence emission scan (Royer et al. 1993) using equation 1,
 |
(1) |
where 〈λ〉 is the average emission wavelength, and Ii is the fluorescence emission at wavelength λi.
Data collected between pH 8.5 and pH 4.75 were fit to a four-state equilibrium folding model as described previously (Bose and Clark 2001) and shown in equation 2.
 |
(2) |
In this model, the protein is assumed to be either in the native homodimeric state (N2), a non-native dimeric state (I2), a non-native monomeric state (I), or the unfolded monomeric state (U), and K1, K2, and K3 are the equilibrium constants for the three steps, respectively.
Data collected at pH 4.5 and pH 4.2 were fit to a three-state equilibrium folding model (Fu and Liang 2002) (equation 3).
 |
(3) |
In this model, the protein is assumed to be either in the native monomeric state (N), a non-native monomeric state (I) or the unfolded monomeric state (U), and K1 and K2 are the equilibrium constants for the two steps, respectively.
Data collected at pH 4 were fit to a two-state equilibrium folding model (Santoro and Bolen 1988) (equation 4).
 |
(4) |
In this model, the protein is assumed to be either in the native monomeric state (N) or in an unfolded monomeric state (U), and Keq is the equilibrium constant for the transition.
Global fits of the equilibrium unfolding data
The experimental protocol results in ~11 data sets at each pH, corresponding to three spectroscopic probes and several protein concentrations. The data collected at each pH were fit globally using the models described above and the program Igor Pro (WaveMetrics, Inc.).
Data collected between pH 8.5 and pH 4.75 were fit to the four-state equilibrium model (equation 2). As described previously (Bose and Clark 2001), the model yields 12 parameters for fitting. Six of the parameters were fit globally, that is, Δ G1 H2O, Δ G2H2O, and Δ G3H2O are the free energy changes in the absence of denaturant corresponding to K1, K2, and K3, respectively, and m1, m2, and m3 are the cooperativity indices associated with each step. The amplitude of the spectroscopic signal determined at each urea concentration is assumed to be a linear combination of the fractional contribution from each species (f) (equation 5)
 |
(5) |
where, YN2, YI2, and YU are the amplitudes of the signals of the respective species. In all fits, the amplitudes of the native and unfolded forms of the protein are assumed to be linearly dependent on urea concentration, as shown in equations 6 and 7.
 |
(6) |
 |
(7) |
where Y ′N2 is the amplitude of the signal in the absence of urea for the native species, and YU′ is the amplitude of the signal in the absence of urea for the unfolded species. In the fits, six parameters were considered local parameters and were varied for each data set independently, that is, Y′,N2, YU′ YI2, YI, mN′, and mU′. For each spectroscopic signal, the values of YI2 and of YI, that is, the amplitudes of the signals for the two intermediate species did not vary with changes in protein concentration.
In separate experiments, the data collected at pH 4.5 and pH 4.2 were fit globally to the three-state model (equation 3). This model yields nine parameters for fitting. Four of the parameters were fit globally, that is, Δ G1H2O, m1, ΔG2H2O, and m2, corresponding to K1 and K2, respectively. As with the four-state equilibrium model described above, the amplitude of the spectroscopic signal determined at each urea concentration is assumed to be a linear combination of the fractional contribution from each species (f) (equation 8)
 |
(8) |
where YN, YI, and YU are the amplitudes of the signals of the respective species. It should be noted that the models do not imply that the intermediate present in the three-state equilibrium unfolding is the same as that observed in the four-state equilibrium unfolding. As described above (equations 6 and 7), the amplitudes of the native and unfolded forms of the protein are assumed to be linearly dependent on urea concentration. In the fits, five parameters were considered local parameters, and were varied for each data set independently, that is, YN′, YU′, YI, mN′, and mU′.
The data collected at pH 4 were fit globally to the two-state model (equation 4). This model yields six parameters for fitting. Two of the parameters were fit globally, that is, ΔGH2O and m, corresponding to Keq. As with the models described above, the amplitude of the spectroscopic signal determined at each urea concentration is assumed to be a linear combination of the fractional contribution from each species (f) (equation 9)
 |
(9) |
where YN and YU are the amplitudes of the signals of the respective species. As described above (equations 6 and 7), the amplitudes of the native and unfolded forms of the protein are assumed to be linearly dependent on urea concentration. In the fits, four parameters were considered local parameters and were varied for each data set independently, that is YN′, YU′, mN′, and mU′.
Acknowledgments
We thank Dr. Michael Goshe for use of the HPLC system and Brett Feeney for performing the HPLC experiments. This work was supported by a grant from the National Institutes of Health (GM065970).
Article published online ahead of print. Article and publication date are at http://www.proteinscience.org/cgi/doi/10.1110/ps.041003305.
References
- Barrick, D. and Baldwin, R.L. 1993. Three-state analysis of sperm whale apomyoglobin folding. Biochemistry 32 3790–3796. [DOI] [PubMed] [Google Scholar]
- Boatright, K.M., Renatus, M., Scott, F.L., Sperandio, S., Shin, H., Pedersen, I.M., Ricci, J.-E., Edris, W.A., Sutherlin, D.P., Green, D.R., et al. 2003. A unified model for apical caspase activation. Mol. Cell 11 529–541. [DOI] [PubMed] [Google Scholar]
- Bose, K. and Clark, A.C. 2001. Dimeric procaspase-3 unfolds via a four-state equilibrium process. Biochemistry 40 14236–14242. [DOI] [PubMed] [Google Scholar]
- Bose, K., Pop, C., Feeney, B., and Clark, A.C. 2003. An uncleavable procaspase-3 mutant has a lower catalytic efficiency but an active site similar to that of mature caspase-3. Biochemistry 42 12298–12310. [DOI] [PMC free article] [PubMed] [Google Scholar]
- Brown, C.R., Hong-Brown, L.Q., and Welch, W.J. 1997. Strategies for correcting the ΔF508 CFTR protein-folding defect. J. Bioener. Biomem. 29 491–502. [DOI] [PubMed] [Google Scholar]
- Cain, K., Brown, D.G., Langlais, C., and Cohen, G.M. 1999. Caspase activation involves the formation of the aposome, a large (~700 kDa) caspase-activating complex. J. Biol. Chem. 274 22686–22692. [DOI] [PubMed] [Google Scholar]
- Chai, J., Wu, Q., Shiozaki, E., Srinivasula, S.M., Alnemri, E.S., and Shi, Y. 2001. Crystal structure of a procaspase-7 zymogen: Mechanisms of activation and substrate binding. Cell 107 399–407. [DOI] [PubMed] [Google Scholar]
- Earnshaw, W.C., Martins, L.M., and Kaufmann, S.H. 1999. Mammalian caspases: Structure, activation, substrates, and functions during apoptosis. Annu. Rev. Biochem. 68 383–424. [DOI] [PubMed] [Google Scholar]
- Fu, L. and Liang, J.J.-N. 2002. Unfolding of human lens recombinant βB2- and γ C-crystallins. J. Struc. Biol. 139 191–198. [DOI] [PubMed] [Google Scholar]
- Gottlieb, R.A., Nordberg, J., Skowronski, E., and Babior, B.M. 1996. Apoptosis induced in Jurkat cells by several agents is preceded by intracellular acidification. Proc. Nat. Acad. Sci. 93 654–658. [DOI] [PMC free article] [PubMed] [Google Scholar]
- Gu, Y., Wu, J., Faucheu, C., Lalanne, J.-L., Diu, A., Livingston, D.J., and Su, M.S.-S. 1995. Interleukin-1β converting enzyme requires oligomerization for activity of processed forms in vivo. EMBO J. 14 1923–1931. [DOI] [PMC free article] [PubMed] [Google Scholar]
- Kumar, S. 1999. Regulation of caspase activation in apoptosis: Implications in pathogenesis and treatment of disease. Clin. Exper. Pharm. Phys. 26 295–303. [DOI] [PubMed] [Google Scholar]
- Matsuyama, S., Llopis, J., Deveraux, Q.L., Tsien, R.Y., and Reed, J.C. 2000. Changes in intramitochondrial and cytosolic pH: Early events that modulate caspase activation during apoptosis. Nat. Cell Biol. 2 318–325. [DOI] [PubMed] [Google Scholar]
- Mittl, P.R.E., DiMarco, S., Krebs, J.F., Bai, X., Karanewsky, D.S., Priestle, J.P., Tomaselli, K.J., and Grutter, M.G. 1997. Structure of recombinant human CPP32 in complex with the tetrapeptide acetyl-asp-val-ala-asp fluoromethyl ketone. J. Biol. Chem. 272 6539–6547. [DOI] [PubMed] [Google Scholar]
- Myers, J.K., Pace, C.N., and Scholtz, J.M. 1995. Denaturant m values and heat capacity changes: Relation to changes in accessible surface areas of protein unfolding. Protein Sci. 4 2138–2148. [DOI] [PMC free article] [PubMed] [Google Scholar]
- Pace, C.N., Shirley, B.A., and Thomson, J.A. 1989. Measuring the conformational stability of a protein. In Protein structure and function, a practical approach. (ed. T. Creighton), pp. 311–329. IRL Press, New York.
- Pace, C.N., Laurents, D.V., and Thomson, J.A. 1990. pH dependence of the urea and guanidine hydrochloride denaturation of ribonuclease A and ribonuclease T1. Biochemistry 29 2564–2572. [DOI] [PubMed] [Google Scholar]
- Pace, C.N., Laurents, D.V., and Erickson, R.E. 1992. Urea denaturation of barnase: pH dependence and characterization of the unfolded state. Biochemistry 31 2728–2743. [DOI] [PubMed] [Google Scholar]
- Pop, C., Chen, Y.-R., Smith, B., Bose, K., Bobay, B., Tripathy, A., Franzen, S., and Clark, A.C. 2001. Removal of the pro-domain does not affect the conformation of the procaspase-3 dimer. Biochemistry 40 14224–14235. [DOI] [PubMed] [Google Scholar]
- Pop, C., Feeney, B., Tripathy, A., and Clark, A.C. 2003. Mutations in the procaspase-3 dimer interface affect the activity of the zymogen. Biochemistry 42 12311–12320. [DOI] [PMC free article] [PubMed] [Google Scholar]
- Renatus, M., Stennicke, H.R., Scott, F.L., Liddington, R.C., and Salvesen, G.S. 2001. Dimer formation drives the activation of the cell death protease caspase 9. Proc. Nat. Acad. Sci. 98 14250–14255. [DOI] [PMC free article] [PubMed] [Google Scholar]
- Riedl, S.J., Fuentes-Prior, P., Renatus, M., Kairies, N., Krapp, S., Huber, R., Salvesen, G.S., and Bode, W. 2001. Structural basis for the activation of human procaspase-7. Proc. Nat. Acad. Sci. 98 14790–14795. [DOI] [PMC free article] [PubMed] [Google Scholar]
- Rotonda, J., Nicholson, D.W., Fazil, K.M., Gallant, M., Gareau, Y., Labelle, M., Peterson, E.P., Rasper, D.M., Ruel, R., Vaillancourt, J.P., et al. 1996. The three-dimensional structure of apopain/CPP32, a key mediator of apoptosis. Nat. Struc. Biol. 3 619–625. [DOI] [PubMed] [Google Scholar]
- Roy, S., Bayly, C.I., Gareau, Y., Houtzager, V.M., Kargman, S., Keen, S.L.C., Rowland, K., Seiden, I.M., Thornberry, N.A., and Nicholson, D.W. 2001. Maintenance of caspase-3 proenzyme dormancy by an intrinsic “safety catch” regulatory tripeptide. Proc. Nat. Acad. Sci. 98 6132–6137. [DOI] [PMC free article] [PubMed] [Google Scholar]
- Royer, C.A., Mann, C.J., and Matthews, C.R. 1993. Resolution of the fluorescence equilibrium unfolding profile of trp aporepressor using single tryptophan mutants. Protein Sci. 2 1844–1852. [DOI] [PMC free article] [PubMed] [Google Scholar]
- Santoro, M.M. and Bolen, D.W. 1988. Unfolding free energy changes determined by the linear extrapolation method. 1. Unfolding of phenylmethanesulfonyl α-chymotrypsin using different denaturants. Biochemistry 27 8063–8068. [DOI] [PubMed] [Google Scholar]
- Sato, S. and Raleigh, D.P. 2002. pH-dependent stability and folding kinetics of a protein with an unusual α-β topology: The C-terminal domain of the ribosomal protein L9. J. Mol. Biol. 318 571–582. [DOI] [PubMed] [Google Scholar]
- Shi, Y. 2002. Mechanisms of caspase activation and inhibition during apoptosis. Mol. Cell 9 459–470. [DOI] [PubMed] [Google Scholar]
- Shortle, D. 1995. Staphylococcal nuclease: A showcase of m-value effects. Adv. Prot. Chem. 46 217–247. [DOI] [PubMed] [Google Scholar]
- Stennicke, H.R. and Salvesen, G.S. 1998. Properties of the caspases. Biochem. Biophys. Acta 1387 17–31. [DOI] [PubMed] [Google Scholar]
- Stennicke, H.R., Deveraux, Q.L., Humke, E.W., Reed, J.C., Dixit, V.M., and Salvesen, G.S. 1999. Caspase-9 can be activated without proteolytic processing. J. Biol. Chem. 274 8359–8362. [DOI] [PubMed] [Google Scholar]
- Van Criekinge, W., Beyaert, R., Van de Craen, M., Vandenabeele, P., Schotte, P., De Valck, D., and Fiers, W. 1996. Functional characterization of the prodomain of interleukin-1β-converting enzyme. J. Biol. Chem. 271 27245–27248. [DOI] [PubMed] [Google Scholar]
- Whitten, S.T., Wooll, J.O., Razeghifard, R., Garcia-Moreno E.B., and Hilser, V.J. 2001. The origin of pH-dependent changes in m-values for the denaturant-induced unfolding of proteins. J. Mol. Biol. 309 1165–1175. [DOI] [PubMed] [Google Scholar]