

Abstract
We report here a recombinant expression system that allows production of large quantities of Alzheimer’s Aβ(1–40) peptide. The material is competent to dissolve in water solutions with “random-coil properties,” although its conformation and factual oligomerization state are determined by the physico-chemical solution conditions. When dissolved in 50 mM sodium phosphate buffer (pH 7.4) at 37°C, the peptide is able to undergo a nucleated polymerization reaction. The aggregation profile is characteristically bipartite, consisting of lag and growth phase. From these curves we determined the lag time as well as the rate of aggregation. Both values were found to depend on peptide concentration and addition or formation of seeds. Moreover, they can vary considerably between apparently identical samples. These data imply that the nucleation event is under influence of a stochastic factor that can manifest itself in profound macroscopic differences in the aggregation kinetics of otherwise indistinguishable samples.
Keywords: amyloid, conformational disease, kinetics, protein folding, prion
Amyloid fibrils are polypeptide aggregates that encompass a specific type of β-sheet arrangement, termed cross-β (Serpell et al. 1999). This structure can be formed in the course of degenerative conditions, such as Alzheimer’s and Creutzfeldt-Jakob diseases. In the case of Alzheimer’s disease, these deposits are formed by Aβ peptide, a proteolytic fragment of the amyloid precursor protein. Aβ occurs in various isoforms that differ by the number of residues at the C-terminal end of the peptide. The 40-residue isoform, Aβ(1–40), is the most abundant Aβ species inside the cerebral cortex of Alzheimer’s patients (Mori et al. 1992). Aβ(1–42) is also characteristically associated with the disease process but is less soluble than Aβ(1–40) and forms fibrils faster (Harper and Lansbury 1997). In vitro, Aβ(1–40) is able to form fibrils of two major types, protofibrils and mature fibrils, that can be distinguished morphologically and by their formation kinetics (Caughey and Lansbury 2003). Mature fibrils are the thermodynamically most stable type of fibrils, whereas protofibrils are their metastable precursors and also involved in the disease process. In several cases, amyloidotic diseases can be propagated by the means of a transmissible species of amyloid characteristics. Examples of such behavior are the mammalian prions, such as those underlying the spongiform encephalopathies, or the amyloid enhancing factor (Prusiner 1998; Lundmark et al. 2002). In vitro, such behavior is recapitulated by the nucleated polymerization mechanism of amyloid fibril formation. This reaction consists of two subsequent processes: the initial formation of aggregation nuclei, which occurs during the lag phase, thus leading to the formation of only small quantities of aggregates, and the subsequent extension of these nuclei during the growth phase of rapid aggregation and fibril formation (Harper and Lansbury 1997; Chiti et al. 2003). The kinetics of aggregation reactions is known to depend on several factors that can both be sequence-inherent, such as secondary structural preferences, hydrophobicity, protein stability, and charges (Chiti et al. 2000, 2003), as well as arising from the physico-chemical environment or concentration (Nielsen et al. 2001; DuBay et al. 2004; Fernandez-Escamilla et al. 2004).
Here we describe a recombinant expression system that enables us to obtain large quantities of highly soluble Aβ(1–40) peptide. Using this material and techniques, including circular dichroism (CD), attenuated-total reflectance Fourier-transform infrared (ATR-FTIR), and time-resolved thioflavine-T (ThT) fluorescence spectroscopy, we found that, in addition to the factors described above, the macroscopically evident kinetic properties of these samples can be modulated also by a stochastic factor that is inherent in the concentration-dependent formation of appropriate aggregate nuclei.
Results
We have established a recombinant expression system that enables us to obtain 50–60 mg of purified Aβ(1–40) peptide from 75 g of Escherichia coli wet cell pellet, the average yield of a single fermentation run (0.4 L) (Fig. 1 ▶). Freshly dissolved in 50 mM sodium phosphate buffer (pH 7.4), the peptide shows concentration-dependent changes of the far-UV CD spectrum, indicating transitions in its secondary structure (Fig. 2A ▶). Low-concentration solutions of the peptide (below 50 μM) produce a strongly negative ellipticity reading at 200 nm, indicating the presence of a largely unfolded, presumably monomeric state with “random-coil properties” (Terzi et al. 1995; Riek et al. 2001). In contrast, concentrations of 50 μM or more produce a far-UV CD spectrum with increasingly negative ellipticity readings at 217 nm, arising from a stabilization of β-sheet structure. ATR-FTIR spectra show that highly concentrated Aβ(1–40) solutions (2 mg/mL) produce a narrow amide I main component, centered at 1628 cm−1 (Fig. 2B ▶). Both the position of this maximum and the shape of the entire amide I region support the argument that this β-sheet structure does not correspond to the native β-sheet structure of globular proteins. Instead, it resembles the β-sheets of aggregated states, such as amyloid fibrils and thermally aggregated polypeptide chains (Jackson and Mantsch 1991; Fink 1998; Zandomeneghi et al. 2004). Indeed, a very similar spectrum can be recorded on Aβ(1–40) amyloid fibrils, although electron microscopy cannot reveal significant amounts of fibrils when the peptide is freshly dissolved (data not shown). In addition, centrifugation does not precipitate these early β-sheet structures (see Fig. 3 ▶).
Figure 1.

Purification of Aβ(1–40). Coomassie-stained gel of purified Aβ(1–40); (lanes A, F) marker; (lane B) cell lysate; (lane C) crude fusion protein after NiNTA chromatography; (lane D) cleaved fusion protein; (lane E) pure Aβ(1–40).
Figure 2.

Secondary structure of recombinant Aβ(1–40). (A) Far-UV CD spectra of Aβ(1–40) dissolved at different concentrations: 4.3 μM: filled circles; 21.3 μM: open circles; 42.6 μM: filled diamonds; 85.2 μM: open diamonds; 127.8 μM: filled squares; 213 μM: open squares. (Insert) Dependence of the mean residue weight ellipticity at 217 nm on peptide concentration. (B) ATR-FTIR spectrum of freshly dissolved Aβ(1–40) at 2 mg/mL concentration (457 μM). All spectra were recorded in 50 mM sodium phosphate (pH 7.4) at room temperature.
Figure 3.

Influence of pH and aggregation on the solubility of Aβ(1–40). Filled diamonds: total peptide concentration in solution. Open diamonds: peptide in the supernatant after centrifugation of a freshly dissolved solution. Filled circles: peptide in the supernatant after centrifugation of a solution after incubation for 24 h. Open circles: peptide in the supernatant after centrifugation of a solution after addition of 5% seeds and incubation for 24 h.
Next, we examined the relationship between aggregation of Aβ(1–40) and the pH value of the solution. When working in the mildly acidic pH range (pH 4–6), and therefore in the pH range close to the theoretical isoelectric point (pIt=5.31) of Aβ(1–40), solubility is limited and precipitation is evident from the large quantities of peptide that can be removed from solution by centrifugation (Fig. 3 ▶). In contrast, with low ionic strength and pH values of 1–3 or 7–11, the solubility of the peptide is much higher. The dissolved peptide is comparatively stable, and incubation for 24 h does not decrease its solubility substantially. A more significant reduction in the solubility of the peptide can be seen upon increasing the ionic strength, for example, by addition of salts or buffers of higher concentration, such as phosphate-buffered saline (data not shown). Furthermore, addition of seeds produces, within 24 h, large quantities of aggregates that appear within two regions of the pH plot, namely, at pH values of 1.0 to 4.0 and 6.5 to 9.0 (Fig. 3 ▶). Both regions of aggregation are clearly different from the precipitation zone that is centered about the pIt value of the peptide. Hence, it is evident that these aggregates are not formed by the effect of simple peptide insolubility and precipitation but rather by conditions in which the polypeptide chain is charged and comparatively soluble.
We then monitored the time-dependent aggregation of Aβ(1–40) by using ThT fluorescence. When ThT dye binds to aggregated structures, this leads to a substantial increase in its fluorescence emission maximum at 482 nm (LeVine 1993). Consistent with this, ThT gives only a small signal when using the freshly dissolved peptide. Upon incubation, however, this signal increases substantially (Fig. 4A ▶). From curves like the one shown in Figure 4A ▶, we have extracted the rate of aggregation k, which can be obtained by fitting a single exponential to the growth phase and the lag time tl, which measures the length of the lag phase (see Fig. 4A ▶ and Materials and Methods). When we compared the individual kinetic traces from apparently identical samples that were obtained, for example, by splitting an initial stock solution into equal aliquots, we found that these samples could differ substantially in their kinetic profiles (Fig. 4B ▶), resulting also in different values for k and tl (Fig. 5A, B ▶).
Figure 4.

Kinetic evaluation of the aggregation reaction. (A) Kinetics of Aβ(1–40) aggregation. tl was determined by fitting the straight lines a to the baseline of the lag phase and b as a tangent to the steepest region of the growth phase curve (normally occurring at ~30% of the fluorescence increase reached at the end of the experiment). tl is defined as the time point where the two lines a and b intersect. To obtain k, the growth phase was fitted the function y=A+B*exp (−kx) (curve c). (B) Families of 10 kinetic traces each of solutions containing 1.0 mg/mL, 0.5 mg/mL, and 0.01 mg/mL Aβ (1–40).
Figure 5.
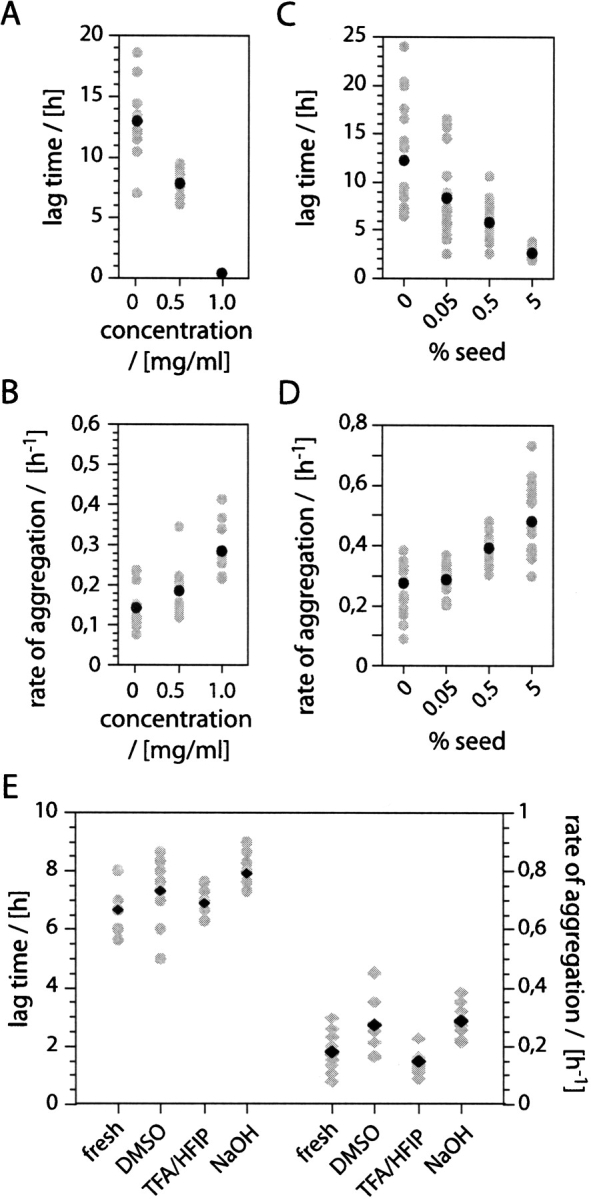
Effect of concentration and seeding on k and tl. (A) Concentration dependence of tl and tav l. tl values at 1 mg/mL solutions are approximated with 0.1 h. (B) Concentration dependence of k and kav. Dependence of tl (C) and k (D) on the seed concentration. (E) tl (crosses) and k (diamonds) of freshly dissolved recombinant Aβ (1–40) and after pre-treatment using DMSO, NaOH, or TFA/HFIP. Gray symbols: tl and k. Black symbols: tavl and kav. The panels show data from 10 (A, B, E) or 20 (C, D) individual experiments.
The first parameter extracted from these kinetic curves is the lag time tl, which reflects mainly the efficiency of the nucleation event (Hofrichter et al. 1974; Arvinte et al. 1993). Comparing tl within the series of concentrations (1.0, 0.5, and 0.01 mg/mL), we noted that the scatter of the individual tl values increases with decreasing the concentration (Fig. 5A ▶). In addition, high concentrations result in a reduction of average value of the lag time, tavl, and no lag phase could be discerned in samples with concentrations of 1 mg/mL or more (Fig. 5A ▶). The second parameter that we extracted from the kinetic curves is the rate of aggregation k (Fig. 4A ▶), which measures the efficiency of the polymerization event. Although there is a slight increase of the average value kav at higher concentrations, the scatter of the values is much less pronounced within the series of concentrations examined here (Fig. 5B ▶). The evident variability of the individual lag time measurements, representing the efficiency of the nucleation events, and their dependence on concentration suggest that the heterogeneity of the samples is inherent to the presence or formation of seeds in these solutions. Indeed, it is possible to reconstitute the effects of concentrations on the aggregation kinetics by addition of various amounts of seeds to solutions of the freshly dissolved peptide, that is, high seed concentrations raise kav and reduce tavl , along with the scatter of the individual values of tl (Fig. 5C, D ▶). Next we tested whether pre-existing seeds might account for the described effect or whether the seeds form in the course of the aggregation reaction. To that end, freshly dissolved peptide are subjected to three different protocols that were shown previously to disrupt pre-existing aggregates (Fezoui et al. 2000; Chen and Wetzel 2001; Lashuel et al. 2003). However, we found that none of these protocols affected, despite small differences, kav and tavl or the scatter of k and tl to the extent seen when varying the peptide or seed concentrations (Fig. 5E ▶). Hence, we conclude that the heterogeneity arises primarily from differences in the efficiency by which these seeds are formed.
Discussion
We report here a recombinant expression system for the production of large quantities of Alzheimer’s Aβ (1–40) peptide. The overall yield is similar to the one obtained by a biotechnological production process for the less soluble Aβ (1–42) peptide based on expression of a 13.8-kDa fusion protein (Dobeli et al. 1995). The quality of the resulting material was examined with gel electrophoresis, thin layer chromatography, mass spectrometry, thin layer and reversed phase chromatography, far-UV CD and ATR-FTIR spectroscopy, along with time-resolved ThT-fluorescence. The aggregation behavior and structural properties of the recombinant material correspond well with data described in the literature (Terzi et al. 1995). For example, Aβ (1–40) approaches a “random-coil” structure when dissolved in low ionic strength buffer (50 mM sodium phosphate at pH 7.4) and at concentrations of less than 50 μM (Fig. 2A ▶). Similar properties have been reported previously in the case of 5mM M ops buffer (pH7.4) (Terzi et al. 1995). FTIR and CD show that higher concentrations lead to a self-assembly of the peptide and aggregated β-sheets (Fig. 2 ▶). Nevertheless, these assemblies are small and cannot be precipitated by centrifugation at low speed (Fig. 3 ▶), and their ThT affinity is small (Fig. 4A ▶).
Aggregation or amyloid formation is generally known to require an appropriate environment, and the necessary properties defining such a favorable condition can differ substantially between different polypeptide chains. One of the key factors in this context is the pH value, and therefore, the peptide charge (Lopez De La Paz et al. 2002; Chiti et al. 2003). However, when comparing the various data existing in the literature, apparently conflicting interpretations can be found as to whether or not charges are required for amyloid formation or aggregation. For example, some authors report the amyloid formation is most favorable in the close proximity of the isoelectric point (Schmittschmitt and Scholtz 2003), whereas others show that a peptide charge of ±1 is most preferential (Lopez De La Paz et al. 2002). Indeed, apomyoglobin forms fibrils at pH 9.0 but not at pH 7.36, its pIt value (Fandrich et al. 2001, 2003). Moreover, the present data on Aβ(1–40) show that there is a clear difference between the formation of aggregates and simple precipitation in the proximity of the pIt. Of course, simple precipitation of insoluble polypeptides leads to turbid solutions that scatter light very strongly and thereby affect the ThT spectrum. We find here that the seeded aggregation occurs most readily in an environment, ~2–3 pH units away from the pIt of Aβ(1–40). Based on its sequence and the ionization potential of its residues, Aβ(1–40) carries a net charge of +6.74 at pH 2.5 and −2.8 at pH 7.5. These data support the view that the formation of ordered aggregates requires an aggregation process that is slow and involves the association of relatively soluble precursors.
We have analyzed the kinetics of aggregation under various conditions and identified factors acting on the average values tavl and kav as well as factors reducing or increasing the spread of the individual values k and tl. Among the properties affecting the average values tavl and kav are the peptide concentration and the addition of seeds, both of which decrease tavl and increase kav. In fact, no lag phase is seen at concentrations of 1 mg/mL after the dead time of our instrumental setup, although solutions of 0.5 mg/mL show a well-resolved lag phase. This shows that high concentrations shift the onset of the growth phase into the dead time of the experiment, thereby eliminating the possibility to observe any lag phase. Although the tl values reported here are well within the known range of values, direct comparisons are difficult because of very different experimental set-ups reported in the literature (Lomakin et al. 1997; Fezoui and Teplow 2002). In addition to its effect on the average values tavl and kav, concentration affects also the spread of the individual values of tl. At 0.01 mg/mL, tl varies between 7.0 and 19.0 h, that is, by values that exceed the uncertainty of the measurements. Furthermore, we obtain a Gaussian distribution in the scattering of the data when we compare the spread of data points from at least 20 traces (data not shown). This suggests that the encountered heterogeneity reflects real and stochastic differences between individual samples. The spread of tl increases with smaller peptide concentrations and longer tavl values, whereas it is reduced if preformed seeds are added to the solutions. In addition, we noted that the variability is also affected by mutation in that Aβ variants that have a very high tavl value show also the greatest diversity of the individual tl values (T. Christopeit and M. Fändrich, unpubl.). While the presence of pre-existing aggregates cannot sufficiently explain these phenomena (Fig. 5E ▶), we found that addition of preformed aggregates to solutions of the freshly dissolved peptide potently reduces this heterogeneity (Fig. 5C, D ▶), in a manner that is similar to raising the concentration (Fig. 5A, B ▶).
These data show that the nucleation-limited aggregation of Aβ(1–40) peptide is controlled by a stochastic factor inherent in the nucleation process that can lead to substantial macroscopic heterogeneity and perhaps to aggregates or nuclei of significantly different structure. As the experimental analysis of polypeptide aggregation approaches higher resolutions and the molecular level, evidence is accumulating from several groups that heterogeneity is, at a microscopic level, a major issue characterizing these aggregation processes. For example, it is well established that the products of aggregation reactions can have, in the case of Aβ(1–40) or other polypeptide chains, very different structure, including fibrils, protofibrils, and differently sized oligomers (Caughey and Lansbury 2003). Even individual types of aggregates, such as mature fibrils, can vary substantially with respect to their morphology (Jimenez et al. 1999; Petkova et al. 2005). On the other hand, molecular dynamics simulations of the early steps of aggregation provide evidence that the associating and initially monomeric polypeptide chains can sample and stabilize early aggregates of considerably different structure (Gsponer et al. 2003). This is consistent with the view that the fibril precursors arise from predominantly unfolded polypeptide chains (Fandrich et al. 2003) that have considerable conformational flexibility, thereby enabling the formation of very different conformational arrangements.
Taken together, we conclude that the substantial and peptide concentration-dependent variation of the kinetic traces reported above are evidence for a stochastic process that underlies the critical step of nucleation and that the overall reaction becomes progressively homogeneous as the concentration is raised, thus favoring intermolecular association. It is of note that seeding phenomena underlie also clinical conditions of amyloid formation, such as those occurring associated with “prions” or “amyloid enhancing factors” (Prusiner 1998; Lundmark et al. 2002). The present observation of heterogeneity in the efficiency of the nucleation event suggests, therefore, a possible explanation for the clinically verified differences in the onset of amyloidotic processes between individuals with apparently identical genetic background.
Materials and methods
Cloning, expression, and purification of Aβ(1–40)
A synthetic gene coding for the human Aβ(1–40) peptide with an extended N terminus including a polyhistidine-tag and a cleavage site for tobacco etch virus (TEV) nuclear inclusion Ia protease was synthesized and cloned in frame with the 5′-end of the gene of the maltose-binding protein (New England Biolabs). For generation of wild-type Aβ(1–40) peptide, the Gly residue in the P1′ position of the canonical TEV protease recognition site (ENLYFQ/G) was replaced by the N-terminal Asp residue of Aβ(1–40) (Kapust et al. 2002). The fusion protein was expressed according to published procedures (Riesenberg et al. 1991) using a 0.4-L Sixfors multifermenter unit (Infors) and isopropylthio-β-D-galactoside induction. Cells were harvested by centrifugation at 15,000g and frozen at −70°C. Then 30 g of frozen cells was resuspended in 300 mL of ice-cold lysis buffer (20 mM Tris/HCl, 0.15 M NaCl, 1 mM phenylmethylsulfonyl fluoride at pH 8.0), and the resulting suspension was homogenized by two passages through a Emulsiflex C5 high pressure homogenizer (Avestin Inc.) using a pressure of 1000 bar. Insoluble material was removed by centrifugation in a Sorvall F28/50 rotor at 4°C for 20 min and 48,000g. Supernatant was further clarified by filtration through a 1.2-μm membrane and diluted with lysis buffer to a total volume of 750 mL. Fusion protein was isolated using a Ni-NTA Superflow (QIAGEN) column and digested over-night by addition of 4 μg of TEV-protease per milligram of fusion protein at room temperature. (His)6-tagged maltose-binding protein was removed by Ni-NTA chromatography, and Aβ(1–40) was further purified using a Resource 15 RPC column. Fractions containing Aβ(1–40) peptide were identified on a 4%–12% BisTris NuPAGE SDS-gel (Invitrogen), lyophilized, and stored at −20°C. Based on the UV-trace after reversed-phase HPLC, the purity of the peptide was better than 95%. Quantitative thin-layer chromatography shows that 1 mg of dry peptide contains <0.01% (<100 ng) lipids. The identity of the peptide was verified by mass spectrometry (theoretical mass: 4329.8 Da, experimental mass: 4329.7 ± 0.2 Da) and N-terminal sequencing. When applying the same run conditions, recombinant Aβ(1–40) elutes from an analytical Resource 15 RPC column at the same position as commercial Aβ(1–40) peptide (Bachem).
Circular dichroism (CD) and Fourier-transform infrared (ATR-FTIR) spectroscopy
All CD spectra were recorded on a JASCO J-720 spectro-polarimeter using quartz cells (Hellma) of 1.0 or 10 mm path length that were optimized for polarimetrical measurements. Peptide concentrations were determined using the Coomassie Plus kit (Pierce). All spectra were measured within 2 h after the dissolution of the peptide and represent the averages of 10 scans after buffer subtraction. FTIR spectra were recorded using a Bruker Tensor-27 Infrared spectrometer equipped with a BIO-ATR-II cell and a photovoltaic LN-MCT detector cooled with liquid nitrogen. All spectra were recorded using a spectral resolution of 4 cm−1 and an aperture of 6 mm. The spectra were processed by apodization (Blackman-Harris 3-term) and double zero filling. The final spectra represent averages of 40 scans after buffer subtraction.
Solubility test of Aβ(1–40)
Buffers of 0.1 M concentration were prepared from sodium phosphate (pH 1.0, 2.0, 3.0), sodium acetate (3.5, 4.0, 4.5, 5.0, 5.5), sodium phosphate (6.0, 6.5, 7.0, 7.5, 8.0), sodium borate (8.5, 9.0, 9.5, 10.0), and sodium phosphate (11.0) without correcting for differences in the ionic strength. These were mixed 1:1 with a stock solution of Aβ(1–40) that was prepared by dissolving ~2 mg of peptide in 1 mL of water. Each peptide solution was divided into four equal aliquots, termed here A, B, C, and D. Aliquot A was flash-frozen in liquid nitrogen to determine the total peptide concentration in solution. Aliquot B was centrifuged for 30 min at 14,000 rpm in an Eppendorf tabletop centrifuge. The top 40% of the supernatant was taken off and flash-frozen for peptide quantification. Aliquot C was incubated for 24 h at 20°C. Aliquot D was incubated for 24 h at 20°C after addition of Aβ(1–40) amyloid fibrils, corresponding to 5% of the total peptide concentration. Afterward, solutions C and D were centrifuged, and the supernatant was taken off and flash-frozen. The peptide concentrations of all solutions were determined using 96-well plates, the Micro-BCA assay (Pierce), and a SpectraMax 250 reader (Molecular Devices). Calculation of the theoretical charge of the peptide was done using the EMBOSS package.
Kinetic analysis using thioflavin-T fluorescence
Data were recorded using a BMG FLUOstar Galaxy reader (BMG) and 96-well blackwall plates (Nunc) sealed with a ThinSeal film (Excel Scientific). Data points were recorded in cycles using the top reading mode. A single cycle consisted of an initial interval followed by 10 sec of orbital shaking (width 5 mm) and the fluorescence measurement, representing the average from 10 flashes. Unless reported otherwise, the data points had a pitch of 15 min. The dye was excited at 450 nm, and the fluorescence signal was recorded at 490 nm. All kinetic measurements were carried out in 50 mM sodium phosphate buffer (pH 7.4) at 37°C. Samples had a volume of 100 μL containing 20 μM thioflavin-T dye. The peptide was dissolved as a stock solution that had at least twice the concentration used for final measurement. This solution was passed through a 0.22-μm acetate PLUS filter (Roth), and the concentration was adjusted to precisely twice the value used for measurement. The filtered solution was then diluted 1:2 within the wells of the plate by mixture with the ThT-stock solution.
Aβ(1–40) was disaggregated using three established methods (Fezoui et al. 2000; Chen and Wetzel 2001; Lashuel et al. 2003). In case of the dimethylsulfoxide (DMSO) method, 1 mg of Aβ(1–40) was dissolved in 50 μL of DMSO and diluted 1:20 into buffer. In case of the trifluoro-acetic acid/1,1,1,3,3,3-hexafluor-2-propanol (TFA/HFIP) method, 1 mg of Aβ(1–40) was dissolved in 2 mL of a 1:1 (v/v) mixture TFA and HFIP. After incubation for 4 h at room temperature, the solvent was evaporated under a steady steam of nitrogen. The dry peptide was redissolved in analysis buffer. In the case of the NaOH method, 1 mg of peptide was dissolved in 1 mL of a 2 mM NaOH solution. After readjustment of the pH to a value of 10.5 using a 0.1 M NaOH solution, the solution was sonicated for 1 min and lyophilized. The dry peptide was redissolved in analysis buffer. All stock solutions were passed through a 0.22 μm acetate PLUS filter, and the concentration was adjusted to precisely twice the value used for measurement. The filtered solution was then diluted 1:2 within the wells of the plate by mixture with the ThT-stock solution. The dead time of the kinetic experiments was 20 min from dissolution of the lyophilized peptide to the acquisition of the first data point.
From the resulting curves we extracted the value of the lag time and the rate of aggregation. The lag time was obtained by fitting a straight line to the initial slope of the growth phase (see Fig. 4A ▶, line b). The time point of its intersection with the baseline (see Fig. 4A ▶, line a) was taken as the lag time. Fits of the aggregation rates were carried out using only the part of the curve corresponding to the growth phase and assuming an exponential growth with the formula y=A+B* exp(−kx) (Chiti et al. 2002). The value of k was taken as the rate of aggregation.
Acknowledgments
This work was supported by a grant from the Deutsche Forschungsgemeinschaft (DFG). M.F. acknowledges a BioFuture grant from the Bundesministerium für Bildung und Forschung (BMBF). The authors thank Astrid Tannert and Sylke Fricke for carrying out the lipid analysis and technical assistance.
Conflict of interest The authors claim a conflict of interest arising from a commercial partner that precludes free distribution of any DNA constructs described here. Basic vectors are available from commercial vendors as described.
Article published online ahead of print. Article and publication date are at http://www.proteinscience.org/cgi/doi/10.1110/ps.041266605.
References
- Arvinte, T., Cudd, A., and Drake, A.F. 1993. The structure and mechanism of formation of human calcitonin fibrils. J. Biol. Chem. 268 6415–6422. [PubMed] [Google Scholar]
- Caughey, B. and Lansbury, P.T. 2003. Protofibrils, pores, fibrils, and neurodegeneration: Separating the responsible protein aggregates from the innocent bystanders. Annu. Rev. Neurosci. 26 267–298. [DOI] [PubMed] [Google Scholar]
- Chen, S. and Wetzel, R. 2001. Solubilization and disaggregation of polyglutamine peptides. Protein Sci. 10 887–891. [DOI] [PMC free article] [PubMed] [Google Scholar]
- Chiti, F., Taddei, N., Bucciantini, M., White, P., Ramponi, G., and Dobson, C.M. 2000. Mutational analysis of the propensity for amyloid formation by a globular protein. EMBO J. 19 1441–1449. [DOI] [PMC free article] [PubMed] [Google Scholar]
- Chiti, F., Taddei, N., Baroni, F., Capanni, C., Stefani, M., Ramponi, G., and Dobson, C.M. 2002. Kinetic partitioning of protein folding and aggregation. Nat. Struct. Biol. 9 137–143. [DOI] [PubMed] [Google Scholar]
- Chiti, F., Stefani, M., Taddei, N., Ramponi, G., and Dobson, C.M. 2003. Rationalization of the effects of mutations on peptide and protein aggregation rates. Nature 424 805–808. [DOI] [PubMed] [Google Scholar]
- Dobeli, H., Draeger, N., Huber, G., Jakob, P., Schmidt, D., Seilheimer, B., Stuber, D., Wipf, B., and Zulauf, M. 1995. A biotechnological method provides access to aggregation competent monomeric Alzheimer’s 1–42 residue amyloid peptide. Biotechnology (NY) 13 988–993. [DOI] [PubMed] [Google Scholar]
- DuBay, K.F., Pawar, A.P., Chiti, F., Zurdo, J., Dobson, C.M., and Vendruscolo, M. 2004. Prediction of the absolute aggregation rates of amyloidogenic polypeptide chains. J. Mol. Biol. 341 1317–1326. [DOI] [PubMed] [Google Scholar]
- Fandrich, M., Fletcher, M.A., and Dobson, C.M. 2001. Amyloid fibrils from muscle myoglobin. Nature 410 165–166. [DOI] [PubMed] [Google Scholar]
- Fandrich, M., Forge, V., Buder, K., Kittler, M., Dobson, C.M., and Diekmann, S. 2003. Myoglobin forms amyloid fibrils by association of unfolded polypeptide segments. Proc. Natl. Acad. Sci. 100 15463–15468. [DOI] [PMC free article] [PubMed] [Google Scholar]
- Fernandez-Escamilla, A.M., Rousseau, F., Schymkowitz, J., and Serrano, L. 2004. Prediction of sequence-dependent and mutational effects on the aggregation of peptides and proteins. Nat. Biotechnol. 22 1302–1306. [DOI] [PubMed] [Google Scholar]
- Fezoui, Y. and Teplow, D.B. 2002. Kinetic studies of amyloid β-protein fibril assembly. Differential effects of a-helix stabilization. J. Biol. Chem. 277 36948–36954. [DOI] [PubMed] [Google Scholar]
- Fezoui, Y., Hartley, D.M., Harper, J.D., Khurana, R., Walsh, D.M., Condron, M.M., Selkoe, D.J., Lansbury Jr., P.T., Fink, A.L., and Teplow, D.B. 2000. An improved method of preparing the amyloid β-protein for fibrillogenesis and neurotoxicity experiments. Amyloid 7 166–178. [DOI] [PubMed] [Google Scholar]
- Fink, A.L. 1998. Protein aggregation: Folding aggregates, inclusion bodies and amyloid. Fold. Des. 3 R9–R23. [DOI] [PubMed] [Google Scholar]
- Gsponer, J., Haberthur, U., and Caflisch, A. 2003. The role of side-chain interactions in the early steps of aggregation: Molecular dynamics simulations of an amyloid-forming peptide from the yeast prion Sup35. Proc. Natl. Acad. Sci. 100 5154–5159. [DOI] [PMC free article] [PubMed] [Google Scholar]
- Harper, J.D. and Lansbury Jr., P.T. 1997. Models of amyloid seeding in Alzheimer’s disease and scrapie: Mechanistic truths and physiological consequences of the time-dependent solubility of amyloid proteins. Annu. Rev. Biochem. 66 385–407. [DOI] [PubMed] [Google Scholar]
- Hofrichter, J., Ross, P.D., and Eaton, W.A. 1974. Kinetics and mechanism of deoxyhemoglobin S gelation: A new approach to understanding sickle cell disease. Proc. Natl. Acad. Sci. 71 4864–4868. [DOI] [PMC free article] [PubMed] [Google Scholar]
- Jackson, M. and Mantsch, H.H. 1991. Protein secondary structure from FT-IR spectroscopy: Correlation with dihedral angles from three-dimensional Ramachandran plots. Can. J. Chem. 69 1639–1642. [Google Scholar]
- Jimenez, J.L., Guijarro, J.I., Orlova, E., Zurdo, J., Dobson, C.M., Sunde, M., and Saibil, H.R. 1999. Cryo-electron microscopy structure of an SH3 amyloid fibril and model of the molecular packing. EMBO J. 18 815–821. [DOI] [PMC free article] [PubMed] [Google Scholar]
- Kapust, R.B., Tozser, J., Copeland, T.D., and Waugh, D.S. 2002. The P1′ specificity of tobacco etch virus protease. Biochem. Biophys. Res. Commun. 294 949–955. [DOI] [PubMed] [Google Scholar]
- Lashuel, H.A., Hartley, D.M., Petre, B.M., Wall, J.S., Simon, M.N., Walz, T., and Lansbury Jr., P.T. 2003. Mixtures of wild-type and a pathogenic (E22G) form of Aβ40 in vitro accumulate protofibrils, including amyloid pores. J. Mol. Biol. 332 795–808. [DOI] [PubMed] [Google Scholar]
- LeVine III, H. 1993. Thioflavine T interaction with synthetic Alzheimer’s disease β-amyloid peptides: Detection of amyloid aggregation in solution. Protein Sci. 2 404–410. [DOI] [PMC free article] [PubMed] [Google Scholar]
- Lomakin, A., Teplow, D.B., Kirschner, D.A., and Benedek, G.B. 1997. Kinetic theory of fibrillogenesis of amyloid β-protein. Proc. Natl. Acad. Sci. 94 7942–7947. [DOI] [PMC free article] [PubMed] [Google Scholar]
- Lopez De La Paz, M., Goldie, K., Zurdo, J., Lacroix, E., Dobson, C.M., Hoenger, A., and Serrano, L. 2002. De novo designed peptide-based amyloid fibrils. Proc. Natl. Acad. Sci. 99 16052–16057. [DOI] [PMC free article] [PubMed] [Google Scholar]
- Lundmark, K., Westermark, G.T., Nystrom, S., Murphy, C.L., Solomon, A., and Westermark, P. 2002. Transmissibility of systemic amyloidosis by a prion-like mechanism. Proc. Natl. Acad. Sci. 99 6979–6984. [DOI] [PMC free article] [PubMed] [Google Scholar]
- Mori, H., Takio, K., Ogawara, M., and Selkoe, D.J. 1992. Mass spectrometry of purified amyloid β protein in Alzheimer’s disease. J. Biol. Chem. 267 17082–17086. [PubMed] [Google Scholar]
- Nielsen, L., Khurana, R., Coats, A., Frokjaer, S., Brange, J., Vyas, S., Uversky, V.N., and Fink, A.L. 2001. Effect of environmental factors on the kinetics of insulin fibril formation: Elucidation of the molecular mechanism. Biochemistry 40 6036–6046. [DOI] [PubMed] [Google Scholar]
- Petkova, A.T., Leapman, R.D., Guo, Z., Yau, W.M., Mattson, M.P., and Tycko, R. 2005. Self-propagating, molecular-level polymorphism in Alzheimer’s β-amyloid fibrils. Science 307 262–265. [DOI] [PubMed] [Google Scholar]
- Prusiner, S.B. 1998. Prions. Proc. Natl. Acad. Sci. 95 13363–13383. [DOI] [PMC free article] [PubMed] [Google Scholar]
- Riek, R., Guntert, P., Dobeli, H., Wipf, B., and Wuthrich, K. 2001. NMR studies in aqueous solution fail to identify significant conformational differences between the monomeric forms of two Alzheimer peptides with widely different plaque-competence, A β(1–40)(ox) and A β(1–42)(ox). Eur. J. Biochem. 268 5930–5936. [DOI] [PubMed] [Google Scholar]
- Riesenberg, D., Schulz, V., Knorre, W.A., Pohl, H.D., Korz, D., Sanders, E.A., Ross, A., and Deckwer, W.D. 1991. High cell density cultivation of Escherichia coli at controlled specific growth rate. J. Biotechnol. 20 17–27. [DOI] [PubMed] [Google Scholar]
- Schmittschmitt, J.P. and Scholtz, J.M. 2003. The role of protein stability, solubility, and net charge in amyloid fibril formation. Protein Sci. 12 2374–2378. [DOI] [PMC free article] [PubMed] [Google Scholar]
- Serpell, L.C., Fraser, P.E., and Sunde, M. 1999. X-Ray fiber diffraction of amyloid fibrils. Methods Enzymol. 309 526–536. [DOI] [PubMed] [Google Scholar]
- Terzi, E., Holzemann, G., and Seelig, J. 1995. Self-association of β-amyloid peptide (1–40) in solution and binding to lipid membranes. J. Mol. Biol. 252 633–642. [DOI] [PubMed] [Google Scholar]
- Zandomeneghi, G., Krebs, M.R., McCammon, M.G., and Fandrich, M. 2004. FTIR reveals structural differences between native β-sheet proteins and amyloid fibrils. Protein Sci. 13 3314–3321. [DOI] [PMC free article] [PubMed] [Google Scholar]