

Abstract
The structural biology of proteins mediating iron-sulfur (Fe-S) cluster assembly is central for understanding several important biological processes. Here we present the NMR structure of the 16-kDa protein YgdK from Escherichia coli, which shares 35% sequence identity with the E. coli protein SufE. The SufE X-ray crystal structure was solved in parallel with the YdgK NMR structure in the Northeast Structural Genomics (NESG) consortium. Both proteins are (1) key components for Fe-S metabolism, (2) exhibit the same distinct fold, and (3) belong to a family of at least 70 prokaryotic and eukaryotic sequence homologs. Accurate homology models were calculated for the YgdK/SufE family based on YgdK NMR and SufE crystal structure. Both structural templates contributed equally, exemplifying synergy of NMR and X-ray crystallography. SufE acts as an enhancer of the cysteine desulfurase activity of SufS by SufE–SufS complex formation. A homology model of CsdA, a desulfurase encoded in the same operon as YgdK, was modeled using the X-ray structure of SufS as a template. Protein surface and electrostatic complementarities strongly suggest that YgdK and CsdA likewise form a functional two-component desulfurase complex. Moreover, structural features of YgdK and SufS, which can be linked to their interaction with desulfurases, are conserved in all homology models. It thus appears very likely that all members of the YgdK/SufE family act as enhancers of Suf-S-like desulfurases. The present study exemplifies that “refined” selection of two (or more) targets enables high-quality homology modeling of large protein families.
Keywords: YgdK, SufE, IscU, Fe-S cluster, NMR, homology modeling
The Escherichia coli protein YgdK is a sequence homolog of the E. coli protein SufE, whose function as an enhancer of cysteine desulfurase activity in the primary E. coli Fe-S cluster assembly pathway has recently been demonstrated (Loiseau et al. 2003; Ollagnier-de-Choudens et al. 2003; Outten et al. 2003). Cysteine desulfurases are pyridoxal 5′-phosphate (PLP)-dependent homodimeric enzymes that catalyze the conversion of L-cysteine to L-alanine and sulfane sulfur via the formation of a protein-bound cysteine persulfide intermediate on a conserved cysteine residue (Mihara and Esaki 2002). Cysteine desulfurases mobilize sulfur for biosynthesis, e.g., for Fe-S cluster assembly or thionucleoside biosynthesis (Mihara and Esaki 2002), and are found in almost all living organisms. However, the mechanisms for sulfur mobilization mediated by cysteine desulfurases are still unclear. The Gram-negative bacterium E. coli possesses three cysteine desulfurases, i.e., IscS, CsdA, and SufS (also known as CsdB), which also have significant sequence similarity with the Azotobacter vinelandii NifS desulfurase functioning in the process of nitrogen fixation. The genes encoding these enzymes are located at different loci and are coexpressed with different sets of accessory proteins.
Expression of bacterial cysteine desulfurases is generally regulated by operons that also control expression of several functionally related proteins. For example, the suf operon contains six genes encoding the proteins SufA, SufB, SufC, SufD, SufS, and SufE, while IscS is part of the similar Isc operon encoding “housekeeping” proteins required for Fe-S cluster biosynthesis. IscS interacts with IscU, a Zn-binding protein (Ramelot et al. 2004) also coded for by the Isc operon. IscU is proposed to function as a scaffold for the assembly of iron-sulfur clusters, whereby a sulfur atom is transferred from L-cysteine via IscS to IscU. Although sharing <10% sequence identity, the similarity of three-dimensional structure, surface features, and regulatory control suggests that IscU and SufE are homologous desulfurase enhancers, interacting with IscS and SufS, respectively (Goldsmith-Fischmann et al. 2004; Ramelot et al. 2004). CsdA and SufS share 45% sequence identity, but both exhibit 24% or less identity with NifS or IscS. Recently, it was shown that SufS and SufE, as well as IscS and IscU, form complexes, thus providing examples of two-component cysteine desulfurase enzymes (Smith et al. 2001; Urbina et al. 2001; Loiseau et al. 2003; Ollagnier-de-Choudens et al. 2003; Outten et al. 2003). The operon containing the gene of CsdA also encodes YgdK directly downstream of CsdA. Given the sequence homology between YgdK and SufE and between CsdA and SufS, it thus appeared quite likely that CsdA and YgdK form a complex similar to that formed by SufS and SufE.
YgdK and SufS share 35% sequence identity and were chosen for parallel structure determination by the Northeast Structural Genomics consortium (NESG) (http://www.nesg.org; target IDs ER75 for YgdK and ER30 for SufS). (Notably, IscU was also selected as a target protein by NESG (target ID IR24; Protein Data Bank [PDB] IDs 1Q48, 1R9P [Ramelot et al. 2004].) One goal of the Protein Structure Initiative (http:// www.nigms.nih.gov/psi) is to experimentally solve at least one representative protein structure for each domain of several hundred domain sequence families. These structures serve as “structural templates” to homology-model the structures of other family members (Marti-Renom et al. 2000). The “leverage value” of a given structural template is estimated by assessing both the number of structures that can be modeled and the resulting quality of the models. Although results from the recent Critical Assessment of Protein Structure Prediction (CASP5) experiment suggest that sequence identity between target and template is not always a reliable indicator of the quality of a homology model (Tramontano and Morea 2003), it is generally acknowledged that the accuracy of a homology model scales with the sequence identity between modeled and template protein (Fiser et al. 2000). A recent study based on the Swiss-Model homology modeling server illustrates this point (Schwede et al. 2000). SwissModel was used to construct a set of 1200 “control” models, i.e., models for sequences with known structure based on templates with which they share between 25% and 95% identity. As expected, models based on alignments of higher sequence identity were structurally more similar to the actual structures than models based on alignments of lower sequence identity. For example, the percentage of models whose Cα atom coordinates were “within” an RMSD value of 2 Å to the experimentally determined structure was, respectively, 18% and 55% for sets with target-template sequence identities of 30%–39% and 50%–59% (Schwede et al. 2000).
Larger families of sequence homologs exhibit a larger range of sequence identity to the representative experimental template. For this reason, it is often necessary to select two (or more) experimental structures to obtain high-quality models for all members, especially when structural diversity is expected among the family members based on an examination of their sequences and secondary structure predictions. If the targets are selected judiciously, these multiple structures can provide a larger number of family members whose structures can be (more) accurately modeled. Iterative selection of multiple targets within a domain family, so as to provide proper coverage of the entire domain family, is a basic component of the target selection strategy of the NESG consortium (Liu and Rost 2002; Liu et al. 2004; Wunderlich et al. 2004). In the present study, we examine the coverage of sequence space by the structures of YgdK (147 residues) and SufE (138 residues), which belong to NESG consortium target cluster 8976 (http://www.nesg.org).
Here we report (1) the high-quality NMR solution structure of YgdK (PDB ID 1NI7), (2) its comparison with the 2.0 Å X-ray crystal structure of SufE (PDB ID 1MZG) that was solved in parallel by Goldsmith-Fischmann et al. (2004), and (3) a thorough search for other structurally similar proteins in the PDB. High-quality homology models were then calculated for 68 out of a family of 70 sequence homologs comprising YgdK and SufE (the “YdgK/SufE” family), and a “leverage analysis” is presented. In conjunction with a homology model for CsdA, which was derived from the crystal structure of SufS, the conservation of structural motifs in the set of homology models allowed us also to identify key features for the putative YgdK–CsdA complex formation. The modeling yields novel insights into the structural biology of two-component desulfurases involved in Fe-S cluster assembly.
Results and Discussion
Resonance assignments
The approximate isotropic overall rotational correlation time for protein YdgK was inferred from 15N T1/T1ρ nuclear spin relaxation time ratios (Szyperski et al. 2002). In agreement with a molecular mass of 16 kDa, a value of ~8.5 nsec was obtained, which shows that YgdK is monomeric in solution. This enabled collection of high-quality NMR spectra.
Following the protocol described previously (Szyperski et al. 2002), reduced-dimensionality (RD) 13C/15N/1H triple resonance NMR spectroscopy, complemented by heteronuclear resolved [1H,1H]-NOESY (Cavanagh et al. 1996), was used for the resonance assignment of 13C/15N- and 15N-labeled YgdK. Complete assignments were obtained for backbone and 13Cα chemical shifts (excluding the “His tag”) with the sole exception of (1) the 13C′ resonances of the residues that precede Pro, and Met 1, Thr 2, and Gly 85; and (2) the backbone amide resonances of Met 1, Thr 2, Asn 3, and Arg 86. Notably, the detection of strong sequential dαδ or dNδ NOEs showed that all prolyl residues (4, 10, 26, 45, 112) adopt a trans-conformation (Wüthrich 1986). Complete assignments were also obtained for (1) the aliphatic side-chain resonances, except those of Met 1 and Thr 2; (2) all aromatic side-chain resonances (except for Hζ of Phe 6, 11, 79, and Hɛ1 of His 78); and (3) all side-chain amide groups of Asn and Gln residues. Furthermore, the HNɛ of five Arg residues (21, 35, 64, 86, 89) as well as the hydroxyl protons of three Thr residues (13, 97, 144) and two Ser residues (83, 137) could be assigned. Overall, 98% and 97% of the, respectively, routinely assigned backbone and side-chain shifts (see Table 1 footnote) were obtained and deposited in the BioMagResBank (accession code 5630).
Table 1.
Statistics of YgdK NMR structure determination
| Completeness of resonance assignments (%) | |
| Backbonea | 98% |
| Side chainsb | 97% |
| Stereospecific assignmentsc | |
| αCH2 of glycines | 83% |
| βCH2 | 70% |
| Val and Leu isopropyl groups | 80% |
| Conformationally restricting distance constraints | |
| Intraresidue | 571 |
| Sequential | 701 |
| Medium range | 665 |
| Long range | 623 |
| Total | 2560 |
| Dihedral angle constraints | |
| φ | 213 |
| ψ | 102 |
| Number of constraints per residue | 19.6 |
| Number of long-range constraints per residue | 4.2 |
| DYANA target function (Å2) | 0.67 ± 0.09 |
| Average RMSD to the mean DYANA coordinates (Å) | |
| Regular secondary structure elements, backbone heavy atoms | 0.53 ± 0.08 |
| Regular secondary structure, all heavy atoms | 0.88 ± 0.08 |
| Residues 7–147, backbone heavy atoms N, Cα, C′ | 0.72 ± 0.12 |
| Residues 7–147, all heavy atoms | 1.13 ± 0.12 |
| Heavy atoms of molecular cored | 0.85 ± 0.08 |
| Ramachandran plot summary for residues 7–147 (%) | |
| Most favorable regions | 83 |
| Additionally allowed regions | 16 |
| Generously allowed regions | 1 |
| Disallowed regions | 0 |
| Average number of distance constraint violation per DYANA conformer (Å) | |
| 0.2–0.5 | 0.7 |
| >0.5 | 0 |
| Average number of dihedral angle constraint violations per DYANA conformer (degrees) | |
| 0–10 | 0.1 |
| >10 | 0 |
a The N-terminal NH3+, Pro N, and carbonyl C′ before Pro residues were not considered to calculate the fraction.
b LYS NH3+, Arg NH2, side-chain carbonyl, and aromatic quaternary carbons were not considered to calculate the fraction.
c Relative to pairs with nondegenerate chemical shifts.
d Includes 47 residues: residues 10, 11, 15, 16, 17, 20, 24, 27, 30, 37, 40, 44, 47, 55, 58, 65, 66, 67, 79, 80, 87, 88, 91, 92, 93, 94, 95, 96, 97, 98, 99, 104, 105, 107, 112, 113, 115, 116, 119, 121, 125, 133, 136, 140, 141, 144, 147.
Structure determination of YgdK
A total of 2560 conformationally constraining NOE distance constraints were derived from 3D 15N- and 13C-resolved [1H,1H]-NOESY. In addition, 3JHNα scalar couplings measured in 3D HNNHA (Vuister and Bax 1993) yielded 110 φ-angle constraints, and 206 backbone dihedral angle constraints were derived from chemical shifts as described using the program TALOS (Cornilescu et al. 1999). Using the FOUND and GLOMSA modules of the program DYANA (Güntert et al. 1997), this set of experimental constraints provided stereospecific assignments (Table 1) for 10 Gly α-methylene proton pairs (83% of the pairs with nondegenerate chemical shifts), 52 β-methylene proton pairs (70% of the pairs with nondegenerated shifts), 19 more peripheral methylene proton pairs, and 20 isopropyl groups (the seven Val residues and 13 of the 21 Leu residues, i.e., 80%of the isopropyl methyl groups with nondegenerate chemical shifts).
An illustration of the quality of the YgdK structure is afforded by Figure 1a ▶, which shows the polypeptide backbone of the 20 DYANA conformers selected to represent the solution structure after superposition of the backbone heavy atoms of the regular secondary structure elements. The small size and number of residual constraint violations show that the constraints are well satisfied in the set of 20 conformers (Table 1), and average RMSD values relative to the mean coordinates of 20 DYANA conformers of 0.72 Å for the backbone and of 1.13 Å for all heavy atoms are indicative of a high-quality NMR solution structure. Moreover, plots of local backbone RMSD values and global backbone displacements versus the sequence (Fig. 2a ▶) show that all regular secondary structure elements are very well defined. Increased local disorder is observed only for the N-terminal hexapeptide segment, and the loop regions comprising residues 59–62 and 122–125. Comparison of RMSD values and displacements shows that these loops exhibit both local and global disorder. The coordinates of the YgdK NMR structure have been deposited in the P DB (ID 1NI7).
Figure 1.

(a) Stereo view of the backbone of the 20 DYANA conformers representing the NMR solution structure of YgdK structure, after superposition of the backbone heavy atoms N, Cα, and C′ of the regular secondary structure elements for minimal RMSD. The polypeptide chain termini, the α-helices (I–VI, and II′), and the β-strands (A, B, and C) are indicated (see also Fig. 3 ▶). α-Helix I, residues 17–25; α-helix II, 30–44; α-helix II′, 48–55; α-helix III, 86–99; α-helix IV, 104–110; α-helix V, 112–120; α-helix VI, 127–147; β-strand A, 56–58; β-strand B, 65–68; β-strand C, 80–83. (b) Arrangement of regular secondary-structure elements identified for YgdK. The start and the end of the regular secondary-structure elements and the polypeptide chain ends are marked with their sequence location.
Figure 2.

(a) Plots vs. the amino acid sequence of the mean global backbone displacements per residue, Dglobbb (diamond), and the mean local RMSD, RMSDlocbb (square), of the 20 DYANA conformers relative to the mean NMR structure calculated after superposition of the backbone heavy atoms N, Cα, and C′ of the regular secondary structures for the minimal RMSD. The local RMSD values are calculated for the tripeptide segments and plotted at the position of the central residue. (b) Relative displacements for the NMR structure of YgdK structure (square) and X-ray crystal structure SufE (diamond) calculated as described in Billeter (1992). For the NMR structure, the relative displacement, Dr(NMR), was calculated according to Dr(NMR) = (D − 〈D〉)/ΔD, where 〈D〉 and ΔD are, respectively, the average displacement and standard deviation of displacement of each residue after superposition of the backbone heavy atoms N, Cα, and C′ for minimal RMSD. For the X-ray crystal structure, the relative displacement, Dr(X-ray), was calculated according to Dr(X-ray) = (√B– − 〈√B–〉)/ΔB–, where 〈√B–〉 and Δ√B− are, respectively, the average and standard deviation of the square root of crystallographic B-factors of the backbone heavy atoms of a given residue.
The high quality of the YgdK structure is further evidenced by (1) the large fraction of stereospecific assignments that have been obtained for the β-methylene and the Val and Leu isopropyl moieties (Table 1); (2) the fact that 83% of all φ and ψ dihedral angles are located in the “most favorable regions” of the Ramachandran plot (Table 1), while none of the residues is located in the “disallowed regions”; (3) an average G factor of −0.41 calculated for the backbone using the program Procheck (Laskowski et al. 1993, 1996); and (4) the identification of a large set of (subtle) helical capping motifs (see below). Highest-quality NMR solution structures have previously been assumed (Billeter 1992; Clore and Gronenborn 1998) to be comparable to 2.0–2.5 Å X-ray crystal structures. It thus appears that the quality of the NMR structure of YgdK and the 2.0 Å X-ray crystal structure of SufE (PDB ID 1MZG) exhibit comparable accuracy. Evidently, having two accurately determined structures is a favorable starting point for the desired high-quality homology modeling of a larger family of sequence homologs. In view of the homology modeling, it is particularly important that the molecular core of YgdK is very well defined by the NMR data, as reflected by an RMSD value of 0.84 Å for all heavy atoms of the core (Table 1).
Fold of YgdK
YgdK exhibits an α+β tertiary fold (Fig. 1b ▶) that is composed of six α-helices, I to VI, which comprise residues 17–25, 30–44, 86–99, 104–110, 112–120, and 127–147, and a three-stranded anti-parallel β-sheet with strands A to C comprising, respectively, residues 56–58, 65–68, and 80–83 (Fig. 1b ▶). In addition, a short helix II′ (residues 48–55) is present immediately N-terminal to strand A. Helices III and VI form a “coiled-coil” motif, and both helices are attached to one side of the β-sheet with helix III being oriented parallel to strand C. Helix IV is oriented approximately anti-parallel to helix III. The remaining helices I, II, and V surround helix III. As a result, helix III is largely buried in the protein’s core (Fig. 3 ▶). The CATH protocol (Orengo et al. 1997; Pearl et al. 2000) assigns YgdK to the “α-β” “fold” class having a “two-layer sandwich” architecture, and YgdK is, for obvious reasons, assigned as a “SufE-like” fold in the class of α and β proteins in the SCOP classification.
Figure 3.
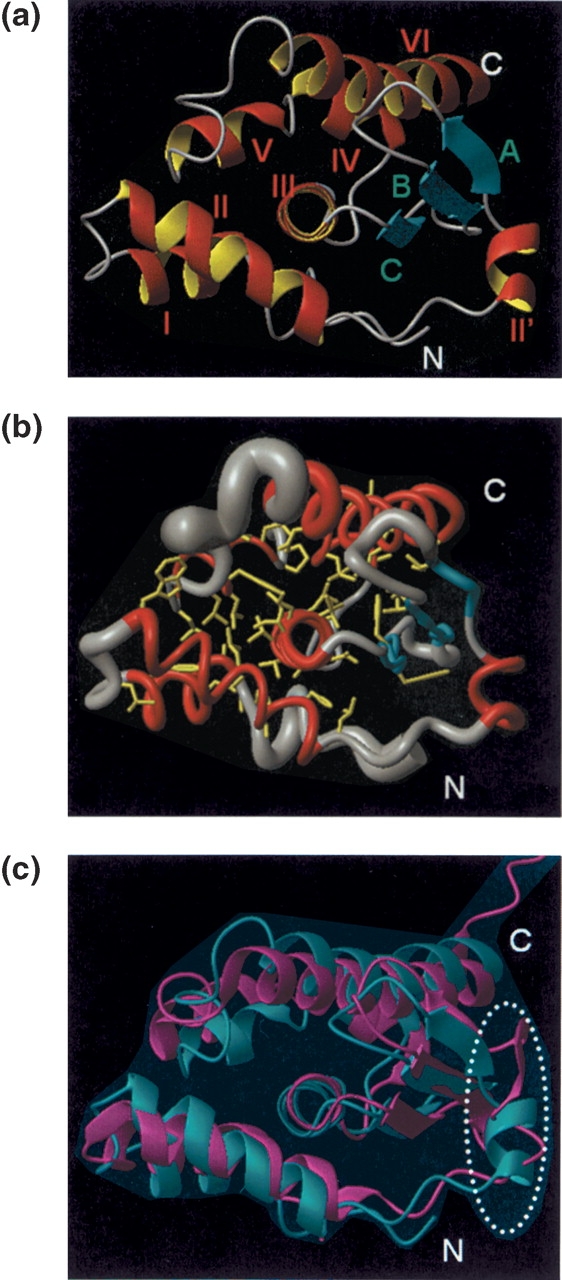
(a) Ribbon drawing of the DYANA conformer of YgdK (shown in the standard orientation of Fig. 1a ▶) that exhibits the smallest RMSD value relative to the mean coordinates after superposition of the backbone heavy atoms of the regular secondary structure elements (Fig. 1b ▶). The seven helices, I to VI and II′, are shown in red and yellow; the β-strands A, B, and C are depicted in cyan; and other polypeptides are displayed in gray. (b) Backbone of protein YgdK and the side chains forming the molecular core in the standard orientation of Figure 1a ▶. For the presentation of the backbone, a spline function was drawn through the Cα positions; the thickness of the cylindrical rod is proportional to the mean of the global displacements of the 20 DYANA conformers calculated after superposition as described in Figure 1 ▶. The helices are shown in red, the β-stands are depicted in cyan, other polypeptide segments are displayed in gray, and the side chains of the molecular core are shown in yellow. (c) Ribbon drawings (in the standard orientation shown in Fig. 1a ▶) of the DYANA conformer with the lowest target function value (Table 1) of YgdK (cyan) and the X-ray crystal structure SufE (magenta) after superposition of the Cα coordinates for minimal RMSD. The polypeptide segment of helix II′ in YgdK, which is corresponding to a coil region in SufE, is encircled (see text).
Helix capping in YgdK
The high quality of the YgdK NMR solution structure allows one to identify capping motifs of helices, which play an important role for stabilizing the helices themselves as well as supersecondary structures (Aurora and Rose 1998). When searching for N-terminal capping interactions (Harper and Rose 1993), the 13Cα and 13Cβ chemical shifts afford a tentative identification of caps (Gronenborn and Clore 1994): The 13Cα chemical shift of the N-capped residue exhibits a 1–2-ppm upfield shift, while a downfield shift of 1–4 ppm is registered for its 13Cβ shift. N-capping interactions were inferred for helices I to IV from the chemical shifts. Inspection of the three-dimensional structure provides insight at atomic resolution. In helix I, Thr 16 is the N-cap residue and forms a capping box with Thr 19 as residue N3 (following the nomenclature of Aurora and Rose 1998): The hydrogen bonds Thr 16 HN–Thr 19 OG1 and Thr 16 OG1–Thr 19 HN are formed. The N terminus of helix I is further stabilized by N′–N4 hydrophobic interaction (a “hydrophobic staple motif”) involving Val 15 and Leu 20. Its C terminus is capped by hydrophobic contacts involving the side chains of Phe 24 and Leu 27 as well as those of Thr 23 and Leu 27. Helix II is likewise stabilized by an N-terminal capping box: HN of the N-cap residue Gln 29 is hydrogen-bonded with the side-chain carboxylate of N3 residue Asn 32, and NH of Asn 32 forms a hydrogen bond with the side-chain carboxyl oxygen of Gln 29. Helix II′ exhibits a N′–N3 N-terminal hydrophobic capping motif coined the “h-xpxhx” motif (Aurora and Rose 1998), in which the methyl groups of Leu 47 are in close contact with those of Leu 51. Helix IV is N-terminally stabilized by a hydrogen bond formed between the amide proton of the N3 residue Glu 106 and the side-chain hydroxyl group of the N-cap residue Thr 103, and additional stabilization is due to the interaction of the side chains of Lys 102 and Glu 106. The C terminus of helix V exhibits a “Schellman motif,” which involves both a hydrogen bond formed between Leu 121 HN and Phe 116 O′ and hydrophobic interactions between the side chains of these two residues.
Molecular core of YgdK
The tertiary fold of YgdK is stabilized by the formation of a molecular core involving side chains from all regular secondary structure elements except helix II′ (Fig. 3b ▶). Notably, helix III is nearly entirely embedded in the core. As a result, most residues of helix III are hydrophobic, and there are only two charged residues, i.e., Arg 86 and Arg 89, among the 14 residues forming helix III. In fact, except for the two Arg residues, all side chains of helix III (Ile 87, Val 88, Leu 91, Leu 92, Ala 93, Val 94, Leu 95, Leu 96, Thr 97, Ala 98, and Val 99) are located in the interior of the protein and participate in hydrophobic contacts in the core. This is also reflected by solvent-exposed surfaces being below 10% for all theses residues. The side chains of helix III serve as a “nucleus” for formation of the molecular core interacting with the side chains of (1) Pro 10, Phe 11, and Val 15 located in the turn preceding helix I; (2) Ala 17, Leu 20, and Phe 24 of helix I; (3) Leu 27 located in the loop connecting helices I and II; (4) Trp 30, Leu 37, Leu 40, and Leu 44 of helix II; (5) Leu 58 of strand A; (6) Val 65 and Leu 67 of strand B; (7) Phe 79 and Phe 80 of strand C; (8) Ala 104, Ala 105, and Leu 107 of helix IV; (9) Pro 112, Leu 113, Leu 115, Phe 116, and Leu 119 of helix V; (10) Leu 121 and Leu 125 located in the loop connecting helices V and VI; and (11) Leu 133, Leu 136, Ile 140, Ile 141, Thr 144, and Val 147 of helix VI. Helix II′ is positioned by hydrophobic contacts with strand C. Those involve Ala 55 of helix II′ , Leu 47 located in the loop connecting helix II and helix II′, and Trp 66 of strand B and Phe 80 of strand C. As a result of this tight network of mostly hydrophobic interactions, the molecular core of YgdK is very well defined in the NMR structure: The average RMSD value of all heavy atoms of the molecular core relative to the mean coordinates is 0.85 Å (Table 1), which is only slightly larger than the corresponding value obtained for the backbone heavy atoms alone.
Comparison of YgdK NMR and SufE crystal structure
The structure of SufE was solved in parallel by X-ray crystallography by Goldsmith-Fischmann et al. (2004). YgdK (147 residues, PDB ID 1NI7) and SufE (138 residues, 1MZG) exhibit 35% amino acid sequence identity, which clearly suggests that the two proteins adopt the same fold. Indeed, the RMSD calculated between the mean Cα coordinates of YgdK and the Cα coordinates of SufE is 2.5 Å . Figure 3c ▶ affords a visual impression of the global structural similarity. Moreover, inspection of the backbone dihedral angles φ and ψ shows that the two structures are also locally rather similar, with the exception of the polypeptide segment of helix II′ in YgdK: The corresponding segment in SufE does not adopt a helical conformation. As a result, a local RMSD value of 4.3 Å is calculated between the mean Cα coordinates of residues 45–54 of YgdK and the Cα coordinates of residues 35–44 of SufE after global superposition of all Cα coordinates of the two structures. This structural variation might be related to details of functional differences between the two proteins. An additional structural variation is manifested in somewhat different orientations of helices I and VI. Compared to YgdK, helices I and V are slightly shifted away from helices III and VI in SufE (Fig. 3c ▶).
Internal motional modes are assumed to play an important role for protein function (for a recent review, see Palmer 2001). We have thus calculated (Fig. 2b ▶) the relative displacements, as described by Billeter (1992), for the backbone heavy atoms in YgdK and SufE structures. For the NMR structure, the relative displacement is derived from local RMSD values, while B-factors are recruited for the crystal structure. Relative displacements turn out to be rather similar throughout the polypeptide backbone for both proteins. However, the flexible disorder found for segment 122–125 in YgdK is apparently not observed for the corresponding segment 113–115 in SufE (Fig. 2b ▶).
Structural similarity search for identifying potential homologs of YgdK
The program CE (Shindyalov and Bourne 1998) was used to search the PDB (Berman et al. 2000) for proteins other than SufE and IscU that are structurally similar to YgdK (see Supplemental Material for a detailed summary of the findings, including Table S1). In all cases, we found that (1) z-scores are at the threshold of being significant (i.e., around 4), (2) RMSD values calculated between the YgdK structure and these potential homologs are fairly high (between 3.5 Å and 4.0 Å ), and (3) only ~60% of the YgdK structure can be aligned with any of the potential homologs (Table S1). Use of the programs Dali (Holm and Sander 1995) and PrISM (Yang and Honig 1999) supports the view that the structural similarity of currently known protein structures with YgdK is low and likely not significant (see Supplementall Material).
Homology modeling with YgdK and SufE: A “leverage analysis”
PSI-BLAST (Altschul et al. 1997) searches with the sequences of either YgdK or SufE against the nonredundant protein sequence database yielded the same set of 70 sequence homologs (including YgdK and SufE). Of these proteins, 66 are coded by prokaryotic genomes, while the remaining four are SufE-like domains of longer eukaryotic sequences. As a key result of this study, we were able to construct high-quality homology models for all 68 of these putative homologs of YgdK/ SufE (see Materials and Methods). In order to assess the quality of the modeling protocol, we built a model of YgdK based on its alignment to SufE and using the structure of SufE as a template and vice versa. The RMSD value calculated between the Cα coordinates of the two models and their corresponding experimental structures is 2.6 Å in both cases, i.e., nearly exactly as large as the RMSD values calculated between the two experimental structures. We thus conclude that our models are accurate “within” 2.5–3 Å .
In Figure 4 ▶, the 68 homology-modeled YgdK/SufE family members are grouped according to their difference in sequence identity relative to YgdK and SufE (chart on the left of Fig. 4 ▶), as well as according to their sequence identity relative to both YgdK and SufE (chart on the right of Fig. 4 ▶). For more than one-half of the modeled proteins, one of the two template sequences exhibits 5% or more sequence identity to a given homolog than the other one, and 54 homologs are >30% identical to either YgdK or SufE, while 14 homologs are <30% identical to either of the two template sequences. Solving the structures of both YgdK and SufE enabled us to structurally characterize with high accuracy 68 naturally occurring proteins by using computational methods. Models for the 54 sequences with higher than 30% identity to either YgdK or SufE were constructed using the structure to which it had higher sequence identity as the template. Either structure would have served as a template in these cases, though, as expected, significantly better models were obtained when the higher similarity template was used. Importantly, it was also possible to build high-quality models for the 14 sequences that had <30% identity to both YgdK and SufE. In these cases, significantly better models could be constructed using one structure over the other as a template with a query/template alignment extracted from the multiple sequence alignment of all homologs. In addition, the alignments for modeling the sequences in this group were manually edited based on information from secondary structure predictions. Hence, the availability of both structures allowed us to model well this set of low-similarity sequences.
Figure 4.

Summary of sequence identities between YgdK/SufE sequence homologs and YgdK and SufE, revealing the “leverage” of homology models obtained when using the experimentally determined structures of YgdK and SufE as templates. The 68 YgdK/SufE sequence homologs are grouped according to their difference in sequence identity to one structure over the other (left panel; A–D) and according to their sequence identity to both of the two structures (right panel; E–H). A, Eight sequence homologs are 50% more identical to one structure than the other; B, eight sequence homologs are between 10% and 50% more identical to one structure than the other; C, 20 sequence homologs are between 5% and 10% more identical to one structure than the other; D, 32 sequence homologs are between 0% and 5% more identical to one structure than the other; E, 18 sequences have >40% identity (40% to 99%) to one structure and <35% to the other; F, 13 sequences have >30% identity to one structure and <30% to the other; G, 23 sequences have between 30% and 40% identity to both structures; H, 14 sequences have <30% identity to both structures. (SWISS-PROT/TrEMBL primary AC: Q46926) and SufE (SWISS-PROT/TrEMBL primary AC: P76194). SWISS-PROT/TrEMBL primary accession numbers of the YgdK/SufE homologs are 26247929, 15802091, 24113068, 16760533, 16764724, 16122621, 22125831, Q9EXP1, 24324015, 24114095, 26249217, 16761763, 16121327, Q9KPQ6, 27365156, 23040025, P74523, 22298633, 17231005, 23124053, 23122888, Q9CME7, P44156, 23470497, 23108626, 26988260, 23467330, 23133309, 23060240, 22963827, 24375284, 21290341, 23028414, 15888257, Q985J5, 23501463, 27378180, Q9A9C7, 17987642, Q52967, 642658, 23105105, Q52742, 22958630, O96155, Q9PEN4, 24215721, 22994520, 22997695, 23135881, 21231690, 21243089, Q9HXX2, 23004440, 23131684, O65584, Q9Z9B0, Q9JSJ9, Q9K208, O84327, Q9PK71, 22974880, Q9RXU0, P96889, 23480445, 23593281, Q9FXE3, and Q9FGS4.
Three sets of 68 homology models for the YgdK/SurfE family were used for the leverage analysis: (1) a set generated with YgdK as template, (2) a set generated with SurfE as template, and (3) a set generated by using the higher similarity structure as template. All models score well according to the structure evaluation programs Verify3D (Bowie et al. 1991; Luthy et al. 1992) and Prosa2 (Sippl 1993), i.e., the models yielded Verify3D profiles that are usually obtained for high-quality experimentally determined structures. However, the models of the third set scored higher than those from the two single template sets. Notably, among the third set of 68 homology models, 34 models each were based on both the SufE and Ygdk structures. Hence, both experimental structures contributed equally to the excellent leverage in terms of both the number of modeled structures and their predicted quality. This finding (1) supports the view that the accuracy of YgdK NMR and SufE crystal structures is comparable, and (2) evidences a case of strong synergy of NMR and X-ray structure analysis for making available high-quality homology models of larger families of sequence homologs in structural genomics. The homology models are available online (http://maat.med.cornell.edu/nesg/er75_model.html).
Conserved surface patches identified in the YgdK/SufE protein family
Figure 5 ▶ depicts the sequence conservation among the YgdK/SufE homologs as well as the corresponding conservation of surface features among the structure of YgdK and four models of sequence-disparate homologs, i.e., none of the sequences whose models are presented in Figure 5 ▶ shares higher than 30% identity with any of the other four proteins shown (see figure legend). Nonetheless, there are highly conserved residues (depicted in maroon in Fig. 5a ▶) that support conserved surface properties across the family, most notably Cys 61, which is implicated in sulfur transfer (Loiseau et al. 2003; Ollagnier-de-Choudens et al. 2003; Outten et al. 2003), and a basic (Arg 129) and an acidic (Glu 84) residue in close spatial proximity that produce a characteristic electrostatic signature surrounding the region of Cys 61. Interestingly, in the one case (Fig. 5e ▶) in which Glu 84 is not conserved, the model is predicted to present a unique acidic residue to the surface immediately adjacent to this site (to the right of the green circle in panel e), so that the overall electrostatic character surrounding Cys 61 is conserved. A PrISM multiple structure superposition of the YgdK structure and the four homology models reveal that 90% of their Cα backbone atoms are “within” an RMSD value of 2 Å , while only 9% are more diverse, sharing RMSD values in the range of 2–4 Å . This supports the view that our homology models are of high quality. Furthermore, the residues denoted in Figure 5 ▶ exhibit rather low fluctuations among the experimental structure and the four models (with average RMSD values of 0.5 Å for Cys 61, 1.0 Å for Glu 84, and 1.5 Å for Arg 129). Taken together, our findings strongly suggest that this surface patch of YgdK and its homologs is functionally important, likely for complex formation with CsdA and its homologs.
Figure 5.

Conservation of surface features among sequence disparate YgdK/SufE homologs. All protein structures/models are shown in the same orientation. (a) Conserved surface residues identified using the program ConSurf (Glaser et al. 2003) with the YgdK NMR structure and the 69 sequence homologs of YgdK (see text). Two conserved charged residues and the cysteine implicated in sulfur transfer are labeled and circled to facilitate comparison with the surface electrostatic potential distribution calculated with the program GRASP (Nicholls et al. 1991), as displayed for YgdK in b, and homology models of four sequence homologs: Q9FXE3 (c), P96889 (d ), Q9K208 (e), and P74523 (f ). The three residues labeled in a are present in all models except Q9K2O8, for which a Lysine is at the position of Glu 84 (green circle, e). The percent pairwise sequence identities based on sequence (structure) alignments are: Q9FXE3/YgdK 25(21); P96889/YgdK 29(24); Q9K208/YgdK 17(15); P74523/YgdK 29(24); P96889/Q9FXE3 23(21); Q9K208/Q9FXE3 18(14); P74523/Q9FXE3 29(29); Q9K208/P96889 15(17); P74523/O96889 24(21); P74523/Q9K208 23(22). Both the multiple sequence alignment and the structure-based multiple sequence alignment were constructed in PrISM (Yang and Honig 1999).
Since it has been shown that (1) SufE and SufS form a binary complex (Loiseau et al. 2003; Ollagnierde-Choudens et al. 2003; Outten et al. 2003) and (2) YgdK and CsdA share, respectively, comparably high sequence homology to SufE and SufS, it is quite likely that YgdK forms a complex with CsdA analogous to the SufE/SufS complex. As a first step toward understanding the structural biology of the complex formation, we built a homology model of CsdA based on the X-ray crystal structure of SufS (PDB ID 1I29; Mihara et al. 2002), which exhibits 45% sequence identity with CsdA. Subsequently, the spatial clustering of residues conserved within the SufS/CsdA family of sequence homologs was analyzed using the program ConSurf (Glaser et al. 2003), and the conserved surface patches and surface electrostatic potentials of YgdK and CsdA were compared (Fig. 6 ▶). Based on their complementarity (green arrows), including the active-site cysteines (Cys 61 in YgdK and Cys 358 in CsdA), it is tempting to propose that complex formation would occur by rotating the YgdK structure, as shown in Figure 6 ▶, by ~180° about a vertical axis and laying the structure on top of the model. Then, the conserved cysteines would be in close apposition for sulfur transfer, and three conserved basic/acidic pairs (yellow arrows) would provide charge matching.
Figure 6.
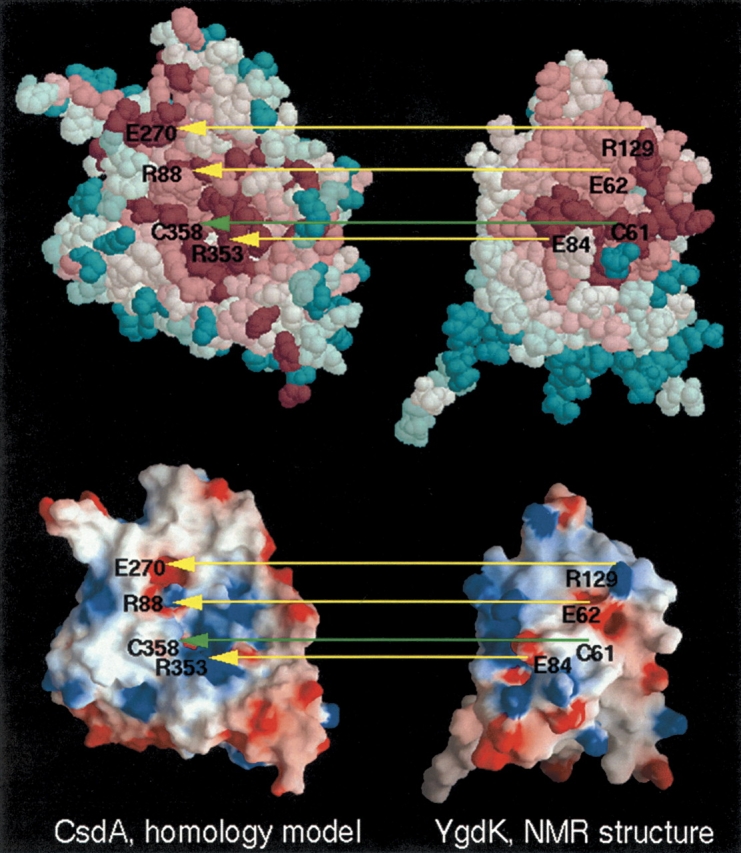
Proposed model of the interaction between CsdA and YgdK. A homology model of CsdA (shown on the left) was derived from the X-ray crystal structure of SufS (PDB ID: 1I29), with which it shares 45% sequence identity. The NMR structure of YgdK is shown on the right. The upper panel displays conserved surface residues inferred, respectively, from sequence conservation among the CsdA and YgdK families of sequence homologs using the program ConSurf (Glaser et al. 2003). Purple residues are most highly conserved, and cyan residues are least conserved. The lower panel displays surface electrostatic potential images calculated with the program GRASP (Nicholls et al. 1991), where red and blue surfaces denote negative and positive electrostatic potentials, respectively. The surfaces of CdsA and YgdK predicted to interact are facing the viewer. Based on the complementarity of conserved residues, in particular the active-site cysteines, as well as the electrostatic surface potentials, it is predicted that the YgdK/CsdA complex would be obtained by rotating the YgdK structure by ~180° about a vertical axis and laying it on top of the CsdA model.
In spite of lack of significant sequence identity, YgdK and IscU are structurally similar (Goldsmith-Fischman et al. 2004; Ramelot et al. 2004). IscU is homologous to the N-terminal domain of NifU, which contains a labile [2Fe-2S]2+ binding site. It is thought that both NifU and IscU function as [Fe-S] cluster scaffold proteins, while there is no evidence to date that YgdK and SufS can function as [Fe-S] cluster scaffold proteins. In contrast to IscU, which binds Zn under conditions of its structure determination (Goldsmith-Fischman et al. 2004; Ramelot et al. 2004), SufE and YgdK are not metallo-proteins. However, key features of the SufE–SufS or YdgK–CsdA interaction are similarly predicted for the IscU–IscS interaction (Goldsmith-Fischmann et al. 2004; Ramelot et al. 2004).
Materials and methods
Protein expression and purification
Uniformly (U) 13C,15N-labeled YgdK was expressed and purified following standard protocols (Acton et al. 2005). Briefly, the full-length YgdK gene from E. coli was cloned into a pET21d (Novagen) derivative, yielding the plasmid pER75-21. The resulting construct contains eight nonnative residues at the C terminus (LEHHHHHH) that facilitate protein purification. E. coli BL21 (DE3) pMGK cells, a rare codon-enhanced strain, were transformed with pER75-21, and cultured in MJ minimal medium (Jansson et al. 1996) containing (15NH4)2SO4 and U-13C-glucose as sole nitrogen and carbon sources. U-13C,15N YgdK was purified using a two-step protocol consisting of Ni-NTA affinity (QIAGEN) and gel filtration (HiLoad 26/60 Superdex 75; Amersham Biosciences) chromatography. The final yield of purified U-13C,15N YgdK (>97% homogeneous by SDS-PAGE; 17 kDa by MALDI-TOF mass spectrometry) was ~90 mg/L. An additional batch of U-15N YgdK was prepared according to the same protocol, but using a minimal medium containing (15NH4)2SO4 and unlabeled glucose. The concentration of both stable isotope-labeled YgdK samples was 1 mM in 95% H2O/5% D2O solution containing 20 mM MES, 100 mM NaCl, 10 mM DTT, 5 mM CaCl2, and 0.02% NaN3 at pH 6.5.
NMR data acquisition and processing
NMR data were collected at 25°C on Varian INOVA 600 and 750 spectrometers. The spectra were processed and analyzed using the programs NMRPipe (Delaglio et al. 1995) and XEASY (Bartels et al. 1995), respectively. Resonance assignments were obtained as described (Szyperski et al. 2002) using a suite of reduced-dimensionality NMR experiments, including 3D HNNCAHA, HACA(CO)NHN, HαβCαβ(CO)NHN, HCCH-COSY, and 2D HBCB(CGCD)HD and 1H-TOCSY relayed HCH-COSY. These data were complemented by conventional (Cavanagh et al. 1996) 3D HNNCACB and HC(C)H TOCSY, and 3D HNNHA (Vuister and Bax 1993) for measurement of 3JHNα couplings. Upper-limit distance constraints were extracted from 3D 15N-resolved [1H,1H]-NOESY (Cavanagh et al. 1996) (τm=70 msec) and 13C-resolved [1H,1H]-NOESY (Cavanagh et al. 1996) (τm=70 msec).
For combined analysis of conventional and RD NMR spectra using the program XEASY (Bartels et al. 1995), a suite of scripts was implemented to transfer chemical shifts into RD NMR peak lists, thereby recognizing the distinct peak pattern manifested in the various experiments (see Fig. 2 ▶ in Szyperski et al. 2002). Initially, peak lists for the RD NMR spectra with proposed resonance assignments were generated from (1) 1HN and 15N chemical shifts of spin systems identified in 2D [15N,1H] HSQC and (2) the 1H and 13C random coil values of chemical shifts measured in the projected dimension. The peak lists thus created were then manually adjusted. Once the assignment of the triple resonance spectra was (largely) completed, peak lists for the heteronuclear resolved NOESY spectra were created. These lists comprised intra, sequential, and medium range NOEs considering the protein’s secondary structure as inferred from 13Cα chemical shifts, and were completed by manual peak picking.
NMR structure calculations
NOESY cross-peak volumes and 3JHNα scalar coupling constants were converted into proton–proton upper distance limit and φ-angle constraints using the program DYANA (Güntert et al. 1997). Additional φ and ψ backbone dihedral angle constraints were derived from chemical shifts using the program TALOS (Cornilescu et al. 1999). The final round of DYANA structure calculations using torsion angle dynamics was started with 100 random conformers and 10,000 annealing steps (Güntert et al. 1997). The 20 structures with the lowest target functions were selected to represent the NMR solution structure. The calculation of RMSD values and solvent-exposed surface areas was performed using the program MOLMOL (Koradi et al. 1996).
Homology modeling and leverage analysis
PSI-BLAST (Altschul et al. 1997) searches against the nonredundant protein database were conducted to detect sequence homologs of YgdK and SufE. The BLOSUM62 substitution matrix (Henikoff and Henikoff 1992) was used with “gap existence” and “extension” penalties of 11 and 1, respectively. Using an inclusion E-value threshold of 0.001, the searches with both YgdK and SufE converged to the same set of sequences after three PSI-BLAST iterations. The sequences of YgdK and SufE and the homologs detected in the PSIBLAST search were analyzed with the program PrISM (Yang and Honig 1999): (1) An all-on-all Needleman-Wunsch (global) sequence alignment provided the basis for pairwise sequence identities, the clustering of sequences into similar groups, and the construction of multiple sequence alignments, and (2) Smith-Waterman (local) sequence scans of the set of sequences homologs against the sequences for YgdK and SufE were used to determine which of the two structures provides the more suitable template for each homologous sequence. In cases in which a sequence chosen for modeling (the target sequence) had >30% sequence identity to the sequence of its structural template, the PrISM global alignment was used as the alignment for homology modeling. In cases in which the sequence identity between target and template was <30%, the alignment for modeling was extracted from a multiple alignment of all homologous sequences with the templates. The program NEST (Petrey et al. 2003) was used to construct all homology models. Each of the models was evaluated by the programs Verify 3D (Bowie et al. 1991; Luthy et al. 1992) and Prosa2 (Sippl 1993), which score structures according to how well each residue fits into its structural environment based on criteria derived from statistical analysis of high-resolution structures in the PDB.
Electronic supplemental material
The Supplemental Material contains a detailed description of results obtained from the search for proteins exhibiting structural similarity to YdgK.
Acknowledgments
This work was supported by the NIH (P50 GM62413-01) and the NSF (MCB 00075773 to T.S.). We thank G. Kornhaber for useful comments on the manuscript, and the UB Center of Computational Research (CCR) for support.
Article and publication are at http://www.proteinscience.org/cgi/doi/10.1110/ps.041322705.
Supplemental material: see http://www.proteinscience.org
References
- Acton, T.B., Gunsalus, K.C., Xiao, R., Ma, L.-C., Aramini, J.M., Baran, M.C., Chiang, Y.-W., Climent, T., Cooper, B., Denissova, N., et al. 2005. Robotic cloning and protein productions platform of the Northeast Structural Genomics Consortium. Methods Enzymol. 394 210–243. [DOI] [PubMed] [Google Scholar]
- Altschul, S.F.,Madden, T.L., Schäffer, A.A., Zhang, J., Zhang, Z., Miller, W., and Lipman, D. 1997. Gapped BLAST and PSI-BLAST: A new generation of protein database search programs. Nucleic Acids Res. 25 3389–3402. [DOI] [PMC free article] [PubMed] [Google Scholar]
- Aurora, R. and Rose, G.D. 1998. Helix capping. Protein Sci. 7 21–38. [DOI] [PMC free article] [PubMed] [Google Scholar]
- Bartels, C., Xia, T.H., Billeter, M., Güntert, P., and Wüthrich, K. 1995. The program XEASY for computer-supported NMR spectral-analysis of biological macromolecules. J. Biomol. NMR 6 1–10. [DOI] [PubMed] [Google Scholar]
- Berman, H.M.,Westbrook, J., Feng, Z., Gilliland,G., Bhat, T.N.,Weissig, H., Shindyalov, I.N., and Bourne, P.E. 2000. The Protein Data Bank. Nucleic Acids Res. 28 235–242. [DOI] [PMC free article] [PubMed] [Google Scholar]
- Billeter, M. 1992. Comparison of protein structures determined by NMR in solution and by X-ray diffraction in single crystals. Q. Rev. Biophys. 25 325–377. [DOI] [PubMed] [Google Scholar]
- Bowie, J.U., Luthy, R., and Eisenberg, D. 1991. A method to identify protein sequences that fold into a known three-dimensional structure. Science 253 164–169. [DOI] [PubMed] [Google Scholar]
- Cavanagh, J., Fairbrother, W.J., Palmer, A.G., and Skelton, N.J. 1996. Heteronuclear NMR experiments. In Protein NMR spectroscopy, pp. 410–453. Wiley, New York.
- Clore, G.M. and Gronenborn, A.M. 1998. New methods of structure refinement for macromolecular structure determination by NMR. Proc. Natl Acad. Sci. 95 5891–5898. [DOI] [PMC free article] [PubMed] [Google Scholar]
- Cornilescu, G., Delaglio, F., and Bax, A. 1999. Protein backbone angle restraints from searching a database for chemical shift and sequence homology. J. Biomol. NMR 13 289–302. [DOI] [PubMed] [Google Scholar]
- Delaglio, F., Grzesiek, S., Vuister, G.W., Zhu, G., Pfeifer, J., and Bax, A. 1995. NMRPipe: A multidimensional spectral processing system based on UNIX pipes. J. Biomol. NMR 6 277–293. [DOI] [PubMed] [Google Scholar]
- Fiser, A., Sanchez, R., Melo, F., and Sali, A. 2000. Comparative protein structure modeling. In Computational biochemistry and biophysics (eds. M. Watanabe et al. ), pp. 275–312. Marcel Dekker, New York.
- Glaser, F., Pupko, T., Paz, I., Bell, R.E., Bechor-Shental, D., Martz, E., and Ben-Tal, N. 2003. ConSurf: Identification of functional regions in proteins by surface-mapping of phylogenetic information. Bioinformatics 19 163–164. [DOI] [PubMed] [Google Scholar]
- Goldsmith-Fischman, S., Kuzin, A., Edstrom, W.C., Benach, J., Shastry, R., Xiao, R., Acton, T.B., Honig, B., Montelione, G.T., and Hunt, J.F. 2004. The SufE sulfur-acceptor protein contains a conserved core structure that mediates interdomain interactions in a variety of redox protein complexes. J. Mol. Biol. 344 549–565. [DOI] [PubMed] [Google Scholar]
- Gronenborn, A.M. and Clore, G.M. 1994. Identification of N-terminal helix capping boxes by means of 13C chemical-shifts. J. Biomol. NMR 4 455–458. [DOI] [PubMed] [Google Scholar]
- Güntert, P., Mumenthaler, C., and Wüthrich, K. 1997. Torsion angle dynamics for NMR structure calculation with the new program DYANA. J. Mol. Biol. 273 283–298. [DOI] [PubMed] [Google Scholar]
- Harper, E.T. and Rose, G.D. 1993. Helix stop signals in proteins and peptides: The capping box. Biochemistry 32 7605–7609. [DOI] [PubMed] [Google Scholar]
- Henikoff, S. and Henikoff, J.G. 1992. Amino acid substitution matrices from protein blocks. Proc. Natl. Acad. Sci. 89 10915–10919. [DOI] [PMC free article] [PubMed] [Google Scholar]
- Holm, L. and Sander, C. 1995. Dali: A network tool for protein structure comparison. Trends Biochem. Sci. 20 478–480. [DOI] [PubMed] [Google Scholar]
- Jansson, M., Li, Y.-C., Jendeberg, L., Anderson, S., Montelione, G.T., and Nilsson, B. 1996. High-level production of uniformly 15N- and 13C-enriched fusion proteins in Escherichia coli. J. Biomol. NMR 7 131–141. [DOI] [PubMed] [Google Scholar]
- Koradi, R., Billeter, M., and Wüthrich, K. 1996. MOLMOL: A program for display and analysis of macromolecular structures. J. Mol. Graphics 14 51–55. [DOI] [PubMed] [Google Scholar]
- Laskowski, R.A., MacArthur, M.W., Moss, D.S., and Thornton, J.M. 1993. PROCHECK: A program to check the stereochemical quality of protein structures. J. Appl. Cryst. 26 283–291. [Google Scholar]
- Laskowski, R.A., Rullmann, J.A., MacArthur, M.W., Kaptein, R., and Thornton, J.M. 1996. AQUA and PROCHECK-NMR: Programs for checking the quality of proteins structures solved by NMR. J. Biomol. NMR 8 477–486. [DOI] [PubMed] [Google Scholar]
- Liu, J. and Rost, B. 2002. Target space for structural genomics revisited. Bioinformatics 18 922–933. [DOI] [PubMed] [Google Scholar]
- Liu, J., Hegyi, H., Acton, T.B., and Montelione, G.T. 2004. Automatic target selection for structural genomics on eukaryotes. Proteins 56 188–200. [DOI] [PubMed] [Google Scholar]
- Loiseau, L., Ollangnier-de-Choudens, S., Nachin, L., Fontecave, M., and Barras, F. 2003. Biogenesis of Fe-S cluster by the bacterial Suf system. J. Biol. Chem. 278 38352–38359. [DOI] [PubMed] [Google Scholar]
- Luthy, R., Bowie, J.U., and Eisenberg, D. 1992. Assessment of protein models with three-dimensional profiles. Nature 356 83–85. [DOI] [PubMed] [Google Scholar]
- Marti-Renom, M.A., Stuart, A.C., Fiser, A., Sanchez, R., Melo, F., and Sali, A. 2000. Comparative protein structure modeling of genes and genomes. Annu. Rev. Biophys. Biomol. Struct. 29 291–325. [DOI] [PubMed] [Google Scholar]
- Mihara, H. and Esaki, N. 2002. Bacterial cysteine desulfurases: Their function and mechanisms. Appl. Microbiol. Biotechnol. 60 12–23. [DOI] [PubMed] [Google Scholar]
- Mihara, H., Fujii, T., Kato, S., Kurihara, T., Hata, Y., and Esaki, N. 2002. Structure of external aldimine of Escherichia coli CsdB, an IscS/NifS homolog: Implications for its specificity toward selenocysteine. J. Biochem. 131 679–685. [DOI] [PubMed] [Google Scholar]
- Nicholls, A., Sharp, K., and Honig, B. 1991. Protein folding and association: Insights from the interfacial and thermodynamic properties of hydrocarbons. Proteins 11 281–296. [DOI] [PubMed] [Google Scholar]
- Ollagnier-de-Choudens, S., Lascoux, D., Loiseau, L., Barras, F., Forest, E., and Fontecave, M. 2003. Mechanistic studies of the SufS–SufE cysteine desulfurase: Evidence for sulfur transfer from SufS to SufE. FEBS Lett. 555 263–267. [DOI] [PubMed] [Google Scholar]
- Orengo, C.A., Michie, A.D., Jones, S., Jones, D.T., Swindells, M.B., and Thornton, J.M. 1997. CATH—A hierarchic classification of protein domain structures. Structure 5 1093–1108. [DOI] [PubMed] [Google Scholar]
- Outten, F.W., Wood, M.J., Munoz, F.M., and Storz, G. 2003. The SufE protein and the SufBCD complex enhance SufS cysteine desulfurase activity as part of a sulfur transfer pathway for Fe-S cluster assembly in Escherichia coli. J. Biol. Chem. 278 45713–45719. [DOI] [PubMed] [Google Scholar]
- Palmer, A.G. 2001. NMR probes of molecular dynamics: Overview and comparison with other techniques. Annu. Rev. Biophys. Biomol. Struct. 30 129–155. [DOI] [PubMed] [Google Scholar]
- Pearl, F.M.G., Lee, D., Bray, J.E., Sillitoe, I., Todd, A.E., Harrison, A.P., Thornton, J.M., and Orengo, C.A. 2000. Assigning genomic sequences to CATH. Nucleic Acids Res. 28 277–282. [DOI] [PMC free article] [PubMed] [Google Scholar]
- Petrey, D., Xiang, X., Tang, C., Xie, L., and Gimpelev, M. 2003. Using multiple structure alignments, fast model building, and energetic analysis in fold recognition and homology modeling. Proteins 53 430–435. [DOI] [PubMed] [Google Scholar]
- Ramelot, T.A., Cort, J.R., Goldsmith-Fischman, S., Kornhaber, G.J., Xiao, R., Shastry, R., Acton, T.B., Montelione, G.T., and Kennedy, M.A. 2004. Solution NMR structure of the iron-sulfur cluster assembly protein U (IscU) with zinc bound at the active site. J. Mol. Biol. 344 67–583. [DOI] [PubMed] [Google Scholar]
- Schwede, T., Diemand, A., Guex, N., and Peitsch, M.C. 2000. Protein structure computing in the genomic era. Res. Microbiol. 151 107–112. [DOI] [PubMed] [Google Scholar]
- Shindyalov, I.N. and Bourne, P.E. 1998. Protein structure alignment by incremental combinatorial extension (CE) of the optimal path. Protein Eng. 11 739–747. [DOI] [PubMed] [Google Scholar]
- Sippl, M.J. 1993. Recognition of errors in three-dimensional structures of proteins. Proteins 17 355–362. [DOI] [PubMed] [Google Scholar]
- Smith, A.D., Agar, J.N., Johnson, K.A., Frazzon, J., Amster, I.J., Dean, D.R., and Johnson, M.K. 2001. Sulfur transfer from IscS to IscU: The first step in iron-sulfur cluster biosynthesis. J. Am. Chem. Soc. 123 11103–11104. [DOI] [PubMed] [Google Scholar]
- Szyperski, T., Yeh, D.C., Sukumaran, D.K., Moseley, H.N.B., and Montelione, G.T. 2002. Reduced-dimensionality NMR spectroscopy for high-throughput protein resonance assignment. Proc. Natl Acad. Sci. 99 8009–8014. [DOI] [PMC free article] [PubMed] [Google Scholar]
- Tramontano, A. and Morea, V. 2003. Assessment of homology-based predictions in CASP5. Proteins 53 352–386. [DOI] [PubMed] [Google Scholar]
- Urbina, H.D., Silberg, J.J., Hoff, K.G., and Vickery, L.E. 2001. Transfer of sulfur from IscS to IscU during Fe/S cluster assembly. J. Biol. Chem. 276 44521–44526. [DOI] [PubMed] [Google Scholar]
- Vuister, G.W. and Bax, A. 1993. Quantitative J correlation: A new approach for measuring homonuclear three-bond J(HNHα) coupling constants in 15N-enriched proteins. J. Am. Chem. Soc. 115 7772–7777. [Google Scholar]
- Wunderlich, Z., Acton, T.B., Liu, J., Kornhaber, G., Everett, J., Carter, P., Lan, N., Echols, N., Gerstein, M., Rost, B., et al. 2004. The protein target list of the Northeast Structural Genomics Consortium. Proteins 56 181–187. [DOI] [PubMed] [Google Scholar]
- Wüthrich, K. 1986. NOE-observable 1H-1H distances in proteins. In NMR of proteins and nucleic acids, pp. 117–129. Wiley, New York.
- Yang, A.S. and Honig, B. 1999. Sequence to structure alignment in comparative modeling using PrISM. Proteins 3(Suppl.) 66–72. [DOI] [PubMed] [Google Scholar]