

Abstract
The stability toward thermal and urea denaturation was measured for HAMLET (human α-lactalbumin made lethal to tumor cells) and α-lactalbumin, using circular dichroism and fluorescence spectroscopy as well as differential scanning calorimetry. Under all conditions examined, HAMLET appears to have the same or lower stability than α-lactalbumin. The largest difference is seen for thermal denaturation of the calcium free (apo) forms, where the temperature at the transition midpoint is 15°C lower for apo HAMLET than for apo α-lactalbumin. The difference becomes progressively smaller as the calcium concentration increases. Denaturation of HAMLET was found to be irreversible. Samples of HAMLET that have been renatured after denaturation have lost the specific biological activity toward tumor cells. Three lines of evidence indicate that HAMLET is a kinetic trap: (1) It has lower stability than α-lactalbumin, although it is a complex of α-lactalbumin and oleic acid; (2) its denaturation is irreversible and HAMLET is lost after denaturation; (3) formation of HAMLET requires a specific conversion protocol.
Keywords: protein stability, protein folding, kinetic trap, α-lactalbumin
In the classical picture, each gene encodes for one polypeptide chain that folds into a unique protein structure, representing the thermodynamically most stable state, with one biological function. For some proteins, the native state is not the most stable structure, but is a kinetically trapped state in a local free energy minimum. Examples of proteins with a kinetically trapped native state are α-lytic protease (Jaswal et al. 2002), serine protease inhibitors (serpins) (Huber and Carrell 1989), and viral membrane fusion proteins (Carr and Kim 1993). A well-ordered native state is not required for a protein to be functional (Wright and Dyson 1999; Uversky 2002a,b). Many proteins involved in cell cycle regulation, DNA and RNA recognition, and signal transduction have an intrinsically disordered structure and adopt a structured state first upon binding their target (Dyson and Wright 2002). The free energy penalty associated with the conformational change will decrease the affinity while the specificity can be maintained, which is feasible in transient cellular events. It is also suggested that the disordered state could be a way of achieving larger intermolecular interfaces without an increase of the crowding effect or larger cell size (Gunasekaran et al. 2003). Sequence analysis of eukaryotic genomes suggests that 35%–51% of the genes code for proteins that are disordered (Dunker et al. 2001).
HAMLET (human α-lactalbumin made lethal to tumor cells) is a folding variant of human α-lactalbumin that induces apoptosis in tumor cells while sparing healthy cells, both in cell culture (Håkansson et al. 1995, 1999; Svanborg et al. 2003) and in tissue (Fischer et al. 2004; Gustafsson et al. 2004). Regular α-lactalbumin is a globular high-affinity Ca2+-binding protein present in the milks of most mammals. It binds to galactosyl transferase in the lactose synthase complex that catalyzes the formation of lactose in the mammary gland (Brew and Hill 1975; Ramakrishnan et al. 2001, 2002). The 123 amino acids of α-lactalbumin are organized into a smaller β-subdomain and a larger α-subdomain separated by a cleft and interconnected by four disulfide bonds (Fig. 1 ▶; Acharya et al. 1989, 1991; Chrysina et al. 2000). HAMLET is a partially unfolded conformer that is stabilized by a specific fatty acid cofactor (Fig. 1B ▶). HAMLET binds to the surface of tumor cells, enters these cells, and eventually accumulates in the cell nucleus where it interacts with histones (Düringer et al. 2003). HAMLET has retained the high-affinity Ca2+-binding site of α-lactalbumin, but mutational studies have shown that a functional Ca2+-site is not required for the apoptosis-inducing effect (Svensson et al. 2003a).
Figure 1.

(A) Human α-lactalbumin (PDB accession no. 1B90). The sphere represents a calcium ion; disulphide bridges are drawn as black lines. The C and N termini and helix A–C are indicated. (B) Space filling and line representation of oleic acid (OA) (same scale as α-lactalbumin). A and B were prepared using MOLMOL (Koradi et al. 1996) and rendered in POV-Ray. (C) Amino acid sequences of human and bovine α-lactalbumin. The bovine sequence is only shown at positions that differ from the human protein. The secondary structure elements as shown in A are marked. Calcium site residues (79–88) and disulphide bridges are indicated.
Previous studies have shown that HAMLET has unusual thermodynamic properties. The complex is formed from calcium-free (apo) α-lactalbumin by ion exchange chromatography on a resin that is conditioned with oleic acid (Svensson et al. 2000, 2003b). It is not possible to produce active HAMLET by just mixing apo α-lactalbumin and oleic acid/oleate in solution (Svensson et al. 2000). Although HAMLET binds calcium with retained activity (Svensson et al. 2003a), HAMLET is not obtained by the chromatographic procedure if α-lactalbumin is applied in its calcium-bound form (Svensson et al. 2000). These findings show that the three-component system α-lactalbumin/oleic acid/calcium does not rapidly reach its thermodynamic equilibrium, suggesting high kinetic barriers between states. Compared to α-lactalbumin HAMLET may have lower, similar, or higher free energy. To address this question, we here investigate the relative stabilities of different folding states of α-lactalbumin including native, apo and molten globule forms, as well as HAMLET in its calcium-free and calcium-bound states. The stability toward urea and thermal denaturation is studied using far- and near-UV circular dichroism (CD), and tryptophan fluorescence spectroscopy, as well as differential scanning calorimetry (DSC). The data suggest that denaturation of HAMLET is an irreversible process, thus our experiments yield apparent stabilities. Nonetheless, our data support that HAMLET is less stable than α-lactalbumin. This means that HAMLET is a kinetically trapped, tertiary disordered fatty acid–protein complex with a novel and biologically beneficial function.
Results
The stability of different α-lactalbumin forms toward urea and thermal denaturation was studied at low and physiological salt and in the absence as well as presence of 1 mM or 10 mM Ca2+. Denaturation was followed by differential scanning calorimetry (DSC) and by different spectroscopic methods to monitor a variety of molecular phenomena. The far-UV CD signal at 222 nm from the chiral backbone amide chromophores reports mainly on the secondary structure, although contributions from aromatic side chains may occur. Near-UV CD at 270 nm monitors the asymmetry of the environment around aromatic side chains; a reduction in signal intensity indicates increased mobility and loss of tertiary structure. Tryptophan fluorescence emission spectroscopy monitors the polarity of the environment around tryptophan side chains; exposure to water shifts the wavelength maximum toward longer wavelength.
Thermal denaturation in physiological salt followed by CD spectroscopy
The near-UV CD signal at 270 nm as a function of temperature shows a distinct transition toward reduced intensity for both HAMLET and α-lactalbumin, with defined baselines before and after the transition at all calcium concentrations examined (Fig. 2A–C ▶). Thermal scans at 15°, 30°, and 60°C h−1 were overlapping. Although denaturation of α-lactalbumin and HAMLET are not two-state processes (see below and Nozaka et al. 1978; Permyakov et al. 1985; Ikegushi et al. 1986), equation 2 was fitted to the data for the purpose of normalization (Fig. 3 ▶) and to obtain apparent values for the temperature at the transition midpoint, Tm.
Figure 2.

Thermal denaturation monitored by far- and near-UV CD. Data are shown as mean residue molar ellipticity. Temperature scan between 5° and 90°C monitored at 270 nm (A–C) and 222 nm (D–F) for human α-lactalbumin (dashed line), HAMLET (solid line), in 5 mM Tris/HCl, 0.15 M NaCl (pH 7.4) with 0.5 mM EDTA (A,D), 1 mM CaCl2 (B,E) or 10 mM CaCl2 (C,F). Data for the molten globule form at pH 2.0, 0.15 M NaCl, are included in A and D (dotted line).
Figure 3.
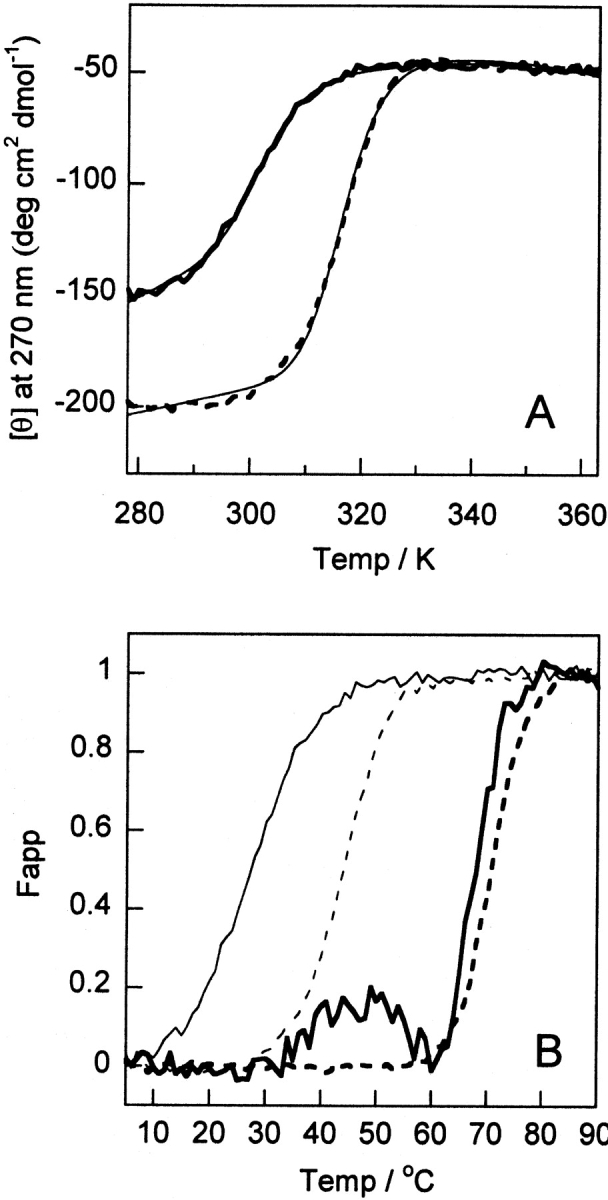
Thermal denaturation monitored by far- and near-UV CD for HAMLET (solid line) and human α-lactalbumin (dashed line). (A) Examples of curves fitted to data in 0.5 mM EDTA. (B) Normalized data in
The apparent Tm values for human α-lactalbumin range from 42°C in 0.5 mM EDTA to 67°C in 10 mM CaCl2. These numbers are in agreement with earlier studies (Nozaka et al. 1978; Permyakov et al. 1985; Ikegushi et al. 1986). For HAMLET, the apparent Tm values range from 27°C at 0.5 mM EDTA to 65°C at 10 mM CaCl2. Compared to human α-lactalbumin, HAMLET hence shows a lower apparent stability toward thermal denaturation regarding the structural confinement of aromatic side chains. The difference is most pronounced in EDTA (15°C), and becomes smaller the higher the Ca2+ concentration. HAMLET shows a hump around 40°–50°C, which precedes the major transition. This shows that denaturation of HAMLET is a complex process with intermediate states. Thermal denaturation curves of samples of α-lactalbumin in mixture with one or two equivalents of oleic acid overlapped with those of α-lactalbumin under all conditions tested (EDTA as well as in 1 or 10 mM Ca2+).
Thermal denaturation of BAMLET (bovine α-lactalbumin made lethal to tumor cells) and bovine α-lactalbumin was studied at 270 nm at physiological salt concentration and 0.5 mM EDTA or 1 mM CaCl2. In EDTA we obtain apparent Tm values of 35°C for BAMLET and 44°C for bovine α-lactalbumin. In 1 mM CaCl2, the apparent Tm is 64°C for BAMLET and 68°C for bovine α-lactalbumin. Hence, BAMLET appears to denature at lower temperature than bovine α-lactalbumin, with the largest difference in EDTA.
Near-UV CD spectra of human α-lactalbumin and HAMLET at 5°–55°C in Ca2+ or EDTA are shown in Figure 4 ▶. In this temperature interval, the spectrum of native α-lactalbumin is largely unaffected, whereas the signal form the apo form gradually disappears between 25° and 45°C. In both Ca2+ and EDTA, the signal reduction is seen at lower temperature for HAMLET than for α-lactalbumin, in agreement with the temperature scans.
Figure 4.

Near-UV CD spectra (320–250 nm) at 10°C intervals from 5° to 55°C in 5 mM Tris/HCl, 0.15 M NaCl (pH 7.4), with EDTA or calcium as indicated below. Data are shown as mean residue molar ellipticity. Human α-lactalbumin in 1 mM CaCl2 (A), 1 mM EDTA (C), and HAMLET in 0.6 mM CaCl2 (B) and 1 mM EDTA (D). A specrum of HAMLET in 0.6 mM CaCl2 after denaturation and cooling to 5°C is shown in B as a thin line with symbols.
Thermal denaturation of HAMLET and human α-lactalbumin was also studied in 0.15 M KCl with 1 mM CaCl2. The CD data at 270 nm are very similar to those recorded in 0.15 M NaCl with 1 mM CaCl2, but with slightly higher apparent Tm, indicating lower binding affinity for potassium (data not shown).
The far-UV signal at 222 nm is less sensitive to temperature changes. For HAMLET and human α-lactalbumin, increasing temperature produces a small but distinct transition toward increased CD signal, with well-defined baselines on both sides (Fig. 2D ▶–F). The transition temperature increases with the calcium concentration, and the transition is most intense at 10 mM CaCl2. At each condition, the midpoint of the transition is close to the one obtained by near-UV CD. The far-UV CD transition might involve aromatic contributions in this range, or an increase in helicity upon heating. The former interpretation is supported by the fact that bovine α-lactalbumin in 1 mM Ca2+ shows a small temperature-induced transition at 222 nm toward lower signal. The composition of aromatic side chains differs between the two species, while the secondary structure is the same. Phe9 and Trp26 are unique to bovine α-lactalbumin (Fig. 1B ▶). The far-UV CD signal at 222 nm for BAMLET does not display any clear transition in 0.5 mM EDTA, only a change in slope.
Thermal denaturation of the pH 2.0 molten globule followed by CD spectroscopy
The molten globule species of human and bovine α-lactalbumin at pH 2.0 show no temperature-induced transition at 0.5 mM EDTA and 1 mM CaCl2 (lines with symbols). All samples contained 5 mM Tris/HCl, 0.15 M NaCl, at pH 7.4. any wavelength examined (Fig. 2A,D ▶). A linear decrease of signal intensity at 222 nm with temperature is observed (Fig. 2D ▶), and the original signal intensity is restored when the sample is cooled back to the starting temperature. At low temperature, the molten globule species show stronger negative signal at 222 nm than the native proteins and HAMLET/BAMLET, but at high temperature the curves approach one another. The molten globule does not show any distinct near-UV signals at any temperature studied, and the temperature scans at 270 nm display no transition (Fig. 2A ▶).
Thermal denaturation monitored using DSC
A thermogram from DSC shows the excess heat capacity (Cp, sample minus reference buffer) as a function of temperature. DSC hence reports on all processes consuming or releasing heat in the sample. At temperatures below the onset of the unfolding, Cp reflects the difference in heat capacity between the protein and the solvent it has displaced. Since water has a high heat capacity compared to proteins, the apparent Cp in this region will normally be negative. The slope of the pretransition baseline is usually positive, and indicates a gradual increase in heat capacity with temperature. As the protein starts to unfold, Cp increases since more heat energy is taken up by the denaturing protein, reaching a peak at the apparent midpoint temperature of the process (Tm), before it drops down to the high temperature baseline. This posttransition baseline represents the heat capacity of the unfolded state relative to water, and is usually found at a higher level (positive ΔCp) and with a smaller slope than the pretransition baseline.
Human α-lactalbumin and HAMLET were subjected to DSC in 1 mM EDTA, as well as in 0.5, 1, and 10 mM CaCl2, both in the absence of added salt and at physiological salt concentration. In all conditions, the baselines have similar slopes for HAMLET and α-lactalbumin, although they are found at lower Cp values for HAMLET, indicating that this form has a lower heat capacity. Data after baseline subtraction (Fig. 5 ▶) yield the excess enthalpy of transition(s).
Figure 5.

Differential scanning calorimetry (DSC) from 5° to 95°C for 70 μM HAMLET (solid line) or human α-lactalbumin (dashed line) in 1 mM EDTA (A), 0.5 (HAMLET) or 1 (α-lactalbumin) mM Ca2+ (B), 10 mM Ca2+ (C), 0.15 M NaCl and 1 mM EDTA (D), 0.15 M NaCl and 0.5 (HAMLET) or 1 (α-lactalbumin) mM Ca2+ (E). Thermograms of 7–350 αM HAMLET in 0.15 M NaCl and 1 mM Ca2+ are shown in F. All samples contain 5 mM Tris/HCl (pH 7.5).
The thermogram of human α-lactalbumin in 1 mM EDTA has one distinct transition at an apparent Tm of 42°C without salt and 39°C in 0.15 M NaCl (Fig. 5A,D ▶). In 1 mM CaCl2, α-lactalbumin shows an ordinary thermogram with an apparent Tm of 70°C without salt and 68°C in 0.15 M NaCl (Fig. 5B,E ▶). The peak intensity is higher and the pre-and posttransition baselines are found at a higher Cp-level than in EDTA, but with similar slopes. α-Lactalbumin in 10 mM CaCl2 has one major transition at 67°C without NaCl (Fig. 5C ▶) and at 70°C in 0.15 M NaCl (data not shown). In the absence of added NaCl, the lower Tm observed at 10 mM Ca2+ compared to 1 mM, might be due to ionic strength effects. Our data are in agreement with earlier DSC studies of α-lactalbumin (Veprintsev et al. 1997; Griko and Remeta 1999).
The thermograms of HAMLET are always at a lower Cp level than those of α-lactalbumin. In 1 mM EDTA, with or without salt, HAMLET has one very broad transition around 30°–34°C, with a poorly defined pretransition baseline (Fig. 5A,D ▶). The thermogram is at a lower Cp level than in calcium and with steeper baseline than α-lactalbumin. At 0.5 and 1 mM Ca2+ (Fig. 5B,E,F ▶), more complicated curves are obtained with two narrow peaks (Tm = 53° and 57°C at low salt, Tm = 49°C and 55°C in 0.15 M NaCl) and one transition with similar width as observed for α-lactalbumin (Tm = 69°C at low salt and 65°C in 0.15 M NaCl). The two narrow peaks appear in the same temperature range as the pretransition hump in thermal scans by near-UV CD. Thermograms of HAMLET at 0.5 mM Ca2+ (Fig. 5B,E ▶) always show these two narrow peaks, while 1 mM Ca2+ (Fig. 5F ▶) is close to the condition where they start to disappear. The thermogram of HAMLET is also strongly dependent on protein concentration, as shown in Figure 5F ▶. In 10 mM CaCl2 HAMLET has a pretransition baseline with a positive slope at negative Cp values. Without salt there is one major transition with Tm = 66°C (Fig. 5C ▶), but in 0.15 M NaCl there is one minor (Tm ≈ 55°C) and one major (Tm = 66°C) peak (data not shown). The posttransition baseline is flat or with a slight negative slope indicating aggregation.
The complex behavior observed for HAMLET is dependent on protein and calcium and salt concentration, and the number of peaks and their sizes vary with these conditions. Inherently there are more processes possible for HAMLET compared to α-lactalbumin. Unfolding as well as calcium and sodium dissociation may occur for both proteins. For HAMLET, we also have oleic acid dissociation and phase transitions involving oleic acid. The highest apparent Tm for HAMLET is, however, lower than the one observed for α-lactalbumin. Multiple sequentially run thermograms for HAMLET in 0.5 and 1 mM Ca2+ and 0.15 M NaCl show a gradual decrease in signal intensity of one of the minor peaks and in the major peak. Upon repeated scans, aggregation is apparent from the sloping baseline at high temperature and the decreasing signal intensity. Under nonde-naturing conditions, magnetic resonance dispersion (MRD) measurements (Halle and Denisov 2001) show that there is a maximum of 2%–5% dimers in a sample with 1.3 mM HAMLET and no added calcium or salt (M. Gottschalk, pers. comm.).
Urea denaturation in physiological salt solution
Both HAMLET and human α-lactalbumin show calcium-dependent stability toward urea denaturation. In physiological salt (0.15 M NaCl), the CD signal at 222 nm shows a transition toward lower intensity with a well-defined pre-transition baseline. CD data for HAMLET are generally noisier than for α-lactalbumin. The tryptophan fluorescence intensity at 335 nm shows a transition toward higher intensity with well-defined baseline before the transition, although it is short in EDTA. Exactly the same samples were analyzed both by CD and fluorescence, but the general quality of the fluorescence data is much higher with less scatter in the data points.
Although denaturation of α-lactalbumin and HAMLET are not two-state processes (see below and Nozaka et al. 1978; Permyakov et al. 1985; Ikegushi et al. 1986), equation 7 was fitted to the data for the purpose of normalization (Fig. 6 ▶). Data for α-lactalbumin and HAMLET were found to superimpose both in EDTA and in Ca2+. In 1 mM Ca2+ (Fig. 6B ▶), the curves obtained by fluorescence and CD are very similar, indicating a cooperative unfolding event involving both tertiary and secondary structure. In 0.5 mM EDTA, there is a low degree of cooperativity seen as a less distinct transition that occurs at lower urea concentration by fluorescence than by CD (Fig. 6A ▶). Hence, the tertiary structure of the apo state, as represented by the polarity around tryptophan fluorophores, is disrupted at lower urea concentration than the secondary structure as monitored by far-UV CD. This is consistent with earlier studies of α-lactalbumin and a sign mark for the presence of a stable intermediate state (Nozaka et al. 1978; Ikegushi et al. 1986; Chaudhuri et al. 2000).
Figure 6.
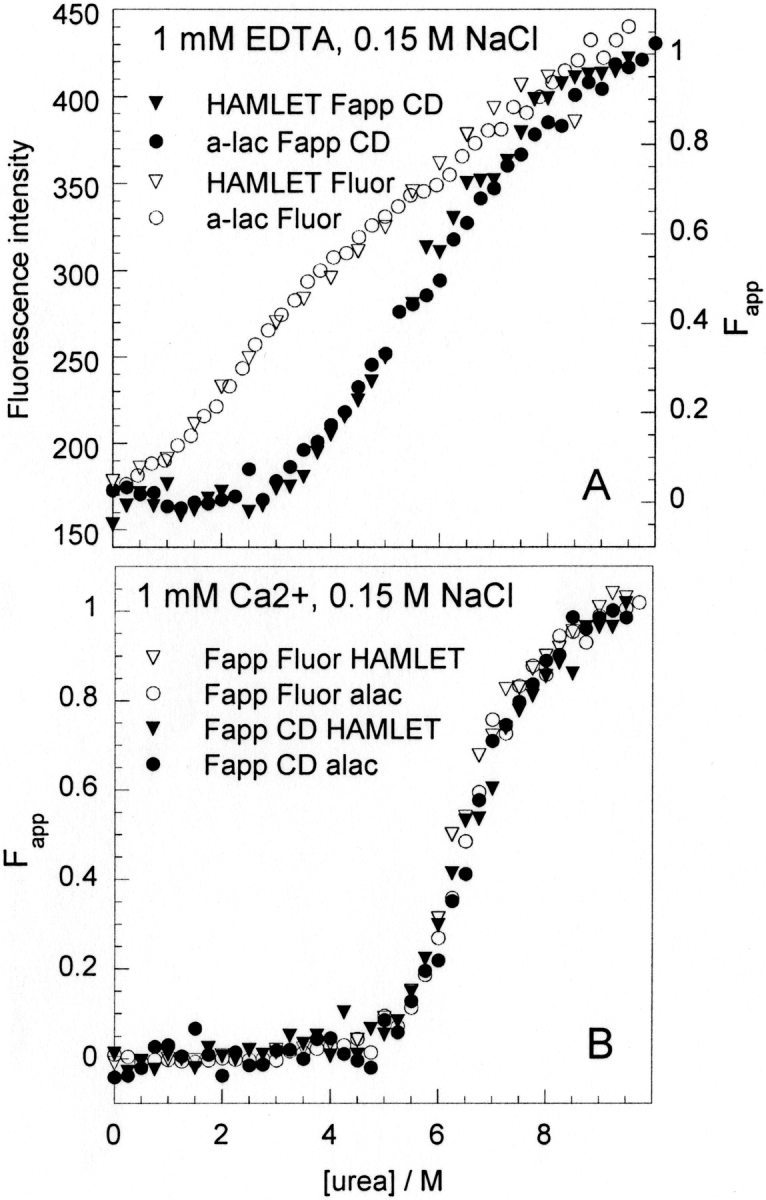
Urea denaturation of HAMLET (triangles) and α-lactalbumin (circles) monitored by fluorescence at 335 nm (open symbols) and CD signal at 222 nm (filled symbols), in 5 mM Tris/HCl, 0.15 M NaCl (pH 7.4), with 0.5 mM EDTA (A) or 1 mM CaCl2 (B). The CD data is normalized to apparent fraction unfolded (Fapp). The fluorescence data in CaCl2 is normalized to Fapp, but in EDTA the fluorescence intensity is shown. Each presented data set is an average over two to four experiments.
Urea denaturation at low salt concentration
In the absence of added salt and at conditions favoring the apo states of the proteins (0.5 mM EDTA), neither α-lactalbumin nor HAMLET shows any cooperative unfolding in urea. In 1 mM Ca2+ and no added salt, both CD and fluorescence measurements yield denaturation curves with distinct transitions and well-defined baselines before and after the transitions. The quality of the data is generally better than in physiological salt solution. The CD data reveal no difference between the two proteins; however, fluorescence data indicate a slightly lower stability toward urea denaturation for HAMLET than for α-lactalbumin (data not shown). The stability at 1 mM Ca2+ is higher in low salt compared to physiological salt solution.
Reversibility
HAMLET shows significantly reduced biological effect after incubation at 50°C for 1 h, as seen as increased cell viability and diminishing DNA fragmentation compared to incubation at 25°C or 37°C (Fig. 7A,B ▶). No activity was retained after incubation of HAMLET at 75°C. We also find that the samples of HAMLET that have used in the urea and temperature denaturation experiments by CD and DSC have lost the ability to induce apoptosis in tumor cells (data not shown). Hence, after denaturation and renaturation of the protein, HAMLET has lost its specific biological activity and behaves like α-lactalbumin and oleic acid that have been mixed in solution. The α-lactalbumin control showed no apoptotic effect.
Figure 7.
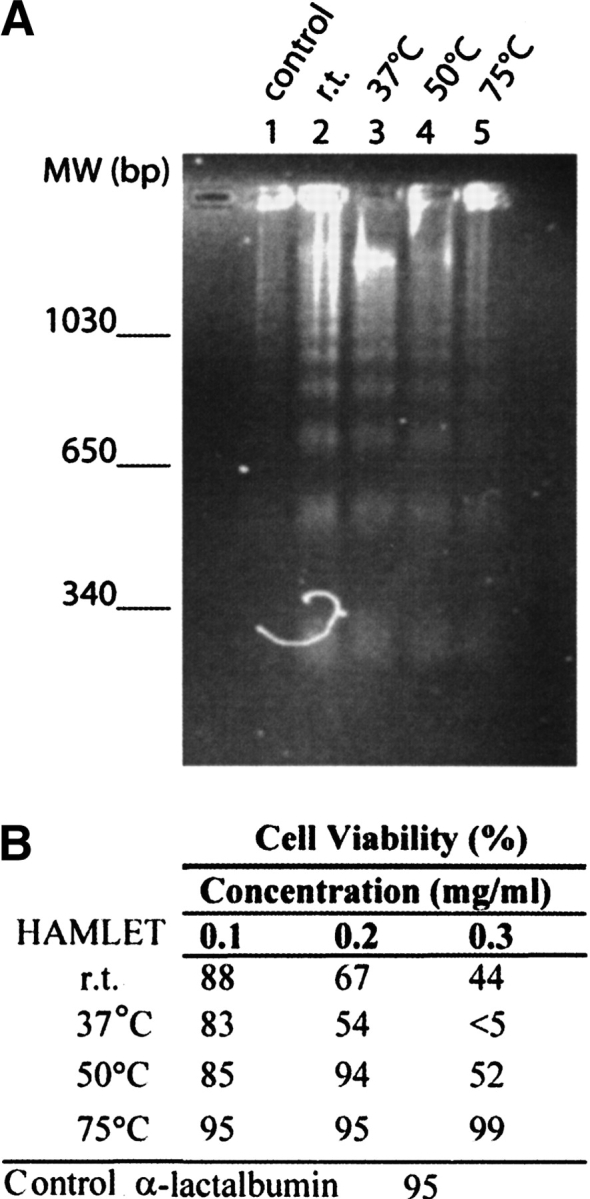
Apoptosis bioassay. (A) Cell viability and (B) DNA fragmentation of the L1210 cancer line after exposure to heat-treated (room temperature, 37°, 50°, or 75°C) aliquots of HAMLET. The apoptotic effect is decreased with the temperature, and at 75°C, no activity was left. The control α-lactalbumin did not affect the cells at all.
Repeated DSC thermograms of HAMLET reveal that thermal denaturation is not reversible. The first of the two narrow peaks disappears, and the second narrow peak shifts, overall the excess enthalpy decreases indicating aggregation. Upon repeated temperature scans monitored by near-UV CD spectroscopy, the signal intensity is reduced probably due to aggregation of protein or fatty acid, but the transition shifts toward higher temperature approaching the Tm for α-lactalbumin.
Far- and near-UV CD spectra were recorded at 20°C before and after every temperature scan. After one denaturation and cooling cycle in 1 or 10 mM Ca2+, the far-UV CD spectrum for HAMLET is similar to that of human α-lact-albumin in the same condition. When the procedure is performed in 0.5 mM EDTA, the renatured HAMLET spectrum is intermediate between those of the molten globule and human α-lactalbumin in 0.5 mM EDTA.
Oleic acid binding
A titration of apo α-lactalbumin with oleic acid was monitored by 1H NMR (Fig. 8 ▶). The spectra reveal that the fatty acid is bound to α-lactalbumin in slow exchange on the NMR time-scale (i.e., with off-rate of approximately 10 sec−1 or lower). One signal appears at 6.8 ppm and reaches saturation, while another signal appears later in the titration at 5.3 ppm and grows linearly after an initial delay. Simultaneous fitting to both signals assuming a simple 1:1 binding model yields an apparent dissociation constant of 0.1 mM (data not shown). This is an apparent dissociation constant because the oleic acid is treated as in equilibrium between protein-bound and “free” form. However, the critical micelle concentration (cmc) for oleic acid is very low and the “free” form mainly exists as micelles and/or other complex phases. Similar binding of oleic acid to α-lactalbumin was observed when a titration of the calcium-bound protein was monitored by 1H NMR (data not shown). Both titrated samples were used in apoptosis assays but showed no activity.
Figure 8.
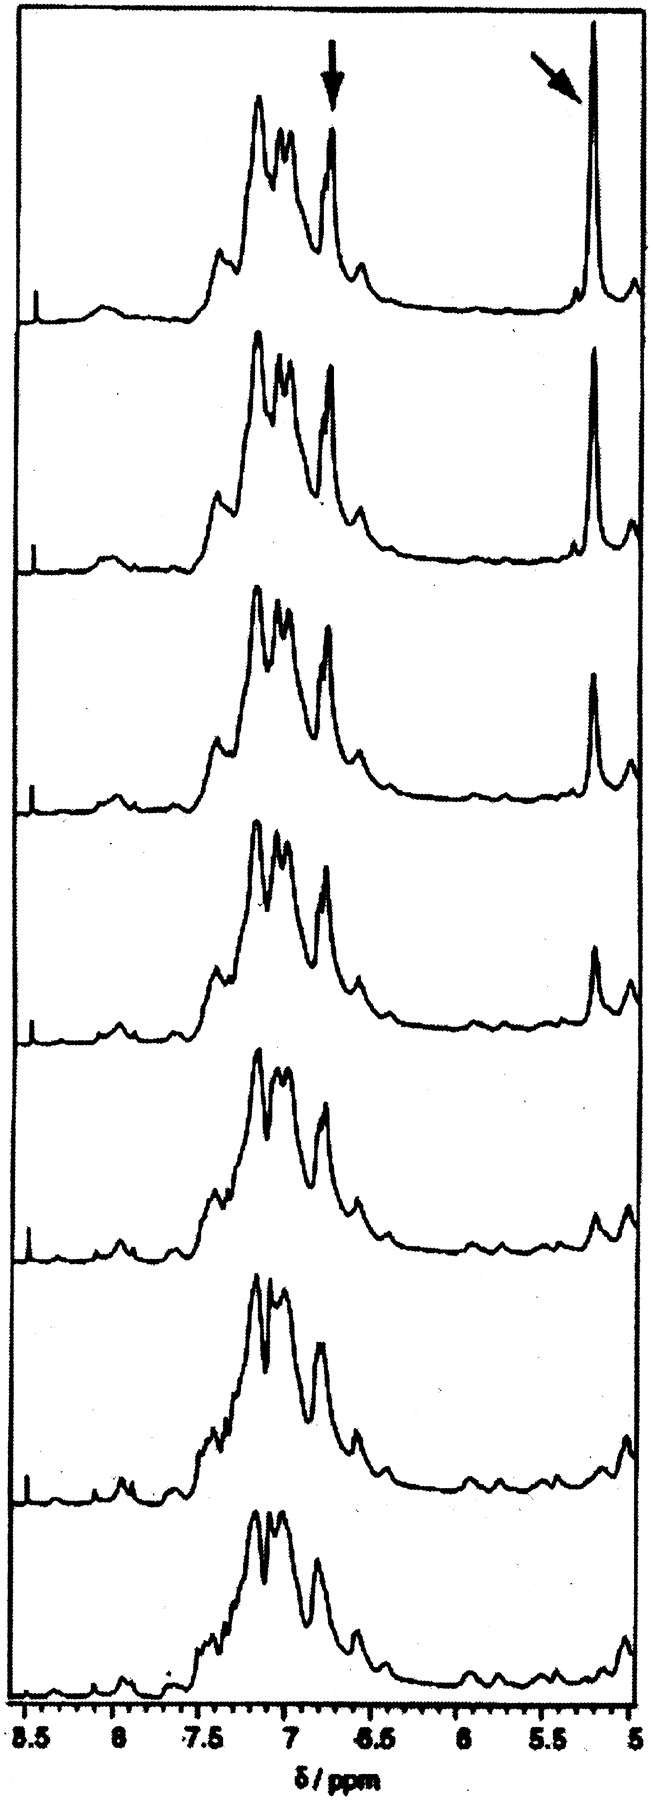
Titration of apo α-lactalbumin with oleic acid as followed by 1H-NMR. One (1) mM protein was dissolved in D2O (pH 7.0). Oleic acid was titrated in steps of 0.25 equivalents at 37°C. One signal appears at 6.8 ppm and reaches saturation, while another signal appears later in the titration at 5.3 ppm and grows linearly after an initial delay (signals indicated by arrows).
Discussion
The stability of α-lactalbumin and HAMLET toward thermal and urea denaturation was studied under a range of conditions as regards salt and calcium concentration. Under all conditions examined, the stability of HAMLET was found to be comparable to or lower than that of α-lactalbumin. This is a remarkable result given that HAMLET is a complex between α-lactalbumin and oleic acid.
Ligand binding is often seen to enhance the stability of a protein toward denaturation, because the free energy of ligand binding factors into the observed unfolding equilibrium. The unfolding process that is observed in the presence of ligand represents both the release of ligand and denaturation of the protein (Shrake and Ross 1990). The apparent stability will therefore be higher the higher the concentration of ligand. The effect is seen at free ligand concentrations well above the dissociation constant of the protein–ligand complex as measured in the absence of denaturant. The two equilibria are linked, and the apparent ligand binding affinity becomes lower as conditions approach the denaturation transition.
For the high-affinity Ca2+-binding protein α-lactalbumin, it is well established that denaturation occurs at significantly higher temperature or denaturant concentration in the presence of calcium (Figs. 2 ▶, 5 ▶; Permyakov et al. 1985; Ikegushi et al. 1986; Kuwajima et al. 1986; Griko et al. 1999). The effect is seen as a gradual increase in stability all the way up to 10 mM Ca2+, while the Ca2+-dissociation constant in the absence of denaturant is around 100 nM at physiological salt concentration (Kronman 1989; Svensson et al. 2003a). The apparent Ca2+ affinity decreases when the conditions are altered to favor the denatured state (elevated temperature or increased denaturant concentration). This explains why a further stabilization is observed between 1 and 10 mM Ca2+, which is 104–105-fold higher than the KD that was measured under nondenaturing conditions.
In line with this, one might expect that HAMLET, which is a protein-oleic acid complex, would exhibit higher stability than the protein in the absence of bound fatty acid. On the contrary, HAMLET exhibits lower stability than α-lactalbumin at several solution conditions, and denaturation processes followed. This is one strong indication that HAMLET is a kinetic trap. The largest difference is seen for the calcium-free forms when thermal denaturation is followed by near-UV CD spectroscopy that reports on confinement of aromatic side chains in the tertiary structure (Fig. 2A ▶).
It was recently shown that BAMLET, a protein–oleic acid complex with apoptosis-inducing capacity, could be formed from bovine α-lactalbumin (Svensson et al. 2003a). In analogy with the human proteins, the tertiary structure of BAMLET appears less stable toward thermal denaturation than that of bovine α-lactalbumin.
α-Lactalbumin has been used extensively over the last 40 years in folding studies because it is known to adopt different folds as a response to the solution conditions (Kronman and Andreotti 1964). At low pH, the protein forms a stable state that is more loosely packed than the native form but has native-like secondary structure. This state has been named the molten globule state (Dolgikh et al. 1981; Ohgushi and Wada 1983), and it lacks a rigid tertiary structure (Dolgikh et al. 1985; Pfeil et al. 1986; Kuwajima 1996; Veprintsev et al. 1997). In more detail, NMR and hydrogen exchange studies have shown that the molten globule state has a structured β-subdomain and a mainly disrupted α-subdomain (Schulman et al. 1995, 1997; Wijesinha-Bettoni et al. 2001). Its unfolding is noncooperative and the molten globule form exhibits a diffuse thermal transition, but a two-state transition in the presence of denaturants (Kuwajima 1996). Other states resembling the molten globule state are achieved by removing the tightly bound Ca2+, upon heating, or through disulfide reduction. All these states show normal reversible equilibrium behavior and the protein returns to the native state when conditions are reversed by adjusting the pH to neutral, adding Ca2+, cooling the solution, or oxidizing the disulfide bonds. The Ca2+-free (apo) state differs from the low pH molten globule in that it is more compact in salt solution and shows distinct transitions both on heating and solvent denaturation (Figs. 2 ▶–5 ▶; Griko et al. 1994; Vanderheeren et al. 1996; Veprintsev et al. 1997).
HAMLET has been described as molten globule-like (Svensson et al. 2000) because it has reduced tertiary structure compared to the native protein but retained secondary structure, and because it is clearly not the same state as the classical pH 2.0 molten globule as it exists at neutral pH and in the presence of Ca2+ and it has a bound cofactor (Svensson et al. 2003a). Denaturation of apo HAMLET resembles that of apo α-lactalbumin much more than that of the molten globule. Both HAMLET and α-lactalbumin show distinct thermal transitions under all conditions examined, which is not true for the molten globule state (Fig. 2 ▶). Also, the Ca2+-bound forms of both HAMLET and α-lactalbumin show distinct thermal transitions in clear contrast to the molten globule state.
The denaturation of HAMLET by heat or urea was found to be irreversible. After denaturation, the biological activity against tumor cells was lost (Fig. 7 ▶) and repeated denaturation experiments are not identical. This is a second strong indication that HAMLET is a kinetically trapped state.
The stability we measure for HAMLET can only be viewed as an apparent stability since the complex will depart during the denaturation process. α-Lactalbumin binds oleic acid in solution (Fig. 8 ▶; Cawthern et al. 1997), but the complex that is formed is not HAMLET and has no apop-tosis-inducing activity.
Although HAMLET appears significantly less stable than α-lactalbumin toward thermal denaturation, there is no or only a small difference in stability toward urea denaturation. This discrepancy most likely arises from two factors: (1) the quite different denaturation mechanisms by heat and urea with different rates of folding and unfolding, and (2) the irreversibility of HAMLET denaturation. The secondary structure is not unfolded at 90°C, but denatures in urea solution. Thermal denaturation of the tertiary structure was monitored during a stepwise temperature change of 0.25°–1.0°C/min, while the urea denaturation involved equilibration of separate samples. The incubation time (1–3 h) seems to allow for a sufficient number of unfolding–folding cycles for the urea samples to reach equilibrium. Oleic acid may dissociate from HAMLET upon denaturation, which results in free fatty acid and denatured α-lactalbumin (Fig. 9 ▶). The protein may then renature into folded α-lactalbumin and the equilibrium established at each urea concentration is not for HAMLET, but for the α-lactalbumin–oleic acid complex that forms in solution. It has been shown in earlier studies that HAMLET can not be produced by simply mixing the protein and fatty acid, but requires a specific conversion protocol involving an oleic acid-conditioned ion exchange matrix (Svensson et al. 2000). In this work we find that HAMLET activity is lost after denaturation, and the renatured protein hence behaves as a mixture of α-lactalbumin and oleic acid.
Figure 9.

Schematic reaction pathway for HAMLET denaturation. When HAMLET is denatured, oleic acid is released and denatured α-lactalbumin is obtained (arrow 1). The denaturation equilibrium is then established for 3-lactalbumin (arrow 2).
In summary, there are three strong indications that HAMLET is a kinetically trapped conformer: (1) the lower apparent stability of HAMLET compared to α-lactalbumin; (2) the lack of reversibility—the biological activity is lost after denaturation; (3) the inability to produce HAMLET by simply mixing α-lactalbumin and oleic acid (Svensson et al. 2000).
It is still possible that HAMLET is the thermodynamically stable state under the conditions of at least one of the steps in the conversion procedure, and that there are high enough kinetic barriers separating it from α-lactalbumin or α-lactalbumin-oleic acid complex to trap the system in the HAMLET state when these conditions are removed. High kinetic barriers may be a means to devise multiple functions for α-lactalbumin, and to keep it in a particular state for enough time to serve its biological function.
Kinetically controlled protein states have been appreciated over the last 15 years (Baker and Agard 1994) with a number of mechanisms for kinetic control. α-lytic protease (Jaswal et al. 2002) has a pro region of 166 residues that is needed for the protein to attain the native state. For plasminogen activator inhibitor 1 (PAI-1) (Huber and Carrell 1989), the active serine protease inhibitor state appears due to faster folding kinetics than an inactive state that is thermodynamically more stable. For luciferase, the active heterodimeric enzyme forms 10-fold faster than homodimers. However, homodimers dissociate very slowly and represent a kinetic trap (Baldwin et al. 1993). For the prion protein (PrP), the disease mechanism involves the conversion from the monomeric α-helical native form (PrPC) into the β-sheet form (PrPSC), which forms toxic polymeric deposits (Zahn 1999). The kinetic barrier for the conversion process is very high. This may explain the low incident rate of disease. Disease is often coupled to single point mutations that reduce the barrier by stabilizing the transition state and thus speeding up the conversion.
The present results show that fatty acids can trap a protein in a state with elevated free energy and impose high kinetic barriers on the route toward a state with lower free energy.
Materials and methods
Chemicals
To produce Ca2+-free buffers, membrane tubing (M.W. cutoff: 3500 [Spectrum Medical Industries Inc.], boiled four times in doubly distilled water before use) was filled with 10 mL Chelex 100 (Biorad) (equilibrated to pH 7.4), sealed, and stored in the solutions to absorb Ca2+. Other chemicals were of highest obtainable laboratory quality.
Purification of human and bovine α-lactalbumin
Native α-lactalbumin was purified from human or bovine milk by ammonium sulphate precipitation and phenyl sepharose chromatography. The ammonium sulphate salt was added at 264 g/L milk, and the mixture was incubated over night at +4°C and centrifuged (Sorvall RC-5B refrigerated super-speed centrifuge, Du Pont Instruments) at 5000g for 15 min. The supernatant was collected, and complemented with 50 mM Tris/HCl and 35 mM EDTA (pH 7.5). A 400-mL phenyl-sepharose column (Pharmacia Biotech) was packed in 50 mM Tris/HCl with 1 mM EDTA (pH 7.5), 25°C loaded with a 500-mL sample of the supernatant, washed with 50 mM Tris/HCl, 1 mM EDTA (pH 7.5), and eluted with 50 mM Tris/HCl, 1 mM CaCl2 (pH 7.5). The eluate contained native (Ca2+-bound ) α-lactalbumin and was dialyzed extensively against distilled water. The purity and calcium content of the protein were confirmed by 1H-NMR, agarose gel electrophoresis in the presence of 1 mM EDTA or 2 mM CaCl2, and SDS-PAGE.
Calcium free (apo) α-lactalbumin
Apo α-lactalbumin was generated by dissolving α-lactalbumin in doubly distilled water containing 10-fold molar excess of EGTA at pH 8.0. The sample was applied to a G-25 gel filtration column after an aliquot of saturated NaCl (calcium-depleted) and eluted by doubly distilled water into plastic tubes to avoid Ca2+ contamination. The protein passed through the saturated NaCl to reduce binding of EGTA. Eluted protein fractions that were free from both Ca2+ and EGTA (as confirmed using 1H NMR at 500 MHz) were pooled and lyophilized.
Anion-exchange chromatography to convert α-lactalbumin to HAMLET
A 14 cm × 1.6 cm column was packed with DEAE-Trisacryl M (BioSepra) in 10 mM Tris/HCl (pH 8.5), 100 mM NaCl (buffer A) and attached to a Bio-Logic chromatography system (Bio-Rad Laboratories). The matrix was conditioned with oleic acid. Ten milligrams of oleic acid were dissolved in 500 μL 99.5% ethanol by sonication (3 min using a Branson 2200 bath sonicator). After addition of 10 mL of buffer A, the lipid solution was applied to the column and dispersed through out the matrix using a linear gradient from 0.1 to 1 M NaCl in buffer A, after which the column was washed with buffer A. α-Lactalbumin in the apo state was applied to the column. Protein was dissolved to 70 μM in 10 mL buffer A with 5 mM EDTA. The column was eluted with a linear NaCl gradient in buffer A from 100 to 300 mM and then a sudden increase to 1 M NaCl. The protein fraction eluting after high salt contains HAMLET and was desalted by dialysis (Spectra/Pore, Spectrum Medical Industries) (membrane cutoff 3.5 Da) against distilled water with at least four changes of water in 100-fold volume excess, and lyophilized. The lyophilized protein was used in the apoptosis assays that confirm the activity.
Protein concentration and extinction coefficient of HAMLET
Protein concentrations were determined by amino acid analysis after acid hydrolysis or from the absorbance at 280 nm. Extinction coefficient values from the literature were used for human (1.82 mL mg−1 cm−1) (Nozaka et al. 1978) and bovine (2.01 mL mg−1 cm−1) (Kronman and Andreotti 1964) α-lactalbumin. For HAMLET we used 2.06 mL mg−1 cm−1 for BAMLET 2.28 mL mg−1 cm−1.
The extinction coefficient for HAMLET was determined as follows: Spectra were scanned from 400 to 240 nm and correction for scattering was performed by subtracting 1.926×A330 from A280 (Pace et al. 1995). The protein concentration was determined amino acid analysis after acid hydrolysis or by the Edelhoch method (Pace et al. 1995) that uses a spectrum of the protein in 6 M Guanidinium HCl and an extinction coefficient based on the amino acid composition. For calcium-free HAMLET, the protein concentration as determined by the two methods differs by 1%. Using the same procedure for α-lactalbumin we obtain an extinction coefficient that is within 1.5% from the literature value. The extinction coefficient for BAMLET was calculated assuming the same ratio as for the human proteins.
Circular dichroism
Far-UV circular dichroism (CD) spectra were obtained using a JASCO J-720 spectropolarimeter with a JASCO PTC-343 Peltier type thermostated cell holder. Quartz cuvettes with 1- or 2-mm path length were used when spectra were recorded between 190 and 250 nm. Near-UV CD spectra were recorded between 250 and 340 nm using a 10 × 10-mm cuvette. Protein concentration was ~14 μM for far-UV CD and 105 μM for near-UV CD. The following settings were used: Resolution, 1 nm; bandwidth, 1 nm; sensitivity, 50 mdeg; response time, 8 sec; accumulation, 3; and scan rate, 50 nm/min. Baseline spectra were recorded with pure buffer in the cuvette and subtracted from the protein spectra. Data are reported as molar ellipticity and was determined as:
 |
(1) |
where c is the protein concentration, l is the path length of the cell, θλ is the measured ellipticity at wavelength λ, Mr is the molecular mass of the protein, and n is the number of residues.
Fluorescence
Fluorescence was measured using a Perkin-Elmer LS-50B spectrometer using a 2 × 10-mm quartz cuvette. Excitation wavelength was 295 nm and emission recorded between 300 and 450 nm. Excitation and emission slits were 3 nm, the scanning rate was 50 nm/min, and three spectra were accumulated and averaged.
Temperature denaturation
Protein samples were dissolved in 5 mM Tris/HCl (pH 7.4) with 0.5 mM EDTA, 1 or 10 mM CaCl2. Parallel experiments were performed with no added salt, 0.15 M NaCl, or 0.15 M KCl. CD responses at 222 nm and 270 nm were monitored from 5° to 90°C at a scanning rate of 1°C/min; bandwidth, 2 nm; sensitivity, 50 mdeg; response time, 16 sec. A few test experiments were performed at scan rates of 0.5° and 0.25°C/min.
Urea denaturation
A set of protein samples with urea concentrations ranging from 0 to 9.5 M were prepared by mixing appropriate amounts of protein stock and two solutions containing either 0 or 10 M urea in 5 mM Tris/HCl (pH 7.4) with 0.5 mM EDTA, 1 or 10 mM CaCl2, and no added salt or 0.15 M NaCl. Urea denaturation was monitored at 222 nm and 25°C, using a 2-mm quartz cuvette. Other CD settings were bandwidth, 1 nm; sensitivity, 50 mdeg; response time, 8 sec; accumulation, 6.
Data analysis
The CD and fluorescence denaturation data were analyzed using the software Kaleidagraph (Synergy Software) with user-specified functions as below.
Temperature denaturation data were fitted to a linear extrapolation model assuming two-state unfolding as follows:
 |
(2) |
where
 |
(3) |
y is the ellipticity, and T is temperature; aN, bN, aU, and bU are the intercepts and the slopes of the baselines of the native and the unfolded states, respectively. Tm is the apparent transition midpoint, and ΔH° NU (Tm) is the enthalpy difference between the two states at Tm. ΔC°p is the heat capacity difference between native and unfolded protein and it was set to 7 kJ mol−1 K−1 for human and bovine α-lactalbumin and 6 kJ mol−1 K−1 for the apo forms, HAMLET and BAMLET (Svensson et al. 2003a). The values are in the range of what we observed with DSC. The Tm value is not affected by changing the value of ΔC°p. The error in the apparent Tm is 1°C or less. For HAMLET at 1 mM Ca2+, the fitting of the major transition and normalization excluded data points in the hump region between 34° and 55°C, to obtain the baselines for normalization.
Urea denaturation data were fitted to a linear extrapolation model assuming two-state unfolding as follows. The baselines before, YN, and after, YU, the actual unfolding were assumed to be straight lines.
 |
(4) |
 |
(5) |
The free energy toward unfolding by urea, ΔGNU, is assumed to obey the linear equation:
 |
(6) |
where kN and kU are the slopes, bN and bU are intercepts and [D] is the denaturant concentration. ΔGNU(H2O) is the unfolding in buffer without denaturant; mD is the influence of denaturant concentration on the stability. The observed ellipticity, Yo, was fitted using the equation:
 |
(7) |
where R is the molar gas constant and T is the temperature. ΔGNU is zero at the urea concentration at the transition midpoint, Cm. After fitting, the data were normalized according to:
 |
(8) |
 |
(9) |
Differential scanning calorimetry (DSC)
Calorimetric measurements were performed on a Microcal VP-DSC between 5° and 95°C at a heating rate of 1°C/min and excess pressure of 1.5 atm. Human α-lactalbumin and HAMLET was dissolved in 2 mM Tris/HCl (pH 7.4–7.5), with 1 mM EDTA, 1 or 10 mM Ca2+, with or without 0.15 M NaCl. Samples were dialyzed four times against 100 times excess of buffer solution. Samples and the final dialyzing buffer solutions were degassed before absorbance and calorimetric measurement. Protein concentrations were around 1 mg/mL.
Reversibility
HAMLET was tested for activation of apoptosis in tumor cells (L1210 mouse cell line) before and after temperature denaturation (CD and DSC) and after exposure to different urea concentrations. Heat exposed samples were freeze dried, dissolved in cell culture medium, and applied to tumor cell cultures. Samples exposed to urea were dialysed against pure buffer before freeze drying and then handled as above. The apoptosis-inducing activity of HAMLET on the L1210 leukemia cell line was also monitored after exposure to four temperatures. HAMLET was dissolved in PBS buffer at 10 mg/mL. Aliquots were exposed to 25°, 37°, 50°, or 75°C for 1 h. The protein was then diluted in cell culture medium to 0.1, 0.2, and 0.3 mg/mL and incubated at 37°C for 1 h before it added to the cells.
Oleic acid binding
Apo or Ca2+-bound α-lactalbumin was dissolved at 1 mM in D2O (pH 7.0). The sample was titrated with oleic acid from a concentrated stock in deuterated ethanol, in steps of 0.25 equivalents. 1H NMR spectra were recorded at 37°C at each titration step using a GE Omega-500 spectrometer operating at 500 MHz.
Apoptosis bioassays
The cell line L1210 (ATCC, CCL 219) was cultured in suspension as described before (Svensson et al. 2000, 2003b). The cells were harvested by centrifugation (200g for 10 min), resuspended in cell culture medium (RPMI 1640 supplemented with 10% fetal calf serum, nonessential amino acids, sodium pyruvate, and 50 μg gentamicin/mL (Life Technologies, Gibco BRL) and seeded into 24-well plates (Falcon, Becton Dickinson) at a density of 2 × 10⁶/ well. The different temperature samples were dissolved in cell culture medium, without fetal calf serum, and added to the cells (final volume 1 mL/well). Plates were incubated at 37°C in 5% CO2 atmosphere and 100 μL of fetal calf serum was added to each well after 30 min. Cell culture medium and human α-lactalbumin served as controls. Cell viability was determined by Trypan blue exclusion after 5 h of incubation. For analysis, 30 μL of the cell suspension was mixed with 30 μL of a 0.2% Trypan blue solution and the fraction of stained cells (dead cells) was determined by manual counting in an interference contrast microscopy (Ortolux II, Leitz Wetzlar).
Agarose gel electrophoresis analysis of DNA fragmentation
Oligonucleosome length DNA fragments were detected by agarose gel electrophoresis. The cell suspension remaining after Trypan blue (970 μL, 2 × 10⁶/mL) was lysed in 5 mM Tris, 20 mM EDTA, 0.5% Triton X-100 (pH 8.0) at 4°C for 1 h and centrifuged at 13,000g for 15 min. DNA was ethanol precipitated overnight in −20°C, treated with proteinase K and RNAse, loaded on 1.8% agarose gels, and electrophoresis was run with constant voltage set at 50 V overnight. DNA fragments were visualized with ethidium bromide using a 305-nm UV-light source and photographed using Polaroid type 55 positive-negative films.
Acknowledgments
This work was supported by the Swedish Cancer Society (C.S.), the Lund Family American Cancer Society (C.S.), the Swedish Scientific Research Council (S.L.), the Swedish Pediatric Cancer Society, the Segerfalk Foundation, the Österlund foundation, and the Lund hospital foundation. Leif Linse is gratefully acknowledged for technical assistance.
Abbreviations
CD, circular dichroism
DSC, differential scanning calorimetry
EDTA, ethylenediamintetraacetic acid. 1 calorie = 4.185 Joule
Article and publication are at http://www.proteinscience.org/cgi/doi/10.1110/ps.04982905.
References
- Acharya, K.R., Stuart, D.I., Walker, N.P., Lewis, M., and Phillips, D.C. 1989. Refined structure of baboon α-lactalbumin at 1.7 Å resolution. Comparison with c-type lysozyme. J. Mol. Biol. 208 99–127. [DOI] [PubMed] [Google Scholar]
- Acharya, K.R., Ren, J.S., Stuart, D.I., Phillips, D.C., and Fenna, R.E. 1991. Crystal structure of human α-lactalbumin at 1.7 Å resolution. J. Mol. Biol. 221 571–581. [DOI] [PubMed] [Google Scholar]
- Baker, D. and Agard, D.A. 1994. Kinetics versus thermodynamics in protein folding. Biochemistry 33 7505–7509. [DOI] [PubMed] [Google Scholar]
- Baldwin, T.O., Ziegler, M.M., Chaffotte, A.F., and Goldberg, M.E. 1993. Contribution of folding steps involving the individual subunits of bacterial luciferase to the assembly of the active heterodimeric enzyme. J. Biol. Chem. 268 10766–10772. [PubMed] [Google Scholar]
- Brew, K. and Hill, R.L. 1975. Lactose biosynthesis. Rev. Physiol. Biochem. Pharmacol. 72 105–158. [DOI] [PubMed] [Google Scholar]
- Carr, C.M. and Kim, P.S. 1993. A spring-loaded mechanism for the conformational change of influenza hemagglutinin. Cell 73 823–832. [DOI] [PubMed] [Google Scholar]
- Cawthern, K.M., Narayan, M., Chaudhuri, D., Permyakov, E.A., and Berliner, L.J. 1997. Interactions of α-lactalbumin with fatty acids and spin label analogs. J. Biol. Chem. 272 30812–30816. [DOI] [PubMed] [Google Scholar]
- Chaudhuri, T.K., Arai, M., Terada, T.P., Ikura, T., and Kuwajima, K. 2000. Equilibrium and kinetic studies on folding of the authentic and recombinant forms of human α-lactalbumin by circular dichroism spectroscopy. Biochemistry 39 15643–15651. [DOI] [PubMed] [Google Scholar]
- Chrysina, E.D., Brew, K., and Acharya, K.R. 2000. Crystal structures of apo-and holo-bovine α-lactalbumin at 2.2 Å resolution reveal an effect of calcium on inter-lobe interactions. J. Biol. Chem. 275 37021–37029. [DOI] [PubMed] [Google Scholar]
- Dolgikh, D.A., Gilmanshin, R.I., Brazhnikov, E.V., Bychkova, V.E., Semisotnov, G.V., Venyaminov, S., and Ptitsyn, O.B. 1981. α-lactalbumin: Compact state with fluctuating tertiary structure? FEBS Lett. 136 311–315. [DOI] [PubMed] [Google Scholar]
- Dolgikh, D.A., Abaturov, L.V., Bolotina, I.A., Brazhnikov, E.V., Bychkova, V.E., Gilmanshin, R.I., Lebedev Yu, O., Semisotnov, G.V., Tiktopulo, E.I., Ptitsyn, O.B., et al. 1985. Compact state of a protein molecule with pronounced small-scale mobility: Bovine α-lactalbumin. Eur. Biophys. J. 13 109–121. [DOI] [PubMed] [Google Scholar]
- Dunker, A.K., Lawson, J.D., Brown, C.J., Williams, R.M., Romero, P., Oh, J.S., Oldfield, C.J., Campen, A.M., Ratliff, C.M., Hipps, K.W., et al. 2001. Intrinsically disordered protein. J. Mol. Graph. Model 19 26–59. [DOI] [PubMed] [Google Scholar]
- Düringer, C., Hamiche, A., Gustafsson, L., Kimura, H., and Svanborg, C. 2003. Hamlet interacts with histones and chromatin in tumor cell nuclei. J. Biol. Chem. 278 42131–42135. [DOI] [PubMed] [Google Scholar]
- Dyson, H.J. and Wright, P.E. 2002. Insights into the structure and dynamics of unfolded proteins from nuclear magnetic resonance. Adv. Protein Chem. 62 311–340. [DOI] [PubMed] [Google Scholar]
- Fischer, W., Gustafsson, L., Mossberg, A.K., Gronli, J., Mork, S., Bjerkvig, R., and Svanborg, C. 2004. Human α-lactalbumin made lethal to tumor cells (HAMLET) kills human glioblastoma cells in brain xenografts by an apoptosis-like mechanism and prolongs survival. Cancer Res. 64 2105–2112. [DOI] [PubMed] [Google Scholar]
- Griko, Y.V. and Remeta, D.P. 1999. Energetics of solvent and ligand-induced conformational changes in α-lactalbumin. Protein Sci. 8 554–561. [DOI] [PMC free article] [PubMed] [Google Scholar]
- Griko, Y.V., Freire, E., and Privalov, P.L. 1994. Energetics of the α-lactalbumin states: A calorimetric and statistical thermodynamic study. Biochemistry 33 1889–1899. [DOI] [PubMed] [Google Scholar]
- Gunasekaran, K., Tsai, C.J., Kumar, S., Zanuy, D., and Nussinov, R. 2003. Extended disordered proteins: Targeting function with less scaffold. Trends Biochem. Sci. 28 81–85. [DOI] [PubMed] [Google Scholar]
- Gustafsson, L., Leijonhufvud, I., Aronsson, A., Mossberg, A.K., and Svanborg, C. 2004. Treatment of skin papillomas with topical α-lactalbumin-oleic acid. N. Engl. J. Med. 350 2663–2672. [DOI] [PubMed] [Google Scholar]
- Halle, B. and Denisov, V.P. 2001. Magnetic relaxation dispersion studies of biomolecular solutions. Methods Enzymol. 338 178–201. [DOI] [PubMed] [Google Scholar]
- Håkansson, A., Zhivotovsky, B., Orrenius, S., Sabharwal, H., and Svanborg, C. 1995. Apoptosis induced by a human milk protein. Proc. Natl. Acad. Sci. 92 8064–8068. [DOI] [PMC free article] [PubMed] [Google Scholar]
- Håkansson, A., Andreasson, J., Zhivotovsky, B., Karpman, D., Orrenius, S., and Svanborg, C. 1999. Multimeric α-lactalbumin from human milk induces apoptosis through a direct effect on cell nuclei. Exp. Cell Res. 246 451–460. [DOI] [PubMed] [Google Scholar]
- Huber, R. and Carrell, R.W. 1989. Implications of the three-dimensional structure of α 1-antitrypsin for structure and function of serpins. Biochemistry 28 8951–8966. [DOI] [PubMed] [Google Scholar]
- Ikeguchi, M., Kuwajima, K., and Sugai, S. 1986. Ca2+-induced alteration in the unfolding behavior of α-lactalbumin. J. Biochem. (Tokyo) 99 1191–1201. [DOI] [PubMed] [Google Scholar]
- Jaswal, S.S., Sohl, J.L., Davis, J.H., and Agard, D.A. 2002. Energetic landscape of α-lytic protease optimizes longevity through kinetic stability. Nature 415 343–346. [DOI] [PubMed] [Google Scholar]
- Koradi, R., Billeter, M., and Wuthrich, K. 1996. Molmol: A program for display and analysis of macromolecular structures. J. Mol. Graph. 14 51–56. [DOI] [PubMed] [Google Scholar]
- Kronman, M.J. 1989. Metal-ion binding and the molecular conformational properties of α lactalbumin. Crit. Rev. Biochem. Mol. Biol. 24 565–667. [DOI] [PubMed] [Google Scholar]
- Kronman, M.J. and Andreotti, R.E. 1964. Inter- and intramolecular interactions of α-lactalbumin. I. Apparent heterogeneity at acid pH. Biochemistry 3 1145. [DOI] [PubMed] [Google Scholar]
- Kuwajima, K. 1996. The molten globule state of α-lactalbumin. FASEB J. 10 102–109. [DOI] [PubMed] [Google Scholar]
- Kuwajima, K., Harushima, Y., and Sugai, S. 1986. Influence of Ca(2+) binding on the structure and stability of bovine α-lactalbumin studied by circular dichroism and nuclear magnetic resonance spectra. Int. J. Pept. Protein Res. 27 18–27. [DOI] [PubMed] [Google Scholar]
- Nozaka, M., Kuwajima, K., Nitta, K., and Sugai, S. 1978. Detection and characterization of the intermediate on the folding pathway of human α-lactalbumin. Biochemistry 17 3753–3758. [DOI] [PubMed] [Google Scholar]
- Ohgushi, M. and Wada, A. 1983. “Molten-globule state”: A compact form of globular proteins with mobile side-chains. FEBS Lett. 164 21–24. [DOI] [PubMed] [Google Scholar]
- Pace, C.N., Vajdos, F., Fee, L., Grimsley, G., and Gray, T. 1995. How to measure and predict the molar absorption coefficient of a protein. Protein Sci. 4 2411–2423. [DOI] [PMC free article] [PubMed] [Google Scholar]
- Permyakov, E.A., Morozova, L.A., and Burstein, E.A. 1985. Cation binding effects on the pH, thermal and urea denaturation transitions in α-lactalbumin. Biophys. Chem. 21 21–31. [DOI] [PubMed] [Google Scholar]
- Pfeil, W., Bychkova, V.E., and Ptitsyn, O.B. 1986. Physical nature of the phase transition in globular proteins. Calorimetric study of human α-lactalbumin. FEBS Lett. 198 287–291. [DOI] [PubMed] [Google Scholar]
- Ramakrishnan, B., Shah, P.S., and Qasba, P.K. 2001. α-lactalbumin (la) stimulates milk β-1,4-galactosyltransferase I (β 4Gal-T1) to transfer glucose from UDP-glucose to N-acetylglucosamine. Crystal structure of β 4Gal-T1 x LA complex with UDP-glc. J. Biol. Chem. 276 37665–37671. [DOI] [PubMed] [Google Scholar]
- Ramakrishnan, B., Boeggeman, E., and Qasba, P.K. 2002. β-1,4-galactosyl-transferase and lactose synthase: Molecular mechanical devices. Biochem. Biophys. Res. Commun. 291 1113–1118. [DOI] [PubMed] [Google Scholar]
- Schulman, B.A., Redfield, C., Peng, Z.Y., Dobson, C.M., and Kim, P.S. 1995. Different subdomains are most protected from hydrogen exchange in the molten globule and native states of human α-lactalbumin. J. Mol. Biol. 253 651–657. [DOI] [PubMed] [Google Scholar]
- Schulman, B.A., Kim, P.S., Dobson, C.M., and Redfield, C. 1997. A residue-specific NMR view of the non-cooperative unfolding of a molten globule. Nat. Struct. Biol. 4 630–634. [DOI] [PubMed] [Google Scholar]
- Shrake, A. and Ross, P.D. 1990. Ligand-induced biphasic protein denaturation. J. Biol. Chem. 265 5055–5059. [PubMed] [Google Scholar]
- Svanborg, C., Agerstam, H., Aronson, A., Bjerkvig, R., Düringer, C., Fischer, W., Gustafsson, L., Hallgren, O., Leijonhuvud, I., Linse, S., et al. 2003. Hamlet kills tumor cells by an apoptosis-like mechanism—Cellular, molecular, and therapeutic aspects. Adv. Cancer Res. 88 1–29. [DOI] [PubMed] [Google Scholar]
- Svensson, M., Håkansson, A., Mossberg, A.K., Linse, S., and Svanborg, C. 2000. Conversion of α-lactalbumin to a protein inducing apoptosis. Proc. Natl. Acad. Sci. 97 4221–4226. [DOI] [PMC free article] [PubMed] [Google Scholar]
- Svensson, M., Fast, J., Mossberg, A.-K., Düringer, C., Gustafsson, L., Hallgren, O., Brooks, C.L., Berliner, L., Linse, S., and Svanborg, C. 2003a. α-lactalbumin unfolding is not sufficient to cause apoptosis, but is required for the conversion to HAMLET (human α-lactalbumin made lethal to tumor cells). Protein Sci. 12 2794–2804. [DOI] [PMC free article] [PubMed] [Google Scholar]
- Svensson, M., Mossberg, A.-K., Pettersson, J., Linse, S., and Svanborg, C. 2003b. Lipids as cofactors in protein folding: Stereo-specific lipid–protein interactions are required to form HAMLET (human α-lactalbumin made lethal to tumor cells). Protein Sci. 12 2805–2814. [DOI] [PMC free article] [PubMed] [Google Scholar]
- Uversky, V.N. 2002a. What does it mean to be natively unfolded? Eur. J. Biochem. 269 2–12. [DOI] [PubMed] [Google Scholar]
- ———. 2002b. Natively unfolded proteins: A point where biology waits for physics. Protein Sci. 11 739–756. [DOI] [PMC free article] [PubMed] [Google Scholar]
- Vanderheeren, G., Hanssens, I., Meijberg, W., and Van Aerschot, A. 1996. Thermodynamic characterization of the partially unfolded state of Ca(2+)-loaded bovine α-lactalbumin: Evidence that partial unfolding can precede Ca(2+) release. Biochemistry 35 16753–16759. [DOI] [PubMed] [Google Scholar]
- Veprintsev, D.B., Permyakov, S.E., Permyakov, E.A., Rogov, V.V., Cawthern, K.M., and Berliner, L.J. 1997. Cooperative thermal transitions of bovine and human apo-alpha- lactalbumins: Evidence for a new intermediate state. FEBS Lett. 412 625–628. [DOI] [PubMed] [Google Scholar]
- Wijesinha-Bettoni, R., Dobson, C.M., and Redfield, C. 2001. Comparison of the structural and dynamical properties of holo and apo bovine α-lactalbumin by NMR spectroscopy. J. Mol. Biol. 307 885–898. [DOI] [PubMed] [Google Scholar]
- Wright, P.E. and Dyson, H.J. 1999. Intrinsically unstructured proteins: Reassessing the protein structure–function paradigm. J. Mol. Biol. 293 321–331. [DOI] [PubMed] [Google Scholar]
- Zahn, R. 1999. Prion propagation and molecular chaperones. Q. Rev. Biophys. 32 309–370. [DOI] [PubMed] [Google Scholar]