

Abstract
Gag protein oligomerization, an essential step during virus assembly, results in budding of spherical virus particles. This process is critically dependent on the spacer p2, located between the capsid and the nucleocapsid proteins. P2 contributes also, in association with NCp7, to specific recognition of the HIV-1 packaging signal resulting in viral genome encapsidation. There is no structural information about the 20 last amino acids of the C-terminal part of capsid (CA[CTD]) and p2, in the molecular mechanism of Gag assembly. In this study the structure of a peptide encompassing the 14 residues of p2 with the upstream 21 residues and the downstream 13 residues was determined by 1H NMR in 30% trifluoroethanol (TFE). The main structural motif is a well-defined amphipathic α-helix including p2, the seven last residues of the CA(CTD), and the two first residues of NCp7. Peptides containing the p2 domain have a strong tendency to aggregate in solution, as shown by gel filtration analyses in pure H2O. To take into account the aggregation phenomena, models of dimer and trimer formed through hydrophobic or hydrophilic interfaces were constructed by molecular dynamic simulations. Gel shift experiments demonstrate that the presence of at least p2 and the 13 first residues of NCp7 is required for RNA binding. A computer-generated model of the Gag polyprotein segment (282–434)Gag interacting with the packaging element SL3 is proposed, illustrating the importance of p2 and NCp7 in genomic encapsidation.
Keywords: Gag polyprotein, particle assembly, p2, HIV-1, NMR
Human immunodeficiency virus type 1 (HIV-1) has three major genes, gag, pol, and env. However, among these genes, the gag product was found necessary and sufficient for the assembly and budding of virus-like particles (VLPs). HIV-1 Gag protein is expressed as a 55-kDa polyprotein precursor (Pr55gag), which is cleaved by the viral protease (PR) (Wang and Barklis 1993; Wiegers et al. 1998) to produce four major viral proteins: matrix (MA), capsid (CA), nucleocapsid (NCp7), and the C-terminal protein p6.
In Pr55gag, the spacer peptide p2 is located between CA and NCp7. The initial cleavage by the viral protease between p2 and NCp7 yields the MA-CA-p2 intermediate, which is subsequently cleaved to produce MA and CA-p2. The cleavage between CA and p2 is a relatively late event in the viral maturation, and was shown to be critical for the formation of a normal cone-shaped core in the mature virion (Wiegers et al. 1998). It has been shown that the region surrounding the CA-p2 junction has a crucial role in this process (von Poblotzki et al. 1993; Krausslich et al. 1995; Accola et al. 1998). Moreover, it was suggested that p2 could also contribute to the specific HIV-1 RNA encapsidation (Kaye and Lever 1998). Recently, it has been shown that this domain plays important roles in the higher capacity of NCp7 to bind HIV-1 genomic RNA, in the context of minimal Pr55Gag protein (mGag) (Roldan et al. 2004).
The molecular mechanism involved in the assembly of spherical virus particles preceding the budding process is still unresolved. MA-CA proteins alone give cylindrical particles, but addition of the 14 amino acids of p2 corresponding to the C-terminal extension of CA is enough to produce in vitro spherical particles (Gay et al. 1998; Morikawa et al. 2000). It has been suggested that in the context of Pr55gag, the CA-p2 junction could form an additional α-helix (Accola et al. 1998) missing in mature CA (Gamble et al. 1997; Worthylake et al. 1999) and required for the production of spherical particle. In an effort to understand the functional relationships involving CA and p2, CA(CTD)-p2, was crystallized (Worthylake et al. 1999). Unfortunately, the domain encompassing the 12 last residues of CA and p2 is disordered in the crystal structure, preventing any valuable conclusion about the p2 peptide structure and its potential role in virus morphology. Moreover, Newman and coworkers have shown by NMR that the CA(CTD) and NCp7 domains are folded as expected, but p2 and the downstream and upstream 13 residues exist as a dynamic equilibrium of predominantly random coil, to a smaller extent, helical states in pure H2O (Newman et al. 2004).
To investigate the role of p2 and surrounding sequences in particle assembly and in recognition of HIV-1 packaging signal, we have determined by NMR the solution structure of the synthetic p2B and p2C peptides (Fig. 1 ▶) in the presence of 30% TFE. Both peptides are characterized by well-defined α-helices called Hp2B and Hp2C regions (Fig. 1 ▶). Moreover, gel shift experiments show that the p2 domain could stabilize the interactions of the peptides containing the NCB domain (Fig. 1 ▶) with the nucleic acids.
Figure 1.

(A) Schematic representation of the HIV-1 Gag protein. (B) Location and name used for the sequence of p2 containing peptides.
Finally, computer-generated models obtained using the present results and previously published structural data, suggest that p2 could stabilize Gag complexes through hydrophobic and hydrophilic interactions, triggering the spherical assembly of virus particles.
Results
NMR study of the p2B and p2C peptides
Initially, the two peptides p2 and p2C (Fig. 1 ▶) were analyzed by 1H NMR in 100% H2O. The samples gelled or precipitated whatever the pH and ionic strength. The addition of 30% TFE prevented the formation of a gel. In a second step the p2B peptide (Fig. 1 ▶) was synthesized, and surprisingly, the NMR spectra recorded on this peptide in solution in pure H2O at pH 3.5 and 5.5 were amenable to assignment. The addition of 10% to 30% of CD3CN increased the chemical shift spreading, but decreased the quality of the NMR spectra due to a broadening of the proton signals and precipitation. These conditions did not allow a total assignment of the spectra, and the NMR conditions were optimized by adding up to 30% TFE in H2O and lowering the pH of the samples. This approach prevented the formation of a gel and reasonably sharp signals were obtained (Fig. 2 ▶).
Figure 2.

600 MHz 2D 1H-1H NOESY spectrum of the p2B peptide recorded in H2O in the presence of 30% TFE at 293 K showing the HN-Hα region. The labels indicate the (HN[i],Hα [i]) correlations.
Clean-TOCSY (Griesinger et al. 1988) and DQF-COSY (Rance et al. 1983) experiments, recorded at 285 K, 293 K, and 303 K, were used for spin system identification, and NOESY cross signals observed at these temperatures, connecting Hαof residue i with HN of residue i + 1 (Fig. 2 ▶) were used for sequential assignment (Wüthrich 1986). In 100% H2O, only few NOEs characteristic of helical secondary structure were found for the p2B peptide: Hα16/NH19, H216/Hδ20, Hα20/NH23, and Hγ33p2/NHδ237. In the presence of CD3CN, an increased number of NOEs supporting the presence of a α-helix conformation was identified: Hα6/NH9, Hα15/NH18, Hα16/NH19, Hα17/NH20, Hα25/NH28, Hα26/NH28, Hα31/NH34, Hα34/NH36, and Hα34/NH37. Some medium NOEs involving side-chain protons were also observed: Hɛ116/Hβ18, Hɛ118/Hγ20, NHδ230/Hβ32, NHδ230/Hβ34, Hβ30/NH33, and Hδ33/NHδ237. Due to the width of the resonances and their overlap, no supplementary NOEs characteristic of this secondary structure were found in these conditions. Finally, the complete secondary structure analysis of p2B and p2C was done in H2O in the presence of 30% TFE at pH 3.5 (Fig. 3 ▶). Due to the overlap of some Hαproton resonances, additional αβ(i,i + 3) NOEs were collected from a 3D homonuclear NOESY–NOESY spectrum. Secondary Hαchemical shifts, which represent the difference between the observed chemical shift and the random coil values (Wishart et al. 1991), are given in Figure 4 ▶. An upfield trend (i.e., negative secondary shift) for the Hαresonances of residues 16–38 (Fig. 3 ▶) suggests that this domain consists predominantly of helical structural elements. An external chemical shift reference (DSS) was used to compare the Hαresonances of the p2B peptide to the random coil values observed in H2O, which have been shown to be insensitive to the solvent (Merutka et al. 1995).
Figure 3.

Summary of the NOE connectivities found in the p2B peptide. The NOEs indicate the formation of α-helices spanning residues (3–8)p2B and (16–37) p2B.
Figure 4.

Secondary Hαchemical shifts, that is, differences between observed chemical shifts and random coil shifts for the Hαresonances of p2B. The negative values on the graph clearly indicate the presence of a α-helix spanning residue 16 to 39.
A diffusion-ordered spectroscopy (DOSY) experiment (Morris and Johnson 1992; Johnson 1999) was performed to determine the oligomeric state of p2B in presence of 30% TFE. DOSY spectra were recorded on 1 mM solution of p2B and Tat, another protein of HIV-1. Tat was chosen because this protein, composed of 86 amino acids (MW = 9752), is nearly twice larger than p2B. The diffusion coefficients measured on the DOSY spectra (Fig. 5 ▶) are 1.045 10−10 m2 sec−1 and 0.737 10−10 m2 sec−1 for p2B and Tat, respectively. In agreement with the size of the proteins, p2B has a higher diffusion coefficient. The apparent molecular mass of p2B, MW = 4882, calculated from the diffusion coefficient, was compared to the mass calculated from the amino acid composition, MW = 5249, and are approximately the same with a 7% difference. From those data we assume that in the presence of 30% TFE the p2B peptide is monomeric.
Figure 5.

600 Hz 1H-detected DOSY spectrum of 1 mM, (A) p2B and (B) Tat, solutions in 30% TFE/70% H2O at 293 K.
NMR derived 3D structures of p2C and p2B
A total of 191 and 462 interproton distance restraints were used in the structure calculation of the p2B and p2C peptides, respectively, by molecular dynamics and simulated annealing. From 50 calculated structures, 19 with the lowest total energy for the p2C and p2B peptides were selected and used for structural analysis (Table 1). The main structural motif is a well-defined α-helix, Hp2B and Hp2C in the p2B and p2C peptides, respectively (Fig. 6A,B ▶).
Table 1.
NMR restraints and structural statistics
| p2C | p2B | |
| NMR-derived distance restraints | ||
| • Intraresidue | 81 | 204 |
| • Sequential (|i − j| = 1) | 60 | 138 |
| • Medium range (1 < |i − j| ≤4) | 44 | 120 |
| Distance violations | ||
| • >0.2 | 0 | 0 |
| r.m.s.d. (Å) from experimental | ||
| • distance restraints | (191) 0.030 ± 0.007 | (462) 0.063 ± 0.007 |
| r.m.s.d. from idealized geometry | ||
| • Bonds (Å) | (440) 0.0050 ± 0.0002 | (751) 0.0061 ± 0.0004 |
| • Angles (deg) | (791) 1.59 ± 0.08 | (1359) 1.98 ± 0.15 |
| • Dihedral ω(deg)a | (26) 3.59 ± 0.37 | (47) 4.51 ± 0.19 |
| Discover potential energiesb | ||
| • ENOE (kcal/mol) | 9.28 ± 2.61 | 65.13 ± 14.12 |
| • EL–J (kcal/mol) | −72.33 ± 5.52 | −89.25 ± 11.85 |
| • Etotal (kcal/mol) | −109.30 ± 10.20 | −117.94 ± 26.77 |
| Ramachandran analysis of residues | ||
| • Favored region (%) | 71.1 | 74.2 |
| • Additional allowed regions (%) | 25.3 | 22.0 |
| • Generously allowed regions (%) | 3.0 | 3.8 |
| • Disallowed regions (%) | 0.6 | 0.0 |
| Atomic rms deviation to mean structure (Å) | ||
| P2C | Backbone atoms | Heavy atoms |
| (25–37)p2C | 0.38 ± 0.16 | 1.23 ± 0.12 |
| P2C | 3.55 ± 0.76 | 4.99 ± 0.76 |
| P2B | Backbone atoms | Heavy atoms |
| (1–21)p2B | 3.35 ± 0.91 | 4.58 ± 0.97 |
| P2 | 0.23 ± 0.04 | 1.05 ± 0.11 |
| (36–48)p2B | 2.20 ± 0.48 | 3.38 ± 0.71 |
| (15–37)p2B | 0.36 ± 0.14 | 1.30 ± 0.14 |
p2C and p2B are the final 19 simulated annealing structures. The numbers of terms for the various restraints are given in parentheses.
a The conformation of the peptide bond was maintained as trans (ω = 180°) with a force constant of 200 kcal.mol−1.rad2
b NOE NMR-constant energy calculated using square-well potentials with a force constant of 32 kcal.mol−1.Å−2, EL–J is the value of the Lennard–Jones equation, which was not included in the simulated annealing step but included in the final energy-minimization steps.
Figure 6.

Superposition of the final refined structures (A) p2B and (B) p2C. The (15–37) residues of the p2B (A) and the (4–16) residues of the p2C (B) peptides are superimposed with respect to their backbone atoms. The residues belonging to the CA(CTD) and NCp7 domains are colored in blue and in green, respectively, and the p2 domain in pink. (C) Stereo view of the p2B structure showing the amphipathic property of the α-helix. The hydrophobic residues are colored in red and the hydrophilic residues in blue. Regions corresponding to the CA(CTD), p2, and NCp7 domains are colored, respectively, in pink, green, and blue.
The helical domain Hp2B presents the structural characteristics of an amphipathic helix because one face is constituted by the following hydrophobic residues: Leu21, Met25, Val28, Ala32, Met35, and Met36, and the other one by the hydrophilic amino acids: His16, Arg19, Glu23, Gln27, Asn30, Gln37, and Arg38 (Fig. 6C ▶).
Analysis of peptides/SL3 and peptides/(1–415)RNA interactions by gel shift experiments
To investigate the importance of the p2C peptide fragment in viral RNA recognition and encapsidation, the ability of the peptides, p2, p2A, p2C, p2D, NCA, and NCB to interact with nucleic acids was examined by gel shift experiments (Fig. 7 ▶). It has already been demonstrated that NCp7 binds the SL3 stem loop of the HIV-1 Ψpackaging domain with a high affinity (Clever et al. 1995; De Guzman et al. 1998). The packaging domain is present in the (1–415)RNA sequence of the genomic RNA that was therefore also used to study the binding of the different peptides. Various concentrations of the p2A, p2D, and NCA peptides were incubated with a fixed concentration of (1–415)RNA (Fig. 7A ▶) and p2, p2C, and NCB peptides were incubated with a fixed concentration of SL3 (Fig. 7B ▶). Samples were analyzed by polyacrylamide gel electrophoresis (PAGE) and stained with ethidium bromide. Increase in the concentration of p2A or NCA with respect to the (1–415)RNA (Fig. 7A1,A2 ▶) and, p2C with respect to SL3 (Fig. 7B2 ▶) led to a decrease in the amount of the free (1–415)RNA or SL3 forms, due to the formation of large aggregates of peptide–DNA complexes unable to enter the gel and remaining in the wells at the top of the gel. Moreover, with lower concentrations (8.2 and 16 μM) of the p2A peptide, intermediate complexes are formed (Fig. 7A1 ▶). In contrast, no peptide interaction with the (1–415)RNA or SL3 was observed, even in the presence of high concentrations of p2D (Fig. 7A3 ▶), p2 ,or NCB peptides (Fig. 7B1,B3 ▶) as shown by the lack of gel shift or aggregation of complexes in the wells.
Figure 7.

Analysis of peptides/SL3 and peptides/(1–415)RNA interactions by gel shift experiments. Fixed amounts of (1–415)RNA (3.3 × 10⁻¹² mol; A) or SL3 (4.5 × 10⁻¹¹ mol; B) were incubated in a buffer containing 25 mM Tris-HCl (pH 7.5), 80 mM NaCl, 0.1 mM MgCl2 for 15 min at 310 K with increasing concentrations of peptides: (A) p2A (1), NCA (2), and p2D (3), and (B) p2 (1), p2C (2), and NCB (3). In each column is indicated the amount of added peptide in μM. Samples were analyzed using poly-acrylamide gel electrophoresis and visualized by ethidium bromide staining and UV illumination.
Model of the complex formed by the Gag CA(CTD)-p2-NCp7 domain and the SL3 RNA sequence
To determine the relative position of the C-terminal part of CA and NCp7 in the Gag protein in interaction with the SL3 RNA sequence, a model of the Gag polyprotein segment, CA(CTD)-p2-NCp7, interacting with SL3 was built up. The structures of the CA(CTD) domain (except the 14 last residues), and the NCp7/SL3 complex determined by X-rays (Worthylake et al. 1999) and NMR (De Guzman et al. 1998), respectively, were obtained from the Protein Data Bank (PDB) and linked on both sides of the Hp2B helix issued from the present NMR study. After minimization of the model, we noticed that the SL3 nucleic acid lies down on the p2 peptide (Fig. 8 ▶) forming hydrogen bonds with the peptide, such as, HɛGln27/O5′G301, and HγThr33/OP1 U315.
Figure 8.

Model of the Gag polyprotein precursor, CA(CTD)-p2-NCp7 domain/SL3 complex. The CA(CTD) sequence (except the 14 last residues) corresponding to the C-terminal domain of the capsid, determined by X-rays (Worthylake et al. 1999), is colored in purple, the NCp7 is dark blue, and the SL3 RNA is purple in the NCp7/SL3 complex determined by NMR methods (De Guzman et al. 1998). The structure of the (8–21)Hp2B and (22–35)Hp2B segments belonging to CA(CTD) and p2 domains, determined in this study, are colored, respectively, in green and magenta. Residues involved in the cleavage sites by the protease are in orange.
Determination of the oligomeric state of p2-containing peptides by gel filtration experiments
The level of oligomerization of different peptides containing the p2 sequence, p2A, p2B, and p2D was analyzed by gel filtration. Thus, the p2B sample concentration ranging from 10 μM to 1 mM was applied to a Superdex 75 HR 10/30 column (Pharmacia) and the column was developed in phosphate buffer (50 mM, pH 7.2) containing 150 mM NaCl. In each case, peptides eluted exclusively in a single peak, masses of which were estimated by comparison with the retention times of proteins of determined masses. This was achieved in the same manner for the three peptides, showing that according to the estimated mass, the eluted peaks represent very likely dimeric forms for p2A, p2B, and p2D (Fig. 9 ▶). The same results were obtained when experiments were performed without NaCl in the running buffer suggesting that dimerization did not occur by electrostatic interactions. Moreover, when the column was developed in phosphate buffer containing 20% ethanol, p2A migrated as a monomer, suggesting that dimerization could occur through hydrophobic interactions.
Figure 9.

Size-exclusion chromatography: A Superose 75HR 10/30 gel filtration column was calibrated by using a series of standard proteins: ribonuclease A (13.7 kDa), chymotrypsin (25 kDa), ovalbumin (43 kDa), and albumin (67 kDa). Upon gel filtration, a linear relationship (y = −0.3282 x + 1.6782, r2 = 0.994) was evidenced between logMW and Kav. The apparent molecular weight (MW) of p2A, p2B, and p2D was determined in different conditions of concentration (from 1 to 10 μM) in phosphate buffer containing or not 150 mM NaCl. In all cases, the observed MW corresponds to the double MW of analyzed peptides.
Models of putative polymeric structures for the Hp2B helix
To understand how the p2 domain could be implicated in the aggregation process of the Gag protein and then in the formation of the viral particle, we tried to simulate the aggregation properties of the p2 domain observed in our experiments, using models generated by molecular dynamics simulations.
First, to determine if the dimerization of the C-terminal domain of capsid is compatible with the hydrophobic interactions, shown by gel filtration experiments, between the two Hp2B helices, molecular dynamics simulations were done on a dimer formed with two (282–381)Gag domains, constituted by CA(CTD), p2 and the two first residues of NCp7. The four helices of the capsid corresponding to residues (282–351)Gag, were fixed during the simulation to keep them in the relative orientation observed in the crystal structure (Worthylake et al. 1999). NMR distance restraints were used for the Hp2B domains and artificial distance restraints were added to force parallel and hydrophobic interactions between them (data not shown). To determine the stability of this model, the lowest energy structure was subjected to a 250-psec molecular dynamics at 300 K without the artificial distance restraints. The parallel hydrophobic interactions between the two α-helices were conserved (Fig. 10 ▶, top).
Figure 10.
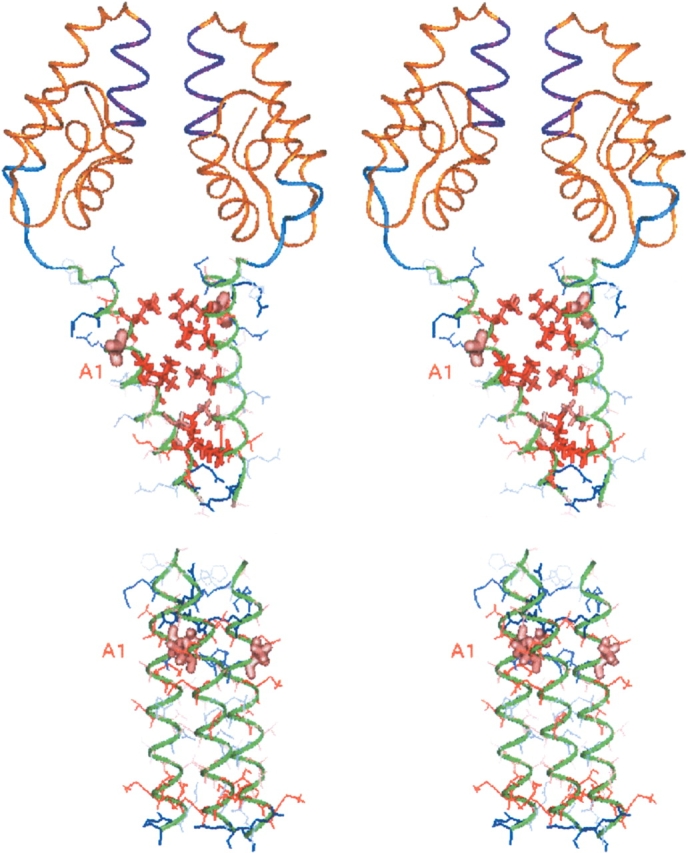
(Top) Stereo view of a dimeric (242–381)Gag model showing the flexibility of the C-terminal (354-GVGGPG-359)Gag motif that allows the closeness of two Hp2B without distortion of the α-helices. Dimer is formed through hydrophobic interactions between the α-helices. This model has been obtained after two series of molecular dynamics simulation, in which the (282–351)Gag domains have been maintained in the relative orientations observed in the crystal structure. For each run, NMR distance restraints have been used to preserve the Hp2B α-helices. Artificial distance restraints have been added to force parallel, hydrophobic interactions, only in the first step of the molecular dynamic simulation. The residue Ala1p2 (366 in Gag) probably implicated in the interaction with PA-457 is in pink. (Bottom) Stereo view of a trimeric structure model formed by interactions between the hydrophilic faces of the Hp2B α-helices obtained during a 250-psec dynamics at 300 K under NMR restraints. Hydrophilic residues are in blue and the hydrophobic ones in red. The residue Ala1p2 (366 in Gag), which interacts with PA-457, is in pink.
In addition, due to the amphipathic property of the Hp2B α-helix (Fig. 6C ▶), hydrophilic interactions could also be implicated in the aggregation phenomena. Two models were therefore generated, in which two or three peptides were associated parallel to each other, with their helices forming a dimer or a trimer, through hydrophilic contacts involving the following residues: His16, Arg19, Glu23, Gln27, Asn30, Gln37, and Arg38 (Fig. 6C ▶). For evaluation of complex stability the models were subjected to molecular dynamics simulations at 300 K under NMR restraints either in a water box or in vacuum. Interactions between the polar faces of the α-helices were evidenced both for the dimer and the trimer because they are stabilized by numerous intermolecular hydrogen bonds implicating the residues: His16, Arg19, Glu23, Gln27, and Asn30 (Table 2). Comparison of the interaction energies indicates a prevalence of the trimer (−117.63 ± 4.00 kcal/mol) with regard to the dimer (−45.38 ± 3.01 kcal/mol) when formed through hydrophilic faces (Fig. 10 ▶, bottom).
Table 2.
Intermolecular hydrogen bonds observed in the dimer and the trimer formed through hydrophilic interactions
| Helix 1 | Helix 2 or Helix 3 | ||||
| His16 | CA | Nδ1 | Arg19 | CA | Hη2 |
| Arg19 | CA | Hη1 | Glu23 | P2 | Oɛ1 or Oɛ2 |
| Gln27 | P2 | Hɛ2 | Gln27 | P2 | Oɛ1 |
| Asn30 | P2 | Hδ2 | Asn30 | P2 | Oδ1 |
Discussion
Helical structure of the Gag domain encompassing the p2 sequence
The solution structure of two synthetic Gag polyprotein segments, p2B and p2C, was determined to elucidate the crucial role played by the spacer p2 in particle assembly, and how it could contribute to the specific recognition of the HIV-1 packaging signal. For this purpose the p2 and p2C peptides were first studied by NMR in 100% H2O, but no interpretable spectra were obtained in these conditions because the solutions gelled, suggesting that these peptides form aggregates in aqueous solutions. Surprisingly, NMR spectra can be recorded with p2B in the same conditions. The relative flexibility of the p2B(1–9) and p2B(16–48) parts of the peptide induced by the flexible 354-GVGGPG-359 (Gly-rich region) domain seems to prevent peptide association and, consequently, the formation of large aggregates. Few NOEs suggesting that this peptide has the propensity to adopt an α-helix conformation were found. Addition of CD3CN in the aqueous solution of p2B induced precipitation of the peptide and increased the width and the chemical shift range of the resonances when compared to experiments in pure H2O. In these conditions, the proton linewidth was too large to allow a complete interpretation of the NMR spectra, but a higher number of NOEs supporting the presence of an α-helix was identified. In light of these results, 30% TFE was incorporated in the final study of the peptides because it is well known that TFE reduces intermolecular hydrophobic interactions and stabilizes α-helices only in regions where a high propensity for helix formation exists (Dyson et al. 1988; Gooley and MacKenzie 1988; Nelson and Kallenbach 1989; Blanco et al. 1994). Diffusion measurements show that in these conditions the p2B peptide is monomeric (Fig. 5 ▶). Moreover, the N-terminal domain of NCp7 ([382–393]Gag) does not exhibit any α-helical conformation despite the presence of 30% TFE in the sample. This is consistent with previous studies showing that this region adopts an α-helical conformation in 90/10 H2O/D2O only when the NCp7 protein is involved in a complex with a nucleic acid (De Guzman et al. 1998). On the contrary, the (1–7) segment in the p2B peptide, which forms an α-helix in the native CA protein (Worthylake et al. 1999), has a propensity to adopt an α-helical structure in the presence of TFE (Fig. 6C ▶) in the p2B peptide. Although positive secondary shifts were observed for the Hαresonances, the (1–7) segment seems to adopt a very flexible α-helix structure as shown by weak NOEs observed on the spectra.
Role of the NCp7 in virus particle assembly
Gag multimerization in vitro seems to be potentiated by NCp7, through strong interaction of the nucleoprotein with viral RNA (Roques et al. 1997; Dawson and Yu 1998; Wang et al. 1998). Some results have suggested that residues within the HIV-1 p2 domain contribute to a relatively specific recognition of its own HIV packaging signal (Kaye and Lever 1998), and that the region encompassing the α-helix in the (359–381)Gag segment increases the affinity of NCp7 for HIV-1 genomic RNA (Roldan et al. 2004). Our results are consistent with these data because gel shift experiments demonstrate that the p2C peptide binds to SL3 (Fig. 7B2 ▶) but the isolated p2 (Fig. 7B1 ▶) or NCB (Fig. 7B3 ▶) peptides do not. We have also observed an increased capacity of NCA to bind (1–415)RNA when this domain is enclosed in the p2A peptide (Fig. 7A1 ▶). Considering that the NCB domain adopts a helical conformation when it binds nucleic acids (De Guzman et al. 1998), we could argue that the well-defined α-helix formed by the p2 domain promotes the formation of the NCB helix when the p2C peptide interacts with nucleic acids. Residues within the p2 domain could also contribute to the interaction with the RNA.
Formation of spherical particles
Virus assembly starts at the cell surface with the clustering of roughly 2000 Gag proteins and the two genomic RNA strands, and the radial organization of the immature HIV particle was revealed by cryoelectron microscopy (cEM) (Wilk et al. 2001). The molecular organization of the Gag protein and derivatives was studied in VLPs by negative-stain electron microscopy and by cEM (Campbell and Vogt 1997; Barklis et al. 1998; Gross et al. 2000; Kingston et al. 2000; Li et al. 2000; Zuber and Barklis 2000; Ehrlich et al. 2001; Wilk et al. 2001; Yu et al. 2001; Nermut et al. 2002; Mayo et al. 2003). All the results indicate the presence of a regular hexagonal network of rings formed by six subunits of Gag proteins or truncated derivatives (Barklis et al. 1998; Kingston et al. 2000; Li et al. 2000; McDermott et al. 2000; Zuber and Barklis 2000; Nermut et al. 2002).
It was reported that Gag/Gag interactions could drive polymerization, and that Gag dimers (Zhang et al. 1998; Ma and Vogt 2002; Larson et al. 2003) or trimers (Morikawa et al. 2000) could be used as building blocks for assembly of the virus particle. These results and assumptions are supported by the 3D structures of CA and MA from HIV showing that the two proteins are respectively dimeric (Momany et al. 1996; Gamble et al. 1997; Berthet-Colominas et al. 1999) and trimeric in the crystal structures (Rao et al. 1995) and in solution (Gamble et al. 1997; Morikawa et al. 1998). Moreover, electron microscopy of cells, expressing various Gag truncated fragments, has shown that the absence of the p2 domain results in the production of cylindrical particles instead of spherical virions (Gross et al. 2000; Morikawa et al. 2000).
In the present study, molecular dynamics simulations based on our structural results show that the high flexibility of the Glyrich region allows a proximity between the p2 domains, despite the size of the CA(CTD), and it seems that hydrophobic p2/p2 association is consistent with the CA/CA dimer formation (Fig. 10 ▶, top), found in the crystal structure. Molecular simulations have shown that a trimer formed through hydrophilic interactions between three Hp2B domains is very stable (Fig. 10 ▶, bottom). An hypothesis to explain the crucial role of p2 in the spherical particle production can be drawn out. Two Gag proteins associated through their MA-CA domain to form a dimer could be locked through interactions between the hydrophobic faces of their Hp2B domains (Fig. 1 ▶). Aggregation between MA-CA-p2 dimers could then be triggered by interactions between three MA on one hand and by isotropic interactions between the p2 domains through their hydrophilic faces on the other hand, resulting in a radial organization of the virion (Fig. 11 ▶). The regions at the CA–NC junctions are important in virus assembly and particle size regulation in many other retroviruses. Mutational analyses revealed that the Rous sarcoma virus (RSV) CA–SP region (in RSV, CA and NC are separated by another cleavage product, e.g., spacer peptide [SP]) is critical in the regulation of virion particle sizes; deletions in this region caused the formation of virions with heterogenous sizes (Krishna et al. 1998). The amino acid sequence at the C-terminal region of murine leukemia virus (MLV) CA, (there is no spacer peptide at the end of CA), has a stretch of 41 amino acids rich in charged residues. Mutations on this motif can drastically disrupt the normal process of particle assembly (Cheslock et al. 2003).
Figure 11.

Theorical arrangement of the dimers and trimers of p2. This illustration is a schematic representation of the projection images of his-HIVCA-p2-nc11 obtained from 2D crystals of membrane-bound proteins (Mayo et al. 2003). The trimers of MA and consequently, trimers of p2, formed through hydrophilic interactions, are represented by three ovals of the same color. Arrows indicate interactions between two CA(CTD) domains and between two p2 α-helices through their hydrophobic interface. This representation underlines the ability of p2 to be implicated both in hydrophobic and hydrophilic interactions, consistent with the results of this study.
The ability of the Hp2B region to adopt an α-helical structure appears to be crucial during assembly because replacement of residues by Gly and Pro that are predicted to disrupt the α-helical conformation, leads to the formation of aberrant budding structure and prevents virus production (von Poblotzki et al. 1993; Krausslich et al. 1995; Accola et al. 1998; Wiegers et al. 1998; Gross et al. 2000; Morikawa et al. 2000; Liang et al. 2002). Moreover, substitution of the hydrophilic residues His16/Ala, Arg19/Ala, and Glu23/Ala on one hand, and the mutations of the hydrophobic residues Ala18/Val, Leu21/Ala, and Met25/Ala on the other hand, which probably prevent intermolecular hydrophilic or hydrophobic interactions, respectively, eliminate virus production. These mutations impede Gag multimerization and thus prevent the formation of large Gag complexes at wild-type levels (Liang et al. 2002).
Protease processing
The HIV-1 protease catalyzes the cleavage of a limited number of sites in the Gag and Gag-Pol precursors (Pettit et al. 1991; Henderson et al. 1992). The long α-helical structure adopted by the Hp2B domain includes the cleavage site between CA and p2 (Figs. 1 ▶,7 ▶) corresponding to the last proteolysis event. The capacity of p2 to form multimers could induce a steric hindrance for the accessibility of the protease to this cleavage site, and might explain why the cleavage of CA-p2 is a relatively late event in the viral maturation. Moreover, the α-helical structure of Hp2B is probably stabilized when p2 multimerizes, while the protease optimally binds residues in extended conformation prior to hydrolysis (Gustchina et al. 1994; Weber et al. 1997).
Our model is in good agreement with recently published results concerning the 3-O-(3′, 3′-dimethylsuccinyl) betulinic acid (PA-457), a novel HIV1 inhibitor. PA-457 induces a defect in Gag processing, preventing the conversion of P25 (CA-p2) to P24 (mature CA protein), but has no effect on the processing of the mutant Gag (Ala1p2: 366Gag)Val (Li et al. 2003). In p2B, 366Gag (Fig. 1 ▶) is not localized on the hydrophobic or hydrophilic faces of the α-helix, and does not seem to be involved in the aggregation properties of p2. This residue is then accessible to PA-457 for interaction. It seems that the prerequisite formation of the α-helix is required for the Gag/PA-457 interaction, because PA-457 appears to block P25 processing only in the context of a higher ordered structure (Li et al. 2003) in which the Gag/Gag interactions could induce the formation and/or the stabilization of the Hp2B α-helix.
Conclusion
Our results suggest that the well-defined amphipathic α-helix p2 increases the helix-forming tendency of both the CA C-terminal and NCp7 N-terminal domains during Gag/Gag associations on the one hand, and during the interaction with the HIV RNA genome on the other hand. The p2 α-helix would take part in oligomerization of the Gag polyprotein and stabilization of the spherical form of polymerized Gag in the early step of virus budding. Moreover, we have shown the importance of p2 in viral RNA recognition because it increases the capacity of NCp7 to bind RNA. The next step would be to use these results and similar studies to design compounds able to prevent the oligomerization of Gag proteins and thus to possibly prevent virus assembly.
Materials and methods
Preparation of peptides and DNA
All the peptides used in this study were obtained by automated solid phase synthesis using the FMOC strategy and then purified by reversed-phase HPLC, using procedures already reported for the production of other retroviral proteins (de Rocquigny et al. 1991). The peptides were analyzed by mass spectrometry and confirmed to have a purity higher than 98%. SL3 DNA sequence (202-GACTAGCGGAGGCTAGAA-399) was purchased from oligo express (France). HIV-1 (1–415)RNA was obtained from pmCG6 plasmid, using a Ribomax large-scale RNA production system T7 (Promega) and then purified on a 7% ureapolyacrylamide gel. RNA concentration was determined by UV measurement using ɛ260 = 10,800 M−1 cm−1.
Gel mobility shift experiments
SL3 DNA or HIV-1 (1–415) RNA were heat-denaturated at 368 K for 2 min to disrupt aggregates and chilled on ice prior to use. Nucleic acid/peptide interactions were initiated by incubation for 15 min at 310 K in 20 μL of a buffer containing 25 mM Tris-HCl (pH 7.5), 80 mM NaCl, 0.1 mM MgCl2. The amount of DNA or RNA, 4.5 × 10⁻¹¹ mol or 3.3 × 10⁻¹² mol per assay, respectively, was kept constant, and increasing concentrations of peptides, from 1.1 up to 44.6 μM, were added. Reactions were stopped by addition of 1 μL of 20% glycerol containing 0.01% bromophenol blue. SL3 or (1–415)RNA/peptide complexes were analyzed as described by native 7% or 5% polyacrylamide gel electrophoresis in 100 mM Tris Borate buffer (pH 8.0), respectively (De Rocquigny et al. 1992). The gels were run at 75 V and 277 K for 1 h 30 min and stained with ethidium bromide. The bands were visualized with a Polaroid MP-4 Land Camera on a Bio-Profil imager (Vilber Lourmat).
Gel filtration chromatography
To estimate the apparent molecular weight (MW) of p2A, p2B, and p2D, peptides were subjected to gel filtration on a FPLC Superdex 75HR 10/30 column in H2O at different concentrations (from 10 μM to 1 mM). Samples (150 μL) were run on the column after equilibration in phosphate buffer (50 mM NaHPO4, pH 7.2) containing or not 150 mM NaCl at 0.4 mL/min. Standard proteins used to calibrate the column were ribonuclease A (stoke radius Rs = 16.4 Å, MW = 13,700, Kav = 0.313), chymotrypsinogen A (Rs = 20.9 Å, MW = 25,000, Kav = 0.251), ovalbumine (Rs = 30.5 Å, MW = 43,000, Kav = 0.144), albumin (Rs = 35.5 Å, MW = 67,000, Kav = 0.098) (low molecular weight gel filtration calibration kit from Amersham Pharmacia Biotech) and (12–53)NCp7 (MW = 6419, Kav = 0.467). Gel filtration data are presented either as elution volumes or as the molecular sieve coefficient, Kav, a parameter calculated as (Ve − V0)/(Vt − V0), where Ve represents the elution volume corresponding to the peak concentration of a peptide, V0 is the void volume of the column, and Vt is the total volume of the gel bed. The void volume was determined by measuring the elution volume with blue dextran. The apparent molecular weight of the different peptides was determined graphically on a Kav versus logMW plot constructed with the above-mentioned standard proteins. Spectrophotometer recordings were performed at 280 nm.
Sample preparation and NMR spectroscopy
The p2, p2B, and p2C peptides were dissolved at pH 3.5 or 5.5 in the presence or not of 200 mM of NaCl, in pure H2O or in water containing either 10% to 30% CD3CN or 30% trifluoroethanol-d2 (TFE) (SDS) to give a final concentration of about 1 mM. 2D phase-sensitive 1H Clean-TOCSY (Griesinger et al. 1988) with a 70-msec spin lock, DQF COSY (Rance et al. 1983), and 100-msec and 200-msec mixing times NOESY experiments (Kumar et al. 1980), were recorded at 285 K, 293 K, and 303 K on an AVANCE Bruker spectrometer operating at 600.14 MHz without sample spinning with 2 K real points in t2, with a spectral width of 6000 Hz and 512 t1-increments. Pulsed-field gradients (Piotto et al. 1992) were used for water suppression. The data were processed using XWINNMR software (Bruker). A π/6 phase-shifted sine bell window function was applied prior to Fourier transformation in both dimensions (t1 and t2). A 3D NOESY-NOESY experiment was performed on the p2B peptide sample. This experiment was used to spread out the signal in a third dimension (t3), and thus to assign overlapping signals in 2D spectra. The water resonance was suppressed by low-power presaturation during the relaxation delay of 1.2 sec and during the NOESY mixing times. Data were collected with 128, 160, and 1024 real points in the t1, t2, and t3 dimensions, respectively, with eight scans per FID. The mixing times were 200 and 100 msec for the two NOESY parts of the 3D experiments. The temperature was externally controlled using a special temperature control system (BCU 05 bruker).
The diffusion-ordered NMR spectroscopy (DOSY) spectra (Morris and Johnson 1992; Johnson 1999) were acquired at 293 K using a 5-mm triple resonance xyz-gradient probe head which delivers a maximum gradient strength of 50 G/cm on p2B (MW = 5249), and Tat (MW = 9752). The strength of the gradient pulses, of 3 msec duration, was incremented in 16 experiments, with a diffusion time of 100 msec and a longitudinal eddy currents delay of 5 msec. The water resonance was suppressed by low-power presaturation during the relaxation delay of 2 sec. All the spectra were processed using XWINNMR (Bruker). A π/6 phase-shifted sine bell window function was applied before the Fourier transformation (FT) and a baseline correction was then conducted after the FT.
The relationship between molecular mass (M) and diffusion coefficient (D) is given by
 |
(1) |
where k is the Boltzmann constant, T is the temperature (293 K), ηis the viscosity of the solvent (30% TFE/70%H2O) (1.606 × 10⁻³ N s m−2) (Schuck et al. 1998). Values of 0.73 × 10⁻³ m3 kg−1, and 1.133062 × 10⁻³ m3 kg−1 were used for the partial specific volume, ν2 and ν1, of the p2B peptide and H2O, respectively. δ1 is the fractional amount of water bound to the molecule (Cantor and Schimmel 1980), generally in the range of 0.3–0.4 g H2O per gram of protein for most proteins. In our conditions (30% TFE/70%H2O) TFE molecules bind the peptide, because we have observed a helix stabilization, instead of H2O molecules. So in this study we used a value of 0.3 for δ1. A value of 1.0009095 was calculated for the shape-factor, F (Dingley et al. 1994) using equation 2.
 |
(2) |
F is expressed in terms of the axial ratio p (p = b/a, with b being the equatorial radius and a being the semiaxis of revolution) (Yao et al. 2000), a and b were calculated from the superposition of the 19 p2B structures calculated by restrained simulated annealing.
NMR structure of the p2B
NOE cross-peak volumes (NOESY, 200-msec mixing time, 293 K) were converted into distances, semiquantitatively, by counting contour levels. Using the Asn-βH geminal protons as the calibration peak, NOEs signals were classified into six categories with upper distance limits ranging from 2.5 Å to 5 Å. Pseudoatom corrections were added when necessary. Calculations were performed with the Discover/NMRchitect software package from Accelrys, with the Amber forcefield using a dielectric constant, ɛ = 4r to diminish in vacuo electrostatic effects. Fifty initial structures were generated for p2B and p2C using simulated annealing, followed by energy minimization, until a maximum gradient value of 0.1 kcal/mol/Å was obtained. The 19 structures that had the lowest total energy and number of NOE restraint violations had the RMSD calculated on their mean helix backbone, and were then used for the final structural analysis (Table 1).
(282–381)Gag dimer model and flexibility of the (354-GVGGPG-359)Gag motif
Molecular dynamic simulations were done on the dimer formed with two (282–381)Gag domains. The two (282–351)Gag domains have not been allowed to move during the simulation. They were fixed to maintain them in their relative position observed in the crystal structure. NMR distance restraints were used to maintain the two Hp2B α-helices, and artificial distance restraints were added to force hydrophobic interactions between them in a parallel orientation. The dimer was minimized using 1000 steps of steepest descent, followed by 1000 steps of conjugate gradient and then subjected to a 250-psec molecular dynamics at 300 K with ɛ = 4r. All dynamics were carried out with a time step of 1 fsec. The coordinates were saved every 5 psec. A second series of molecular simulation with the same conditions was performed on the lowest energy of the previously generated structures, without the restraints used to make the two Hp2B helices close to each other.
Models of intermolecular Hp2B interactions
One initial dimer and trimer of Hp2B were constructed to interact through their hydrophilic faces. The two models were either placed in the center of a periodic boundary condition box filled with water molecules or in vacuum, with ɛ = 4r to diminish electrostatic effects, or ɛ = 80. The models were minimized using 1000 steps of steepest descent, followed by 1000 steps of conjugate gradient. Then each structure was subjected to a 250-psec molecular dynamics at 300 K, under NMR restraints for the Hp2B α-helix.
Protein Data Bank accession number
The coordinates of the best calculated simulated annealing structures of p2B as well as the NMR restraints have been deposited in the Brookhaven Protein Data Bank, accession number 1U57.
Acknowledgments
This work was supported by ANRS and SIDACTION (ECS), the French programs against AIDS. We gratefully acknowledge Dr. M.F. Summers for helpful discussions. We thank Dr. J.L. Darlix (INSERM 412, Lyon) who generously supplied HIV-1 (1–415)RNA.
Abbreviations
TFE, trifluoroethanol
HIV-1, human immunodeficiency virus type 1
VLPs, virus-like particles
PR, protease
MA, matrix
CA, capsid
CA[CTD], C-terminal domain of CA
NCp7, nucleocapsid
DOSY, diffusion-ordered spectroscopy
cEM, cryoelectron microscopy
mGag, minimal Pr55Gag protein
RSV, Rous sarcoma virus
MLV, murine leukemia virus
Article and publication are at http://www.proteinscience.org/cgi/doi/10.1110/ps.041087605.
References
- Accola, M.A., Hoglund, S., and Gottlinger, H.G. 1998. A putative α-helical structure which overlaps the capsid-P2 boundary in the human immunode-ficiency virus type 1 Gag precursor is crucial for viral particle assembly. J. Virol. 72 2072–2078. [DOI] [PMC free article] [PubMed] [Google Scholar]
- Barklis, E., McDermott, J., Wilkens, S., Fuller, S., and Thompson, D. 1998. Organization of HIV-1 capsid proteins on a lipid monolayer. J. Biol. Chem. 273 7177–7180. [DOI] [PubMed] [Google Scholar]
- Berthet-Colominas, C., Monaco, S., Novelli, A., Sibai, G., Mallet, F., and Cusack, S. 1999. Head-to-tail dimers and interdomain flexibility revealed by the crystal structure of HIV-1 capsid protein (P24) complexed with a monoclonal antibody Fab. EMBO J. 18 1124–1136. [DOI] [PMC free article] [PubMed] [Google Scholar]
- Blanco, F.J., Jimenez, M.A., Pineda, A., Rico, M., Santoro, J., and Nieto, J.L. 1994. NMR solution structure of the isolated N-terminal fragment of protein-G B1 domain. Evidence of trifluoroethanol induced nativelike β-hairpin formation. Biochemistry 33 6004–6014. [DOI] [PubMed] [Google Scholar]
- Campbell, S. and Vogt, V.M. 1997. In vitro assembly of virus-like particles with Rous sarcoma virus Gag deletion mutants: Identification of the p10 domain as a morphological determinant in the formation of spherical particles. J.Virol. 71 4425–4435. [DOI] [PMC free article] [PubMed] [Google Scholar]
- Cantor, C.R. and Schimmel, P.R. 1980. Biophysical chemistry, part II: Techniques for the study of biological structure and function, pp. 539–590. W.H. Freeman, New York.
- Cheslock, S.R., Poon, D.T., Fu, W., Rhodes, T.D., Henderson, L.E., Nagashima, K., McGrath, C.F., and Hu, W.S. 2003. Charged assembly helix motif in murine leukemia virus capsid: An important region for virus assembly and particle size determination. J. Virol. 77 7058–7066. [DOI] [PMC free article] [PubMed] [Google Scholar]
- Clever, J., Sassetti, C., and Parslow, T.G. 1995. RNA secondary structure and binding sites for gag gene products in the 5′packaging signal of human immunodeficiency virus type 1. J. Virol. 69 2101–2109. [DOI] [PMC free article] [PubMed] [Google Scholar]
- Dawson, L. and Yu, X.F. 1998. The role of nucleocapsid of HIV-1 in virus assembly. Virology 251 141–157. [DOI] [PubMed] [Google Scholar]
- De Guzman, R.N., Wu, Z.R., Stalling, C.C., Pappalardo, L., Borer, P.N., and Summers, M.F. 1998. Structure of the HIV-1 nucleocapsid protein bound to the SL3 psi-RNA recognition element. Science 279 384–388. [DOI] [PubMed] [Google Scholar]
- de Rocquigny, H., Ficheux, D., Gabus, C., Fournie-Zaluski, M.C., Darlix, J.L., and Roques, B.P. 1991. First large scale chemical synthesis of the 72 amino acid HIV-1 nucleocapsid protein NCp7 in an active form. Biochem. Biophys. Res. Commun. 180 1010–1018. [DOI] [PubMed] [Google Scholar]
- De Rocquigny, H., Gabus, C., Vincent, A., Fournie-Zaluski, M.C., Roques, B., and Darlix, J.L. 1992. Viral RNA annealing activities of human immuno-deficiency virus type 1 nucleocapsid protein require only peptide domains outside the zinc fingers. Proc. Natl. Acad. Sci. 89 6472–6476. [DOI] [PMC free article] [PubMed] [Google Scholar]
- Dingley, A.J., Veale, M.F., King, N.J., and King, G.F. 1994. Two-dimensional 1H NMR studies of membrane changes during the activation of primary T lymphocytes. Immunomethods 4 127–138. [DOI] [PubMed] [Google Scholar]
- Dyson, H.J., Rance, M., Houghten, R.A., Wright, P.E., and Lerner, R.A. 1988. Folding of immunogenic peptide fragments of proteins in water solution. II. The nascent helix. J. Mol. Biol. 201 201–217. [DOI] [PubMed] [Google Scholar]
- Ehrlich, L.S., Liu, T., Scarlata, S., Chu, B., and Carter, C.A. 2001. HIV-1 capsid protein forms spherical (immaturelike) and tubular (mature-like) particles in vitro: Structure switching by pH-induced conformational changes. Biophys. J. 81 586–594. [DOI] [PMC free article] [PubMed] [Google Scholar]
- Gamble, T.R., Yoo, S., Vajdos, F.F., von Schwedler, U.K., Worthylake, D.K., Wang, H., McCutcheon, J.P., Sundquist, W.I., and Hill, C.P. 1997. Structure of the carboxyl-terminal dimerization domain of the HIV-1 capsid protein. Science 278 849–853. [DOI] [PubMed] [Google Scholar]
- Gay, B., Tournier, J., Chazal, N., Carriere, C., and Boulanger, P. 1998. Morphopoietic determinants of HIV-1 Gag particles assembled in baculovirus-infected cells. Virology 247 160–169. [DOI] [PubMed] [Google Scholar]
- Gooley, P.R. and MacKenzie, N.E. 1988. Location of an α-helix in fragment 96–133 from bovine somatotropin by 1H NMR spectroscopy. Biochemistry 27 4032–4040. [DOI] [PubMed] [Google Scholar]
- Griesinger, C., Otting, G., Wüthrich, K., and Ernst, R.R. 1988. Clean TOCSY for 1H spin system identification in macromolecules. J. Am. Soc. 110 7870–7872. [Google Scholar]
- Gross, I., Hohenberg, H., Wilk, T., Wiegers, K., Grattinger, M., Muller, B., Fuller, S., and Krausslich, H.G. 2000. A conformational switch controlling HIV-1 morphogenesis. EMBO J. 19 103–113. [DOI] [PMC free article] [PubMed] [Google Scholar]
- Gustchina, A., Sansom, C., Prevost, M., Richelle, J., Wodak, S.Y., Wlodawer, A., and Weber, I.T. 1994. Energy calculations and analysis of HIV-1 protease-inhibitor crystal structures. Protein Eng. 7 309–317. [DOI] [PubMed] [Google Scholar]
- Henderson, L.E., Bowers, M.A., Sowder 2nd, R.C., Serabyn, S.A., Johnson, D.G., Bess Jr., J.W., Arthur, L.O., Bryant, D.K., and Fenselau, C. 1992. Gag proteins of the highly replicative MN strain of human immunodeficiency virus type 1: Posttranslational modifications, proteolytic processings, and complete amino acid sequences. J. Virol. 66 1856–1865. [DOI] [PMC free article] [PubMed] [Google Scholar]
- Johnson, J.C.S. 1999. Diffusion ordered nuclear magnetic resonance spectroscopy: Principles and applications. Prog. Nucl. Magn. Reson. Spectrosc. 34 203–256. [Google Scholar]
- Kaye, J.F. and Lever, A.M. 1998. Nonreciprocal packaging of human immunodeficiency virus type 1 and type 2 RNA: A possible role for the P2 domain of Gag in RNA encapsidation. J. Virol. 72 5877–5885. [DOI] [PMC free article] [PubMed] [Google Scholar]
- Kingston, R.L., Fitzon-Ostendorp, T., Eisenmesser, E.Z., Schatz, G.W., Vogt, V.M., Post, C.B., and Rossmann, M.G. 2000. Structure and self-association of the Rous sarcoma virus capsid protein. Struct. Fold. Des. 8 617–628. [DOI] [PubMed] [Google Scholar]
- Krausslich, H.G., Facke, M., Heuser, A.M., Konvalinka, J., and Zentgraf, H. 1995. The spacer peptide between human immunodeficiency virus capsid and nucleocapsid proteins is essential for ordered assembly and viral infectivity. J. Virol. 69 3407–3419. [DOI] [PMC free article] [PubMed] [Google Scholar]
- Krishna, N.K., Campbell, S., Vogt, V.M., and Wills, J.W. 1998. Genetic determinants of Rous sarcoma virus particle size. J. Virol. 72 564–577. [DOI] [PMC free article] [PubMed] [Google Scholar]
- Kumar, A., Ernst, R.R., and Wüthrich, K. 1980. A two-dimensional nuclear Overhauser enhancement (2D NOE) experiment for the elucidation of complete proton–proton cross-relaxation networks in biological macromolecules. Biochem. Biophys. Res. Commun. 95 1–6. [DOI] [PubMed] [Google Scholar]
- Larson, D.R., Ma, Y.M., Vogt, V.M., and Webb, W.W. 2003. Direct measurement of Gag–Gag interaction during retrovirus assembly with FRET and fluorescence correlation spectroscopy. J. Cell Biol. 162 1233–1244. [DOI] [PMC free article] [PubMed] [Google Scholar]
- Li, S., Hill, C.P., Sundquist, W.I., and Finch, J.T. 2000. Image reconstructions of helical assemblies of the HIV-1 CA protein. Nature 407 409–413. [DOI] [PubMed] [Google Scholar]
- Li, F., Goila-Gaur, R., Salzwedel, K., Kilgore, N.R., Reddick, M., Matallana, C., Castillo, A., Zoumplis, D., Martin, D.E., Orenstein, J.M., et al. 2003. PA-457: A potent HIV inhibitor that disrupts core condensation by targeting a late step in Gag processing. Proc. Natl. Acad. Sci. 100 13555–13560. [DOI] [PMC free article] [PubMed] [Google Scholar]
- Liang, C., Hu, J., Russell, R.S., Roldan, A., Kleiman, L., and Wainberg, M.A. 2002. Characterization of a putative α-helix across the capsid-SP1 boundary that is critical for the multimerization of human immunodeficiency virus type 1 gag. J. Virol. 76 11729–11737. [DOI] [PMC free article] [PubMed] [Google Scholar]
- Ma, Y.M. and Vogt, V.M. 2002. Rous sarcoma virus Gag protein–oligonucleotide interaction suggests a critical role for protein dimer formation in assembly. J. Virol. 76 5452–5462. [DOI] [PMC free article] [PubMed] [Google Scholar]
- Mayo, K., Huseby, D., McDermott, J., Arvidson, B., Finlay, L., and Barklis, E 2003. Retrovirus capsid protein assembly arrangements. J. Mol. Biol. 325 225–237. [DOI] [PubMed] [Google Scholar]
- McDermott, J., Mayo, K., and Barklis, E. 2000. Three-dimensional organization of retroviral capsid proteins on a lipid monolayer. J. Mol. Biol. 302 121–133. [DOI] [PubMed] [Google Scholar]
- Merutka, G., Dyson, H.J., and Wright, P.E. 1995. “Random coil” 1H chemical shifts obtained as a function of temperature and trifluoroethanol concentration for the peptide series GGXGG. J. Biomol. NMR 5 14–24. [DOI] [PubMed] [Google Scholar]
- Momany, C., Kovari, L.C., Prongay, A.J., Keller, W., Gitti, R.K., Lee, B.M., Gorbalenya, A.E., Tong, L., McClure, J., Ehrlich, L.S., et al. 1996. Crystal structure of dimeric HIV-1 capsid protein. Nat. Struct. Biol. 3 763–770. [DOI] [PubMed] [Google Scholar]
- Morikawa, Y., Zhang, W.H., Hockley, D.J., Nermut, M.V., and Jones, I.M.1998. Detection of a trimeric human immunodeficiency virus type 1 Gag intermediate is dependent on sequences in the matrix protein, p17. J. Virol. 72 7659–7663. [DOI] [PMC free article] [PubMed] [Google Scholar]
- Morikawa, Y., Hockley, D.J., Nermut, M.V., and Jones, I.M. 2000. Roles of matrix, P2, and N-terminal myristoylation in human immunodeficiency virus type 1 Gag assembly. J. Virol. 74 16–23. [DOI] [PMC free article] [PubMed] [Google Scholar]
- Morris, K.F. and Johnson, J.C.S. 1992. Diffusion-ordered two-dimensional nuclear magnetic resonance spectroscopy. J. Am. Chem. Soc. 114 3139–3141. [Google Scholar]
- Nelson, J.W. and Kallenbach, N.R. 1989. Persistence of the α-helix stop signal in the S-peptide in trifluoroethanol solutions. Biochemistry 28 5256–5261. [DOI] [PubMed] [Google Scholar]
- Nermut, M.V., Bron, P., Thomas, D., Rumlova, M., Ruml, T., and Hunter, E. 2002. Molecular organization of Mason-Pfizer monkey virus capsids assembled from Gag polyprotein in Escherichia coli. J. Virol. 76 4321–4330. [DOI] [PMC free article] [PubMed] [Google Scholar]
- Newman, J.L., Butcher, E.W., Patel, D.T., Mikhaylenko, Y., and Summers, M.F. 2004. Flexibility in the P2 domain of the HIV-1 Gag polyprotein. Protein Sci. 13 2101–2107. [DOI] [PMC free article] [PubMed] [Google Scholar]
- Pettit, S.C., Simsic, J., Loeb, D.D., Everitt, L., Hutchison 3rd, C.A., and Swanstrom, R. 1991. Analysis of retroviral protease cleavage sites reveals two types of cleavage sites and the structural requirements of the P1 amino acid. J. Biol. Chem. 266 14539–14547. [PubMed] [Google Scholar]
- Piotto, M., Saudek, V., and Sklenar, V. 1992. Gradienttailored excitation for single-quantum NMR spectroscopy of aqueous solutions. J. Biomol. NMR 2661–665. [DOI] [PubMed] [Google Scholar]
- Rance, M., Sørensen, O.W., Bodenhausen, G., Wagner, G., Ernst, R.R., and Wüthrich, K. 1983. Improved spectral resolution in cosy 1H NMR spectra of proteins via double quantum filtering. Biochem. Biophys. Res. Commun. 117 479–485. [DOI] [PubMed] [Google Scholar]
- Rao, Z., Belyaev, A.S., Fry, E., Roy, P., Jones, I.M., and Stuart, D.I. 1995. Crystal structure of SIV matrix antigen and implications for virus assembly. Nature 378 743–747. [DOI] [PubMed] [Google Scholar]
- Roldan, A., Russell, R.S., Marchand, B., Gotte, M., Liang, C., and Wainberg, M.A. 2004. In vitro identification and characterization of an early complex linking HIV-1 genomic RNA recognition and Pr55Gag multimerization. J. Biol. Chem. 279 39886–39894. [DOI] [PubMed] [Google Scholar]
- Roques, B.P., Morellet, N., de Rocquigny, H., Demene, H., Schueler, W., and Jullian, N. 1997. Structure, biological functions and inhibition of the HIV-1 proteins Vpr and NCp7. Biochimie 79 673–680. [DOI] [PubMed] [Google Scholar]
- Schuck, P., MacPhee, C.E., and Howlett, G.J. 1998. Determination of sedimentation coefficients for small peptides. Biophys. J. 74 466–474. [DOI] [PMC free article] [PubMed] [Google Scholar]
- von Poblotzki, A., Wagner, R., Niedrig, M., Wanner, G., Wolf, H., and Modrow, S. 1993. Identification of a region in the Pr55gag-polyprotein essential for HIV-1 particle formation. Virology 193 981–985. [DOI] [PubMed] [Google Scholar]
- Wang, C.T. and Barklis, E. 1993. Assembly, processing, and infectivity of human immunodeficiency virus type 1 gag mutants. J. Virol. 67 4264–4273. [DOI] [PMC free article] [PubMed] [Google Scholar]
- Wang, C.T., Lai, H.Y., and Li, J.J. 1998. Analysis of minimal human immunodeficiency virus type 1 gag coding sequences capable of virus-like particle assembly and release. J. Virol. 72 7950–7959. [DOI] [PMC free article] [PubMed] [Google Scholar]
- Weber, I.T., Wu, J., Adomat, J., Harrison, R.W., Kimmel, A.R., Wondrak, E.M., and Louis, J.M. 1997. Crystallographic analysis of human immunodeficiency virus 1 protease with an analog of the conserved CA-P2 substrate—Interactions with frequency occuring glutamic acid residue at P2′position of substrates. Eur. J. Biochem. 249 523–530. [DOI] [PubMed] [Google Scholar]
- Wiegers, K., Rutter, G., Kottler, H., Tessmer, U., Hohenberg, H., and Krausslich, H.G. 1998. Sequential steps in human immunodeficiency virus particle maturation revealed by alterations of individual Gag polyprotein cleavage sites. J. Virol. 72 2846–2854. [DOI] [PMC free article] [PubMed] [Google Scholar]
- Wilk, T., Gross, I., Gowen, B.E., Rutten, T., de Haas, F., Welker, R., Krausslich, H.G., Boulanger, P., and Fuller, S.D. 2001. Organization of immature human immunodeficiency virus type 1. J. Virol. 75 759–771. [DOI] [PMC free article] [PubMed] [Google Scholar]
- Wishart, D.S., Sykes, B.D., and Richards, F.M. 1991. Relationship between nuclear magnetic resonance chemical shift and protein secondary structure. J. Mol. Biol. 222 311–333. [DOI] [PubMed] [Google Scholar]
- Worthylake, D.K., Wang, H., Yoo, S., Sundquist, W.I., and Hill, C.P. 1999. Structures of the HIV-1 capsid protein dimerization domain at 2.6 Å resolution. Acta Crystallogr. D Biol. Crystallogr. 55 (Pt. 1) 85–92. [DOI] [PubMed] [Google Scholar]
- Wüthrich, K. 1986. NMR of protein and nucleic acids. Wiley and Sons, New York.
- Yao, S., Howlett, G.J., and Norton, R.S. 2000. Peptide selfassociation in aqueous trifluoroethanol monitored by pulsed field gradient NMR diffusion measurements. J. Biomol. NMR 16 109–119. [DOI] [PubMed] [Google Scholar]
- Yu, F., Joshi, S.M., Ma, Y.M., Kingston, R.L., Simon, M.N., and Vogt, V.M. 2001. Characterization of Rous sarcoma virus Gag particles assembled in vitro. J. Virol. 75 2753–2764. [DOI] [PMC free article] [PubMed] [Google Scholar]
- Zhang, Y., Qian, H., Love, Z., and Barklis, E. 1998. Analysis of the assembly function of the human immunodeficiency virus type 1 gag protein nucleocapsid domain. J. Virol. 72 1782–1789. [DOI] [PMC free article] [PubMed] [Google Scholar]
- Zuber, G. and Barklis, E. 2000. Atomic force microscopy and electron microscopy analysis of retrovirus Gag proteins assembled in vitro on lipid bilayers. Biophys. J. 78 373–384. [DOI] [PMC free article] [PubMed] [Google Scholar]