Abstract
The presence and location of intramolecular disulphide bonds are a key determinant of the structure and function of proteins. Intramolecular disulphide bonds in proteins have previously been analyzed under the assumption that there is no clear relationship between disulphide arrangement and disulphide concentration. To investigate this, a set of sequence nonhomologous protein chains containing one or more intramolecular disulphide bonds was extracted from the Protein Data Bank, and the arrangements of the bonds, Protein Data Bank header, and Structural Characterization of Proteins fold were analyzed as a function of intramolecular disulphide bond concentration. Two populations of intramolecular disulphide bond-containing proteins were identified, with a naturally occurring partition at 25 residues per bond. These populations were named intramolecular disulphide bond-rich and -poor. Benefits of partitioning were illustrated by three results: (1) rich chains most frequently contained three disulphides, explaining the plateaux in extant disulphide frequency distributions; (2) a positive relationship between median chain length and the number of disulphides, only seen when the data were partitioned; and (3) the most common bonding pattern for chains with three disulphide bonds was based on the most common for two, only when the data were partitioned. The two populations had different headers, folds, bond arrangements, and chain lengths. Associations between IDSB concentration, IDSB bonding pattern, loop sizes, SCOP fold, and PDB header were also found. From this, we found that intramolecular disulphide bond-rich and -poor proteins follow different bonding rules, and must be considered separately to generate meaningful models of bond formation.
Keywords: disulphide, disulfide, nonhomologous, PDB, PDBSELECT, arrangement, pattern
A protein’s native conformation and function are mainly determined by its amino acid sequence. The amino acid cysteine helps maintain proteins’ native conformations by forming a covalent bond between itself and another cysteine in the protein. As covalent bonds require more energy to disrupt than the other forces (e.g., electrostatic) which maintain the conformation of a protein, the addition of cysteine–cysteine disulphide bonds can stabilize either the native or denatured conformations of a protein depending on the location of the bonds (Matsumura and Matthews 1991; Betz 1993; Darby and Creighton 1995). Overall, 28% of the protein entries in the October 7, 2003 edition of the PDB contain one or more disulphide bonds.
When disulphide bonds are between cysteines in the same protein chain, they are referred to as intramolecular disulphide bonds (IDSB). Knowledge of the location of IDSBs is useful for structure prediction and taxonomy. For sequence-based native conformation prediction, it is useful to be able to predict where in a protein sequence the IDSBs will form. This knowledge dramatically reduces the number of possible conformations of the protein, making conformation prediction more feasible (Casadio et al. 2000; Fariselli and Casadio 2001). If the three-dimensional (3D) structure of a protein is known, the arrangement of the IDSBs can be used to taxonomically classify proteins which have little or no secondary structure, by aligning their IDSBs in space (Mas et al. 2001) or, if some secondary structure is present, by analyzing patterns of IDSB placement relative to the secondary structure (Harrison and Sternberg 1996).
It has been predicted (Richardson 1981; Miller et al. 1987; White 1992) that proteins with a high concentration of IDSBs form a distinct subset of proteins. Harrison and Sternberg (1994) confirmed this by showing that the ratio between the number of IDSBs and the number of residues in proteins (or IDSB concentration) is bimodally distributed on a logarithmic scale.
Although previous work (Harrison and Sternberg 1994) has identified the existence of two populations of IDSB-containing proteins, and examined proteins’ IDSB bonding patterns (Table 1) as a whole, no work to our knowledge has examined the differences in IDSB bonding between the two populations. To do this, a data set of 1280 sequence non-homologous, IDSB-containing protein chains was derived from the Protein Data Bank (PDB) (Berman et al. 2000), using a modified version of the PDBSELECT algorithm (Hobohm and Sander 1994). The arrangement of IDSBs within the protein chains (referred to as connectivities) was then examined. This included the concentration of disulphide bonds, the pattern of disulphide bonding, the “distance” (i.e., number of sequential amino acids) between each half-IDSB, and the “distances” between the first half-IDSB and the N terminus and the last half-IDSB and the C terminus (referred to as “tail lengths”). By analyzing trends in IDSB connectivities as a function of IDSB concentration, different patterns of PDB headers, SCOP folds (Murzin et al. 1995), and connectivities were observed.
Table 1.
IDSB bonding patterns and loop types
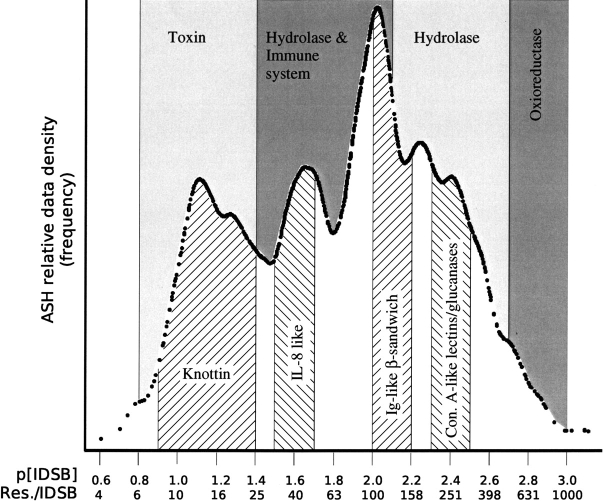
All IDSB bonding patterns can be described as combinations of these four basic loop types.Although a third mode was seen in the IDSB concentration frequency distribution (Fig. 1 ▶) at 45 residues per IDSB, the data were not analyzed as having three modes, as there were no clear metrics (other than the frequency distribution) separating the middle mode from the other two.
In this article, to clarify whether an amino acid is a cysteine or a cystine, the following terminology was used: If the redox state of the cysteine was not relevant to the discussion, the amino acid was referred to as a cysteine. If the redox state was relevant, the amino acid was referred to as either a bonded cysteine or an unbonded cysteine.
Results
Identification of two distinct groups
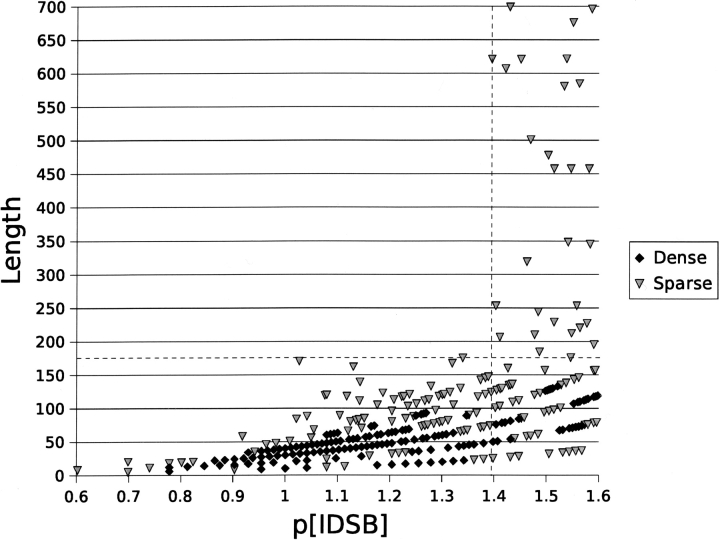
Evidence for the existence of more than one population of proteins came from the frequency distribution (Fig. 1 ▶) of IDSB concentration ([IDSB]), patterns in chain length (Fig. 2 ▶), and patterns in PDB headers and SCOP folds (Table 2). In the valley after the first frequency mode (Fig. 1 ▶), the maximum observed chain length jumped dramatically from 175 to 621 residues (Fig. 2 ▶) at a −log10 [IDSB] (p[IDSB]) of ~1.4. Over several IDSB concentration ranges, one particular PDB header or SCOP fold was found to predominate in the protein chains (Table 2). In the first mode of the IDSB concentration distribution, most chains were described as toxins and folded as “knottins,” changing to “immune system” and “IL-8– like fold” as the IDSB concentration decreased. Together, these results suggest 24.8 residues per IDSB (Figs. 1 ▶, 2 ▶) as a naturally occurring partition for IDSB-rich and IDSB-poor protein chains (Supplemental Material: richchai.txt, poorchai.txt).
Figure 1.
IDSB frequency distribution. The frequency distribution (averaged shifted histogram [ASH]) (Scott 1985) of IDSB concentration in sequence nonhomologous protein chains is shown on a logarithmic scale. no. IDSBs The X-axis is labeled in both  ; units and residues per IDSB. Concentration ranges (Table 2) with predominating PDB headers (annotated above the frequency plot) and SCOP folds (annotated below) are marked (bin size = 0.1 concentration units). The data featured three peaks, at 13, 45, and 104 residues/IDSB, with valleys between, at 30 and 62 residues/IDSB. Con. A: Concavalin-A.
Figure 2.
p[IDSB] vs. chain length. To categorize points as “dense” or “sparse,” the p[IDSB] range was discretized into 0.1-unit bins and the chain length to 10-residue bins. Any (p[IDSB], length) bin with five or more chains was classified “dense” in the figure. The sudden jump in chain lengths near p[IDSB] = 1.4 suggests a naturally occurring partition exists between IDSB-rich chains (<1.395 or 24.83 residues/IDSB) and IDSB-poor chains (≥1.395).
Table 2.
Most common PDB header and SCOP fold for IDSB concentrations.
| p[IDSB] | Header | Number of chains | % Total | SCOP fold | Number of chains | % of Found |
| 0.7 | Cell adhesion | 3 | 60 | Integrin-binding RGD peptide | 2 | 40 |
| 0.8 | Toxin | 8 | 73 | Conotoxins | 5 | 71 |
| 0.9 | Toxin | 12 | 52 | Knottins | 10 | 50 |
| 1 | Toxin | 21 | 40 | Knottins | 29 | 62 |
| 1.1 | Toxin | 19 | 25 | Knottins | 28 | 46 |
| 1.2 | Toxin | 13 | 22 | Knottins | 18 | 38 |
| 1.3 | Toxin | 8 | 13 | Knottins | ||
| Growth factor | 10 | 16 | 9 | 20 | ||
| 1.4 | Hydrolase | 6 | 12 | Bifunctional inhibitor/lipid-transfer protein/seed storage 2S albumin | ||
| Blood clotting | 3 | 6 | 3 | 8 | ||
| Immune system | 3 | 6 | ||||
| 1.5 | Immune system | 6 | 12 | IL8-like | ||
| Hydrolase | 5 | 10 | 4 | 14 | ||
| Transferase | 5 | 10 | ||||
| 1.6 | Cytokine | 11 | 14 | IL8-like | ||
| Hydrolase | 16 | 21 | 7 | 12 | ||
| 1.7 | Hydrolase | 16 | 23 | C-type lectin-like | 5 | 8 |
| Trypsin-like serine proteases | 5 | 8 | ||||
| 1.8 | Immune system | 7 | 13 | 4-helical cytokines | ||
| Hydrolase | 7 | 13 | 5 | 15 | ||
| 1.9 | Hydrolase | 26 | 28 | Trypsin-like serine proteases | 7 | 13 |
| 2 | Immune system | 18 | 14 | Immunoglobulin-like β-sandwich | ||
| Hydrolase | 31 | 24 | 16 | 20 | ||
| 2.1 | Hydrolase | 13 | 16 | Immunoglobulin-like β-sandwich | 9 | 16 |
| 2.2 | Hydrolase | 18 | 23 | Lipocalins | 6 | 10 |
| 2.3 | Hydrolase | 17 | 21 | Concanavalin A-like lectins/glucanases | 5 | 10 |
| 2.4 | Hydrolase | 26 | 38 | Concanavalin A-like lectins/glucanases | 4 | 10 |
| α/β-Hydrolases | 4 | 10 | ||||
| 2.5 | Hydrolase | 19 | 32 | TIM β/α-barrel | 4 | 11 |
| 2.6 | Hydrolase | 9 | 26 | 6/7-bladed β-propeller | 2 | 13 |
| 2.7 | Oxidoreductase | 11 | 35 | |||
| Hydrolase | 6 | 19 | ||||
| 2.8 | Toxin | 2 | 15 | |||
| Hydrolase | 2 | 15 | ||||
| Oxidoreductase | 2 | 15 | ||||
| Glycosyltransferase | 2 | 15 | ||||
| 2.9 | Oxidoreductase | 3 | 38 |
“Number” represents the number of the chains in a concentration range having a particular header or fold. Concentration ranges with fewer than five chains were not shown. When two headers or folds were the most common in a concentration range, both were shown. As some of the chains were not found in the SCOP database, the “% of found” is the percentage of chains having a fold, in the SCOP database, in the concentration range.
Differences between IDSB-rich and IDSB-poor chains
Table 3 summarizes the principal differences between IDSB-rich and -poor chains. The observations and patterns described in this section represent characteristic differences in cysteine placing between IDSB concentrations and between IDSB bonding patterns.
Table 3.
Summary of differences between IDSB-rich and IDSB-poor protein chains
| IDSB-rich | IDSB-poor | |
| Most common header | Toxin | Hydrolase |
| Most common fold | Knottin | Immunoglobulin-like β-sandwich |
| Median chain length | 42 | 218 |
| Most common no. of IDSBs | 3, normal distribution | 1, exponential decay |
| Most common bonding pattern | Overlapping patterns | Independent patterns |
| Percent of chains with unbonded cysteines | 7% | 43% |
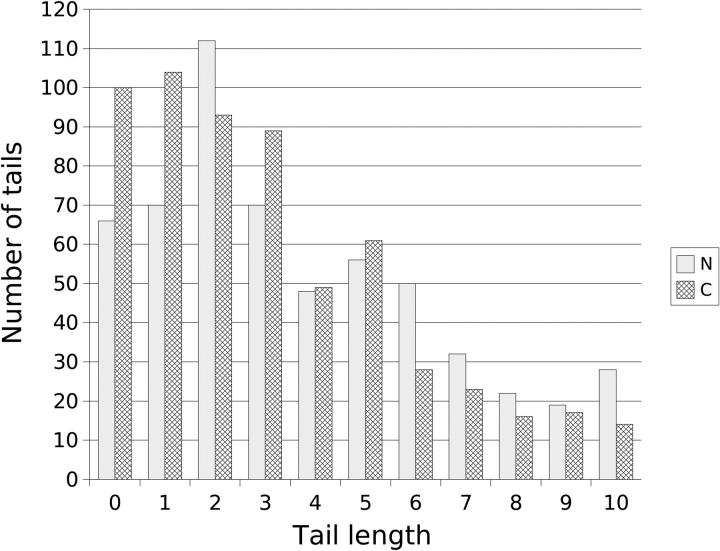
| Most common tail length | N: 2, 1, 0. | N: 2, 3, 5. C: 1, 2, 0. |
| C: 0, 1, 2. | Second mode near 21 residues. | |
| No. of chains | 313 | 967 |
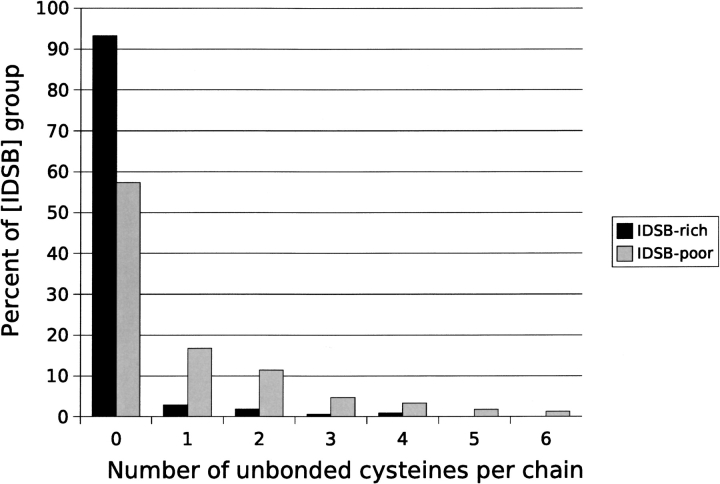
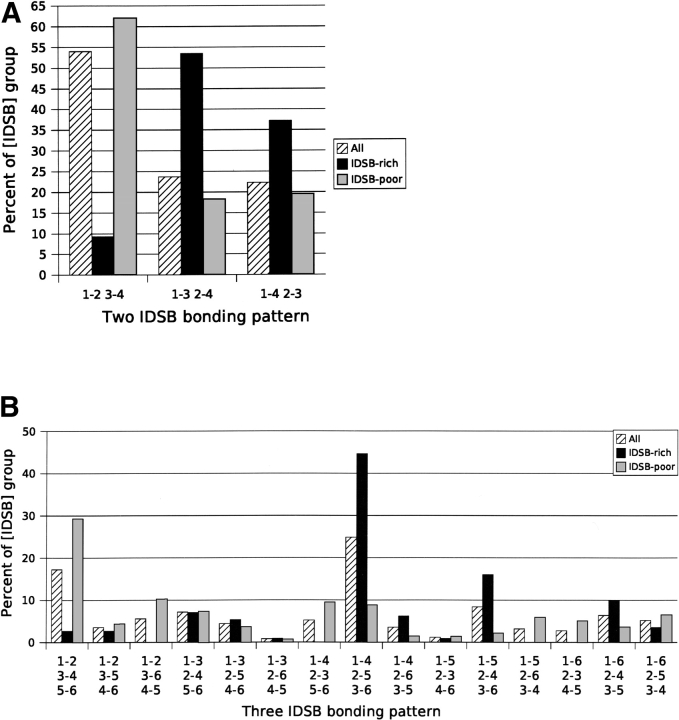
IDSB-rich chains were shorter on average (Supplemental Material: len_dist.csv) than IDSB-poor chains (both groups of chains had chain lengths between 25 and 175 residues). Almost all IDSB-rich chains’ cysteines were bonded (Fig. 3 ▶). As follows from this, odd numbers of cysteines were found to be associated with IDSB-poor chains. Finally, the two IDSB populations had different distributions for the number of IDSBs per chain (Fig. 4 ▶), and favored different bonding patterns (Fig. 5 ▶). IDSB-rich chains more commonly had IDSBs in overlapping bonding patterns, and IDSB-poor more commonly in independent patterns.
Figure 3.
Frequency distribution of unbonded cysteines in nonhomologous protein chains. Seven percent (7%) of IDSB-rich and 43% of IDSB-poor chains contained unbonded cysteines.
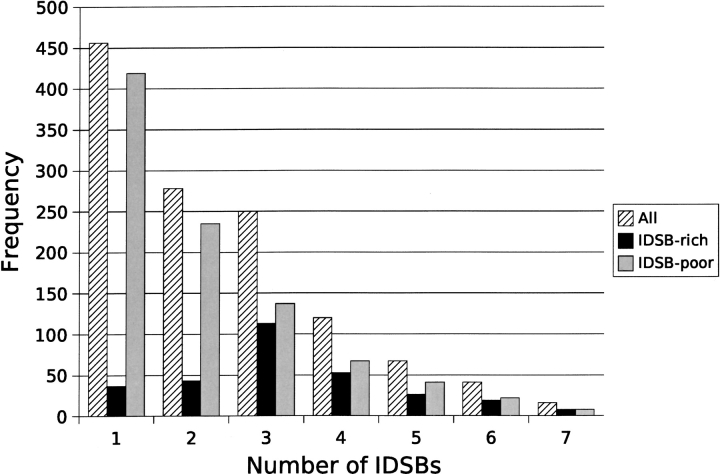
Figure 4.
Frequency distribution of the number of IDSBs in nonhomologous protein chains for unpartitioned, IDSB-rich, and IDSB-poor data. IDSB-poor chains with up to 26 IDSBs were seen, but 96% of chains had seven or fewer IDSBs. The relative plateau in the unpartitioned chains between two and three IDSBs was explained by IDSB-rich chains favoring three IDSBs per chain.
Figure 5.
Frequency distribution of IDSB bonding patterns for all, IDSB-rich, and IDSB-poor protein chains. A and B show the distribution for two and three IDSB-containing chains, respectively. The IDSB concentration groups ([IDSB] group) refer to the “All chains,” “IDSB-rich,” and “IDSB-poor” data. Within each graph, the values for “All chains,” “IDSB-rich,” and “IDSB-poor” each sum to 100%. Overlapping patterns were more common in IDSB-rich chains and independent patterns in IDSB-poor.
Loop sizes
A “loop” was defined as the number of sequence contiguous residues between the two cysteines which form an IDSB. Overall IDSB-rich chains loops of size 10–15 and 17 residues were the most common, and in IDSB-poor, four, seven–eight, 10, 12–13, and 15 residues were most commonly seen (Supplemental Material: richloop.csv, poorloop.csv). Loop sizes were then examined with respect to bonding patterns in order to determine whether bonding patterns have a propensity for particular loop sizes.
In order to analyze bonding patterns, canonical representations of disulphide bond bonding patterns were created by numbering half-IDSBs sequentially from the N terminus. Although these “1-2 3-4”-style bonding patterns were canonical, they were also difficult to interpret for chains with more than two IDSBs. The relationship between any two IDSBs can be described as “independent,” “overlapping,” or “enclosed” (Table 1). To help clarify the independent (I), overlapping (O), or enclosed (E) content of bonding patterns, each of the IDSBs is systematically removed (from the N to the C terminus) and the relationship between the remaining pairs is described (Fig. 6 ▶). For example, 1-2 3-4 5-6 is annotated (III), 1-4 2-5 3-6 is annotated (OOO), and 1-5 2-3 4-6 is annotated (IOE).
Figure 6.
Deconstruction of 3-IDSB bonding patterns. The process whereby a 3-IDSB bonding pattern is broken down into its component bonding patterns in order to illustrate the degree of independent (I), overlapping (O), and enclosed (E) relationships in the larger bonding pattern.
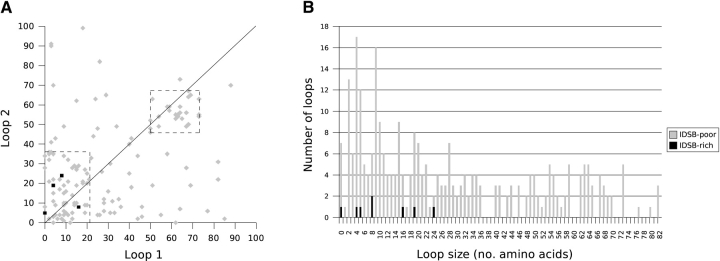
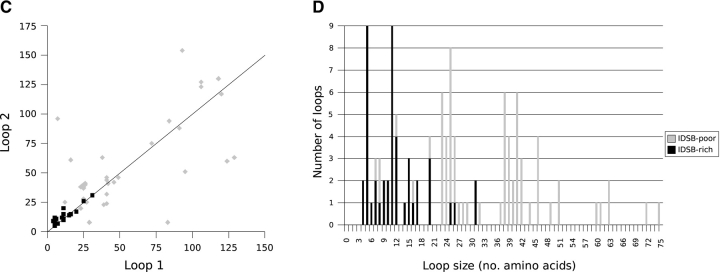
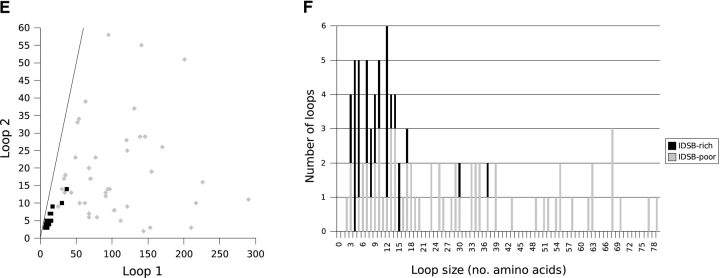
Irrespective of IDSB concentration, the most common loop sizes for chains with two IDSBs in an independent arrangement (1-2 3-4, Fig. 7A ▶) were two, four, five, and nine residues; in overlapping (1-3 2-4, Fig. 7B ▶): five, 11, and 25 residues and in enclosed (1-4 2-3, Fig. 7C ▶): four, five, seven, 10, and 12 residues.
Figure 7.
Loop size associations, by bonding pattern, for IDSB-rich and -poor chains with two IDSBs. The relationship between the size of the first (i.e., closer to the N terminus) and second (i.e., closer to the C terminus) loops in nonhomologous protein chains with 1-2 3-4 (A, B), 1-3 2-4 (C, D), and 1-4 2-3 (E, F) IDSB bonding patterns. The solid line represents Loop 1 = Loop 2 (y = x). The dashed squares in A highlight two clusters in loop lengths.
Bonding patterns alone were frequently sufficient to partition chains into IDSB-rich or -poor (Fig. 5 ▶). For example, all chains with a 1-2 3-6 4-5 (EII) bonding pattern were IDSB-poor while chains with a 1-5 2-4 3-6 (OOE) bonding pattern were mostly IDSB-rich.
Loop size correlations and patterns
Patterns in the sizes of the loops within a chain can be examined by treating chains’ n IDSB loops as n-dimensional points. The loop sizes of each chain are then represented by a single point.
Loop sizes in chains with overlapping bonding patterns were correlated. For example, Figure 7B ▶ illustrates a weak correlation (r = 0.759) between loop 1 and loop 2 length, in chains with a 1-3 2-4 (overlapping) disulphide bond arrangement. In three-IDSB chains with a 1-4 2-5 3-6 (OOO) arrangement, a stronger correlation was noted (r ranged from 0.837 to 0.960). Although both IDSB-rich and -poor chains were considered together when calculating correlation coefficients, protein chains with overlapping bonding patterns (1-3 2-4 or 1-4 2-5 3-6 [OOO]) were predominantly IDSB-rich (Fig. 5 ▶).
In enclosed (1-4 2-3) IDSB bonding patterns, where the outer loop was less than 40 residues, the sizes of loop 1 and loop 2 were strongly correlated (r = 0.946, Fig. 7C ▶). Enclosed IDSBs were found equally in IDSB-rich and -poor chains; however, loops larger than 40 residues were exclusively found in IDSB-poor chains.
Two clusters in the loop size distribution of chains with a 1-2 3-4 IDSB bonding pattern (mainly IDSB-poor) accounted for 62% of 1-2 3-4 chains (Fig. 7A ▶, boxed areas). The larger cluster contained 68 chains: the first loop having 0–21 residues and the second, 0–36 residues. This cluster contained most of the 119 chains with a 1-2 3-4 IDSB bonding pattern, having at least one loop <36 residues. The second cluster contained 25 chains: the first loop having 50–73 residues and the second, 46–67 residues. In total, 44 chains with a 1-2 3-4 IDSB bonding pattern contained at least one loop between 46 and 73 residues.
This mapping technique efficiently illustrates differences in loop size distributions within different disulphide bonding patterns.
In chains with a 1-2 3-4 5-6 (III) IDSB bonding pattern, no loops of size 14 residues were seen (Supplemental Material: 1–2_3–4_.csv). This was unusual for three reasons: First, 13 and 15 residue loops were the most common loop size (eight loops each) for these chains. Second, all loop sizes up to 24 residues were seen (by which point the frequencies had decreased to one or two observations). Finally, 14 residues was not an uncommon loop size in other bonding patterns; for example, it was the second most common loop size in chains with a 1-4 2-5 3-6 (OOO) bonding pattern.
Tail lengths
The number of sequence contiguous amino acids between the first half-IDSB and the N terminus and between the last half-IDSB and the C terminus were referred to as “tail lengths.” IDSB-poor tail lengths were more widely distributed than IDSB-rich. This was illustrated by their percentiles: for IDSB-rich: 10%, 0 residues; 50%, 2 residues; 90%, 9 residues; in comparison to IDSB-poor percentiles of 10%, 2 residues; 50%, 24 residues; 90%, 173 residues. The most common IDSB-rich N- and C-terminal tails were two, one, zero and zero, one, two residues, respectively. The most common IDSB-poor N and C-terminal tails were two, three, five and one, two, zero residues, respectively. These results are different to those reported in the literature (Harrison and Sternberg 1996), where two and three residue tails were, and were predicted to be, the most common. A second mode near 21 residues was also seen in both the IDSB-poor N-and C-terminal tails. No correlation between N- and C-terminal tail lengths within the same protein chain was found (r = 0.2 for both IDSB-rich and -poor).
Fold and bonding pattern
The relationship between SCOP folds and bonding patterns was initially investigated by analyzing the bonding patterns of each SCOP fold. The 1280 sequence nonhomologous protein chains in the data set featured 246 SCOP folds. Of these folds, a third were comprised of proteins having more than one IDSB bonding pattern. One of the folds, the “knottins,” featured 28 different bonding patterns.
For some IDSB bonding patterns, a relationship between bonding pattern and the SCOP fold of the protein chain was found. SCOP folds can provide valuable insights on both the structure and function of a protein. In this work, the bonding pattern data were too sparse to draw conclusions for chains with more than three IDSBs, as not every possible bonding pattern was represented in the data.
Bonding patterns which were strongly associated with one particular SCOP fold included 1-2 3-6 4-5 (EII) with “C-type lectin-like”; 1-3 2-4 5-6 (IIO), and 1-4 2-5 3-6 (OOO) with “Knottin”; and 1-5 2-4 3-6 (OOE) with “De-fensin-like.” Bonding patterns were also found to be strongly associated with PDB headers. For example, 1-2 3-4 (I) with “Hydrolase” and “Immune system,” 1-3 2-4 (O) with “Cytokine” and “Toxin,” 1-2 3-4 5-6 (III) with “Hydrolase,” and 1-4 2-5 3-6 (OOO) with “Toxin.” These relationships between bonding patterns and SCOP folds/PDB headers were a further illustration of the analogous relationship between bonding pattern and IDSB concentration (Fig. 5 ▶), and IDSB concentration and SCOP folds/PDB headers (Fig. 1 ▶).
Some SCOP folds and PDB headers predominantly contained particular loop sizes (Supplemental Material: scoploop.csv). PDB headers were not clearly delineated over the 7–16 residue range; however, beyond 16 residues associations were visible (e.g., “Cytokine” with 23–27 and 36–42 residues and “Hydrolase inhibitor” with 33–36 residues).
A three-way relationship between loop sizes, SCOP fold, and PDB header was also found. When the loop sizes of chains with an overlapping (1-3 2-4) 2-IDSB bonding pattern were plotted against each other, a cluster of 12 IDSB poor chains was found (Fig. 7B ▶, loop 1: 23–26 residues, loop 2: 37–41 residues). The cluster accounted for most of the overlapping 2-IDSB chains which had loops in the size range (20 chains had a loop size between 23 and 26 residues, and 19 chains had a loop size between 37 and 41 residues). All of the chains in the cluster had similar PDB headers and SCOP folds, despite having nonhomologous sequences. According to their PDB headers, nine were “cytokines,” and all of the known SCOP folds were classified as “IL8-like” folds.
Discussion
The data set used to analyze and derive conclusions on IDSB arrangements consisted of 1280 sequence nonhomologous protein chains. A subset of the proteins having a higher relative frequency of IDSBs per amino acid were partitioned out into an IDSB-rich population, with the remainder labeled IDSB-poor. At least two distinct populations of protein chains were identified, with IDSB-rich and -poor chains differing in their PDB headers, SCOP folds, IDSB bond arrangements, and chain lengths. The main differences identified between IDSB-rich and IDSB-poor chains were summarized in Table 3. These differences suggested that there were at least two populations of IDSB-containing proteins. The presence of a third mode at 45 residues per IDSB hints that other populations may exist in the data; however, no clear boundaries to delineate this middle mode were found.
This work required an unbiased set of protein chains to draw statistical inferences. The nonhomologous list used in this work had three advantages over the commonly used PDBSELECT list: the number of chains in the set was larger (three times larger than the PDBSELECT, seven times larger than Harrison and Sternberg’s 1994 work), bonding patterns of the chains were considered when determining whether proteins were similar, and chains with less than 30 residues (which were almost by definition IDSB-rich) were included. In our list, 91 chains (7%) had less than 30 residues.
The main prior work in this area is by Harrison and Sternberg (1994), who partitioned the chains by length, at 72 and 193 residues, to produce three groups with equal numbers of chains in each. Therefore, Harrison’s >193 residue partition is composed entirely of IDSB-poor chains. Our partitioning, near 25 residues / IDSB, is based on differences in frequency (data density), chain lengths, headers, and SCOP folds, and represents a more thorough examination of the data.
In the IDSBs per-chain frequency distribution (Fig. 4 ▶), the number of IDSB-poor chains decreased approximately by half with each additional IDSB, whereas IDSB-rich chains had a bell-shaped distribution centered around three IDSBs per chain. In other words, IDSBs were distributed by overall IDSB frequency in IDSB-poor chains, whereas IDSB-rich chains followed different rules favoring three IDSBs per chain.
A chain with two, four, or an odd number of cysteines was more often an IDSB-poor chain, with no guarantee that all the cysteines would bond to form IDSBs. Having six, eight, 10, 12, or 14 cysteines, a chain was more likely to be an IDSB-rich chain, with all of its cysteines forming IDSBs. This information may be of use for cysteine bonding prediction. The chain length and the number of cysteines gives an indication of the IDSB concentration, which indicates whether the chain will be IDSB-rich or -poor, which in turn, favors particular IDSB bonding patterns.
Unbonded cysteines contain highly reactive thiol groups, which can form intermolecular disulphide bonds, leading to protein precipitation. To prevent this, in molecules large enough to be able to do so, unbonded cysteines are usually buried in the core of the protein (Petersen et al. 1999). Chains were found to be biased (IDSB-rich chains more so) to having fewer and no unbonded cysteines. Overall, IDSB-rich chains had fewer unbonded cysteines than IDSB-poor chains (Fig. 3 ▶). As IDSB-rich chains are, on average, smaller than IDSB-poor, they have less solvent-inaccessible volume in which to bury unbonded cysteines.
Our median loop sizes for IDSB-rich and -poor are similar to Thornton (1981), even though the data set has increased from 50 to over 1000 protein chains. Loop sizes in chains were found not to be independently drawn from the overall frequency distribution for the bonding pattern. Instead, common loop size combinations (clusters) shaped the frequency distributions for loop sizes. Clusters in loop sizes were associated with SCOP folds. Unexpectedly, the most common loop lengths in IDSB-rich chains were longer than those of IDSB-poor chains. This may be explained by IDSB-poor chains favoring independent bonding patterns, which minimize loop length, and IDSB-rich favoring overlapping bonding patterns, which maximize loop length.
Harrison and Sternberg (1994) theorized that IDSBs near the termini of a protein chain are more entropically favorable if they occur a few residues from the end of the chain. In chains longer than 50 residues, they found a peak at two to three residues, which had a significant deviation from a uniform distribution. Results from our work showed that over all protein chains, zero, one, and three residue tails were equally common, with two residue tails being approximately 15% more frequent (Fig. 8 ▶). This means that the results from this work did not support Harrison and Sternberg’s theory that 0 residue tails are less favorable than two or three. As Harrison analyzed chains >50 residues, considering only the longer IDSB-poor chains, our results still showed that one residue C-terminal tails are more common than two residue tails, and zero residue tails are more common than three.
Figure 8.
Frequency distribution of N- and C-terminal tail lengths, over all nonhomologous proteins. Overall, 46% of tails were 10 or less residues in length, and 28% were between 0 and 3 residues in length. IDSB-rich and -poor results were combined for this analysis.
The advantages of partitioning the data by IDSB concentration were illustrated by three unexpected results. First, a plateau in the IDSB frequency distribution (Fig. 4 ▶) at two and three IDSBs per chain (also seen in Harrison and Sternberg 1994; Petersen et al. 1999; Fariselli and Casadio 2001) was the result of IDSB-rich chains most frequently containing three IDSBs. Second, no relationship between median chain length and the number of IDSBs per chain was seen (Supplemental Material: medlengt.csv). Partitioning the data revealed positive relationships for both IDSB-rich and IDSB-poor chains. Finally, the most common bonding pattern for three IDSBs was not based on the most common for two IDSBs (Fig. 5 ▶). In unpartitioned data, the most common bonding pattern for two IDSBs was the most independent (1-2 3-4), and the most common bonding pattern for three IDSBs was the most overlapping (1-4 2-5 3-6). Under the assumption that the IDSB bonding rules for chains containing two and three IDSBs are similar, it was expected that the most common pattern for three IDSBs would have been based on the most common pattern for two IDSBs. That is, the result of adding an IDSB to the most common two IDSB bonding pattern should have been seen more frequently than the result of adding an IDSB to a less common two IDSB bonding pattern. The partitioned data confirmed this premise.
IDSB-connectivity prediction enjoys mixed success (Fariselli et al. 1999; Ceroni et al. 2003; Rost and Liu 2003), which may be due to the existence of two (or more) distinct groups of proteins in the available data, which have differing connectivities, PDB classifications, and 3D SCOP folds. In related work, separating these groups has improved the accuracy of our own IDSB-connectivity prediction efforts (J. Trygg, unpubl.).
This work has attempted to show that analysis of the connectivities of IDSB-containing protein chains must take into account the existence of the (at least) two distinct classes of proteins. IDSB-rich and IDSB-poor chains’ connectivities follow different patterns, and perhaps different rules for their formation. As far as we are aware, no one has analyzed and compared the connectivities of proteins by partitioning the data into IDSB-rich and IDSB-poor chains. IDSB connectivities are also useful descriptors, halfway between a 1D and a 3D description of a molecule, with potential applications in taxonomy and native structure prediction. The data set itself (and algorithm used to construct the data set) may be of use to researchers interested in a large, nonhomologous set of IDSB containing proteins.
Materials and methods
This project was carried out on a uniprocessor 32-bit 1.2 GHz AMD Athlon computer with 1.25-GB memory and 76-GB disk space, running Mandrake Linux 9.1 (kernel 2.4.21, libc 2.3.1, gcc 3.2.2) (http://www.mandrakelinux.com), in Sun Java 1.4.1 (http://java.sun.com). The relational database was implemented on Oracle 9.2.0 (http://www.oracle.com) and the Huang sequence alignment was implemented in C (Huang and Miller 1991; http://bioinformatics.weizmann.ac.il/software/align/huang/). Various helper programs were implemented in Python 2.3.2 (http://www.python.org).
Creation of the data set
The October 7, 2003 edition of the PDB database was mirrored locally into a relational database. The PDB entries were parsed, attributes were calculated, and stored in the database. Chains which did not contain at least five standard amino acids and one IDSB were not considered further.
Modifications to Hobohm’s PDBSELECT algorithm
The PDB’s protein chains are biased, due to the presence of mutants and serial refinements of structures. This work required unbiased (nonhomologous) data in order to be able to draw inferences. Duplicate chains were identified through sequence alignments and removed. This resulted in a diverse set of sequences, which is considered to be equivalent to a set of proteins with diverse functions and roles (Sander and Schneider 1991; Abagyan and Batalov 1997).
The algorithm used to generate the nonhomologous list was modified from the PDBSELECT algorithm (Hobohm et al. 1992; Abagyan and Batalov 1997). The changes to the original algorithm were aimed at increasing the number and diversity of the IDSB-containing proteins. Only chains that contained an IDSB were used as input to the algorithm. Limiting the input to IDSB-containing chains prevented a chain without an IDSB causing a sequence homologous IDSB-containing chain to be removed from the list. Chains with different IDSB bonding patterns were treated as dissimilar, regardless of the similarity between their amino acid sequences, as proteins with different IDSB bonding patterns have different 3D topologies. The unmodified PDBSELECT algorithm does not consider IDSB bonding in its similarity calculation.
The unmodified PDBSELECT algorithm excludes chains less than 30 residues in length and therefore discards some nonhomologous IDSB-rich chains. The algorithm was modified to impose no lower size constraints. Due to the common use of the PDBS-ELECT, these very short, IDSB-rich chains have not been previously analyzed. All chains, regardless of the structure’s quality, were included as input. This has not effected the validity of our results as this work was concerned only with sequences and IDSB locations, whereas the PDBSELECT list was intended to also be a list of high-quality 3D structures.
The July 2003, 25% homology PDBSELECT list was also stored in a separate table in the database to compare the results from our nonhomologous list to a generally accepted list.
Calculation of protein’s attributes
The numbers of intra- and intermolecular disulphide bonds were calculated from the SSBOND record of the PDB file. The amino acid sequence was parsed out of the SEQRES record of the PDB file and translated into single-letter sequences. IDSB concentration was calculated through  . Proteins’ SCOP folds (Murzin et al. 1995) were determined by submitting a query to a mirror of the SCOP database (http://scop.wehi.edu.au/scop/search.cgi).
Loops were defined as the residues between half-IDSBs in a protein chain. Tail lengths were defined as the number of residues from each termini to the nearest half-IDSB.
Acknowledgments
We thank the Institute for Molecular Bioscience for a Ph.D. Scholarship, and Protagonist Pty. Ltd. for financial support. We also thank Stephen Long, Johan Trygg, Darryn Bryant, and Peter Adams for fruitful discussions.
Abbreviations
IDSB, intramolecular disulphide bond

PDB, Protein Data Bank
SCOP, structural characterization of proteins database
Con. A, concavalin-A
Article and publication are at http://www.proteinscience.org/cgi/doi/10.1110/ps.04923305.
Supplemental material: see www.proteinscience.org
References
- Abagyan, R.A. and Batalov, S. 1997. Do aligned sequences share the same fold? J. Mol. Biol. 273 355–368. [DOI] [PubMed] [Google Scholar]
- Berman, H.M., Westbrook, J., Feng, Z., Gilliland, G., Bhat, T.N., Weissig, H., Shindyalov, I.N., and Bourne, P.E. 2000. The Protein Data Bank. Nucleic Acids Res. 28 235–242. [DOI] [PMC free article] [PubMed] [Google Scholar]
- Betz, S. F. 1993. Disulfide bonds and the stability of globular proteins. Protein Sci. 2 1551–1558. [DOI] [PMC free article] [PubMed] [Google Scholar]
- Casadio, R., Compiani, M., Fariselli, P., Jacoboni, I. and Martelli, P.L. 2000. Neural networks predict protein folding and structure: Artificial intelligence faces biomolecular complexity. SAR QSAR Environ. Res. 11 149–182. [DOI] [PubMed] [Google Scholar]
- Ceroni, A., Frasconi, P., Passerini, A., and Vullo, A. 2003. Predicting the disulfide bonding state of cysteines with combinations of kernel machines. J. VLSI Signal Process. 35 287–295. [Google Scholar]
- Darby, N. and Creighton, T.E. 1995. Disulfide bonds in protein folding and stability. Methods Mol. Biol. 40 219–252. [DOI] [PubMed] [Google Scholar]
- Fariselli, P. and Casadio, R. 2001. Prediction of disulfide connectivity in proteins. Bioinformatics 17 957–964. [DOI] [PubMed] [Google Scholar]
- Fariselli, P., Riccobelli, P., and Casadio, R. 1999. Role of evolutionary information in predicting the disulfide-bonding state of cysteine in proteins. Proteins 36 340–346. [PubMed] [Google Scholar]
- Harrison, P.M. and Sternberg, M.J.E. 1994. Analysis and classification of disulphide connectivity in proteins. The entropic effect of cross-linkage. J. Mol. Biol. 244 448–463. [DOI] [PubMed] [Google Scholar]
- ———. 1996. The disulphide β-cross: From cysteine gemoetry and clustering to classification of small disulphide-rich protein folds. J. Mol. Biol. 264 603–623. [DOI] [PubMed] [Google Scholar]
- Hobohm, U. and Sander, C. 1994. Enlarged representative set of protein structures. Protein Sci. 3 522–524. [DOI] [PMC free article] [PubMed] [Google Scholar]
- Hobohm, U., Scharf, M., Schneider, R., and Sander, C. 1992. Selection of representative protein data sets. Protein Sci. 1 409–417. [DOI] [PMC free article] [PubMed] [Google Scholar]
- Huang, X. and Miller, W. 1991, A time-efficient, linear-space local similarity algorithm. Adv. Appl. Math. 12: 337–357. [Google Scholar]
- Mas, J.M., Aloy, P., Martí-Renom, M.A., Oliva, B., de Llorens, R., Aviles, F.X., and Querol, E. 2001. Classification of protein disulphide-bridge topologies. J. Comput. Aided Mol. Des. 15 477–487. [DOI] [PubMed] [Google Scholar]
- Matsumura, M. and Matthews, B.W. 1991. Stabilization of functional proteins by introduction of multiple disulfide bonds. Methods Enzymol. 202 336–356. [DOI] [PubMed] [Google Scholar]
- Miller, S., Janin, J.A., Lesk, A.M., and Chothia, C. 1987. Interior and surface of monomeric proteins. J. Mol. Biol. 196 641–656. [DOI] [PubMed] [Google Scholar]
- Murzin, A., Brenner, S.E., Hubbard, T.J.P., and Chothia, C. 1995. SCOP: A Structural Classification of Proteins database for the investigation of sequences and structures. J. Mol. Biol. 247 536–540. [DOI] [PubMed] [Google Scholar]
- Petersen, M.T.N., Jonson, P.H., and Petersen, S.B. 1999. Amino acid neighbours and detailed conformational analysis of cysteines in proteins. Protein Eng. 12 535–548. [DOI] [PubMed] [Google Scholar]
- Richardson, J.S. 1981. The anatomy and taxonomy of protein structure. Adv. Protein Chem. 34 167–339. [DOI] [PubMed] [Google Scholar]
- Rost, B. and Liu, J. 2003. The PredictProtein server. Nucleic Acids Res. 31 3300–3304. [DOI] [PMC free article] [PubMed] [Google Scholar]
- Sander, C. and Schneider, R. 1991. Database of homology-derived protein structures and the structural meaning of sequence alignment. Proteins 9 56–68. [DOI] [PubMed] [Google Scholar]
- Thornton, J.M. 1981. Disulphide bridges in globular proteins. J. Mol. Biol. 151 261–287. [DOI] [PubMed] [Google Scholar]
- White, S. 1992. Amino acid preferences in small proteins. J. Mol. Biol. 227 991–995. [DOI] [PubMed] [Google Scholar]


