

Abstract
The isoprenoid quinones exist widely among prokaryotes and eukaryotes. They play essential roles in respiratory electron transport and in controlling oxidative stress and gene regulation. In the isoprenoid quinone biosynthetic pathway, polyprenyl pyrophosphates are used as isoprenoid side-chain precursors. Here we report the crystal structure of a novel polyprenyl pyrophosphate binding protein, TT1927b, from Thermus thermophilus HB8, complexed with its ligand. This protein belongs to the YceI-like family in the Pfam database, and its sequence homologs are present in a broad range of bacteria and archaea. The structure consists of an extended, eight-stranded, antiparallel β-barrel. In the hydrophobic pore of the barrel, the protein binds the polyisoprenoid chain by hydrophobic interactions. Its overall structure resembles the lipocalin fold, but there is no sequence homology between TT1927b and the lipocalin family of proteins.
Keywords: Thermus thermophilus HB8, polyisoprenoid-binding protein, crystallography, YceI-like family, eight-stranded β-barrel
The isoprenoid quinones, composed of a quinone core and a hydrophobic isoprenoid chain, exist in many organisms (Søballe and Poole 1999). They are essential components of the membrane-bound electron-transport system. In addition, it is clear that isoprenoid quinones play important roles in controlling oxidative stress and gene regulation. Quinone biosynthesis has been extensively studied in Escherichia coli. The polyisoprenyl tail is generated by the C5 molecule, isopentenyl pyrophosphate (IPP), and its isomer, dimethylallyl pyrophosphate (DMAPP) (Fig. 1 ▶). Farnesyl pyrophosphate synthase catalyzes the sequential 1′−4 condensation reactions and forms C15 farnesyl pyrophosphate (FPP). Using FPP as the primer, long-chain polyprenyl pyrophosphate synthase adds IPPs by sequential condensation reactions, resulting in the formation of polyprenyl pyrophosphate (Fig. 1 ▶). The quinone structure contains isoprenoid side chains of different lengths, depending on the species (Collins and Jones 1981). E. coli mainly has ubiquinone (UQ), menaquinone (MK), and demethylmenaquinone (DMK) with eight isoprenyl units (C40), with the length of the isoprenoid chains determined by octaprenyl pyrophosphate synthase (Okada et al. 1996).Here we report the crystal structure of a novel polyprenyl pyrophosphate binding protein, TT1927b, from Thermus thermophilus HB8, complexed with its ligand. T. thermophilus mainly uses MK with eight isoprenyl units (C40). TT1927b consists of 178 amino acid residues, and a PSI-BLAST search (Altschul et al. 1997) of the TT1927b sequence identified more than 100 similar proteins from bacteria and archaea, with sequence identities ranging from 14% to 46% and E-values below 3 × 10⁻¹³ (Fig. 2 ▶). The homolog of TT1927b in E. coli is the YceI protein. Until now, TT1927b, YceI, and all of the other homologs have been annotated as hypothetical proteins. In the Pfam database, TT1927b and its homologous proteins belong to the PF04264 or YceI-like family, which is equivalent to COG2353 in the National Center for Biotechnology Information database of Clusters of Orthologous Groups. The crystal structure suggests that this family of proteins plays an important role in isoprenoid quinone metabolism and/or transport and/or storage.
Figure 1.

Pathway of polyisoprenoid chain biosynthesis. In E. coli, the major quinones are ubiquinone-8 (UQ-8), menaquinone-8 (MK-8), and demethylmenaquinone-8 (DMK-8), where -8 refers to eight isoprenoid units in the side chain (Collins and Jones 1981). In T. thermophilus, MK-8 is the major quinone (Collins and Jones 1981).
Figure 2.
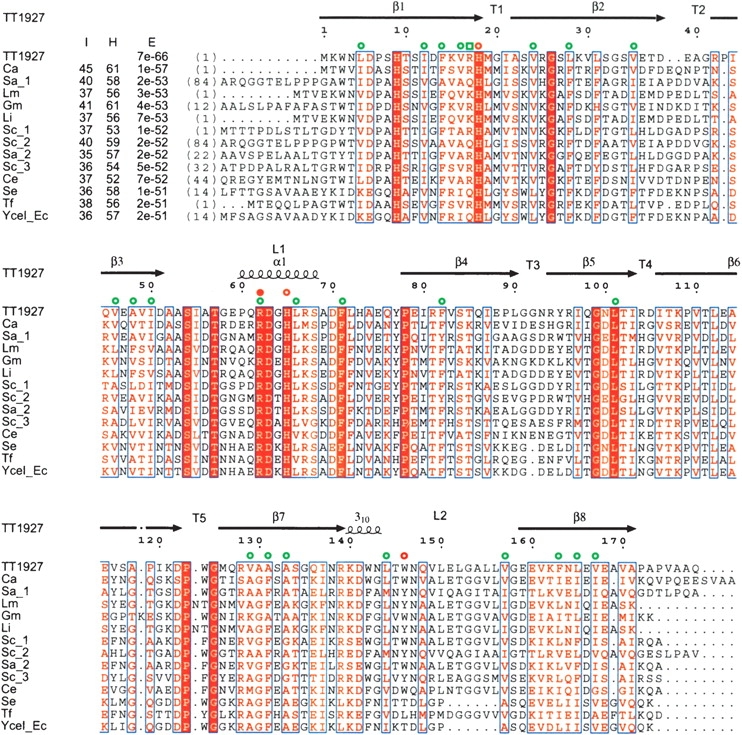
Sequence comparison between TT1927b and its thirteen closest homologs. The figure was constructed by PSI-BLAST (Altschul et al. 1997) followed by CLUSTALW (Thompson et al. 1994). The first column shows the protein identifier. All proteins are annotated as hypothetical or uncharacterized proteins: Ca, Chloroflexus aurantiacus; Sa, Streptomyces avermitilis; Lm, Listeria monocytogenes; Gm, Geobacter metallireducens; Li, Listeria innocua; Sc, Streptomyces coelicolor; Ce, Corynebacterium efficiens; Se, Salmonella enterica; Tf, Thermobifida fusca; YceI_Ec, YceI from E. coli. “I”, “H”, and “E” represent percent identity, percent homology, and E-values from the PSI-BLAST results, respectively. Strictly conserved and similar residues are represented within a red box and in red letters, respectively. Residues that recognize the isoprenoid chain of the ligand with their main chains and side chains are indicated by open green squares and circles, respectively. Residues that contact the phosphate group of the ligand with their side chains are indicated by open red circles. Arg62, with a side chain that contacts and forms a hydrogen bond with the phosphate group of the ligand, is indicated by a filled red circle.
Results and Discussion
Overall structure
TT1927b consists of a single, all-next-neighbor, antiparallel eight-stranded β-barrel, which, in cross section, has a slightly elliptical shape (Fig. 3 ▶). The topology diagram is shown in Figure 4 ▶. The barrel is extended, with an average strand length of 13 residues. The shear number is 10. On one side of the β-barrel, there are two long loops, L1 and L2 (between β3 and β4 and between β7 and β8, respectively). L1 contains one α-helix in its middle, and L2 contains one 310-helix at its beginning (Figs. 3 ▶, 4 ▶). The other five loops connecting the strands are all short, and form turns. Both ends of the β-barrel are open to the solvent.
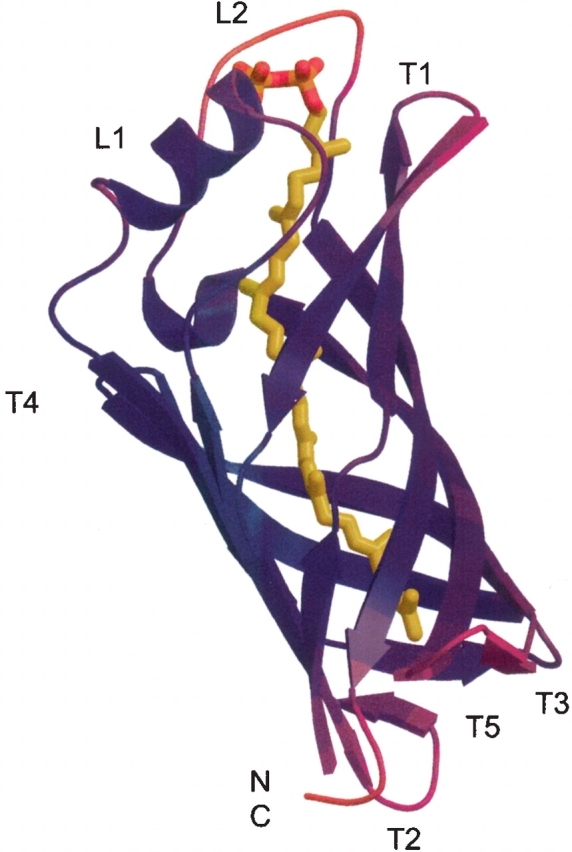
Figure 3.

Overall structure of TT1927b with the bound ligand (stereo view). The α-helix is red, the β-strands are cyan, the 310 helix is green, and the random coils are gray. An octaprenylpyrophosphate molecule is bound in the hydrophobic pore of the eight-stranded barrel. The isoprenoid chain, phosphorus atoms, and oxygen atoms of the ligand are colored yellow, orange, and red, respectively. The figure was drawn using MOLSCRIPT (Kraulis 1991) and RASTER3D (Merritt and Bacon 1997).
Figure 4.

Topology diagram of TT1927b, as viewed from the outside of the barrel. Residues in β-strands are shown in squares, those in coils are shown in circles, those in α-helices are shown in pentagons, and those in the 310-helix are shown in diamonds. Residues that recognize the isoprenoid chain of the ligand with their side chains are highlighted in green. Arg17, with a main-chain carbonyl group that forms a VDW contact with the isoprenoid chain, is represented within a green box. His18, Arg62, His65, and Trp146, with side chains that form hydrophobic or VDW contacts with the phosphate group of the ligand, are highlighted by red frames. Arg62, with an Nh atom that forms a hydrogen bond with the phosphate group of the ligand, is represented by a red letter.
In the hydrophobic pore of the β-barrel, the strong density of a ligand molecule was clearly present (Fig. 5 ▶). We modeled the ligand density as octaprenyl pyrophosphate (Figs. 1 ▶, 5 ▶). Its structure was confirmed by mass spectrometry, which demonstrated that the ligand is a C40 isoprenoid (see Materials and Methods). The phosphate group of the octaprenyl pyrophosphate contacts His18 at the C-terminal end of the β1 strand, Arg62 and His 65 in the α-helix of L1, and Trp146 in L2 (Figs. 2 ▶, 4 ▶, 5 ▶). One of the phosphate group oxygens, O3, forms a hydrogen bond with the side chain of Arg62. The long isoprenoid chain forms hydrophobic or van der Waals (VDW) interactions with the protein (Figs. 2 ▶, 4 ▶, 5 ▶). Among the closest homologs of TT1927b, all of the residues involved in ligand binding are well conserved (Fig. 2 ▶). However, the corresponding residues of the remote homologs, which also belong to the YceI like family, show diverse side-chain sizes (data not shown). The ligands and the ligand–protein interactions may differ in some degree between the closest homologs of TT1927b and the remote ones. As indicated by their B factors, the T1, T2, and T5 turns and the L2 loop are more mobile than the β-strands, the L1 loop, and the T3 and T4 turns (Fig. 6 ▶). This structural flexibility of both sides of the barrel may assist in ligand binding.
Figure 5.

Difference electron density for the octaprenylpyrophosphate (stereo view). A simulated annealing omit αcalc(|o| − |Fc|) map was calculated without the ligand atoms to 1.65 Å resolution and contoured at 3.0 σ. The figure is in the same orientation as in Figure 3 ▶. The carbon, phosphorus, and oxygen atoms of the octaprenylpyrophosphate are represented in yellow, orange, and red, respectively. The carbon, oxygen, and nitrogen atoms of the protein are represented in green, red, and blue, respectively. Hydrogen bonds between the phosphate group in octaprenylpyrophosphate and Arg62 are represented by red dotted lines.
Figure 6.
Crystallographic B-factors of TT1927b. The protein chain is colored according to the B-factor values, with lower values in blue and higher values in red.
Structure comparison
A search of the Protein Data Bank with the program DALI revealed that TT1927b exhibits the highest structure similarity to one domain, the OmpA transmembrane domain from E. coli (1bxw-A, DALI Z-score = 9.4). OmpA consists of an eight-stranded β-barrel with the same shear number, 10 (Pautsch and Schulz 1998). The length and the diameter size of the TT1927b β-barrel are very similar to those of the OmpA β-barrel (Fig. 7A ▶). The two proteins can be superimposed with a root-mean-square deviation (RMSD) of 4.3 Å for 136 Cα atoms, although they share no sequence identity. OmpA is a membrane protein, and it appears to be constructed like an inverse micelle, whereas TT1927b is a water-soluble protein with a hydrophobic pore.
Figure 7.
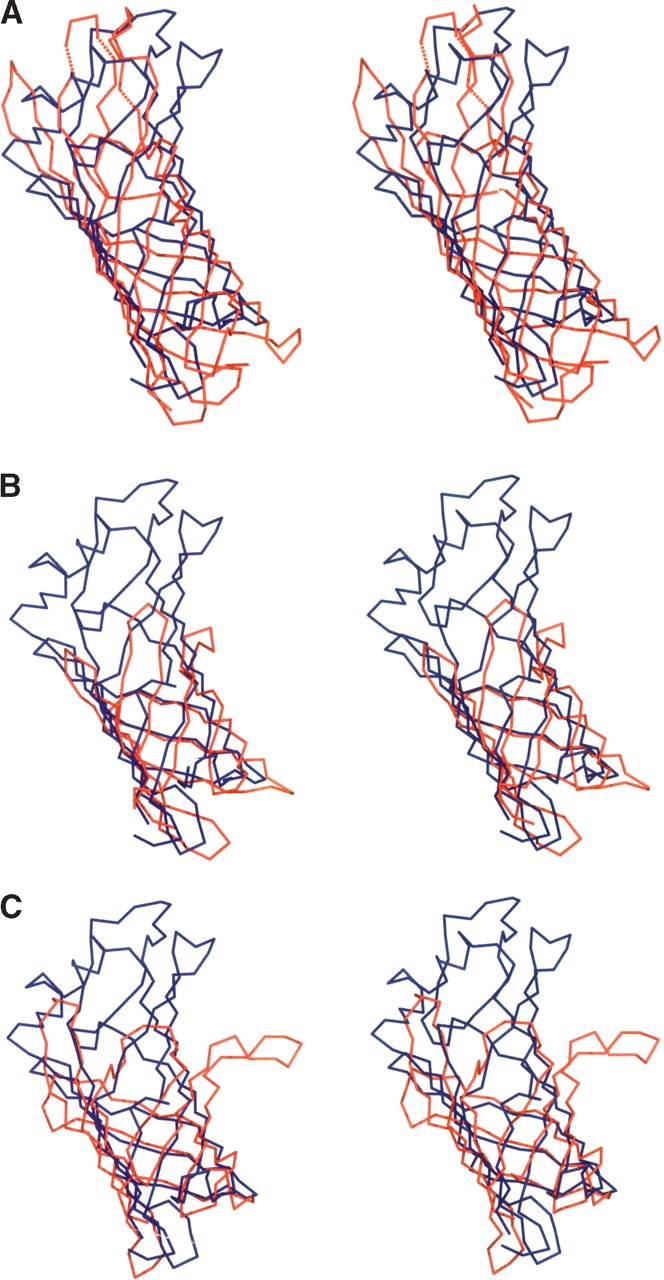
Cα superposition of TT1927b with its structural homologs (stereo view). The figure is in the same orientation as in Figure 3 ▶. TT1927b and its structural homologs are displayed in blue and red, respectively. (A) Superposition of TT1927b with the OmpA transmembrane domain. The OmpA model (PDB code 1bxw-A) consists of residues 1–171. The disordered regions are represented by dotted lines. (B) Superposition of TT1927b with αd2 of QHNDH. The QHNDH model (PDB code 1jju-A) consists of residues 174–273. (C) Superposition of TT1927b with RBP. The RBP model (PDB code 1aqb) consists of residues 21–140.
The protein with the second highest similarity is the α subunit domain 2 (αd2) of the quinohemoprotein amine dehydrogenase (QHNDH) from Paracoccus denitrificans (1jju-A, DALI Z-score = 7.9, RMSD = 2.9 over 97 Cα residues). QHNDH is water-soluble, and αd2 also consists of an eight-stranded β-barrel with the same shear number, 10 (Datta et al. 2001; Fig. 7B ▶). However, the β-barrel of TT1927b is much longer than that of QHNDH αd2, and the two proteins share only weak similarity (identity of 11%).
The protein with the third highest similarity is retinol-binding protein (RBP) (1aqb, DALI Z-score = 7.3, RMSD = 3.2 over 104 Cα residues), which is the best-characterized member of the lipocalin protein family (Newcomer et al. 1984). The lipocalin fold is an antiparallel eight-stranded β-barrel with a shear number of 10, accompanied by an N-terminal 310 helix before the β-barrel and a short C-terminal α-helix (Flower 1996). However, the β-barrel of TT1927b is much longer than those of the lipocalins (Fig. 7C ▶), and the positions of these two helical structures differ. These differences may determine their ligand selectivity. The lipocalins bind a range of small hydrophobic molecules, which are much smaller than C40 polyisoprenoids. TT1927b and the lipocalins share no sequence identity, and TT1927b has no conserved lipocalin sequence motifs.
Functions of TT1927b and its homologs
Since the octaprenyl pyrophosphate was never added during either purification or crystallization, it originated from the E. coli host and bound tightly to TT1927b during purification. Actually, the octaprenyl pyrophosphate naturally occurs in the E. coli quinone synthetic pathway (Fig. 1 ▶). The amino acid residues that contact the ligand are conserved among the closest sequence homologs (Fig. 2 ▶). These findings suggest that TT1927b binds the ligand specifically.
In E. coli, the side chains of UQ-8, MK-8, and DMK-8 are synthesized by octaprenyl pyrophosphate synthase, encoded by the ispB gene (Fig. 1 ▶; Okada et al. 1996). The T. thermophilus HB8 genome encodes a protein homologous to IspB (39% identity and 54% similarity). In E. coli, octaprenyl pyrophosphate is attached to 1,4-dihydroxy-2-naphthoic acid (DHNA), resulting in the formation of DMK-8. Next, the methylation of DMK-8 forms MK-8. The former step is catalyzed by the DHNA octaprenyltransferase encoded by the menA gene (Suvarna et al. 1998). In addition, E. coli has the UQ-8 synthetic pathway, in which octaprenyl pyrophosphate is attached to 4-hydroxybenzoate by UbiA (Søballe and Poole 1999). The amino acid sequence alignment of E. coli MenA and UbiA shows 21% identity and 35% similarity (Suvarna et al. 1998). The T. thermophilus HB8 genome encodes a protein homologous to both UbiA and MenA (identity 25% and similarity 41%, identity 23% and similarity 39%, respectively). As MK-8 is the major quinone in T. thermophilus, octaprenyl pyrophosphate is abundant in T. thermophilus cells. Therefore, we conclude that TT1927b naturally binds octaprenyl pyrophosphate in T. thermophilus. TT1927b may increase the solubility of the hydrophobic molecule of the longest polyisoprenoid in this pathway (Fig. 1 ▶). As TT1927b shares no sequence homology with IspB, MenA, and UbiA, it is unlikely that TT1927b has either octaprenyl pyrophosphate synthase or polyprenyltransferase activity. We therefore propose that TT1927b may be involved in C40 isoprenoid transport and/or storage. There is also a possibility that TT1927b is involved in an unknown pathway of isoprenoid metabolism, since the phosphate group of the ligand contacts His18, Arg62, His65, and Trp146.
E. coli YceI, one of the closest homologs of TT1927b, is a periplasmic protein that is induced by high pH (Stancik et al. 2002). The upstream gene adjacent to yceI encodes the putative cytochrome b561, which is a member of PF01292 or the cytochrome b561 family in the Pfam database. The genes of this family and the TT1927b homologs often exist as neighbors, such as in Bacillus subtilis, Vibrio cholerae, Pseudomonas aeruginosa, Yersinia pestis, Mesorhizobium loti, and Xylella fastidiosa. One of the open reading frames of Caulobacter crescentus encodes a fusion of the two proteins. Thus, it is likely that these members of the YceI like family of proteins play a role in the electron transport system by binding polyisoprenoid molecules. In the case of T. thermophilus HB8, there is no known protein that belongs to the cytochrome b561 family.
The TT1927b structure presented here will provide the basis for the design of further studies to clarify the functions of this family of proteins.
Materials and methods
Cloning, protein expression, purification, and crystallization
The gene encoding T. thermophilus HB8 TT1927b was amplified by PCR from T. thermophilus HB8 genomic DNA. The PCR product was cloned into the pET11a expression vector (Novagen).
The TT1927b protein was expressed in the E. coli strain BL21(DE3)pLysS. Cells were grown in LB medium, and protein expression was induced by isopropyl-β-D-thiogalactopyranoside (IPTG). The cells were disrupted by sonication and then were incubated at 70°C for 30 min. The lysate was centrifuged at 16,000 × g at 4°C for 20 min, to remove the cell debris. The cell lysate was loaded on a Q Sepharose (Amersham Biosciences) column (30 mL) previously equilibrated with 20 mM Tris-HCl buffer (pH 8.0) containing 50 mM NaCl and 1 mM DTT. The protein was eluted with a linear gradient of 0.05–1.0 M NaCl in 20 mM Tris-HCl buffer (pH 8.0) containing 1 mM DTT. Next, the protein sample was loaded on a Phenyl Toyopearl (TOSOH) column (5 mL) previously equilibrated with 20 mM Tris-HCl buffer (pH 8.0) containing 1.2 M (NH4)2SO4, 5 mM NaCl, and 1 mM DTT. The protein was eluted with a linear gradient of 1.2–0 M (NH4)2SO4 in 20 mM Tris-HCl buffer (pH 8.0) with 5 mM NaCl and 1 mM DTT. Next, the protein sample was loaded on a Resource Q (Amersham Biosciences) column (1 mL) previously equilibrated with 20 mM Tris-HCl buffer (pH 8.0) containing 1 mM DTT, and was eluted with a linear gradient of 0–1.0 M NaCl in 20 mM Tris-HCl buffer (pH 8.0) with 1 mM DTT. Finally, the protein sample was loaded on a Superdex 75 (Amersham Biosciences) column (24 mL) previously equilibrated with 20 mM Tris-HCl buffer (pH 8.0) containing 300 mM NaCl and 1 mM DTT, and was eluted with this buffer.
The selenomethionine (SeMet) substituted protein was synthesized by a cell-free system, as described (Kigawa et al. 2002; Wada et al. 2003), and purified in the same way as the native protein.
The crystals of the SeMet-substituted protein were grown at 30°C by the hanging-drop vapor-diffusion method (protein at 3.0 mg/ml) against a reservoir solution containing 1.6 M (NH4)2SO4, 100 mM MES at pH 6.7, and 5% Dioxane. The best crystals were obtained by macroseeding, and were indexed in the space group P4212, with unit cell constants of a = b = 95.36 Å, c = 47.28 Å and one monomer in the asymmetric unit. Crystals of the native protein were grown by cross-macroseeding, and were indexed in the space group C2221, with unit cell constants of a = 32.56 Å, b = 96.95 Å, c = 109.14 Å and one monomer in the asymmetric unit. Before data collection, the crystals were flash-frozen in the reservoir solution plus 30% glycerol.
Data collection and processing
Data for the MAD method and data from the native crystals were collected at RIKEN beamlines BL45XU and BL44B2 of SPring-8, Harima, Japan (Yamamoto et al. 1998; Adachi et al. 2001), respectively (Table 1). All data were processed using the HKL2000 and SCALEPACK programs (Otwinowski and Minor 1997). The positions of the Se atoms and the initial multiwavelength anomalous dispersion (MAD) phases were determined using the program SOLVE (Terwilliger and Berendzen 1999). The resulting electron density map was extremely clear.
Table 1.
Data collection and refinement statistics
| MAD data collection and processing | ||||
| Data set | Low remote | Edge | Peak | High remote |
| Wavelength (Å) | 1.0200 | 0.9796 | 0.9794 | 0.9740 |
| Resolution range (Å) | 20–1.95 | 20–2.05 | 20–2.05 | 20–2.05 |
| Unique reflections | 15,972 | 13,812 | 13,794 | 13,778 |
| Measured reflections | 151,875 | 131,653 | 131,370 | 131,359 |
| Completeness (%) | 97.1 (95.9)b | 96.9 (96.3) | 96.8 (95.7) | 96.6 (95.6) |
| Rsyma (%) | 7.0 (28.6)b | 7.7 (29.1) | 8.7 (32.2) | 8.5 (35.4) |
| I/σ(I) | 34.3 (7.3)b | 26.8 (6.6) | 22.6 (5.9) | 24.6 (5.0) |
| Phasing statistics | ||||
| Resolution range (Å) | 20–2.5 | |||
| Se sites/monomer | 3 | |||
| FOMMADc | 0.40 | |||
| FOMResolved | 0.63 | |||
| Native data collection and processing | ||||
| Wavelength (Å) | 0.900 | |||
| Resolution range (Å) | 20–1.65 | |||
| Unique reflections | 20,740 | |||
| Measured reflections | 106,948 | |||
| Completeness (%) | 97.4 (86.4)b | |||
| Rsyma (%) | 3.4 (23.0)b | |||
| I/σ(I) | 43.8 (4.1)b | |||
| Model refinement | ||||
| Resolution range (Å) | 20–1.65 | |||
| No. of reflections | 19,738 | |||
| No. of protein atoms | 1358 | |||
| No. of water molecules | 102 | |||
| No. of ligand atoms | 49 | |||
| ESUpositionale | 0.081 | |||
| ESUthermalf | 2.34 | |||
| Rwork/Rfreeg (%) | 22.1/26.3 | |||
| Stereochemistry | ||||
| rmsd for bond length (Å) | 0.014 | |||
| rmsd for bond angles (°) | 1.830 | |||
| Residues in the Ramachandran plot | ||||
| Most favored region (%) | 88.1 | |||
| Additional allowed regions (%) | 9.3 | |||
| Generously allowed regions (%) | 2.0 | |||
aRsym = (∑h∑i|Ihi − (Ih)|∑h∑i|Ihi|) where h indicates unique reflection indices, and i indicates symmetry equivalent indices.
bStatistics for the highest resolution shell are given in parentheses.
cFigure of merit after SOLVE phasing.
dFigure of merit after RESOLVE.
eEstimated standard uncertainty of the positional parameters.
fEstimated standard uncertainty of the thermal parameters.
gRwork = ∑|Fobs − Fcalc|∑/Fobs for all reflections and Rfree was calculated using randomly selected reflections (5%).
Model building and structural refinement
The data collected at the high remote wavelength (0.9740 Å) were initially used to refine the model. The MAD phases were improved and automated model building was performed with RESOLVE (Terwilliger 2001, 2003). The remaining residues were built with the program TURBO-FRODO, and multiple cycles of model building and refinement were performed. Using the final model as a search model, the 1.65 Å structure of the native protein was solved by molecular replacement. The program MOLREP was used for the rotation and translation searches (Vagin and Teplyakov 1997). The model was refined using X-PLOR v3.851 (Brunger 1996) with bulk solvent correction. Conventional positional refinement and individual B-factor refinement were alternated with manual fitting to the electron density using TURBO-FRODO and O (Jones et al. 1991). REFMAC (Murshudov et al. 1999) was used for the final refinement stage. The final model has good geometry, as examined by PROCHECK (Laskowski et al. 1992): 88.1% of the residues have φ/ψ angles in the “most favored region” of the Ramachandran plot and 99.3% are in the “allowed regions”. The electron density for the model is quite good, as shown in Figure 5 ▶. The data collection and refinement statistics are listed in Table 1.
Atomic coordinates have been deposited into the Protein Data Bank, with the PDB code 1UF6.
Ligand characterization
The protein solution was analyzed by HPLC (column: COSMO- SIL 5C8-MS (Nacalai Tesque); eluate: acetonitrile-H2O), and the nonpolar fraction was isolated and subjected to an analysis with a fast-atom bombardment (FAB) mass spectrometer (MS) (JEOL JMS700; matrix: glycerol). A peak at m/z 563 was obtained as an M+H+ ion of C40H66O. The same sample was also analyzed by electron impact ionization (EI) MS (JEOL GCmate). The mass spectrum showed positive ion peaks at m/z 544 ([M-H2O] +), 475, 407, 339, 271, and 203, which is a typical fragment pattern of a polyisoprenoid; that is, the mass difference of 68 corresponds to a C5H8 unit.
Acknowledgments
We thank Mr. Kenji Matsuura, JEOL DATUM LTD., for help with mass spectra measurements. We thank Dr. Nobuo Kamiya, Mr. Taiji Matsu, and Dr. Hisashi Naitow for help in data collection at RIKEN beamline BL44B2 of SPring-8. We thank Dr. Yoshiaki Kawano and Mr. Hiroki Nakajima for help in data collection at RIKEN beamline BL45XU of SPring-8. We thank Mr. Hiroaki Hamana and Ms. Yoshiko Ishizuka-Katsura for purification of the protein. We thank Ms. Miki Idaka for help in crystallization of the protein. This work was supported by the RIKEN Structural Genomics/Proteomics Initiative (RSGI), the National Project on Protein Structural and Functional Analyses, Ministry of Education, Culture, Sports, Science and Technology of Japan.
Article published online ahead of print. Article and publication date are at http://www.proteinscience.org/cgi/doi/10.1110/ps.041183305.
References
- Adachi, S., Oguchi, T., Tanida, H., Park, S.-Y., Shimizu, H., Miyatake, H., Kamiya, N., Shiro, Y., Inoue, Y., Ueki, T., et al. 2001. The RIKEN structural biology beamline II (BL44B2) at the SPring-8. Nucl. Instrum. Methods Phys. Res. A 467–468 711–714. [Google Scholar]
- Altschul, S.F., Madden, T.L., Schaffer, A.A., Zhang, J., Zhang, Z., Miller, W., and Lipman, D.J. 1997. Gapped BLAST and PSI-BLAST: A new generation of protein database search programs. Nucleic Acids Res. 25 3387–3402. [DOI] [PMC free article] [PubMed] [Google Scholar]
- Brunger, A.T. 1996. X-PLOR, Version 3.85. Yale University Press, New Haven, CT.
- Collins, M.D. and Jones, D. 1981. Distribution of isoprenoid quinone structural types in bacteria and their taxonomic implications. Microbiol. Rev. 45 316–354. [DOI] [PMC free article] [PubMed] [Google Scholar]
- Datta, S., Mori, Y., Takagi, K., Kawaguchi, K., Chen, Z.W., Okajima, T., Kuroda, S., Ikeda, T., Kano, K., Tanizawa, K., et al. 2001. Structure of a quinohemoprotein amine dehydrogenase with an uncommon redox cofactor and highly unusual crosslinking. Proc. Natl. Acad. Sci. 98 14268–14273. [DOI] [PMC free article] [PubMed] [Google Scholar]
- Flower, D.R. 1996. The lipocalin protein family: Structure and function. Biochem J. 318 1–14. [DOI] [PMC free article] [PubMed] [Google Scholar]
- Jones, T.A., Zou, J.Y., Cowan, S.W., and Kjeldgaard, M. 1991. Improved methods for building protein models in electron density maps and the location of errors in these models. Acta Crystallogr. A 47 110–119. [DOI] [PubMed] [Google Scholar]
- Kigawa, T., Yamaguchi-Nunokawa, E., Kodama, K., Matsuda, T., Yabuki, T., Matsuda, N., Ishitani, R., Nureki, O., and Yokoyama, S. 2002. Selenomethionine incorporation into a protein by cell-free synthesis. J. Struct. Funct. Genomics 2 29–35. [DOI] [PubMed] [Google Scholar]
- Kraulis, P.J. 1991. MOLSCRIPT: A program to produce both detailed and schematic plots of protein structures. J. Appl. Cryst. 24 946–950. [Google Scholar]
- Laskowski, R.A., MacArthur, M.W., Moss, D.S., and Thornton, J.M. 1992. PROCHECK: A program to check the stereochemical quality of protein structures. J. Appl. Cryst. 26 283–291. [Google Scholar]
- Merritt, E.A. and Bacon, D.J. 1997. Raster3D: Photorealistic molecular graphics. Methods Enzymol. 277 505–524. [DOI] [PubMed] [Google Scholar]
- Murshudov, G.N., Vagin, A.A., Lebedev, A., Wilson, K.S., and Dodson, E.J. 1999. Efficient anisotropic refinement of macromolecular structures using FFT. Acta Crystallogr. D Biol. Crystallogr. 55 247–255. [DOI] [PubMed] [Google Scholar]
- Newcomer, M.E., Jones, T.A., Aqvist, J., Sundelin, J., Eriksson, U., Rask, L., and Peterson, P.A. 1984. The three-dimensional structure of retinol-binding protein. EMBO J. 3 1451–1454. [DOI] [PMC free article] [PubMed] [Google Scholar]
- Okada, K., Suzuki, K., Kamiya, Y., Zhu, X.F., Fujisaki, S., Nishimura, Y., Nishino, T., Nakagawad, T., Kawamukai, M., and Matsuda, H. 1996. Polyprenyl diphosphate synthase essentially defines the length of the side chain of ubiquinone. Biochem. Biophys. Acta 1302 217–223. [DOI] [PubMed] [Google Scholar]
- Otwinowski, Z. and Minor, W. 1997. Processing of X-ray diffraction data collected in oscillation mode. Methods Enzymol. 276 307–326. [DOI] [PubMed] [Google Scholar]
- Pautsch, A. and Schulz, G.E. 1998. Structure of the outer membrane protein A transmembrane domain. Nat. Struct. Biol. 5 1013–1017. [DOI] [PubMed] [Google Scholar]
- Stancik, L.M., Stancik, D.M., Schmidt, B., Barnhart, D.M., Yoncheva, Y.N., and Slonczewski, J.L. 2002. pH-dependent expression of periplasmic proteins and amino acid catabolism in Escherichia coli. J. Bacteriol. 184 4246–4258. [DOI] [PMC free article] [PubMed] [Google Scholar]
- Søballe, B. and Poole, R.K. 1999. Microbial ubiquinones: Multiple roles in respiration, gene regulation and oxidative stress management. Microbiology 145 1817–1830. [DOI] [PubMed] [Google Scholar]
- Suvarna, K., Stevenson, D., Meganathan, R., and Hudspeth, M.E.S. 1998. Menaquinone (vitamin K2) biosynthesis: Localization and characterization of the menA gene from Escherichia coli. J. Bacteriol. 180 2782–2787. [DOI] [PMC free article] [PubMed] [Google Scholar]
- Terwilliger, T.C. 2001. Map-likelihood phasing. Acta Crystallogr. D Biol. Crystallogr. 57 1763–1775. [DOI] [PMC free article] [PubMed] [Google Scholar]
- ———. 2003. Automated side-chain model building and sequence assignment by template matching. Acta Crystallogr. D Biol. Crystallogr. 59 45–49. [DOI] [PMC free article] [PubMed] [Google Scholar]
- Terwilliger, T.C. and Berendzen, J. 1999. Automated MAD and MIR structure solution. Acta Crystallogr. D Biol. Crystallogr. 55 849–861. [DOI] [PMC free article] [PubMed] [Google Scholar]
- Thompson, J.D., Higgins, D.G., and Gibson, T.J. 1994. CLUSTAL W: Improving the sensitivity of progressive multiple sequence alignment through sequence weighting, position-specific gap penalties and weight matrix choice. Nucleic Acids Res. 22 4673–4680. [DOI] [PMC free article] [PubMed] [Google Scholar]
- Vagin, A. and Teplyakov, A. 1997. MOLREP: An automated program for molecular replacement. J. Appl. Cryst. 30 1022. [Google Scholar]
- Wada, T., Shirouzu, M., Terada, T., Ishizuka, Y., Matsuda, T., Kigawa, T., Kuramitsu, S., Park, S.Y., Tame, J.R., and Yokoyama, S. 2003. Structure of a conserved CoA-binding protein synthesized by a cell-free system. Acta Crystallogr. D Biol. Crystallogr. 59 1213–1218. [DOI] [PubMed] [Google Scholar]
- Yamamoto, M., Kumasaka, T., Fujisawa, T., and Ueki, T. 1998. Trichromatic concept at SPring-8 RIKEN beamline I. J. Synchrotron Rad. 5 222–225. [DOI] [PubMed] [Google Scholar]